-
PDF
- Split View
-
Views
-
Cite
Cite
C Codella, L Podio, M De Simone, C Ceccarelli, S Ohashi, C J Chandler, N Sakai, J E Pineda, D M Segura-Cox, E Bianchi, N Cuello, A López-Sepulcre, D Fedele, P Caselli, S Charnley, D Johnstone, Z E Zhang, M J Maureira, Y Zhang, G Sabatini, B Svoboda, I Jiménez-Serra, L Loinard, S Mercimek, N Murillo, S Yamamoto, FAUST XII. Accretion streamers and jets in the VLA 1623–2417 protocluster, Monthly Notices of the Royal Astronomical Society, Volume 528, Issue 4, March 2024, Pages 7383–7396, https://doi.org/10.1093/mnras/stae472
Close - Share Icon Share
ABSTRACT
The ALMA interferometer has played a key role in revealing a new component of the Sun-like star forming process: the molecular streamers, i.e. structures up to thousands of au long funnelling material non-axisymmetrically to discs. In the context of the FAUST ALMA LP, the archetypical VLA1623-2417 protostellar cluster has been imaged at 1.3 mm in the SO(56–45), SO(66–55), and SiO(5–4) line emission at the spatial resolution of 50 au. We detect extended SO emission, peaking towards the A and B protostars. Emission blue-shifted down to 6.6 km s−1 reveals for the first time a long (∼ 2000 au) accelerating streamer plausibly feeding the VLA1623 B protostar. Using SO, we derive for the first time an estimate of the excitation temperature of an accreting streamer: 33 ± 9 K. The SO column density is ∼ 1014 cm−2, and the SO/H2 abundance ratio is ∼ 10−8. The total mass of the streamer is 3 × 10⁻³M⊙, while its accretion rate is 3–5 × 10⁻⁷M⊙ yr−1. This is close to the mass accretion rate of VLA1623 B, in the 0.6–3 × 10⁻⁷M⊙ yr−1 range, showing the importance of the streamer in contributing to the mass of protostellar discs. The highest blue- and red-shifted SO velocities behave as the SiO(5–4) emission, the latter species detected for the first time in VLA1623-2417: the emission is compact (100–200 au), and associated only with the B protostar. The SO excitation temperature is ∼ 100 K, supporting the occurrence of shocks associated with the jet, traced by SiO.
1 INTRODUCTION
The low-mass star forming process takes a dense core of gas and dust inside a molecular cloud and leaves a Sun-like star possibly surrounded by its planetary system (Shu 1977). Historically, the youngest two classes of Sun-like protostars have been classified in Class 0 and Class I objects (André, Ward-Thompson & Barsony 1993; Andre, Ward-Thompson & Barsony 2000), being 104 and 105 yr old, respectively. The standard picture shows a collapse of the slowly infalling envelope (spatial scale of ∼ 1000 au) accreting the protostellar mass through a rotating equatorial accretion disc (∼ 50 au). At the same time, angular momentum is removed via fast (∼100 km s−1) jets ejected from both the protostellar poles (e.g. Terebey, Shu & Cassen 1984; Frank et al. 2014; Lee 2020), pushing in turn slower outflows. All these physical components, characterized by different velocities, have been imaged using the proper combination between spatial resolution and molecular tracer (e.g. Codella et al. 2019; Ceccarelli et al. 2023, and references therein). As an example, envelopes and outflows can be well traced by CO and its rarer isotopologues, while the classical jet tracers are the SiO isotopologues. The so-called interstellar Complex Organic Molecules (iCOMS, i.e. organic species with at least six atoms such as CH3OH, Herbst & van Dishoeck 2009; Ceccarelli et al. 2023, and references therein) are able to trace the inner 100 au around the protostars where the temperature is high enough (≥100 K) to release species from dust mantles to the gas phase. Finally, the protostellar disc has been traced by the chemical enrichment (iCOMs, S-bearing species, such as SO) due to mild shocks occurring near the centrifugal barrier, where the infalling envelope has to lose energy to proceed on its journey to the protostar through the accretion disc (Sakai et al. 2014a, b; Oya et al. 2016; Lee et al. 2019; Ceccarelli et al. 2023, and references therein).
As a matter of fact, the classic protostellar collapse picture predicted axisymmetry of the protostellar structures with respect to the disc equatorial plane, and/or the jet axis (e.g. Frank et al. 2014), which was generally supported by observations until recently. None the less, a new component has been detected thanks to high sensitivity interferometric images: the molecular streamers, i.e. elongated structures revealed in the protostellar environment, which could significantly contribute to the mass accretion of the newly born stars (see the recent review by Pineda et al. 2023, and references therein). Using IRAM-NOEMA, Pineda et al. (2020) discovered the presence of a large scale (10 000 au) accretion streamer in HC3N line emission towards the Class 0 object Per-emb-2. Successively, other streamers (as long as 6000 au) have been imaged around well known Class 0 protostars with ALMA: Lupus3-MMS (CO isotopologues; Thieme et al. 2022), and IRAS16293–2422 A (HNC, HC3N, HC5N; Murillo et al. 2022). Thanks to ALMA, accretion streamers have been detected also towards more evolved Class I objects, starting from the archetypical HL Tau disc, where Yen et al. (2019) imaged in HCO+(3–2) a 200 au structure rotating and infalling to the disc. In addition, (i) Garufi et al. (2021) imaged a small (∼ 150 au) CS(5–4) streamer towards DG Tau, while (ii) Garufi et al. (2022) and Bianchi et al. (2023) showed evidence for shocks due to the encounter between discs and infalling streamers in DG Tau, HL Tau, and SVS13-A using SO, SO2, and HDO emission. Finally, using IRAM-NOEMA, Valdivia-Mena et al. (2022) revealed a long (≥2000 au) streamer in HCO+ and C18O in the Class I object Per-emb-50, while Hsieh et al. (2023) imaged a DCN and C18O streamer 700 au long accreting onto the SVS13-A binary.
In summary, there is evidence that molecular streamers are funnelling fresh material in an asymmetric way towards protostellar discs at the earliest protostellar phases. This is even more important taking into account that one of the main ALMA breakthrough results is that planet formation may start already around protostars less than 1 Myr old (e.g. Sheehan & Eisner 2017; Fedele et al. 2018; Segura-Cox et al. 2020). The investigation of molecular streamers has just started: the more efficient molecular tracers have not been identified yet, as well as the typical lengths of the elongated structures. More observations are clearly needed to draw a more detailed picture (Pineda et al. 2023). In this paper, in the context of the ALMA Large program FAUST1 (Fifty AU STudy of the chemistry in the disc/envelope system of Solar-like protostars), we present a survey in SO and SiO of the VLA 1623–2417 protostellar cluster in order to reveal material associated with accretions streamers as well as protostellar jets.
2 THE VLA1623–2417 PROTOSTELLAR SYSTEM
The VLA 1623–2417 (hereafter VLA 1623) region, located in Ophiucus A (d = 131 ± 1 pc; Gagné et al. 2018) is one of the most studied protostellar systems in the Southern hemisphere. VLA 1623 has several components imaged at different spectral wavelengths (e.g. Andre et al. 1990; Leous et al. 1991; André, Ward-Thompson & Barsony 1993; Looney, Mundy & Welch 2000; Ward-Thompson et al. 2011; Murillo et al. 2013; Harris et al. 2018; Murillo et al. 2018a, b; Hsieh et al. 2020; Codella et al. 2022; Ohashi et al. 2022; Mercimek et al. 2023, and references therein): (i) a binary system made up of two Class 0 objects, A1 and A2, separated by less than 30 au, and surrounded by a circumbinary disc; (ii) another Class 0, labelled B, lies outside of the A1+A2 circumbinary disc, at a projected angular separation of ≃ 1 arcsec (∼130 au); in addition, a more evolved Class I object, labelled W, is located at ∼ 1200 au west of the VLA1623 A1+A2+B system.
Given its complexity, the VLA 1623 star forming region is a perfect laboratory to study the interaction of the star forming process with the surrounding medium. Fig. 1 provides a sketch (not to scale) summarizing some processes imaged in VLA1623 and discussed here (see also fig. 19 by Hsieh et al. 2020). From the kinematic point of view, three main processes have been detected: (1) outflowing motion, (2) gravitationally supported discs, and (3) infalling molecular streamers. These processes are described further below.
Extended (>1000 au) outflows along a NW-SE direction have been observed in a number of species (e.g. CO isotoplogues) driven by the A+B multiple system (e.g. Andre et al. 1990; Caratti o Garatti et al. 2006; Hsieh et al. 2020; Hara et al. 2021, and references therein). Santangelo et al. (2015) imaged a fast CO jet from VLA1623 B, while the number of flows driven by A1+A2 is controversial. On the one hand, Hsieh et al. (2020) and Hara et al. (2021) reported two cavities opened by two outflows along the same projected NW-SE direction driven by A1 and A2. As part of ALMA-FAUST, Ohashi et al. (2022) sampled (with a beam of 50 au) a unique, rotating, and low-velocity NW-SE cavity opened by A1;
C18O, CS, and CH3OH emission around both VLA1623-2417 A1 and B shows velocity gradients (on 20–30 au scale) along the NE-SW direction (Murillo et al. 2013; Codella et al. 2022; Ohashi et al. 2022), i.e. along the main axis of each protostellar disc observed in continuum (Harris et al. 2018);
Recently, the occurrence of molecular streamers have been reported by Hsieh et al. (2020) imaging SO(88–77) at a spatial scale ∼ 100 au. The authors support the occurrence of two blue-shifted northern flows accreting onto both the circumbinary disc around the A binary and the B protostellar disc, plus a red-shifted southern flow feeding B from the SW direction. The largest recoverable scale of the SO maps by Hsieh et al. (2020) is 3|${_{.}^{\prime\prime}}$|5, calling for further observations imaging more lines and larger spatial scales to confirm the occurrence of extended accretion streamers.
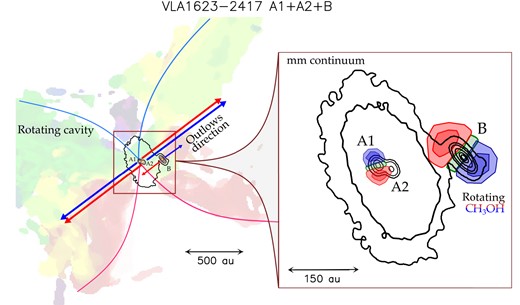
Sketch (not to scale) of the VLA1623–2417 system (see also fig. 19 by Hsieh et al. 2020). The figure shows: (i) the high-spatial resolution mm-continuum map (Harris et al. 2018) revealing the A1+A2 binary system, its circumbinary disc, and the protostar B, (ii) the extended rotating cavity (CS; Ohashi et al. 2022), (iii) the directions of the multiple outflows (CO; Santangelo et al. 2015; Hsieh et al. 2020; Hara et al. 2021), and (iv) the rotating discs of A1 and B imaged in CH3OH (Codella et al. 2022).
3 OBSERVATIONS
The VLA1623 multiple system was observed between 2018 December, and 2020 March with ALMA Band 6 (Setup 1: 214.0–219.0 GHz and 229.0–234.0 GHz, Setup 2: 242.5–247.5 GHz and 257.2–262.5 GHz) in the context of the FAUST Large Programme (2018.1.01:205.L, PI: S. Yamamoto), using the 12-m array (C43-1, C43-4, with 48 and 49 antennas, respectively) as well as the ACA (Atacama Compact Array) 7-m array (12 antennas). The baselines were between 9 m (Bmin) and 969 m (Bmax), for a maximum recoverable scale (θMRS ∼ |$0.6\, \lambda \, B_{\rm min}^{-1}$|) of |$\sim \, 29$|arcsec. The observations were centred at αJ2000 = 16h 26m 26|${_{.}^{\rm s}}$|392, δJ2000 = –24° 24′ 30|${_{.}^{\prime\prime}}$|178. The lines here analysed are SO(56–45) (219.9 GHz), SO(66–55) (258.3 GHz), and SiO(5–4) (217.1 GHz): the spectroscopic parameters are reported in Table 1. The SO and SiO lines were observed using spectral windows with a bandwidth/frequency resolution of 59 MHz/122 kHz (∼80 km s−1/0.14–0.17 km s−1). The FWHM field of view (FoV) of the ALMA images are: 26 arcsec for SO(56–45) and SiO(5–4), and 22 arcsec for SO(56–45). A wide bandwidth (1.875 GHz) spectral window was also included to support measurement of the continuum emission. Data were calibrated using the quasars J1427-4206, J1517-2422, J1625-2527, J1924-2914, and J1626-2951, reaching an absolute flux calibration uncertainty of ∼10 per cent. The data were self-calibrated using line-free continuum channels. The primary beam correction has also been applied. We used the calibration pipeline2 within casa 5.6.1–8 (CASA Team 2022), including an additional calibration routine to correct for Tsys issues and spectral data normalization.3As a consequence, the dynamical range of the continuum data improved up to one order of magnitude. Once the three array configurations were merged, the resulting continuum-subtracted line-cubes were cleaned with a Briggs parameter of 0.5. The data analysis was performed using the iram-gildas4 package. The continuum has been imaged using uniform weighting, thus obtaining a beam of 0|${_{.}^{\prime\prime}}$|37 × 0|${_{.}^{\prime\prime}}$|34 (−65°), and 0|${_{.}^{\prime\prime}}$|43 × 0|${_{.}^{\prime\prime}}$|32 (−65°), for Setup 1 and Setup 2, respectively. On the other hand, the r.m.s. noise is 0.22 mJy beam−1 (Setup 1), and 0.15 mJy beam−1 (Setup 2). The synthesized beams of the line data sets are 0|${_{.}^{\prime\prime}}$|54 × 0|${_{.}^{\prime\prime}}$|45 (PA = –75°), for Setup 1, and 0|${_{.}^{\prime\prime}}$|48 × 0|${_{.}^{\prime\prime}}$|45 (PA = +86°), for Setup 2. The typical r.m.s. noise (per channel) is ∼3 mJy beam−1. To decrease the noise, the SiO(5–4) datacube has been spectrally smoothed to 1 km s−1, for an r.m.s. of 1 mJy beam−1.
| Transition . | νa . | E|$_{\rm u}^{\rm a}$| . | Log10(Aul/s−1)a . | Sμ2a . |
|---|---|---|---|---|
| . | (MHz) . | (K) . | . | (D2) . |
| SO(56–45) | 219949.442 | 35 | –3.9 | 14.0 |
| SO(66–55) | 258255.826 | 57 | –3.7 | 13.7 |
| SiO(5–4) | 217104.980 | 31 | –3.3 | 48.0 |
| Transition . | νa . | E|$_{\rm u}^{\rm a}$| . | Log10(Aul/s−1)a . | Sμ2a . |
|---|---|---|---|---|
| . | (MHz) . | (K) . | . | (D2) . |
| SO(56–45) | 219949.442 | 35 | –3.9 | 14.0 |
| SO(66–55) | 258255.826 | 57 | –3.7 | 13.7 |
| SiO(5–4) | 217104.980 | 31 | –3.3 | 48.0 |
| Transition . | νa . | E|$_{\rm u}^{\rm a}$| . | Log10(Aul/s−1)a . | Sμ2a . |
|---|---|---|---|---|
| . | (MHz) . | (K) . | . | (D2) . |
| SO(56–45) | 219949.442 | 35 | –3.9 | 14.0 |
| SO(66–55) | 258255.826 | 57 | –3.7 | 13.7 |
| SiO(5–4) | 217104.980 | 31 | –3.3 | 48.0 |
| Transition . | νa . | E|$_{\rm u}^{\rm a}$| . | Log10(Aul/s−1)a . | Sμ2a . |
|---|---|---|---|---|
| . | (MHz) . | (K) . | . | (D2) . |
| SO(56–45) | 219949.442 | 35 | –3.9 | 14.0 |
| SO(66–55) | 258255.826 | 57 | –3.7 | 13.7 |
| SiO(5–4) | 217104.980 | 31 | –3.3 | 48.0 |
4 RESULTS
4.1 Continuum emission
Fig. 2 shows the VLA 1623 region as observed in dust continuum emission at 216 GHz (1.4 mm) and 244 GHz (1.2 mm). A 1.2 mm image has been already reported in the context of the FAUST campaign by Codella et al. (2022), but only using the C43-4 configuration of the 12 m array. The 1.4 mm image has been presented by Mercimek et al. (2023) in the context of the analysis of source W.
The FAUST continuum images show the envelope containing the A1 and A2 binary system (not disentangled by the present spatial resolution) and the B protostar. The emission from the A1+A2 circumbinary disc is also revealed. At about 1300 au west of the A+B system, the W protostar is also detected. The J2000 coordinates of the A, B, and W protostars, as traced by the 2D fitting of both the 1.2 and 1.4 mm images are A: 16h 26m 26|${_{.}^{\rm s}}$|392, –24° 24′ 30|${_{.}^{\prime\prime}}$|90; B: 16h 26m 26|${_{.}^{\rm s}}$|307, –24° 24′ 30|${_{.}^{\prime\prime}}$|76; W: 16h 26m 25|${_{.}^{\rm s}}$|632, –24° 24′ 29|${_{.}^{\prime\prime}}$|64. In summary, the FAUST picture is well in agreement with the ALMA image at 0.9 mm obtained by Harris et al. (2018, see also the references therein) with a resolution of 0|${_{.}^{\prime\prime}}$|2. A detailed analyis of continuum emission is beyond the scope of this paper. Continuum images will contribute to the analysis of the origin of the SO and SiO (Section 4) gas observed in the A+B system.
4.2 Overall SO spatial distribution and spectra
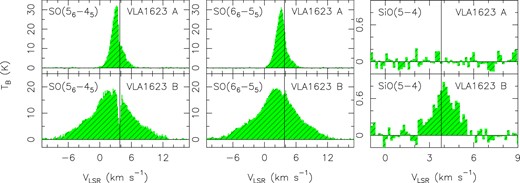
Both SO(56–45) and SO(66–55) emission lines have been detected and imaged. Fig. 3 shows the SO(56–45) and SO(66–55) line profiles derived integrating the emission over a region as large as the field of view of the SO map at 258 GHz (22 arcsec). In Fig. 3 (Bottom panels) the zoom-in shows the weakest SO emission, offset in velocity up to ∼ 10 km s−1 with respect to the systemic velocity of the A+B system, i.e. Vsys = + 3.8 km s−1 (Ohashi et al. 2022). More precisely, the velocity range goes from –7.6 to +12.0 km s−1. Emission due to SO has been recently reported by Hsieh et al. (2020), who detected the SO(88–77) line at 344 GHz with ALMA, in a narrower velocity range, from ∼ –2 km s−1 to ∼ +6 km s−1. Fig. 4 reveals the spatial distribution of the SO(56–45) and SO(66–55) emission as integrated over the whole emitting velocity range (moment 0 maps). The present SO maps improve the spatial resolution of the image collected by Hsieh et al. (2020), obtained with a synthesized beam of 1|${_{.}^{\prime\prime}}$|11 × 0|${_{.}^{\prime\prime}}$|76. Fig. 5 reports the SO(56–45) and SO(66–55) spectra extracted at the positions of the A, and B peaks. Emission is also detected towards the object W, located at the edge of the FoV of the SO(66–55) image, but its analysis is out of the scope of this paper. Those maps show that SO has compact emission peaking on A and B, but also shows extended and elongated structures not associated with the VLA1623 outflows. Both components are discussed below.

Dust continuum emission at 216 and 244 GHz (colour scale and contours) from the VLA1623-2417 multiple system. First contours, in white, are 3σ (0.8 mJy beam−1). Steps are 100σ. The synthesized beam (bottom-left corners) are 0|${_{.}^{\prime\prime}}$|43 × 0|${_{.}^{\prime\prime}}$|32 (PA = –65°), and 0|${_{.}^{\prime\prime}}$|38 × 0|${_{.}^{\prime\prime}}$|35 (PA = + 66°), for the 216 and 244 GHz maps, respectively. The A1 and A2 protostars are not disentangled at the present angular resolutions. The B and W protostars are also labelled.
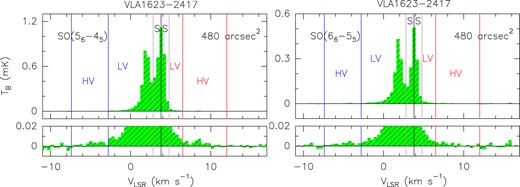
Upper panels: SO(56–45) (Left), and SO(66–55) (Right) spectra (in brightness temperature, TB, scale) derived integrating the emission over 480 arcsec2, i.e. a region 22 arcsec wide centred around the A1+A2+B protostars (see Fig. 4). In both panels, the brightness temperature r.m.s. is ∼ 1 mK. The vertical line is for the systemic velocity of the triple system of Vsys = + 3.8 km s−1 (Ohashi et al. 2022). The grey vertical lines show the velocity range ± 1 km s−1 with respect to Vsys (labelled S). Vertical lines delimitate the blue- and red-shifted velocity ranges tracing different SO structures, as described in Section 3. More precisely, the velocity range with a shift between 1.0 and 6.6 km s−1 (blue) or 2.5 km s−1 (red) is labelled as LV. The label HV is for the highest and weakest SO emission (see the results on kinematics of Section 4). Bottom panels: Zoom-in of the same SO spectra of the upper panels shown to highlight the weak high-velocity emission.
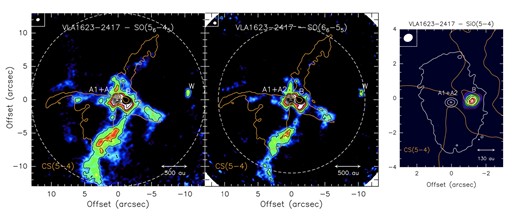
The VLA1623–2417 system as traced by the integrated intensity map (moment 0, colour scale and contours) of SO(56–45) (Left panel), SO(66–55) (Middle), and SiO(5–4) (Right). The SO emission is integrated from –7.6 to + 12.0 km s−1, while that of SiO map from +0.6 to + 5.2 km s−1. First contours of both the SO maps start from 3σ (27 mJy km s−1 beam−1) with intervals of 9σ. First contour of the SiO image start from 5σ (10 mJy km s−1 beam−1) with intervals of 3σ. The synthesized beam (top-left corners) are 0|${_{.}^{\prime\prime}}$|54 × 0|${_{.}^{\prime\prime}}$|45 (PA = –74°), for SO(56–45) and SiO(5–4), and 0|${_{.}^{\prime\prime}}$|47 × 0|${_{.}^{\prime\prime}}$|45 (PA = + 86°), for SO(66–55). The dashed circles delimitate the FWHM field of view of the ALMA image: 26 arcsec for SO(56–45) and SiO(5–4), and 22 arcsec for SO(56–45). In the right panel, white contours representing selected intensities of the continuum map at 216 GHz (see Fig. 2) are drawn to show the position of the A1+A2, and B protostars. The orange thick contour is the CS(5–4) emission (25σ) which traces the outflow cavity walls associated with VLA1623A1+A2 (from Ohashi et al. 2022).
4.3 SO emission close to the A and B protostars
The close association of the SO peaks with the protostellar positions suggest a possible contribution from hot-corinos, where the temperature is high enough (≥100 K) to allow evaporation into the gas phase of the icy mantles. Recent observations (Codella et al. 2022) of VLA1623-2417 imaged methanol emission rotating, on small-spatial scales, around the protostars A1 and B (see Fig. 1).
The linewidth of the SO spectra extracted at the A continuum peak (see Fig. 5) is 1.8 km s−1, narrower than the 4 km s−1 methanol profile observed by Codella et al. (2022). However, the entire SO lines are broader, and they look affected by absorption at velocities close to Vsys, more specifically at slightly red-shifted velocities, as found observing CS(5–4) by Ohashi et al. (2022). As a consequence, the contribution of the SO emission by the hot-corino in A cannot be assessed using the observed lines.
The line profiles extracted at the B continuum peak (Fig. 5) protostar are more complex: the lines are very broad (∼ 8 km s−1) with, in addition, extended wings suggesting the occurrence of a high-velocity jet. An absorption dip is observed at velocities close to the systemic one in the SO(56–45) line, whereas a weak absorption is present in the SO(66–55) profile. A remarkable absorption along the line of sight of B, down to negative brightness temperatures, has been observed by Ohashi et al. (2022) using CS, CCH, and H13CO+ low-excitation (Eu = 25–35 K) lines. Those profiles suggest absorption against an optically thick continuum in the background, associated with the protostar. The present SO profiles are also consistent with material placed between the material surrounding the protostars and the observer. As shown in Fig. 5, the absorption is more prominent for the SO(56–45) line (Eu = 35 K) with respect to the SO(66–55) one (Eu = 57 K), suggesting low-excitation absorbing material or an optically thick continuum.
4.4 Extended SO emission
The elongated SO structures can be compared with the spatial distribution of the CS cavities (orange contours in Fig. 4), opened by the outflow located along the NW-SE direction and driven by the VLA1623A1 object (Ohashi et al. 2022). Fig. 4 shows that two elongated structures lie outside the static CS cavities: (i) a very long (∼ 1500 au) one in the region south of the multiple protostellar system, and (ii) one located north of A1+A2, ∼ 250 au long. The present large scale picture shows some differences with respect to that drawn by Hsieh et al. (2020) using the SO(88–77) line: on the one hand we confirm the occurrence of the elongated structure north of A1+A2; on the other hand, the SW emission looks associated with the molecular cavity.
4.4.1 Southern region: the VLA1623 B accretion streamer
The analysis of kinematics allows us to disclose different molecular components emitting at different velocities. Fig. 6 shows the VLA1623-2417 A1+A2+B system as traced by both SO(56–45), and SO(66–55) emission integrated over ± 1 km s−1 (velocity range labelled S, see Fig. 3) with respect to the systemic velocity of the triple system of + 3.8 km s−1 (Ohashi et al. 2022). The emission at systemic velocity is mainly associated with the cavities, with additional features plausibly related with the VLA1623-2417 envelope. Fig. 7 shows the SO(56–45), and SO(66–55) maps of the blue-shifted (by 1–6.6 km s−1 with respect to Vsys) and red-shifted emission (by 1–2.5 km s−1), i.e. the intervals labelled as LV in Fig. 3. Note that the blue- and red-shifted LV ranges are asymmetric with respect to Vsys because they have been defined a posteriori after inspecting the SO data set to identify velocity ranges tracing the same molecular structure. On these maps the intensity-weighted velocity CS(5–4) map (moment 1 map), by Ohashi et al. (2022), is overlapped. The CS map reveals the rotation of the outflow cavity, with the southern sides red-shifted.
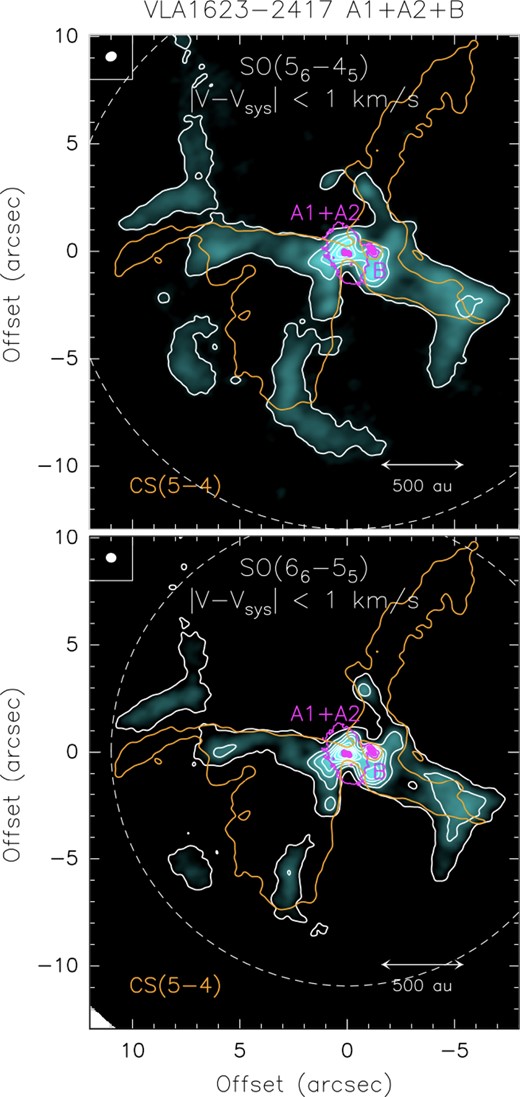
The VLA1623–2417 A1+A2+B system as traced by SO(56–45) (Upper panel), and SO(66–55) (Bottom) emission integrated over ± 1 km s−1 (labelled S in Fig. 3) with respect to the systemic velocity of the triple system of + 3.8 km s−1 Ohashi et al. (2022). The position of the A1+A2, B, and W protostars are labelled. The dashed circles delimitate the FWHM field of view of the ALMA image: 26 arcsec for SO(56–45), and 22 arcsec for SO(56–45). The dashed circles delimitate the FWHM field of view of the ALMA image. The synthesized beam (top-left corners) are 0|${_{.}^{\prime\prime}}$|54 × 0|${_{.}^{\prime\prime}}$|45 (PA = –74°), for SO(56–45), and 0|${_{.}^{\prime\prime}}$|47 × 0|${_{.}^{\prime\prime}}$|45 (PA = +86°), for SO(66–55). First contours of both the SO maps start from 5σ (35 mJy km s−1 beam−1, Upper, 25 mJy km s−1 beam−1, Lower) with intervals of 10σ. The orange thick contour is the CS(5–4) emission (25σ) which traces the outflow cavity walls associated with VLA1623A1+A2 (from Ohashi et al. 2022). In magenta we plot selected contours from the high spatial resolution (∼ 0|${_{.}^{\prime\prime}}$|2) continuum (0.9 mm) ALMA map by Harris et al. (2018) to pinpoint the positions of A1, A2, and B.
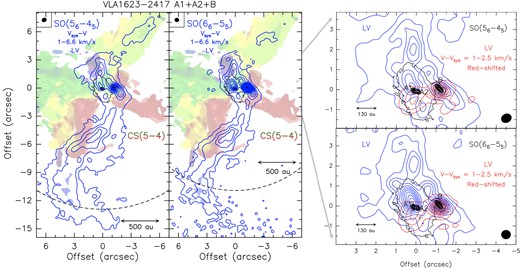
The VLA1623-2417 A1+A2+B system as traced by SO(56–45) (Left panel), and SO(66–55) (Middle) emission blue-shifted by 1–6.6 km s−1 and red-shifted by 1–2.5 km s−1 (labelled LV, see Fig. 3) with respect to the systemic velocity of the triple system of +3.8 km s−1 (Ohashi et al. 2022). For sake of clarity the contours of the red-shifted spatial distribution are reported only in the zoom-in in the right panels. The position of the A1+A2, and B protostars are labelled. The dashed circles delimitate the FWHM field of view of the ALMA image: 26 arcsec for SO(56–45), and 22 arcsec for SO(66–55). The synthesized beam (top-left corners) are 0|${_{.}^{\prime\prime}}$|54 × 0|${_{.}^{\prime\prime}}$|45 (PA = –74°), for SO(56–45), and 0|${_{.}^{\prime\prime}}$|47 × 0|${_{.}^{\prime\prime}}$|45 (PA = + 86°), for SO(66–55). First contours of both the SO maps start from 5σ (25 mJy km s−1 beam−1, blue, 15 mJy km s−1 beam−1, red) with intervals of 10σ. Colour image represents the moment 1 spatial distribution of the molecular cavity as traced by CS(5–4) by Ohashi et al. (2022): the cavities are rotating with the red-shifted emission coming from the southern arms, while the blue-shifted emission (here in green to avoid confusions with the SO blue contours) associated with the northern arms. In black we plot selected contours from the high spatial resolution (∼ 0|${_{.}^{\prime\prime}}$|2) continuum (0.9 mm) ALMA map by Harris et al. (2018) to pinpoint the positions of A1, A2, and B.
The red-shifted SO LV emission is quite compact, as highlighted in the zoom-in of Fig. 7. The emission peaks towards the B protostar, plus an additional component starting at the position of A1+A2 and inclined towards the SE direction, in agreement with the red-shifted outflow cavity (Ohashi et al. 2022).
On the other hand, the blue-shifted SO LV emission is very extended and clearly reveals a long (∼1500 au) southern streamer pointing to the central protostellar A+B system. Note that (i) the association with the outflow cavity is excluded from both the curved morphology, and, most importantly, (ii) by the fact that the outflow cavity in the southern region is red-shifted. These findings are well summarized by Fig. 8, which shows the position–velocity (PV) cut (obtained with a slice width equal to the beam) of SO(56–45), black, and CS(5–4), magenta (Ohashi et al. 2022), along the southern direction (PA = 0°) from the position of VLA1623 A (upper panel) and VLA1623 B (lower panel). The emission from the molecular cavity and the streamer are located in different positions of the PV plot.
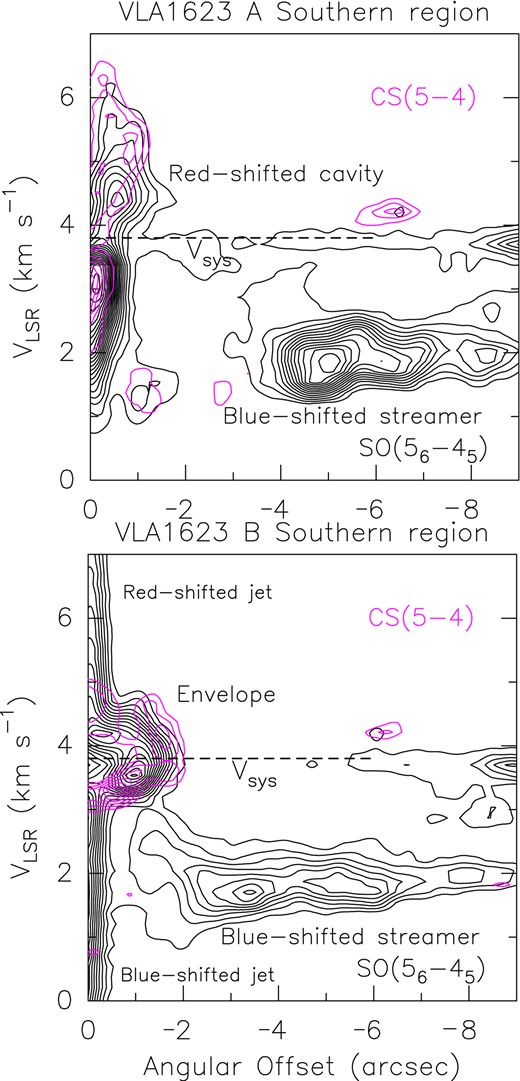
Position–velocity cut (beam averaged) of SO(56–45), black, and CS(5–4), magenta (Ohashi et al. 2022), along the southern direction (PA = 0 arcsec) centred on the position of VLA1623 A (Upper panel) and VLA1623 B (Lower panel) Contour levels range from 5σ (10 mJy beam−1) by steps of 8σ. Dashed lines marks the systemic velocity (+ 3.8 km s−1; Ohashi et al. 2022).
Crucial information on the streamer kinematics is also provided by Fig. 9, which shows, for the blue-shifted LV emission of both SO lines: the moment 1 image as well as the intensity-weighted velocity dispersion map (moment 2). More precisely, the zoom-in region in the right panels of Fig. 9 suggests that the streamer, once at ∼ 100 au from the protostars, is directing its gas mainly towards the B protostar, through an elongated feature well observed in the velocity dispersion map. The moment 2 map also indicates that the velocity dispersion is higher towards B, in agreement with an inclination close to the edge-on geometry (74°; Harris et al. 2018; Ohashi et al. 2022). Both the PV diagrams and the moment 1 maps show that the southern streamer is a coherent structure and slightly accelerating from VLSR ∼ 2 km s−1 at −8 arcsec distance from the protostar VLA1623 B to ∼1.5 km s−1 at −2 arcsec offset. This suggests that the streamer is conveying material towards the protostars.
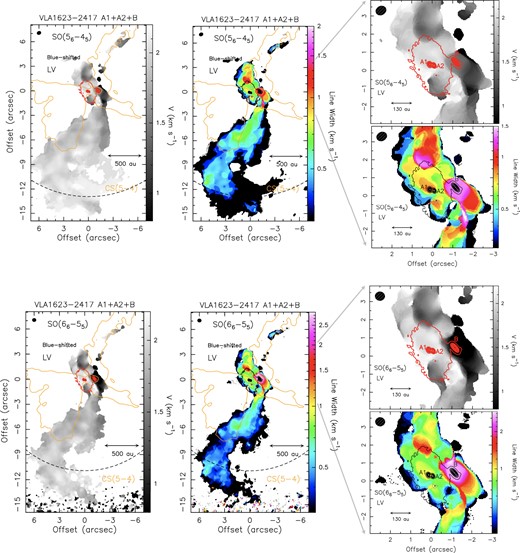
Kinematics of the VLA1623–2417 A1+A2+B system as traced by the SO(56–45) (Upper panels), and SO(66–55) (Bottom panels) emissions blue-shifted with respect to systemic velocity (+3.8 km s−1; Ohashi et al. 2022) of 1–6.6 km s−1 (labelled LV, see Fig. 3). Left and Middle panels are for the moment 1 (intensity-weighted peak velocity), and moment 2 (intensity-weighted emission width) maps, respectively (colour scale). First contours of both the SO maps start from 5σ (25 mJy km s−1 beam−1). The position of the A1+A2, and B protostars are labelled. The dashed circles delimitate the FWHM field of view of the ALMA image: 26 arcsec (Upper), and 22 arcsec (Bottom). The synthesized beam (top-left corners) are 0|${_{.}^{\prime\prime}}$|54 × 0|${_{.}^{\prime\prime}}$|45 (PA = –74°), for SO(56–45), and 0|${_{.}^{\prime\prime}}$|47 × 0|${_{.}^{\prime\prime}}$|45 (PA = + 86°), for SO(66–55). In red or black we plot selected contours from the high spatial resolution (∼ 0|${_{.}^{\prime\prime}}$|2) continuum (0.9 mm) ALMA map by Harris et al. (2018) to pinpoint the positions of A1, A2, and B. The orange thick contour is the CS(5–4) emission (25σ) which traces the outflow cavity walls associated with VLA1623A1+A2 (from Ohashi et al. 2022). Right panels: Zoom-in of the inner region around the circumbinary A1+A2 disc and the protostellar B disc.
To summarize, the analysis of the spatial distribution and velocity of the SO emission indicate a streamer of gas extending from the outer envelope (out to 1500 au distance from A+B) to the central cluster plausibly feeding source B. The velocity and velocity dispersion increase towards the protostellar multiple system, possibly indicating accretion from the large scale envelope to the protostellar discs. Note that the streamer is blue-shifted, but it is on the side with red-shifted rotation of outflow and envelope (Ohashi et al. 2022). To make this happen, the streamer needs to infall from the backside of sources, and it will go behind the central sources.
4.4.2 Northern region: the VLA1623 A accretion streamer
Focusing on the region north of A+B, Fig. 7 shows two small (∼ 1 arcsec) elongated features, which could be associated with the blue-shifted cavity expected in these regions, plus a longer (∼ 2 arcsec) structure located along the N–S direction (see the zoom-in in the right panels). The latter is not spatially associated with the outflow cavity, therefore plausibly being an accretion streamer, in agreement with what Hsieh et al. (2020) proposed using the SO(88–77) line. Again, instructive information is provided by kinematics. Fig. 9 shows that the northern LV streamer has an increase of the intensity-weighted emission line width coinciding (on the plane of the sky) with the outer regions of the circumbinary disc around A1+A2. In conclusion, these findings are very suggestive that material falls onto the circumbinary disc at the position where SO emission is broader. No further information on the fate of the material of the circumbinary disc is learned from the present data.
4.5 SO and SiO jet emission
Fig.10 shows the SO spatial distribution at the highest velocities with respect to Vsys = + 3.8 km s−1: blue-shifted by up to 11.2 km s−1, and red-shifted by up to 8.2 km s−1. This velocity range has been labelled as HV in Fig. 3. Note that the disc size derived from the high-spatial resolution continuum by Harris et al. (2018) is plotted in magenta. Both the SO(56–45) and SO(66–55) emissions are compact and overlap with the position of the protostar B. The red-shifted and blue-shifted emission peaks are spatially separated, and located along the SE-NW direction. This direction is perpendicular to the disc position angle (42°; Harris et al. 2018). In turn, these findings support the association of HV SO with outflowing motion driven by VLA1623 B. The velocities once deprojected using the geometry of the protostellar system (disc inclination ≃ 74°; Harris et al. 2018) reaches values ∼ 40 km s−1 with respect to the systemic velocity.
The SiO(5–4) line has been detected, for the first time, in the VLA1623 star forming region. Fig. 4 shows the moment 0 map: the emission is in fact spatially unresolved and it overlaps on the position of the B protostar. The spectrum towards VLA1623 B is shown in Fig. 5: the line is centred at the systemic velocity (+ 3.8 km s−1), and it extends up to about + 6 km s−1 and down to + 2 km s−1. Fig. 10 shows the blue- and red-shifted SiO emission: as for SO at the highest velocities, SiO is associated with a velocity gradient, with the red-shifted emission spatially offset towards SE (with respect to the continuum emission), while the blue-shifted emission peaks at NW. As a typical high-velocity shock tracer, SiO then probes the protostellar jet driven by VLA1623 B. This is consistent with the CO(2–1) ALMA Band 6 images by Santangelo et al. (2015): their maps have a lower spatial resolution (0|${_{.}^{\prime\prime}}$|65) than the FAUST data set, but they indicate the same spatial offset for emission at velocities blue- and red- shifted by at least 6 km s−1. The SiO radial velocities are lower than for SO. This could be due to the fact that the SO emission probes a wider angle layer of the wind with respect to SiO, which is expected to probe the inner collimated jet portion, as seen, e.g. in the high resolution ALMA maps of HH 212 (see e.g. Lee et al. 2019). In this scenario the SiO gas would lie closer to the plane of the sky, which would explain lower observed radial velocities. Moreover, the estimated jet velocity could be a lower limit since it is obtained by deprojecting the SiO and SO radial velocity for the inclination derived for the disk (∼74°). The estimate of disc inclination for systems that are close to edge-on is affected by large uncertainty (e.g. Villenave et al. 2020), and an inclination of larger than 85° would lead to a typical jet velocity of at least 100 km s−1 (Podio et al. 2021). Finally, note that the direction of the SiO velocity gradient is perpendicular (within the present spatial resolution) to the rotating protostellar disc recently traced using methanol by Codella et al. (2022) and at the C18O(2–1) HV emission (here traced in Fig. 10). This comparison again supports that SiO traces the protostellar jet ejected by VLA1623 B.
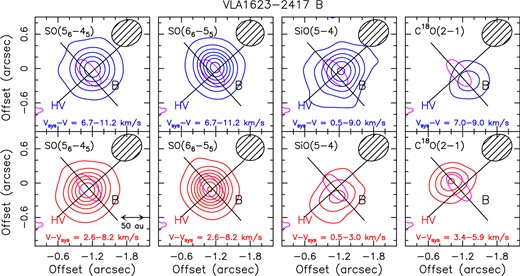
Kinematics of the VLA1623–2417 B protostar as traced by the SO(56–45), and SO(66–55) (Left panels) emission at the highest velocities with respect to systemic velocity (+ 3.8 km s−1; Ohashi et al. 2022): blue-shifted by up to 11.2 km s−1(Upper panels), and red-shifted by up to 8.2 km s−1(Lower panels). These velocity ranges are labelled as HV in Fig. 3. First contours of both the SO maps start from 5σ (20 mJy km s−1 beam−1) by steps of 10σ. The synthesized beam (top-right corners) are 0|${_{.}^{\prime\prime}}$|54 × 0|${_{.}^{\prime\prime}}$|45 (PA = –74°), for SO(56–45), and 0|${_{.}^{\prime\prime}}$|47 × 0|${_{.}^{\prime\prime}}$|45 (PA = + 86°), for SO(66–55). In magenta we plot a selected contour from the high spatial resolution (∼ 0|${_{.}^{\prime\prime}}$|2) continuum (0.9 mm) ALMA map by Harris et al. (2018). The tilted black cross indicates the disk inclination (PA = 42°) and the normal direction expected for the jet axis. (Right panels): SiO(5–4) and C18O(2–1) blue- and red-shifted emission. The SiO(5–4) line is weaker than the SO ones: first contours and steps correspond to 3σ: 9 and 6 mJy km s−1 beam−1 for the blue- and red-shifted emission, respectively. The velocity ranges are smaller fo SiO (see the text), while for C18O the highest velocities tracing emission around B have been selected and reported in the labels. The beam is that of the SO(56–45) image.
5 DISCUSSION
5.1 Excitation temperature of the VLA1623 B accretion streamer
In light of the SO results, and in order to constrain the physical parameters of the molecular streamer detected in the VLA1623 A+B region, we inspected the C18O(2–1) data set, published by Mercimek et al. (2023). Fig. 11 (Left panel) shows the C18O(2–1) map integrated over the velocities tracing the blue-shifted streamers, namely shifted by 1.4–3.2 km s−1 with respect to Vsys. The southern streamer accreting towards VLA1623 B is well revealed, while in the northern portion of the map there is a clear contamination with the blue-shifted outflow cavity. We then proceeded to analyse the southern VLA1623 B streamer. We extracted the spectrum at the position offset by –0|${_{.}^{\prime\prime}}$|7,–3|${_{.}^{\prime\prime}}$|0 (with respect to the phase centre of the map, see Section 2), i.e. at the emission peak closest to the A+B system. The C18O(2–1) line profile shows the Gaussian-like component associated with the accretion streamer. Fig. 11 (Right panels) compares the C18O(2–1) lines with those of both the SO lines, extracted at the same position of the map. Also the SO spectra show a Gaussian-like profile similar to that of C18O. Assuming an LTE (local thermodynamic equilibrium) population and optically thin lines, a crude estimate of the SO excitation temperature (Tex) can be derived from the two SO observed lines: 33 ± 9 K. To our knowledge, this is the first Tex estimate of a molecular streamer based on two lines of the same species, being usually detected with one emission line of a molecular species (see the recent review by Pineda et al. 2023). Based on a simple toy model where the gas and dust are heated by the central protostars (without considering the outflow cavities and the discs) (e.g. Ceccarelli et al. 2000), we estimate the expected gas temperature at ∼ 390 au distance from the protostars (where the spectra have been extracted). For a total bolometric luminosity of ∼ 1 L⊙, we find that the temperature is ∼ 20 K. The estimated excitation temperature is higher, being in the 24–42 K range. However, the comparison has to be taken with a pinch of salt, being based on two transitions: more lines need to be observed to investigate the reliability of the LTE assumption, as well as possible line opacity effects. In addition, (i) if the emission is thermalized, the temperature is likely to increase near the cavity walls, being thus closer to the SO excitation temperature, and (ii) there are the uncertainties due to projection effects and to the length of the material along the line of sight.
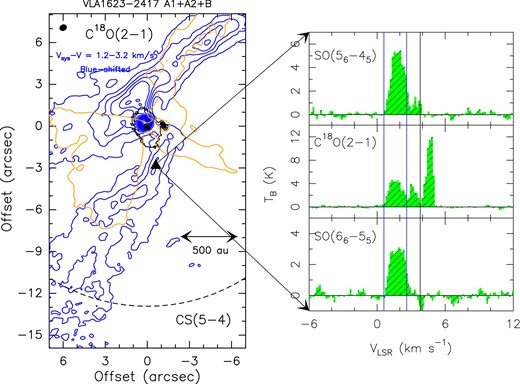
Left panel: The VLA1623–2417 southern molecular streamer as traced by the C18O(2–1) emission at velocities blue-shifted by 1.4–3.2 km s−1 with respect to Vsys = + 3.8 km s−1. The velocities are those tracing, in C18O, the blue-shifted streamer (see the text). First contours start from 5σ (30 mJy km s−1 beam−1) with intervals of 3σ. Right panels SO(56–45), C18O(2–1), and SO(66–55) spectra (in brightness temperature, TB, scale) derived at the position (–0|${_{.}^{\prime\prime}}$|7,–3|${_{.}^{\prime\prime}}$|0) associated with the streamer, and marked with a triangle in the Left panel. The vertical lines at 3.8 km −1 are for the systemic velocity, while the other vertical lines delimit the velocities of the C18O used to obtain the image of the southern streamer shown in the Left panel.
Note that the excitation temperature measured towards the SO region where the northern streamer impacts with the circumbinary VLA1623 A disc (see Fig. 9 at + 0|${_{.}^{\prime\prime}}$|3, + 1|${_{.}^{\prime\prime}}$|5 from the map centre) is higher than the value measured in the southern streamer, 55 ± 12 K, a temperature plausibly increased due to a slow shock at the impact location. The SO excitation temperature has been estimated also at the position where the southern streamer seems to impact onto the disc of the B protostar (see Fig. 9 at –1|${_{.}^{\prime\prime}}$|4,–0|${_{.}^{\prime\prime}}$|2): the temperature is high, 63 ± 12 K, and it can be explained again by a shock. Alternatively, given the proximity of the position to B, the high temperature could be due to protostellar heating. Again, this has to be verified using multiple SO lines for a more reliable temperature measurement.
5.2 Accretion and infalling rates
At a temperature of 33 K, the total SO column density is NSO ≃ 2 × 1014 cm−2. To derive the uncertainty, NSO increases by a factor 2 assuming 20 K instead of 33 K. The total column density of C18O is 4 × 1015 cm−2. Using the classical 16O/18O = 560 and CO/H2 = 10−4 (Wilson & Rood 1994), the H2 total column density is 2 × 1022 cm−2. The total mass of the blue-shifted southern streamer can be estimated from the emitting region and the estimate of the average C18O (and consequently H2) column density throughout the emitting region: Mstreamer ≃ 3 × 10⁻³ M⊙. This estimate is lower with respect to the total mass of the HC3N long (104 au) streamer detected by Pineda et al. (2020) towards the Class 0 object IRAS 03292+3039 (Mstreamer = 0.1–1 M⊙). On the other hand, if we compare the VLA 1623–2417 southern streamer with the Class I streamers, our estimates are similar: SVS13-A (4 × 10⁻³M⊙; Hsieh et al. 2023) and Per-emb-50 (1 × 10⁻²M⊙; Valdivia-Mena et al. 2022).
As the southern streamer is impacting on the disc of source VLA1623 B, we aim to compare the mass infall rate of the streamer with the mass accretion rate on source B, to understand how much streamers may contribute to set the final mass of protostellar objects. This is indeed still an open question, given the paucity of measurements of the physical properties of accretion streamers. On the one hand, Pineda et al. (2020) and Valdivia-Mena et al. (2022) found that the accretion rates of the streamers in IRAS 03292+3039 and Per-emb-50, are of the same order of magnitude of the protostellar accretion rates. On the other hand, Hsieh et al. (2023), found an accretion rate of the streamer lower by an order of magnitude with respect to the protostellar accretion in the SVS13-A source. An estimate of the free-fall time-scale of the southern streamer accreting VLA1623 B can be obtained using the classical equation (e.g. Pineda et al. 2020, 2023),
where R is the streamer length, Mtotal is the mass inside R, and G is the gravitational constant. Taking R = 1500 au, a total mass in the 1–2 M⊙ range (e.g. Murillo et al. 2018a; Ohashi et al. 2022), we obtain, for the southern blue-shifted streamer, tff ≃ 6–9 × 10³ yr. Note that the free-fall velocity lies in the range 0.9–1.3 km s−1, i.e. values quite close (56 per cent–81 per cent) to the difference in velocity, 1.6 km s−1, observed within the southern streamer. By dividing the streamer mass with the free-fall time-scale we obtain an estimate of the accretion rate of the southern streamer onto the B protostar: 3–5 × 10⁻⁷ M⊙ yr−1.
To estimate the mass accretion rate on source B, we assume that the source bolometric luminosity is due to the gravitational energy released by the accretion onto the protostar (Lbol = Lacc), and estimate the mass accretion as: |$\dot{M}_{\rm acc}$| = LbolR*/GM*. The bolometric luminosity of source B derived by Murillo et al. (2018a) based on the source spectral energy distribution is 0.2–0.3 L⊙, while the protostellar mass has been estimated from the fit of the rotation curve of the disc by Ohashi et al. (2022), giving a dynamical mass of 1.7 M⊙. Based on these values, and assuming that the stellar radius is R* = 2 R⊙ (Stahler 1988) we infer |$\dot{M}_{\rm acc}$| = 10−8 M⊙ yr−1. The estimated mass accretion rate is highly uncertain because it depends strongly on the protostellar properties, which may be affected by large uncertainties, and because accretion may be episodic and characterized by accretion bursts (Fischer et al. 2023). In particular, the estimated dynamical mass is uncertain, due to the intermediate angular resolution of the FAUST data (50 au; Ohashi et al. 2022). If we assume the typical range of masses kinematically estimated for low-mass protostellar objects, i.e. M* = 0.05–0.25 M⊙ (Choi, Tatematsu & Kang 2010; Kwon et al. 2015; Yen et al. 2017; Lee 2020), we obtain a mass accretion rate up to 6 × 10⁻⁸M⊙ yr−1 (for 0.25 M⊙) and 3 × 10⁻⁷M⊙ yr−1 (for 0.05 M⊙). In summary, as the streamer infall rate is about 3–5 × 10⁻⁷M⊙ yr−1 the mass fed by the streamer is comparable with the total mass accretion rate.
5.3 SO abundances in the southern VLA1623 B streamer
The SO abundance relative to H2 can be derived for the LV southern streamer by comparing the SO and H2 column densities extracted at the (–0|${_{.}^{\prime\prime}}$|7,–3|${_{.}^{\prime\prime}}$|0) position, where C18O emission is dominated by the streamer emission (see Section 5.1): XSO ≃ 10−8. This value is larger than that measured in the gas phase in molecular clouds located in Perseus, Taurus, and Orion (0.7–2 × 10⁻⁹; Navarro-Almaida et al. 2020; Rodríguez-Baras et al. 2021, and references therein). On the other hand XSO ≃ 10−8 is at the lower end of the SO abundance range derived for hot-corinos around protostars up to ∼ 10−7 (e.g. Codella et al. 2021, and references therein). However, the hot-corino nature, i.e. the thermal evaporation of the dust mantle in the streamer, is here excluded (assuming LTE conditions), considering the derived excitation temperature of ∼ 30 K. Even the occurrence of strong shocks (Vshocks ≥ 10 km s−1) has to be excluded given that they would increase the SO abundance up to higher values than those observed in the southern streamer (∼ 10−7, e.g. Bachiller & Pérez Gutiérrez 1997; Bachiller et al. 2001; Feng et al. 2020). A possibility to explain an SO abundance larger than those typical in starless molecular clouds is to speculate the occurrence of mild shocks (Vshocks of a few km s−1), induced by the accretion of the gas through the streamer, releasing part of the Sulphur on dust mantles. Interestingly, van Gelder et al. (2021) modelled the Sulphur chemistry in low-velocity shocks (down to ∼ 3–4 km s−1), showing that SO can be efficiently formed from SH reacting with the O atom and/or S with OH. The SO chemistry in the streamer could mimic that observed in the L1448-mm protostar (Jiménez-Serra et al. 2005), where the weak shock precursor component increases the SO abundance by one order of magnitude only.
5.4 VLA 1623B: the SiO jet
Here we estimate the beam-averaged column density in the HV SO component (see Fig. 3) as well as of the SiO jet. Assuming LTE conditions and optically thin emission, the excitation temperature of the HV SO ranges between 92 ± 18 K (emission red-shifted by up to 8.2 km s−1) and 102 ± 19 K (emission blue-shifted by up to 11.2 km s−1). This supports the association of HV SO with shocked regions created by the propagation of the jet driven by VLA1623 B, as observed in several protostellar regions (e.g. Bachiller et al. 2001; Feng et al. 2020; Taquet et al. 2020; Podio et al. 2021, and references therein). With these temperatures the SO column density is ∼ 5 × 1014 cm−2. The SiO total column density has been derived assuming a typical jet temperature of 100 ± 50 K (e.g. Podio et al. 2021), obtaining NSiO = 2–5 × 1012 cm−2. Unfortunately, the SO and SiO abundances cannot be constrained because the C18O(2–1) emission at these highest detected velocities (up to 6 km s−1 and down to 9 km s−1 with respect to Vsys) are tracing a compact structure rotating along a direction perpendicular to the SiO jet axis (Fig. 10, Right panels). As a matter of fact, C18O observed on spatial scales below 100 au is an efficient tracer of the inner protostellar envelope and/or accretion discs (Murillo et al. 2015; Bergner et al. 2019; Zhang et al. 2021; Mercimek et al. 2023). In the VLA1623 B case, C18O(2–1) traces the same rotating gas observed as the CH3OH by Codella et al. (2022) using the FAUST data set.
6 CONCLUSIONS
In the context of the FAUST ALMA Large Program, the VLA1623-2417 protostellar cluster has been imaged at 1.2–1.3 mm in the SO(56–45), SO(66–55), and SiO(5–4) emissions at the spatial scale of 50 au. In particular, we focused on VLA1623 A and its circumbinary disc, and on the VLA1623 B protostar. The main findings are summarized as follows:
SO shows extended (∼ 20 arcsec, 260 au) emission, peaking towards the A and B protostars, where the observed spectra are consistent with the association with the A and B hot-corinos. An absorption dip is present in the VLA1623 B profile. The absorption is more prominent for SO(56–45), suggesting the presence of a cold SO component along the line of sight;
The analysis of the SO kinematics allows us to reveal different structures emitting at different velocities. At the systemic velocity (+3.8 km s−1) elongated SO structures are associated with the outflow cavities previously imaged in CS. Velocities blue-shifted by 1–6.6 km s−1 reveal a long (∼ 2000 au) southern streamer, with an increase in the mean velocity of ∼ 1.6 km s−1 approaching the central A + B system, and apparently feeding the VLA1623 B protostar. In addition, a ∼ 2 arcsec (260 au) streamer, previously observed by Hsieh et al. (2020), is imaged through the N-S orientation, impacting from North the A circumbinary disc;
The SiO emission, detected for the first time in VLA1623-2417, is very compact (∼ 100 au) and associated only with the B protostar. The HV SO emission, red- and blue-shifted up to ∼ 10 km s−1 is also compact (≤ 100 au), and overlaps with the B protostar, as shown by SiO(5–4). Assuming LTE conditions and optically thin lines, an estimate of the HV SO excitation temperature can be derived: 92 ± 5 K(red) and 102 ± 6 K (blue), showing the association of HV SO with shocks created by VLA1623 B jet. Using these temperatures, the SO and SiO total column densities are NSO = 5 × 1014 cm−2, and NSiO = 2–5 × 1012 cm−2, respectively;
An estimate of the SO excitation temperature of the southern streamer can also be derived (LTE, optically thin emission): 33 ± 9 K. The total SO column density is 2 × 1014 cm−2. Using C18O(2–1) FAUST data (Mercimek et al. 2023), we estimated the SO abundance: XSO ≃ 10−8, a value higher than what is usually found in molecular clouds. We speculate the occurrence of weak shocks induced by the accretion through the shock which could release into the gas-phase part of the dust mantles;
The total mass of the blue-shifted southern streamer is 3 × 10⁻³ M⊙. This estimate is in agreement with those observed in Class I objects: 4 × 10⁻³M⊙ for SVS13-A (Hsieh et al. 2023), and 1 × 10⁻²M⊙ for Per-emb-50 (Valdivia-Mena et al. 2022). On the other hand, our estimate is lower with respect to that measured in the Class 0 object IRAS 03292+3039 (0.1–1 M⊙; Pineda et al. 2020). It would be tempting to correlate the streamer mass with the evolutionary stage of the accreting protostars. However, beside the evident lack of statistics, the comparison between the total mass of the streamers strongly depends on its length, which looks not fully traced because it is larger than the FoV of the interferometric (IRAM-NOEMA, ALMA) images;
The free-fall time-scale of the southern streamer is 6–9 × 10³ yr. Consequently, the estimate of the the accretion rate of the streamer on the B protostar is 3–5 × 10⁻⁷M⊙ yr−1. This can be compared with the mass accretion rate, |$\dot{M}_{\rm acc}$|, on source B, calculated between 6 × 10⁻⁸M⊙ yr−1 and 3 × 10⁻⁷M⊙ yr−1. In conclusion, the mass fed by the streamer is a significative fraction of the total mass accretion rate of VLA1623 B.
7 EPILOGUE: UNIQUENESS OF THE VLA1623–2717 REGION
The ALMA high-sensitivity FAUST data contributed to chemically characterize the already well studied VLA1623–2417 star forming region, imaging: CS, CCH, and H13CO+ (Ohashi et al. 2022), CH3OH, and HCOOCH3 (Codella et al. 2022), C18O (Mercimek et al. 2023), SO, and SiO (this paper). As matter of fact, CH3OH, HCOOCH3, and SiO have been detected for the first time in VLA1623–2417. In addition, the FAUST papers enlighted the multiple processes at work in shaping a multiple protostellar system A1+A2+B. More specifically, there are strong hints of misaligned accretion from the southern environment (this paper), and the possible hierarchical decay of the multiple stellar system, where the A1 and B protostellar discs are counter-rotating (Codella et al. 2022; Ohashi et al. 2022), molecular envelope and outflows show a misalignment rotation (Ohashi et al. 2022), and with the ejection of one member of such an unstable system in the NE direction (Mercimek et al. 2023; VLA1623 W).
ACKNOWLEDGEMENTS
We thank the anonymous referee for their comments and suggestions definitely improved the manuscript. This project has received funding from the EC H2020 research and innovation programme for: (i) the project ‘Astro-Chemical Origins’ (ACO, No 811312), (ii) the European Research Council (ERC) project ‘The Dawn of Organic Chemistry’ (DOC, No 741002), and (iii) the European Research Council (ERC) project Stellar-MADE (No. 101042275, project Stellar-MADE). CC, LP, and GS acknowledge the PRIN-MUR 2020 BEYOND-2p (Astrochemistry beyond the second period elements, Prot. 2020AFB3FX), the PRIN MUR 2022 FOSSILS (Chemical origins: linking the fossil composition of the Solar System with the chemistry of protoplanetary discs, Prot. 2022JC2Y93), the project ASI-Astrobiologia 2023 MIGLIORA (Modelling Chemical Complexity, F83C23000800005), and the INAF-GO 2023 fundings PROTO-SKA (Exploiting ALMA data to study planet forming discs: preparing the advent of SKA, C13C23000770005). LP also acknowledges support from the INAF Mini-Grant 2022 “Chemical Origins”. GS also acknowledges support from the INAF-Minigrant 2023 TRIESTE (‘TRacing the chemIcal hEritage of our originS: from proTostars to planEts’). EB aknowledge the Deutsche Forschungsgemeinschaft (DFG, German Research Foundation) under Germany’s Excellence Strategy – EXC 2094–390783311. DJ is supported by NRC Canada and by an NSERC Discovery Grant. LL acknowledges the support of UNAM DGAPA PAPIIT grants IN112820 and IN108324, and CONAHCYT-CF grant 263356. SBC was supported by the NASA Planetary Science Division Internal Scientist Funding Program through the Fundamental Laboratory Research work package (FLaRe). IJ-S acknowledges funding by grants No. PID2019-105552RB-C41 and PID2022-136814NB-I00 from the Spanish Ministry of Science and Innovation/State Agency of Research MCIN/AEI/10.13039/501100011033 and by ‘ERDF A way of making Europe’. This paper makes use of the following ALMA data: ADS/JAO.ALMA#2018.1.01205.L. ALMA is a partnership of ESO (representing its member states), NSF (USA) and NINS (Japan), together with NRC (Canada), MOST and ASIAA (Taiwan), and KASI (Republic of Korea), in cooperation with the Republic of Chile. The Joint ALMA Observatory is operated by ESO, AUI/NRAO and NAOJ. The National Radio Astronomy Observatory is a facility of the National Science Foundation operated under cooperative agreement by Associated Universities, Inc.
DATA AVAILABILITY
The raw data are available on the ALMA archive at the end of the proprietary period (ADS/JAO.ALMA#2018.1.01205.L).
Footnotes
http://faust-alma.riken.jp; Codella et al. (2021)
https://github.com/autocorr/faust_line_imaging; Chandler et al. (in preparation)
https://help.almascience.org/kb/articles/what-errors-could-originate-from-the-correlator-spectral-normalization-and-tsys-calibration; Moellenbrock et al. (in preparation)


