


ABSTRACT
SMC X-2 exhibits X-ray outburst behaviour that makes it one of the most luminous X-ray sources in the Small Magellanic Cloud. In the last decade it has undergone two such massive outbursts – in 2015 and 2022. The first outburst is well reported in the literature, but the 2022 event has yet to be fully described and discussed. That is the goal of this paper. In particular, the post-peak characteristics of the two events are compared. This reveals clear similarities in decay profiles, believed to be related to different accretion mechanisms occurring at different times as the outbursts evolve. The H α emission line indicates that the Be disc undergoes complex structural variability, with evidence of warping as a result of its interaction with the neutron star. The detailed observations reported here will be important for modelling such interactions in this kind of binary systems.
1 INTRODUCTION
SMC X-2 is a high-mass X-ray binary system located in the Small Magellanic Cloud (SMC), a satellite galaxy of the Milky Way. The system consists of a neutron star and a massive companion star, which are orbiting each other in a close binary system.
The neutron star in SMC X-2 is a highly compact object with a mass approximately 1.4 times that of the sun, but a radius of only a few kilometers. The companion star is a massive OB-type star, which is a type of hot, luminous star that emits strong Balmer lines in its spectrum due to the presence of a circumstellar disc of gas.
The binary system is slightly eccentric (e = 0.07), with an orbital period of 18.4 d (Townsend et al. 2011). As the two stars orbit each other, material from the companion star’s circumstellar disc is pulled towards the neutron star due to its strong gravitational field. This material may form a transient accretion disc around the neutron star, which emits X-rays as it is heated up and undergoes gravitational interactions with the neutron star.
SMC X-2 is an important object of study for astrophysicists because it is a high-mass X-ray binary system (HMXB), which is a class of objects that are thought to provide significant sources of X-rays in the universe. The system is also notable for exhibiting a range of complex X-ray variability. These include regular 2.37 s pulsations from the neutron star, as well as more erratic variability that is likely caused by changes in the circumstellar disc size and hence accretion rate on to the neutron star.
The first reported super-Eddington outburst for SMC X-2 was in 2000 (Corbet et al. 2001). It then underwent an extended period of quiescence until 15 yr later when the system exhibited another major X-ray outburst reaching X-ray luminosities well in excess of 1038 erg s−1. Observational reports and follow-up discussions of this particular outburst may be found in the following papers: Lutovinov et al. (2017), Li et al. (2016), Fotopoulou et al. (2015), La Palombara et al. (2016), Kennea et al. (2015), Roy et al. (2022), and Jaisawal et al. (2023). 7 yr later the source underwent the next major X-ray outburst which is reported in this paper. Though this 2022 outburst did not quite reach the same X-ray peak luminosity as the 2015 event it none the less again exceeded 1038 erg s−1 and hence represents a substantial occurrence. In this work, we report a multiwaveband study of this event and make important comparisons with the earlier 2015 X-ray outburst.
2 OBSERVATIONS
2.1 Swift X-ray observations
The Swift Small Magellanic Cloud (SMC) Survey, S-CUBED,project (Kennea et al. 2018) started regular observations using the Swift X-ray Telescope (XRT; Burrows et al. 2005) of the SMC in July 2016 in order to watch for X-ray outbursts from Be star X-ray Binary ststems (BeXRB) systems.As part of this project SMC X-2 has been observed approximately weekly in the 0.3–10 keV band, although the majority of these observations are only 60 s exposure. We note that the previous outburst of SMC X-2 was in 2015, and was tracked extensively by Swift through target of opportunity (TOO) observations, however this outburst was over before the S-CUBED project began.
On 2022 June 14, data from S-CUBED showed a point source at the location of SMC X-2 detected in 38 s of Photon Counting (PC) mode XRT data, significantly above all previous upper limits found in S-CUBED monitoring of this source Kennea, Coe & Evans (2022). This indicated that SMC X-2 was likely entering a new outburst phase.
Due to the detection of this new outburst observations were requested through the Swift TOO programme, consisting of initially daily, followed by every 2 d observations with a requested exposure time of 1 ks per exposure. Observations were taken in a combination of PC and windowed timing (WT) modes for XRT, based on predicted X-ray brightness. These TOO observations continued until SMC X-2 was no longer detectable by Swift, with the final observation taken on 2022 September 19. Alongside these TOO observations, S-CUBED regular monitoring of the source continued.
A table of TOO observations is given in Table A1 and the resulting measurements displayed in Fig. 1.
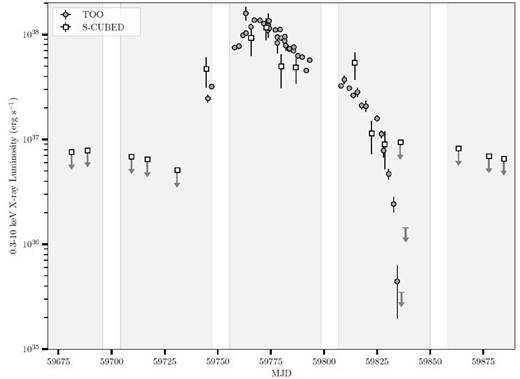
Combined S-CUBED and TOO X-ray light curve of SMC X-2, showing the 2022 outburst period. Grey background regions show periods of time when the source was observable by Swift, white gaps are observing gaps due to spacecraft constraints. The similarity of the 2022 outburst profile can be compared to the 2015 outburst profile (see fig. 1 from Lutovinov et al. 2017).
Fig. 2 shows the X-ray decay profiles of the 2022 outburst overlaid on the profile for the 2015 one. To produce this merged plot the 2015 data timings have been arbitrarily adjusted by −57 280 d and the 2022 data by −59 740 d. There has been no attempt to precisely match the data sets, but rather a small offset has been chosen so that both data sets can be clearly seen to follow similar decay patterns. Though the peak fluxes differ by a factor of 2, the decay profiles are extremely similar. In both cases there is a distinct change in the decay slope around the 60 d mark in the figure. These decay profiles are discussed further below.
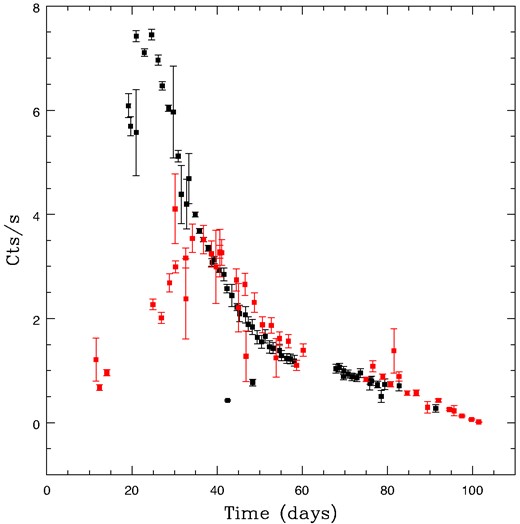
The X-ray profiles (XRT counts s−1 in 0.3–10 keV range) of the 2015 outburst (largest outburst) overlaid on top of the 2022 outburst discussed in this paper (smaller outburst). The 2022 data are the same as that presented in Fig. 1, but on a linear scale and in flux units.
2.2 Ultraviolet and optical photometry
The Ultraviolet and Optical Telescope (UVOT) uvw1 filter (2600 Å) data were analysed using the Swift ftools available in heasoft version 6.30. Images with multiple snapshots were summed with uvotimsum. Photometry was then performed using uvotsource with a source region of radius 5 arcsec and a larger source-free background region. Images that were not aligned with the World Coordinate System were first aspect corrected using uvotunicorr before being analysed as previously described. The resulting light curve is shown in Fig. 3.
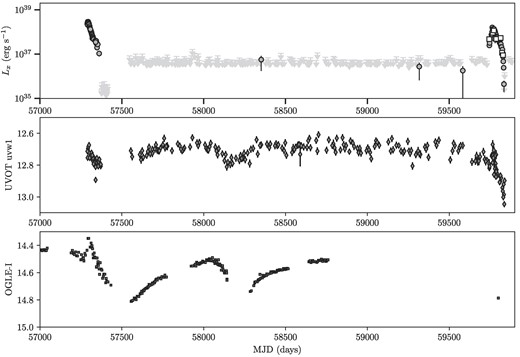
8 yr time history of Swift XRT 0.3–10 keV (top panel), UVOT uvw1 filter (middle panel), with OGLE I-band light curve plotted for comparison (bottom panel). The 2015 outburst covers the period MJD57300–57450, and the 2022 outburst MJD59750–58400.
The Optical Gravitational Lens Experiment (OGLE) project (Udalski, Szymański & Szymański 2015) provides long term I-band photometry with a cadence of 1–3 d. I-band data were collected on the optical counterpart to SMC X-2 as part of the OGLE IV project from JD 2455 346 till JD 2458 759. The OGLE identification for this object is SMC720.17.50. These results are also shown in Fig. 3.
2.3 Optical spectroscopy
The optical counterpart to SMC X-2 was observed with the Southern African Large Telescope (SALT; Buckley, Swart & Meiring 2006) using the Robert Stobie Spectrograph (RSS; Burgh et al. 2003; Kobulnicky et al. 2003) and the High-Resolution Spectrograph (HRS; Bramall et al. 2010, 2012; Crause et al. 2014). The RSS observations were performed using various grating settings: PG0900, PG1800, and PG2300. A summary of the settings is provided in Table 1. The primary reductions (which comprise overscan correction, bias subtraction, gain correction, and amplifier cross-talk corrections) were performed using the SALT pipeline (Crawford et al. 2012). The remaining data reduction steps (arc line identification, background subtraction, and one-dimensional spectrum extraction) were executed using iraf.1
A summary of the settings for the SALT RSS observations.
| Grating | Wavelength | Exposure | |
|---|---|---|---|
| Grating | angle | range (Å) | time (s) |
| PG0900 | 12.5/14.75 | 4070−7000 | 120/600 |
| PG1800 | 36.5 | 5900−7200 | 240 |
| PG2300 | 48.875 | 6100−6900 | 1800 |
| Grating | Wavelength | Exposure | |
|---|---|---|---|
| Grating | angle | range (Å) | time (s) |
| PG0900 | 12.5/14.75 | 4070−7000 | 120/600 |
| PG1800 | 36.5 | 5900−7200 | 240 |
| PG2300 | 48.875 | 6100−6900 | 1800 |
The HRS observations were carried out in low-resolution mode (R ∼ 14000), where exposure times of 1200 s were used. A wavelength coverage of 3750–8790 Å was obtained. The SALT pipeline was used for the primary reductions, while the remaining reduction steps (background subtraction, identification of arc lines, blaze function removal, and merging of the orders) were done using the midas feros (Stahl, Kaufer & Tubbesing 1999) and echelle (Ballester 1992) packages. The full details of the data reduction process are described in Kniazev, Gvaramadze & Berdnikov (2016).
A log of the observations and the inferred H α equivalent width (EW) measurements are shown in Table A2. An example of the H α emission line profile is shown in Fig. 4.
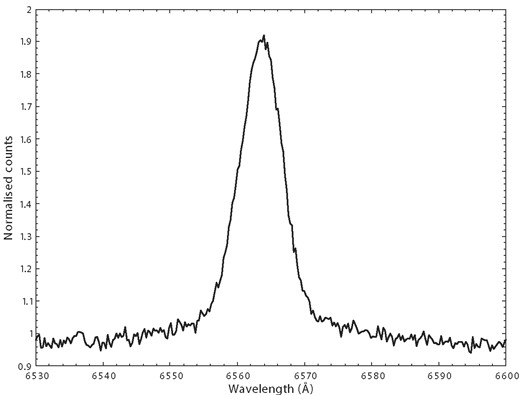
An example of the H α emission line in SMC X-2 from an RSS observation obtained on 2022 July 8 (MJD59798.07).
However, obtaining a reliable assessment of the true strength of the H α EW for SMC X-2 is difficult. The optical counterpart has been shown to have a very close, similar star on the sky, separated by just ∼1 arcsec (Murdin, Morton & Thomas 1979). Those authors report that the nearby star is an O7 type object, which means it probably has an H α EW of +(3.0–3.4) Å (Conti 1974). The vast majority of the SALT spectra were obtained whilst the seeing conditions were 1–2 arcsec, therefore it is probable that there is some contamination of the determined H α EW values for SMC X-2 by up to this amount. If the O7 star does not have a circumstellar disc, and hence does not exhibit variable H α EW, then the estimates presented here of the H α EW for SMC X-2 could be misrepresented in magnitude by up to +3 Å. So it cannot be assumed that any apparent changes in this parameter from SMC X-2 are real if the changes are less than ∼3 Å.
2.4 MeerKAT
We obtained three observations of SMC X-2 with Maximum Karoo Array Telescope (MeerKAT) during its outburst. The observations were performed at a central frequency of 1.28 GHz, bandwidth of 856 MHz and an integration time of 8 s. Each observation consisted of a total of 60-min scans on target. J0408-6545 was used as a primary calibrator, where it was observed at the start and end of each scan. The secondary calibrator, J0252-7104, was observed in 2-min scans for every 20-min on the target. The data were processed using the oxkat reduction routines (Heywood 2020)2, which performs averaging, application of standard bandpass and gain corrections, and flagging. The imaging was executed using wsclean, after which a self-calibration cycle was performed. All three observations resulted in non-detections at the optical position of SMC X-2. A log of the 3σ upper limits is given in Table 2. The radio emission during peak outburst is believed to be due to the launch of an accretion-powered jet in these systems (e.g. van den Eijnden et al. 2021, 2022). However, the current sensitivity of instruments is inadequate to detect jet emission at extragalactic distances. The increased sensitivity from future radio telescopes in the Southern hemisphere is expected to probe the jet-launching mechanism.
MeerKAT (1.28 GHz) 3σ upper limits.
| Date | MJD | Radio flux density (µJy) |
|---|---|---|
| 2022-06-19 | 59749.5 | <38.4 |
| 2022-07-10 | 59770.5 | <38.6 |
| 2022-07-18 | 59778.5 | <34.9 |
| Date | MJD | Radio flux density (µJy) |
|---|---|---|
| 2022-06-19 | 59749.5 | <38.4 |
| 2022-07-10 | 59770.5 | <38.6 |
| 2022-07-18 | 59778.5 | <34.9 |
3 DISCUSSION
3.1 X-ray decay profiles
Fig. 2 shows the combined X-ray decay profiles of the 2015 and 2022 outbursts. Simple linear best fits have been applied to the two phases of the decay with a break at 40 d (TJD 57 320 for the 2015 outburst and TJD 52 513 for the 2022 event). This break corresponds to a XRT count rate of ∼1.5 cts s−1, or a luminosity in the SMC of ∼5 × 1037 erg s−1. At this point the decay profile slope completely changes and flattens by a factor of ∼6.5. Other simple models were explored to fit the decay section of the S-CUBED data such as an exponential fit. Such a fit works well for the first section of the data, but after the 40 d point the data indicate a flatter decay profile. Clearly more sophisticated modelling beyond the scope of this paper are required.
There is also a suggestion of an even steeper decay rate during the first 10–15 d of the 2015 outburst, that switch occurring at a luminosity of ∼1.5 × 1038 erg s−1. Unfortunately the 2022 outburst did not reach such high luminosities so we cannot comment on such a steep profile component.
These changes in decay profile rates almost certainly indicate significant changes in the mode of accretion on to the neutron star. Lutovinov et al. (2017) studied the changing decay profile of the 2015 outburst and concluded that there was a change of accretion mode to the propeller mode (Illarionov & Sunyaev 1975) at a luminosity of 4 × 1036 erg s−1 which corresponds to an XRT count rate of ∼0.1 cts s−1 – see Fig. 2. This is at the very end of the outburst, at which point they show that the X-ray flux dropped significantly. There is no doubt that this is the end of the outburst but it is at the limit of the sensitivity of the Swift XRT telescope. Important to their model are the upper limits set immediately after the final positive detection since they help define the shape of the final decay phase. They set the upper limit for any detection as low as 2 × 1034 erg s−1. Unfortunately, the data presented here are less sensitive and are only able to set a limit an order of magnitude higher – see Fig. 1.
Tsygankov et al. (2016) investigated the switching on/off of the propeller effect in two other BeXRBs – 4U 0115+63 and V 0332+53. In both cases, they interpreted the tail end of the outburst decays to indicate an accretion transition around (1−2) × 1036 erg s−1. It is interesting to see the visual difference that presenting the data on a logarithmic scale (e.g. Fig. 1) as compared to a linear scale (e.g. Fig. 2). Plus the difficulties of fitting models that rely on the limiting sensitivity of the telescope – see for example the results presented by Tsygankov et al. (2016) on the source V 0332+53 (their fig. 2). The manner of the data presented here focuses strongly on the times of very significant source detection, and the resulting change in decay rates seen at ∼5 × 1037 erg s−1. This is unlikely to be a switch to the propeller regime since the flux does not drop dramatically, but it certainly indicates that something significant has happened that deserves further modelling investigations beyond the scope of this paper. Finally, it is worth noting that the binary period for this system is 18.4 d with a slight eccentricity of 0.07 (Townsend et al. 2011), so throughout the observational period being discussed here (∼70 d) the distance between the neutron star and the fuel source, the circumstellar disc, is constantly varying. So, inevitably, the accretion environment being experienced by the neutron star is also constantly changing. This factor also needs to be included in any models.
3.2 Optical photometric variability
3.2.1 Long-term UVOT uvw1 and I-band light curves
The evolution of the UVOT uvw1 and OGLE I-band brightness taken over a period of ∼8 yr is shown in the bottom two panels of Fig. 3. The light curves reveal long-term variability that is an indicator of structural changes happening in the inner and outer regions of the disc.
Both the uvw1 and I-band magnitudes generally show correlated changes with respect to the X-ray light curve. This is particularly evident during the decline of both the 2015 and 2022 X-ray outbursts. The I-band light curve shows a sharp spike at the onset of the 2015 X-ray outburst, which suggests that the neutron star distorted the outer parts of the disc which resulted in the matter being accreted, leading to enhanced X-ray activity. This behaviour was discussed by Roy et al. (2022). Similarly, an enhanced spike in the uvw1 light curve is observed at the start of the 2022 X-ray outburst followed by a drop in flux as the X-ray outburst decays. During the decay of the 2015 X-ray outburst, the I-band brightness is seen to decrease at a faster rate than the uvw1. This is unsurprising since the I-band magnitude is a tracer of the more extended, outer regions of the disc compared to the uvw1 magnitude which measures the changes in the inner disc regions. It is often noted that the longer wavelength filters (i.e. the I band) undergo larger amplitude changes compared to those at the shorter wavelengths in BeXBs (e.g. Reig & Fabregat 2015; Coe et al. 2022). This behaviour indicates global disruption of the disc from the outer to inner parts as a result of the interaction of the disc with the neutron star. A noticeable feature of Fig. 3 during the simultaneous uvw1 and I-band observations is the time lag in reaching peak brightness in the two bands between MJD57900 and MJD58100. The innermost region of the disc reaches peak brightness ∼150 d before the outermost parts of the disc, indicative of the time taken for the effects of a mass ejection to reach the outer limits of the disc.
3.2.2 (uvw1 − I) colour variability
The top panel of Fig. 5 shows the evolution of the (uvw1 − I) colour for the period where there are simultaneous uvw1- and I-band observations. The colour is a proxy for the disc temperature, with the blue and red colours indicating hotter and cooler temperatures, respectively. During the period between MJD57300 and MJD57400 the overall (uvw1 − I) colour evolves to lower (bluer) values, indicating an overall temperature increase. This is the period when the overall brightness was undergoing a decline (Fig. 3) during the decay of the 2015 X-ray outburst. This suggests that the outer, cooler parts of the disc were lost due to the neutron star interaction. The overall trend of the (uvw1 − I) colour between MJD57600 and MJD58800 is increasing (the colour is reddening) since this is the period when the disc is increasing in size and there is therefore a larger contribution of cooler temperatures as the outer regions extend outwards.
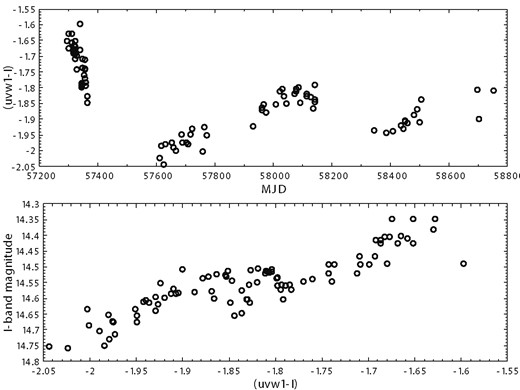
Top panel: The evolution of the (uvw1 − I) − I colour. Bottom panel: (uvw1 − I) − I colour–magnitude diagram.
As circumstellar discs in BeXBs grow in size they generally show an excess flux and their red continuum increases. The reddening of the system with disc growth is attributed to the outer parts of the disc being cooler than the inner parts (Harmanec 1983). When viewed at low/intermediate angles, a correlation between the brightness and colour (i.e. temperature) would be observed. Discs that are viewed at an edge-on orientation (high-inclination angles) would exhibit an anti-correlation between the brightness and colour. In this geometry, as the disc grows in size the overall brightness of the Be disc/star system decreases since the flaring disc blocks out some of the light from the Be star (Harmanec 1983; Rajoelimanana, Charles & Udalski 2011; Reig & Fabregat 2015). Fig. 5 (bottom panel) shows the (uvw1 − I) − I colour–magnitude plot for the optical counterpart of SMC X-2. A strong correlation is observed between the (uvw1 − I) colour and the brightness, which indicates an intermediate-/low-inclination angle of the disc. This is corroborated by the morphology of the H α emission line in Fig. 4, which does not show a shell profile with a central depression that goes below the continuum, as is conventionally seen in highly inclined disc orientations (Reig & Fabregat 2015).
3.3 Optical spectroscopic variability
Using Kepler’s laws, we estimate the semimajor axis and periastron passage of the neutron star, assuming the canonical neutron star mass (MX ∼ 1.4 M⊙) and a Be star mass of M⋆ ∼ 24 M⊙ based on its spectral type (Straizys & Kuriliene 1981). The orbital parameters (P = 18.38 d and ecc = 0.07) derived by Townsend et al. (2011) were used for the calculations. Using these parameters we find values of 86.20 ± 0.10 R⊙ and 80 ± 2 R⊙ for the semimajor axis and periastron passage, respectively.
Using the method of Hanuschik (1989), we estimate the size of the disc from the largest measured equivalent width (13.15 Å), which hopefully has the least contamination from the nearby O7 star. It gives a maximum radius that is larger than the periastron distance of the neutron star orbit (111 ± 7 R⊙).
In Fig. 6, we show the evolution of residual H α emission line spectra. To obtain these, we first created a model emission line by fitting a Voigt function to each spectrum and then subtracted the observed spectra from the model. Since the Voigt model approximates emission from an axisymmetric circumstellar disc, the resultant residual is a measure of deviation from axisymmetry. For the analysis, we only consider observations taken with the PG2300 grating, as the resolution from the PG0900 and PG1800 is insufficient to study the morphological behaviour of the disc. Evidence of deviation from symmetry is seen before the 2022 X-ray outburst, at MJD58002.95, as there is a residual structure that shows up as a peak on the redshifted side of the line. This residual profile is seen to develop into a double-peak profile in the subsequent observations until MJD58395.93. The redshifted peak is seen to develop again during the peak of the 2022 X-ray outburst (MJD59773.12). The subtle variability in the residual profile continued as the outburst declined until MJD59831.93 when a pronounced double-peaked structure is seen that persists until the end of the outburst. This is a possible indicator of a complex non-uniform structure at the outer parts of the disc.
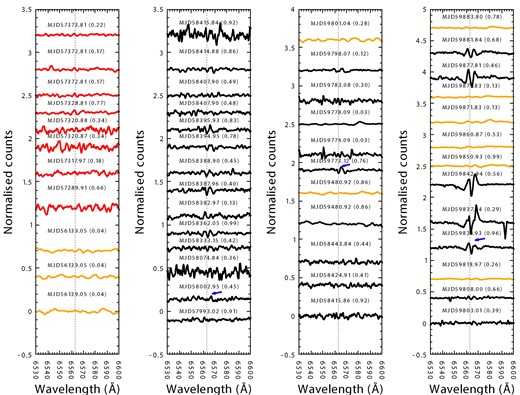
Voigt-subtracted H α residual spectra. The dashed vertical line in each panel represents the rest lab wavelength of the H α line. The modified Julian dates and orbital phases were calculated using the ephemeris from Townsend et al. (2011). The blue arrows indicate the epochs of the onset of the redshifted peaks as discussed in Section 3.3. The different colours indicate the different gratings used for the observations: PG0900 (orange), PG1800 (red), and PG2300 (black).
The semimajor axis can be calculated using the orbital parameters above, which when combined with the projected semimajor axis, aX sin iorbit ∼ 32 R⊙ (Townsend et al. 2011), can be used to estimate the inclination angle (iorbit ∼ 22°) of the plane of the neutron star orbit. The disc radius can be estimated using the double-peaked H α emission from the relation (Huang 1972)
where:
G – gravitational constant
M⋆ – mass of the Be star
idisc – inclination angle of the disc
ΔV – peak separation.
The peak separation, ΔV, is measured by fitting a two-peak Voigt profile to the double-peaked emission lines and using the central wavelengths of the fitted peaks in the calculation. Assuming that the residual component of the disc extends out to the outer edges, up to a radius of around 100 R⊙, using equation (1) and the spread of measured peak separations (∼250−300 km s−1) gives a range of 35–45° for the outer edge inclination angles. This misalignment between the plane of the orbit of the neutron star and the plane of the Be disc can result in the warping of the outer disc edges. This is especially true when the circumstellar disc has grown to a size approaching that of the neutron star orbit.
4 CONCLUSIONS
The source SMC X-2 has shown three major outbursts in the last two decades – in 2000, 2015, and 2022. The one reported here which occurred in 2022 though not quite as X-ray bright as the 2015 event, is, however, well documented at multiple wavelengths. At its peak, it exceeded the traditional Eddington Limit with an X-ray luminosity of over 1038 erg s−1, and triggered supporting optical and UV observations, both spectroscopic and photometric. It is only by integrating all these different multiwavelength data sets together that valuable insights are obtained into both the details of the accretion physics of neutron stars, as well as the dynamic behaviour pattern of the companion Be star that triggered the whole event. The evidence that the Be star triggered the 2022 X-ray outburst is the contemporaneous sharp rise in the UV flux reported here – indicative of a major mass ejection from the star. This is the fuel for accretion on to the neutron star and the resulting X-ray outburst. Such behaviour is well established in other BeXRB systems – see for example Kennea et al. (2020) and Monageng et al. (2019).
The characteristics of the 2015 and 2022 decay profiles are compared revealing clear similarities, including a significant change in the rate of decay believed to be related to differing accretion mechanisms occurring at different times. The H α emission line profiles indicates that the Be disc undergoes complex structural variability during the outburst, with evidence of warping as a result of its interaction with the neutron star. The detailed observations reported here will be important for more sophisticated modelling of such interactions in BeXRB systems, perhaps using smooth particle hydrodynamics (see for example Brown et al. 2019).
ACKNOWLEDGEMENTS
JAK and MW acknowledge support from NASA Grant NAS5-00136. PAE acknowledges UKSA support. LJT was supported by the SALT Foundation and the South African NRF. IMM and DAHB are supported by the South African NRF.
DATA AVAILABILITY
All X-ray data are freely available from the NASA Swift archives. The OGLE optical data in this article will be shared on any reasonable request to Andrzej Udalski of the OGLE project.
Footnotes
Image reduction and analysis facility: iraf.noao.edu.
References
APPENDIX: TABLES OF X-RAY AND OPTICAL OBSERVATIONS
Summary of all Swift XRT detections of SMC X-2 during the 2022 outburst.
| Obs date | Flux | Flux |
|---|---|---|
| MJD | cts s−1 | error |
| 59744.57 | 0.87 | 0.35 |
| 59745.37 | 0.63 | 0.05 |
| 59747.09 | 0.82 | 0.04 |
| 59757.93 | 1.91 | 0.10 |
| 59759.92 | 2.00 | 0.11 |
| 59761.84 | 2.55 | 0.15 |
| 59763.16 | 4.11 | 0.59 |
| 59763.27 | 2.64 | 0.10 |
| 59765.61 | 3.13 | 0.19 |
| 59765.68 | 2.13 | 0.72 |
| 59767.21 | 3.53 | 0.07 |
| 59769.85 | 3.52 | 0.07 |
| 59771.65 | 3.24 | 0.07 |
| 59772.77 | 2.91 | 0.70 |
| 59773.67 | 3.21 | 0.38 |
| 59773.67 | 3.00 | 0.12 |
| 59774.13 | 3.27 | 0.26 |
| 59777.55 | 2.74 | 0.14 |
| 59778.00 | 2.21 | 0.47 |
| 59779.57 | 2.66 | 0.13 |
| 59779.80 | 1.28 | 0.49 |
| 59781.72 | 2.31 | 0.09 |
| 59783.67 | 1.87 | 0.20 |
| 59785.73 | 1.86 | 0.05 |
| 59786.82 | 1.45 | 0.37 |
| 59787.69 | 1.61 | 0.13 |
| 59789.74 | 1.56 | 0.05 |
| 59791.65 | 1.09 | 0.15 |
| 59793.24 | 1.41 | 0.12 |
| 59807.99 | 0.83 | 0.04 |
| 59809.59 | 0.96 | 0.09 |
| 59811.90 | 0.78 | 0.04 |
| 59813.79 | 0.67 | 0.04 |
| 59814.55 | 1.05 | 0.37 |
| 59815.74 | 0.74 | 0.07 |
| 59817.67 | 0.54 | 0.04 |
| 59819.79 | 0.53 | 0.06 |
| 59825.03 | 0.41 | 0.03 |
| 59827.58 | 0.26 | 0.02 |
| 59830.49 | 0.12 | 0.01 |
| 59832.78 | 0.06 | 0.01 |
A log of the SALT observations. The H α equivalent width measurements are recorded and the binary phase determined from the ephemeris in Townsend et al. (2011).
| Date | MJD | EW (Å) | Binary phase | RSS grating |
|---|---|---|---|---|
| 2012-07-31 | 56139.05 | −9.96 ± 0.25 | 0.04 | PG0900 |
| 2012-07-31 | 56139.06 | −10.54 ± 1.0 | 0.04 | PG0900 |
| 2012-07-31 | 56139.06 | −9.83 ± 0.69 | 0.04 | PG0900 |
| 2015-09-24 | 57289.91 | −10.40 ± 0.47 | 0.66 | PG1800 |
| 2015-10-22 | 57317.97 | −10.33 ± 0.28 | 0.18 | PG1800 |
| 2015-10-25 | 57320.87 | −12.51 ± 0.55 | 0.34 | PG1800 |
| 2015-10-25 | 57320.88 | −10.97 ± 0.52 | 0.34 | PG1800 |
| 2015-11-02 | 57328.81 | −9.57 ± 0.59 | 0.77 | PG1800 |
| 2015-12-16 | 57372.81 | −10.67 ± 0.37 | 0.17 | PG1800 |
| 2015-12-16 | 57372.81 | −10.58 ± 0.44 | 0.17 | PG1800 |
| 2015-12-17 | 57373.81 | −10.88 ± 0.32 | 0.22 | PG1800 |
| 2017-08-28 | 57993.02 | −10.29 ± 0.45 | 0.91 | PG2300 |
| 2017-09-06 | 58002.95 | −10.05 ± 0.36 | 0.45 | PG2300 |
| 2017-11-17 | 58074.84 | −10.12 ± 0.73 | 0.36 | PG2300 |
| 2018-08-03 | 58333.15 | −9.74 ± 0.28 | 0.42 | PG2300 |
| 2018-09-01 | 58362.05 | −10.19 ± 0.32 | 0.99 | PG2300 |
| 2018-09-21 | 58382.97 | −9.89 ± 0.56 | 0.13 | PG2300 |
| 2018-09-26 | 58387.96 | −9.65 ± 0.21 | 0.40 | PG2300 |
| 2018-09-27 | 58388.90 | −9.07 ± 0.38 | 0.45 | PG2300 |
| 2018-10-03 | 58394.95 | −9.55 ± 0.29 | 0.78 | PG2300 |
| 2018-10-04 | 58395.93 | −9.11 ± 0.53 | 0.83 | PG2300 |
| 2018-10-16 | 58407.90 | −8.81 ± 0.17 | 0.48 | PG2300 |
| 2018-10-16 | 58407.95 | −8.77 ± 0.56 | 0.49 | PG2300 |
| 2018-10-23 | 58414.88 | −9.79 ± 0.19 | 0.86 | PG2300 |
| 2018-10-24 | 58415.84 | −6.88 ± 0.45 | 0.92 | PG2300 |
| 2018-10-24 | 58415.86 | −8.88 ± 0.18 | 0.92 | PG2300 |
| 2018-11-02 | 58424.91 | −8.29 ± 0.32 | 0.41 | PG2300 |
| 2018-11-21 | 58443.84 | −9.44 ± 0.49 | 0.44 | PG2300 |
| 2021-09-23 | 59480.92 | −13.15 ± 1.16 | 0.86 | PG0900 |
| 2021-09-23 | 59480.92 | −10.95 ± 0.84 | 0.86 | PG0900 |
| 2022-07-13 | 59773.12 | −9.46 ± 0.66 | 0.76 | PG2300 |
| 2022-07-18 | 59778.09 | −10.26 ± 0.45 | 0.03 | PG2300 |
| 2022-07-18 | 59778.12 | −11.72 ± 0.20 | 0.03 | PG2300 |
| 2022-07-22 | 59783.08 | −10.29 ± 0.45 | 0.30 | PG2300 |
| 2022-08-07 | 59798.07 | −10.00 ± 0.36 | 0.12 | PG2300 |
| 2022-08-10 | 59801.04 | −11.75 ± 0.43 | 0.28 | PG0900 |
| 2022-08-12 | 59803.01 | −10.35 ± 0.59 | 0.39 | PG2300 |
| 2022-08-17 | 59808.00 | −9.98 ± 0.42 | 0.66 | PG2300 |
| 2022-08-27 | 59818.97 | −11.47 ± 0.32 | 0.26 | PG0900 |
| 2022-09-09 | 59831.93 | −10.79 ± 0.43 | 0.96 | PG2300 |
| 2022-09-15 | 59837.94 | −8.52 ± 0.38 | 0.29 | PG2300 |
| 2022-09-20 | 59842.94 | −8.40 ± 0.37 | 0.56 | PG2300 |
| 2022-09-28 | 59850.93 | −11.15 ± 0.19 | 0.99 | PG0900 |
| 2022-10-08 | 59860.87 | −11.16 ± 0.41 | 0.53 | PG0900 |
| 2022-10-19 | 59871.83 | −10.80 ± 0.45 | 0.13 | PG0900 |
| 2022-10-19 | 59871.87 | −10.04 ± 0.33 | 0.13 | PG0900 |
| 2022-10-25 | 59877.81 | −4.05 ± 0.02 | 0.46 | PG2300 |
| 2022-10-29 | 59881.84 | −9.32 ± 0.32 | 0.68 | PG2300 |
| 2022-10-31 | 59883.80 | −11.14 ± 0.30 | 0.78 | PG0900 |
| 2022-11-17 | 59900.87 | −7.09 ± 0.38 | 0.71 | HRS |
