-
PDF
- Split View
-
Views
-
Cite
Cite
O M Smirnov, B W Stappers, C Tasse, H L Bester, H Bignall, M A Walker, M Caleb, K M Rajwade, S Buchner, P Woudt, M Ivchenko, L Roth, J E Noordam, F Camilo, The RATT PARROT: serendipitous discovery of a peculiarly scintillating pulsar in MeerKAT imaging observations of the Great Saturn – Jupiter Conjunction of 2020. I. Dynamic imaging and data analysis, Monthly Notices of the Royal Astronomical Society, Volume 528, Issue 4, March 2024, Pages 6517–6537, https://doi.org/10.1093/mnras/stae303
Close - Share Icon Share
ABSTRACT
We report on a radiopolarimetric observation of the Saturn–Jupiter Great Conjunction of 2020 using the MeerKAT L-band system, initially carried out for science verification purposes, which yielded a serendipitous discovery of a pulsar. The radiation belts of Jupiter are very bright and time variable: coupled with the sensitivity of MeerKAT, this necessitated development of dynamic imaging techniques, reported on in this work. We present a deep radio ‘movie’ revealing Jupiter’s rotating magnetosphere, a radio detection of Callisto, and numerous background radio galaxies. We also detect a bright radio transient in close vicinity to Saturn, lasting approximately 45 min. Follow-up deep imaging observations confirmed this as a faint compact variable radio source, and yielded detections of pulsed emission by the commensal MeerTRAP search engine, establishing the object’s nature as a radio emitting neutron star, designated PSR J2009−2026. A further observation combining deep imaging with the PTUSE pulsar backend measured detailed dynamic spectra for the object. While qualitatively consistent with scintillation, the magnitude of the magnification events and the characteristic time–scales are odd. We are tentatively designating this object a pulsar with anomalous refraction recurring on odd time-scales (PARROT). As part of this investigation, we present a pipeline for detection of variable sources in imaging data, with dynamic spectra and light curves as the products, and compare dynamic spectra obtained from visibility data with those yielded by PTUSE. We discuss MeerKAT’s capabilities and prospects for detecting more of such transients and variables.
1 INTRODUCTION
Jupiter has been an iconic object for astronomers from prehistoric times. Galileo’s discovery of the Jovian moons (1610) was a key piece of data for the Copernican heliocentric model. With the discovery of radio emission from the planet by Franklin & Burke (1956), and its modulation by interactions with Io (Bigg 1964), Jupiter became a fascinating target for radio astronomers. The ‘Great’ Conjunction of 2020 placed Saturn and Jupiter in their closest proximity since the time of Galileo. This provided a unique science verification opportunity for MeerKAT, with two radio-emitting planets in the same field of view. Although no new scientific insights were expected, the technical challenge of the observation provided a great opportunity to stress-test both the telescope systems and our software pipelines. In L band, Jupiter is an extremely bright radio source, largely owing to the so-called decametric emission produced by cyclotron processes within its radiation belts (Drake & Hvatum 1959). This emission is also strongly polarized, highly time-variable, and spatially resolved by MeerKAT. Combined with the proper motion of the planets relative to the background sources, this observation therefore represented a dynamic imaging challenge not usually faced by conventional radio interferometric imaging. Presented in movie form, the observations yielded a serendipitous discovery of a transient source in close vicinity to Saturn. Follow-up observations of this source confirmed its nature as a radio emitting neutron star.
With the advent of large field-of-view SKA precursors such as MeerKAT, LOFAR, and ASKAP, the search for transients has become a burgeoning industry. All three of these precursor telescopes are running large science projects that are successfully detecting new transients. Some examples from the ThunderKAT LSP of MeerKAT are reported by Driessen et al. (2020, 2022) and Andersson et al. (2022, 2023), from the ASKAP VAST survey by Wang et al. (2021), and from the LOFAR Transients KP by Stewart et al. (2016). Typically, such discoveries have been either triggered by dedicated transient search engines such as MeerTRAP, or targeted through imaging strategies optimized for transient detection, involving multi-epoch observations of the same field. Examples of these include Caleb et al. (2022) and Hurley-Walker et al. (2022, 2023). Circular polarization, common in pulsars but rare elsewhere in the sky, can also be a powerful pulsar imaging signature (Kaplan et al. 2019). The detection reported here is unusual in having a pulsar announce itself in total intensity imaging so prominently.
MeerKAT’s high instantaneous sensitivity and large FoV make it an ideal instrument for detecting transients and source variability on short time-scales, using conventional synthesis imaging observations, so this discovery is perhaps not as serendipitous as it appears at first sight. One of the aims of this work is to illustrate the capability of the instrument for such transient searches. The final aim of this work is to present data reduction techniques developed for the dynamic imaging observations of Jupiter.
This paper is structured as follows. Section 2 gives an overview of the observations. Section 3 discusses the ‘dynamic imaging’ data reduction for the Great Conjunction observation, which led to the initial PARROT discovery. Section 4 discusses data reduction of the follow-up observations, and the extraction of data products for transient and variability analysis. Section 5 discusses the results from the pulsar timing engine. Section 6 contains a preliminary discussion of the phenomenology of the PARROT. The latter seems highly irregular and meriting of a deeper investigation, which is deferred to a follow-up Paper II. We end the paper with a summary and conclusions.
2 SUMMARY OF OBSERVATIONS
The MeerKAT synthesis imaging observation of the Great Conjunction (schedule block ID 1608538564, proposal ID SSV-20200715-SA-01) commenced a few hours before the closest approach of Jupiter and Saturn, on 2020 December 21 08:18 UTC, using the L-band receiver (856–1712 MHz) in 4096 channel correlator mode, with 8 s integrations. The total duration of the observation was 9.4 h, including calibrator scans. Due to the challenging and experimental nature of the imaging targets (i.e. two planets in the field of view moving relative to the background sources, Jupiter itself being very bright in L band and variable in time), a conservative observing strategy was adopted, including 8 separate 15-min visits to a bandpass calibrator (J1939−6342), and relatively short ‘target’ scans of 14.8 min each, interspersed with 2-min scans on a nearby gain calibrator (J1923−2104). The observation started with a 5-min scan of the polarization calibrator, 3C 286. During the target scans, both the antenna pointing and the correlator phase/delay centre tracked Jupiter. Fig. 1 illustrates the resulting azimuth and elevation tracks.
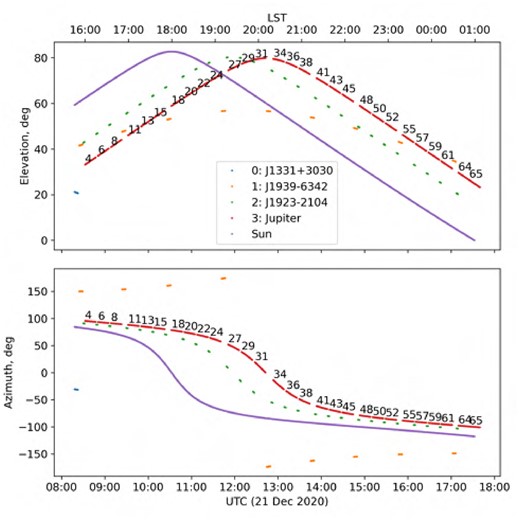
Azimuth and elevation tracks for the Great Conjunction observation. Scans on Jupiter are labelled with the scan number. Scans on the gain, bandpass and polarization calibrators are indicated by the legend. The position of the Sun is plotted as a continuous line.
The dynamic nature of the targets precluded normal static interferometric imaging where a single image of the field would be constructed. Instead, we created a ‘movie’ composed of per-scan images (Fig. 2). This showed that in radio, the Great Conjunction was far more eventful than expected. In addition to two distinctive FR2 (Fanaroff–Riley Class II; Fanaroff & Riley 1974) radio galaxies joining the conjunction, we also observed a new radio transient in close vicinity. The transient manifested itself as a relatively bright (peaking at 5.6 mJy), almost 100 per cent polarized point source, which was detectable in three 15-min snapshot images. Its discovery was thus a serendipitous by-product of doing dynamic imaging.
The Great Conjunction observation, presented in per-scan movie form. Jupiter is at the centre. Bottom left inset: zoom into a 6 arcmin × 6 arcmin region containing Jupiter, Saturn and the PARROT. Bottom right inset: a 1|${_{.}^{\prime}}$|5 × 1|${_{.}^{\prime}}$|5 zoom into Jupiter, with observed B-field vectors overplotted. Top left inset: mean image of 5 consecutive scans (6, 8, 11, 13, 15), image size is 7|${_{.}^{\prime}}$|2 × 7|${_{.}^{\prime}}$|2. Callisto is marked by a circle.
The nature of the transient was difficult to establish from this initial observation, and so several follow-up imaging observations were conducted (Table 1) in both L band and UHF (544–1088 MHz). These also employed 4096-channel mode and 8 s integrations (with the benefit of hindsight, given the pulsar nature of the transient, 2 s integrations would have been more useful, but this did not become obvious until later.) Since by this time Jupiter and Saturn had moved to different positions in the sky, these follow-up observations were conducted in a more conventional imaging mode, with the array tracking the fixed RA/Dec. position of the suspected transient during the 30-min target scans, interspersed with 2-min scans of the gain calibrator (J2007−1016). J1939−6342 was used as the bandpass calibrator, with 3 or 4 scans of 15 min each, and 3C 286 as the polarization calibrator, with one 15-min scan.
Summary of observations. Nd is number of dishes available, SB ID is schedule block ID. Mean flux refers to the flux of the PARROT as measured in the full synthesis image; peak flux refers to peak flux in the light curve. L0 is the original ‘detection observation’ of the Great Conjunction which was imaged dynamically per scan, here ‘rms’ indicates the per-scan (15-min) sensitivity, and the overall mosaic sensitivity, the latter being limited by artefacts associated with Jupiter and the depth of per-scan deconvolution. All other observations were centred on the transient, and ‘rms’ indicates the full synthesis sensitivity as measured at the centre of the field. Peak flux is measured from 8-s light curves. Note that, the UHF observations are confusion-limited. L3 and U1 were carried out simultaneously by splitting MeerKAT into two subarrays. Data capture had to be restarted midway through U3, so it shows up as two schedule blocks that were concatenated and imaged together. Where the MeerTRAP backend was operating commensally, we indicate the pulse detections, if any.
| label . | UTC start . | time, h . | band . | Nd . | SB ID . | |$\mu$|Jy rms . | |$\mu$|Jy peak . | |$\mu$|Jy mean . | commensal observations . |
|---|---|---|---|---|---|---|---|---|---|
| L0 | 2020-Dec-21 08:18 | 9.4 | L | 61 | 1608 538 564 | 20.0/7.0 | 5591 ± 127 | 69 | none |
| L1 | 2021-May-31 20:08 | 10.0 | L | 62 | 1622 491 578 | 3.0 | 517 ± 148 | 66 | MeerTRAP: no pulses |
| L2 | 2021-June-20 19:14 | 10.0 | L | 60 | 1624 216 341 | 2.9 | 750 ± 146 | 86 | MeerTRAP: 5 pulses |
| L3 | 2021-July-27 17:02 | 10.0 | L | 29 | 1627 405 233 | 6.1 | 1250 ± 338 | 57 | none |
| U0 | 2021-July-7 02:07 | 1.3 | UHF | 60 | 1625 623 568 | 10.0 | 422 ± 153 | 102 | MeerTRAP: no pulses |
| U1 | 2021-July-27 17:02 | 10.0 | UHF | 29 | 1627 405 250 | 9.3 | 1145 ± 413 | 138 | none |
| U2 | 2021-Aug-8 16:13 | 11.0 | UHF | 60 | 1628 439 081 | 4.9 | 1348 ± 161 | 125 | MeerTRAP: 12 pulses |
| U3 | 2022-Feb-4 04:11 | 5.9 | UHF | 62 | 1643 947 704 | 4.9 | 1922 ± 187 | 231 | continuous pulsar mode |
| 2022-Feb-4 10:19 | 4.6 | UHF | 61 | 1643 969 937 |
The object was reliably detected in all follow-up observations as a variable point source with an average flux density of 58 ∼ 86 |$\mu$|Jy in L band, and 102 ∼ 231 |$\mu$|Jy in UHF, with its light curves exhibiting occasional peaks (see Section 4). During observation U2, the MeerTRAP transient search backend detected1 several pulses in the coherent beam containing the object. Since the times of these pulses coincided with peaks in the light curves, the pulsar-like nature of the object became evident. A final observation (U3) was therefore performed commensally with the PTUSE pulsar backend operating in search mode. The results of this are discussed further in Section 5.
3 IMAGING THE GREAT CONJUNCTION
The Great Conjunction observation was highly non-standard in that the telescope continuously tracked a moving and variable object (namely, Jupiter) during the target scans – that is, the pointing and phase direction changed with every integration. This type of observation is difficult to concisely express in terms of the Measurement Set definition (Kemball & Wieringa 2000, MSv2), since MSv2 specifies a FIELD subtable containing fixed RA/Dec. coordinates, and a conformant MS would thus require a separate field entry for every integration, while most tools expect a target to be a single field. The observatory adopted a workaround similar to that used by NRAO for planetary observations:2 the FIELD subtable had a single entry specifying the position of Jupiter at the start of the observation, while the correlator phase centre (and computed uvw coordinates) actually tracked the correct position of Jupiter throughout the observing run. Additional steps were then inserted into the processing workflow (see below) to accommodate this.
This complication did not affect the initial reference calibration process (a.k.a. 1GC), since the calibrator scans tracked fixed positions on the sky, as for any conventional imaging observation. We used the caracal pipeline (Józsa et al. 2022) to do the reference calibration. This consisted of the following steps:3
Splitting out the calibrator scans;
RFI flagging on the calibrator data using the tricolour4 package;
Bandpass, fluxscale and gain calibration (via the standard casa tasks);
Polarization leakage calibration using J1939−6342, and crosshand phase calibration using 3C 286 (via the standard casa tasks);
Splitting out the target data and applying calibration solutions, averaging the target data down to 1024 channels;
RFI flagging on the target data using tricolour.
In a normal workflow, this would have been followed by full synthesis imaging and self-calibration of the target data. In this case, it was obviously not practical – full synthesis imaging completely blurred Jupiter’s radiation belts due to the planet’s axial tilt, smeared the image of Saturn due to its relative motion, and produced long smeared tracks for all the background sources, which were drifting past as the telescope tracked Jupiter, at a rate of 0|${_{.}^{\prime\prime}}$|3/min.
The target data were therefore split up by scan, and each (14.8-min) scan was treated as an independent imaging problem. The ‘field’ direction corresponding to the scan was set to the position of Jupiter at the mid-point of the scan. The sky drift over each scan was about ±2|${_{.}^{\prime\prime}}$|2, i.e. a substantial fraction of the synthesized beam (∼6 arcsec). None the less, this was short enough to eventually allow for artefact-free per-scan images (Fig. 3).

MeerKAT image of scan 11 of the Great Conjunction observation. Jupiter is at the centre. The duration of the scan is 14.8 min. Bottom left inset: zoom into a 6 arcmin × 6 arcmin region containing Jupiter, Saturn (‘S’), and the PARROT (‘P’). Bottom right inset: a 1|${_{.}^{\prime}}$|5 × 1|${_{.}^{\prime}}$|5 zoom into Jupiter, with observed B-field vectors overplotted. Top left inset: mean image of 5 consecutive scans (6, 8, 11, 13, 15), image size is 7|${_{.}^{\prime}}$|2 × 7|${_{.}^{\prime}}$|2. Callisto is marked by a circle.
3.1 Per-scan polarized selfcal pipeline
The eventual pipeline consisted of the following steps: Initial imaging in Stokes I was done using the wsclean imager, with a robustness value of 0, using 8 imaging subbands with joint-channel cleaning and 4th-order spectral polynomial fitting. Only single-scale clean was used5 The resulting images (see e.g. Fig. 4, top left) were relatively poor, but proved sufficient to start the self-calibration process. The images were also used to construct a cleaning mask for the subsequent step, using the breizorro.6 masking tool with a threshold of 10σ.
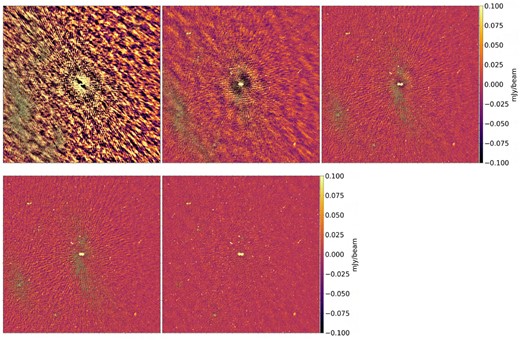
The various stages of self-calibration for scan 11. Top left: initial image after 1GC. Top centre: 1 round of phase & delay selfcal. Top right: 2 rounds of phase & delay selfcal. Bottom left: 3 rounds of phase & delay selfcal. Bottom centre: peeling and 4 rounds of phase & delay selfcal, followed by 3.7-min imaging. Colour scale is locked across all images. Images are 1.˚4 × 1.˚4.
Three rounds of phase & delay selfcal in full Stokes IQUV. Both a per-antenna phase offset and a delay term (with a solution interval of 8 s, i.e. a single integration, Jupiter being bright enough to provide sufficient SNR for this) were solved for at each round, using the cubical7 calibration suite (Kenyon et al. 2018). Stokes IQUV images were generated with wsclean at each round, and fed into breizorro (using a threshold of 6.5σ) to produce a mask for the next round of cleaning. The resulting images from each round, for one scan, are shown in Fig. 4 top centre, top right, and bottom left.
The self-calibration process yielded a number of interesting insights. First, three rounds of selfcal were really necessary for many of the scans to converge to a relatively artefact-free image (though perhaps not for the scan shown in Fig. 4, which conveged at the second round). Secondly, when we restricted ourselves to Stokes I imaging in an early version of the pipeline, self-calibration of some scans failed to converge. We established that this was due to Jupiter’s high degree of linear polarization – the unmodelled Stokes Q signal (in the parallel-hand correlations) was interacting with the independent X/Y delay solutions, resulting in extended imaging artefacts around Jupiter. Our eventual solution was to add a so-called unislope solver to cubical, which solves for independent X/Y phase offsets, but a single common phase slope (i.e. delay) term. This, in combination with full Stokes imaging, allowed selfcal to converge in all scans (strictly speaking, only Stokes IQ imaging is necessary for the selfcal, since the UV signal does not enter the XX and YY correlations, but our final imaging product required full Stokes anyway).
Peeling and selfcal, i.e. direction-dependent calibration using differential gains (Smirnov 2011b), was then required to deal with the brightest off-axis source in the field (see Fig. 4, eight o’clock position), which was contributing radial artefacts to the map. Peeling was performed using cubical, using the following form of the radio interferometer measurement equation (RIME: Smirnov 2011a):
Here, Vpq is the observed 2 × 2 visibility matrix data for the baseline formed by antennas p and q; Mpq is the visibility model for the field (as predicted by wsclean from the last round of selfcal); |$M^{(1)}_{pq}$| is a visibility model for the offending source; Kp is a solvable phase-and-delay Jones term for antenna p, and dEp is a solvable differential gain Jones term (diagonal complex). The solution intervals for the dE term were 16 timeslots and 128 frequency channels. The visibility model |$M^{(1)}_{pq}$| was obtained as follows: we ran wsclean in Stokes I-only mode and generated a source list containing the clean components and their spectral polynomial coefficients (note that, the wsclean source list feature is not available in full-Stokes mode), then selected the components within a small circular region around the offending source, then converted them into visibilities via a direct Fourier transform (DFT) using the crystalball8 tool (Serra, Perkins & Smirnov 2022). The corrected visibilities are then formed up as
where |$\tilde{K}_p$| and |$\tilde{dE}_p$| are the calibration solutions derived by cubical.
Subinterval imaging. Post-peeling, the only prominently remaining artefacts in the maps were radial spokes centred on Jupiter. After some experimentation, we discovered that these could be suppressed by splitting each scan into four subintervals (of 3.7 min duration each), and imaging (in full Stokes) and deconvolving each subinterval independently (wsclean provides an -intervals-out parameter that makes this straightforward). The (inverse variance weighted) mean image over the four subintervals is given by Fig. 4, bottom centre. We conclude that the main reason for the artefacts in the full-scan (14.8 min) images is rapid (minute-time-scale) variability in Jupiter’s radiation belts, which per-subinterval deconvolution is able to account for.
Residual flagging. The residual visibilities from the previous step (formed up by subtracting the model column generated during subinterval imaging from the corrected data column) were passed to tricolour for another round of flagging. This picked up some additional faint RFI in several scans.
Repeeling. The peeling + selfcal step was repeated, using the visibility model generated by the previous imaging step. This model (presumably) accounts for rapid variations in the radiation belts, but does not include the previously peeled source. The RIME for this step is therefore slightly different:
This resulted in a marginal improvement in the maps for some of the scans. In retrospect, it is questionable whether this final improvement is worth the extra processing time.
Final imaging. The subinterval imaging step is repeated once more, using the corrected visibilities from the repeeling step. The inverse variance weighted mean Stokes IQUV images are taken to be the final imaging product for that scan. We also generate residual visibilities once more, since these are needed to generate the dynamic spectra for the PARROT (Section 4.5) later. Note that, in the final version of this workflow (once the PARROT had been discovered), the PARROT was removed from the cleaning mask at this stage, since we wanted its full signal present in the dynamic spectra.
3.2 Pipeline automation
The Great Conjunction observation consisted of 28 target scans. It would have been impractical to rerun the procedure described above for each scan by hand, yet on the other hand, it is sufficiently non-standard to preclude the use of any existing calibration and imaging pipeline. We essentially needed to build a custom pipeline from scratch. For a single one-off observation, this would have been quite the onerous task, especially considering the number of diverse software packages that needed to be made to interact together.
Fortuitously, the processing of this observation coincided with a complete rewrite of the stimela pipeline framework (Makhathini 2018). The process drew on three years of experience of the RATT group with stimela (among other things, it is the underlying technology for the caracal pipeline), as well as on the new challenges posed by the Great Conjunction data reduction. The result, stimela29 (Smirnov et al. in preparation), is proving to be an extremely flexible workflow management framework. It allows complex workflows, such as the one described above, to be expressed in terms of human-readable and succinct YaML recipes, and allows for a high degree of modularity (i.e. support for libraries of recipes and task definitions), composability (recipes may be included as sub-steps of other recipes, YaML configurations can be included in one another), and reproducibility (recipes can be shared and rerun on other compute environments, while the use of container technology can ensure that the exact same versions of all relevant software is used).
The stimela2 recipes for the pipeline described in Section 3.1 can be found on the PARROT project website. The technically inclined reader is urged to look at the YaML files, as the sequence of steps defined therein matches the procedure described above fairly closely, and supplies the finer details omitted in this manuscript.
The two top-level recipes are the single-scan recipe, which can be run as e.g.
$ stimela run jove-pol.yml scan=11
...and the multi-scan recipe (which illustrates Stimela2’s for-loop feature):
$ stimela run jove-pol-loop.yml scan-list=[4,6,8,11]
We leave further details to the stimela2 paper (Smirnov et al. in preparation) and technical documentation. Here, we only wish to stress that the provided recipes form an integral part of this work, and serve both to document the finer details of the calibration and imaging procedure, and to support a fully reproducible data reduction.
3.3 Making movies: Callisto and the PARROT
The output of the per-scan pipeline consists of 4 × 28 FITS images (four Stokes parameters and 28 scans). We have combined these images into an animation showing total intensity, fractional polarization and B-field vectors, as a function of time. The full animation is presented10 in Fig. 2, and a single frame (corresponding to scan 11) is shown in Fig. 3.
The animation illustrates quite a few fascinating aspects of this observation:
There is a very clear transient source lasting for approximately three scans (45 min) just above and to the right of Saturn (also indicated by an arrow in Fig. 3.) Follow-up observations, detailed below, have confirmed sporadic pulsed emission from the source, which suggests that this is a pulsar-type object. To our knowledge, this is the first direct discovery of a pulsar via single-epoch imaging. The discovery is the epitome of serendipity: in a normal multiple-hour synthesis, such a short-duration transient would manifest itself as a mere faint unresolved source: it is only because we made an animation (and the object popped up in such an attention-grabbing time and place) that it became detectable.
At 9.1 h in duration, the observation covers almost a full Jovian day (9.9 h). We can clearly see the effects of Jupiter’s rotating magnetic field: the magnetic axis is tilted ∼10° with respect to the rotation axis (Bloxham et al. 2022), which produces a corresponding tilt-and-rotation in the radiation belts. (It is somewhat fascinating that the Great Conjunction has also brought into conjunction two objects where a rotating magnetic field drives the radio emission, and where substantial circular polarization is present.) This behaviour is consistent with previous detailed observations of the radiation belts (e.g. Sault et al. 1997).
The observed B-field vectors show an overall dipole around Jupiter. The two FR2’s arriving on the scene are weakly polarized within their lobes. The PARROT shows an extremely high degree of both linear and circular polarization. These properties are to be expected for the respective classes of objects, and serve to confirm that our polarization calibration (and pol-selfcal) is yielding sensible results.
Saturn appears rather less spectacular than its bigger cousin (or, indeed, than its own familiar optical manifestation). Its angular extent of 15 arcsec is only three resolution elements across. We do not detect (or resolve) the rings, which is not unexpected, given our resolution and the rings’ low surface brightness at L band (de Pater & Dickel 1991; Zhang et al. 2019). We detect some linear polarization across the planetary disc, on the order of a few per cent. We do not analyse Saturn further in this work.
As a bonus detection, we observe a Galilean moon in radio. Callisto happened to be at a relatively large separation from Jupiter during the observation. It proved too faint to be detected in a single-scan image, but by taking a sliding mean (sliding window in time) of every 5 scans, we can detect a moving compact source at exactly the expected position (highlighted by a circle in the top left inset). Given that Callisto itself is smeared by its motion relative to Jupiter, an accurate flux measurement is non-trivial. A simple measure of peak pixel values gives us a range of 50 ∼ 80 |$\mu$|Jy.
Callisto’s radio emission is expected to be purely thermal in origin. We are not aware of any direct measurements of its flux density at L band, but extrapolation from Butler (2012) and Camarca et al. (2023) suggests a brightness temperature of ∼110 K. The distance to Jupiter at the time of observation (890 · 106 km) and the diameter of Callisto (4820 km) gives us a source extent of 1|${_{.}^{\prime\prime}}$|1. Combining that with the Rayleigh–Jeans approximation, we would predict Callisto to have a flux density of ∼120 |$\mu$|Jy at our effective frequency of 1.28 GHz, which is somewhat discrepant with our peak pixel measurements. However, the latter are bound to be an underestimate due to Callisto’s apparent motion over each scan. Since this is completely tangential to this work, we defer a more accurate measurement as a bookmark for future follow-up.
We do not directly detect the other three Galilean moons in these images. Given the increased level of residual deconvolution artefacts closer to Jupiter, this is not surprising. The four moons have comparable brightness temperatures (Butler 2012). Callisto was the moon with the largest separation at the time. Europa was the second furthest out, but given its smaller size (3120 km), its expected flux density is less than half that of Callisto. Ganymede’s flux density should be comparable to Callisto’s, but it was much closer to Jupiter at the time. Finally, Io is somewhat smaller and fainter, and being the innermost moon, is the most challenging to detect in such observations.
As an alternative way to present this information, we also construct an image-plane mosaic of the per-scan maps (Fig. 5). This becomes a deep map (7 |$\mu$|Jy sensitivity) of the extragalactic sources in the field, with Jupiter and Saturn smeared out by their motion. Note that, the PARROT is clearly detected as a point source in this map.
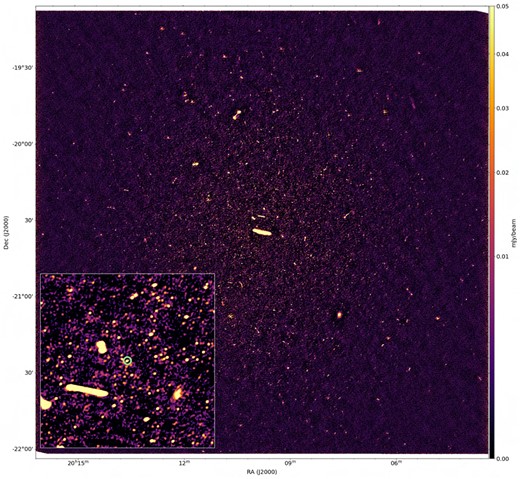
MeerKAT mosaic of the Great Conjunction observation. Per-scan images have been combined into an image–plane mosaic. Jupiter and Saturn are smeared by their motion throughout the observation. The PARROT is circled.
4 IMAGING THE FOLLOW-UP OBSERVATIONS
Since the follow-up observations were conducted in a more conventional imaging mode, and did not feature an exotic source such as Jupiter, the initial data reduction procedures were correspondingly more straightforward. 1GC was performed using caracal, following essentially the same procedure as described in Section 3.
The 1GC-corrected target data were then split out into a separate MS and fed through a custom selfcal pipeline implemented with Stimela2 (recipes available on the project website). Details of this are described below. Finally, light curves of all sources in the field, and dynamic spectra of the PARROT were extracted.
4.1 Imaging considerations for variability and transient studies
The ultimate goal of the pipeline is to extract light curves and dynamic spectra for the PARROT (as well as, ultimately, other field sources, as the scope of our analysis widened.) Broadly speaking, we want to construct the deepest possible (time-averaged) sky model for the field, then subtract it from the visibilities so that we can analyse temporal and spectral variability at each target source position, while minimizing contamination by sidelobes from other sources. (This is not dissimilar to the continuum subtraction problem in spectral line work, with an extra time dimension thrown in.) The reduction strategy we eventually converged on is therefore somewhat different from conventional deep wideband continuum imaging.
First, we want to ensure spectral smoothness in the (subtracted) sky models, to avoid introducing unwanted spectral signatures into the dynamic spectra. Conventional wideband imaging is done over a few (and thus relatively wide) subbands, resulting in a stepwise spectrum for each source in the constructed sky model. The resulting errors tend to average down during regular imaging, but can impart unwanted signatures into the dynamic spectra of interest during sky model subtraction.
Secondly, we want to be very conservative in our treatment of direction-dependent effects (DDEs). On the one hand, untreated DDEs contribute imaging artefacts, which translate to residual signal (with a temporal and spectral signature) when the sky model is subtracted. The best deep continuum images tend to employ DD-calibration in multiple directions to suppress the imaging artefacts. On the other hand, excessive degrees of freedom in DD solutions are known to cause flux suppression of unmodelled sources (Sob et al. 2021), and given that the sky model is constructed from a deep multiple-hour synthesis image, any temporal variability becomes unmodelled by definition. Thus, the same process that yields the best continuum image will artificially suppress variability in the sources of interest! There is obviously a balance to be struck here.
Consider that the spectral signature of DDE-induced artefacts is modulated by the PSF sidelobes, which become increasingly random at increasing distance from the corrupted source. The contribution to the dynamic spectrum at any given target position from an ensemble of corrupted sources (that are imperfectly subtracted due to DDEs) is thus increasingly close to an additional Gaussian noise term, as long as there is no dominant DDE-contributing source nearby. In other words, we can tolerate DDEs from a collection of weaker sources – they will, effectively, just increase the noise level – but we do want to deal with the dominant DDE contributors. Fortunately, there is only one such dominant off-axis source in the field – the same one that needed to be dealt with in the Great Conjunction images (Section 3).
Thirdly, and for similar reasons, we want to be careful that our sky model does not pick up the remaining DDE-induced artefacts. Unmasked blind cleaning is prone to picking up sidelobe peaks, and absorbing some of their flux into the sky model. This can be mitigated via careful clean masking.
Fourthly, since some of the observations were conducted in daytime (with U3 particularly close to the Sun), solar RFI was an issue. We dealt with this by imposing a uv-cut and an inner Tukey taper during imaging, on a per-observation basis. The settings for these were tweaked by examining the uv-amplitude maps produced at stage 4 of the pipeline (see below).
4.2 Pipeline structure
This pipeline consists of the following steps:
Step 1. Initial imaging is done using wsclean. This is done with a robustness value of 0, using 8 imaging subbands for L-band observations (6 for UHF) with joint-channel cleaning and 4th-order spectral polynomial fitting, down to an auto-threshold of 2σ. Only single-scale clean was used. Initial versions of the pipeline employed wsclean’s auto-masking feature, but this tended to absorb sidelobe artefacts into the sky model (see discussion above). After some experimentation, we settled on using static breizorro masks for the final version of the pipeline. The initial cleaning mask for this step was constructed with breizorro using a post-selfcal image produced by a previous pipeline run. The initial image is then flipped into visibilities to bootstrap the selfcal.
Step 2. Delay + phase selfcal is done using quartical11, the successor package to cubical. We used a solution interval of 1 timeslot for the delays and phase offsets. The resulting corrected visibilities are then imaged with wsclean down to a threshold of 1σ, using a breizorro mask constructed from the initial image.
Step 2.1. Sky model smoothing. The 8-band (6-band) sky model derived from the previous step was then upsampled into 256 channels using the smops12 tool, which takes in a set of per-band model images produced by wsclean, and outputs a set of model images at a higher frequency resolution, using polynomial interpolation in frequency at each model pixel. The resulting models are then fed back into wsclean to predict model visibilities at the increased spectral resolution. The value of 256 is a trade-off between smoothness and compute and disc space cost.
Step 2.2. A direction-dependent sky model is constructed for the dominant off-axis source by running crystalball to select and predict relevant clean components from the previous imaging run, exactly as described in Section 3.
Step 3. Peeling & selfcal is then done via quartical, using the spectrally smooth sky model and the DD sky model derived above, with the RIME given by equation (1). quartical produces corrected visibilities with the off-axis source peeled away, using equation (2). These are then fed into wsclean to produce a deep image (Figs 6 and 7). The sky model smoothing step is repeated, and an updated sky model is predicted.
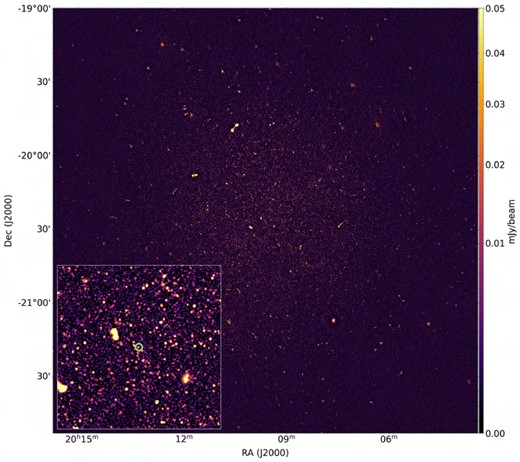
MeerKAT image of a deep follow-up observation in L band (observation L1). Inset shows zoom into the centre of the field. The PARROT is circled.
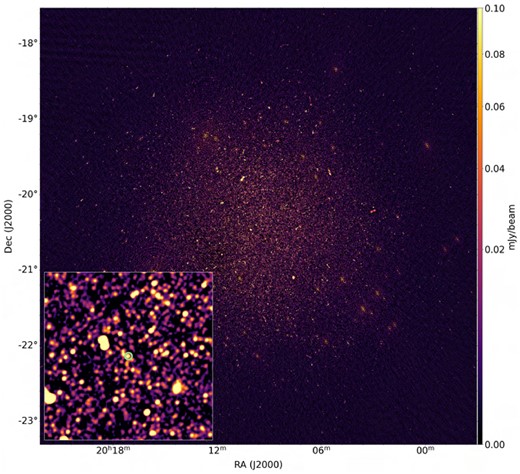
MeerKAT image of a deep follow-up observation in UHF (observation U3). Inset shows zoom into the centre of the field. The PARROT is circled.
Step 4. Peeling & selfcal, second round is done using the updated sky model. Since this no longer contains the off-axis source, the version of the RIME employed is that of equation (3). For this round, we tell quartical to produce corrected residuals – that is, both the smooth sky model and the DD sky model are subtracted from the output visibilities. These are then reimaged with wsclean in order to deconvolve any remaining faint sources not included in the subtracted sky models.
We then Fourier transform the residual image from this last deconvolution round to obtain a map of the residual uv-amplitudes. This is a valuable diagnostic product, since any faint RFI and bad individual baselines show up as bright peaks in the uv-plane. These maps were used to tweak the flagging and imaging settings (see discussion on solar RFI above) before re-running the pipeline.
Step 5. Finalizing the ultimate residuals. The model images from step 4 (containing the remaining faint sources) are converted back to visibilities using wsclean, then subtracted from the corrected residual data generated by step 4. The result is a set of visibilities with our best possible integrated model of the sky subtracted. We call these the ultimate residuals, and use them to construct the light curves and dynamic spectra below. These ultimate residuals contain three components:
Our science signal: the temporal and spectral variation of each source with respect to its subtracted model;
Contaminating signal due to any remaining DDEs, and fainter sources below the deconvolution threshold;
Thermal noise.
We can then proceed to extract light curves and dynamic spectra for each source of interest, using the ultimate residuals. Note that, a time-averaged and spectrally smooth model for each model source has been subtracted at this point, so the resulting light curves and spectra are ‘mean-subtracted’ – that is, they should show only variation around a mean of 0. The subtracted mean signal is contained in the sky models generated by the previous stages, and can be straightforwardly added back to the light curves afterwards, if needed.
4.3 Variability measurements
Our variability analysis was initially tightly focused on the PARROT. However, the need to discriminate between intrinsic variations, scintillation, and instrumental effects widened the scope of our investigation to include other sources in the field.
The two primary data products for analysing variabilty are dynamic spectra and light curves. A dynamic spectrum, S(t, ν), represents the variation in the flux of a source as a function of time and frequency. A light curve, S(t), is just the 1D version of this, representing the temporal variation in flux integrated over a frequency band.
Given the position of a source and a set of ultimate residual visibilities, we can compute the (mean-subtracted) dynamic spectrum S(t, ν) by, essentially, beamforming: phase-shifting all the visibilities to the source position, then computing the (sensitivity-weighted) mean signal across all baselines in every time and frequency bin. A light curve can then be derived by taking a mean of S(t, ν) over the frequency axis. Appropriate smoothing can be applied to suppress noise, and emphasize variability on particular time and frequency scales.
This approach is computationally expensive, scaling as O(Nvis × Nsrc), and is thus only practical for relatively few sources. We will apply it to the PARROT below. An alternative is to leverage the FFT to compute dynamic spectra en masse: essentially, a dirty image cube made from the ultimate residuals, with appropriate time and frequency binning, will contain a dynamic spectrum at every image pixel (an alternative way to think about it is that the beamforming procedure above is mathematically equivalent to what the Fourier transform does at every pixel in the image). This scales as O(Nvis × Npixlog Npix).
The dirty image cube approach is very easy to implement (only a run of the imager is needed, no deconvolution) and is embarrassingly parallel over the time and frequency bins. In practice, it is only limited by considerations of RAM and disc space – 4D images get prohibitively large very quickly. A compromise is to reduce the number of time/frequency bins. At the extreme, using one frequency bin corresponding to the full band, the dirty cube becomes a 3D cube of light curves. This is the approach we take in this work.
4.4 Light curve extraction pipeline
The light curve extraction pipeline is a continuation of the imaging pipeline described in Section 4.2 (and, in fact, forms part of the same Stimela2 recipe). We therefore retain the step numbering from Section 4.2 in what follows.
Step 6. A source catalogue is constructed by running the pybdsf13 tool (Mohan & Rafferty 2015) on the images produced by step 3 of the pipeline. This results on the order of 23 000 source detections in the L-band images, and 42 000 detections in the UHF-band images. Note that, this is a one-off operation that is not required for every pipeline run (or for every observation); it is therefore skipped by default and only invoked by hand. It is, in any case, preferable to have a single catalogue to work with across multiple observations, so as to retain a consistent set of source labels. We also use PyBDSF to get in-band spectral index estimates, needed for the source selection below. This requires power beam-corrected per-subband images. We use the MeerKAT holography beams provided by de Villiers (2023) to correct the step 3 images by the array-average power beam, and make a spectral cube suitable for use by pybdsf.
Although the following steps can (and do) routinely produce light curves for any number of sources, analysing them at such scale is well beyond the scope of this work. A sensible selection is needed to narrow down the sources of interest (in addition to the PARROT). Since only extremely compact sources can be expected to show variability on such time-scales (including due to scintillation), we perform the following selection:
AGN core candidates: unresolved sources with a flat or inverted spectrum. The L-band catalogue produced at step 6 contains 26 sources with an apparent flux of 0.3 mJy or higher, and a spectral index of −0.1 and above.
Compact VLBI sources: the Radio Fundamental Catalogue14 contains 9 sources within our (UHF) field of view. We find bright counterparts to all 9 sources in the UHF catalogue from step 3 (with positions matching to within 0.5 ∼ 4|${_{.}^{\prime\prime}}$|).
A known pulsar, PSR J2012-2029 is approximately 45′ East of the field centre, and has a reported continuum flux density of 1 mJy at 800 MHz (Boyles et al. 2013). Its uncertainty in Ecliptic latitude is probably quite large, because the position is derived from pulse timing and the source has a very low Ecliptic latitude. In the discovery paper (Boyles et al. 2013), the error ellipse was described by its projection onto Equatorial coordinates; in Ecliptic coordinates the uncertainty may be as large as 8 arcsec in latitude, and 4|${_{.}^{\prime\prime}}$|5 in longitude. The UHF catalogue from step 6 contains three sufficiently bright candidates within a 3σ error box.
The selected candidate positions are stored as DS9 region files, for subsequent use by the light curve extraction tool.
Step 7. Light curve cube. High time cadence (HTC) dirty images are constructed from the ultimate residual visibilities, by running wsclean with the -intervals-out parameter set to the number of available integrations. This results in several thousand images (one per each 8s integration) per each observation, which we then stack into a single 3D FITS cube. To keep this cube to a reasonable size, and because oversampling the PSF is not required (as we will not be doing deconvolution), we set the pixel size to 3 times that used in the regular imaging pipeline, that is 2|${_{.}^{\prime\prime}}$|4 for L band and 4|${_{.}^{\prime\prime}}$|8 for UHF, and set the image size to 3072 × 3072.
Step 8. Cube smoothing: the light curve cube is convolved with a Gaussian filter along the time axis, to increase SNR and emphasize time-scales of interest. This step is optional—even the raw 8 s light curves already show interesting events. It can be repeated several times with different kernel widths (σt values) to obtain light curves of various degrees of smoothness.
Step 9. Light curve extraction: a python script loads the (raw or smoothed) cube and the source catalogue, as well as the DS9 regions corresponding to ‘interesting’ sources. For every source in the catalogue (beginning with the PARROT, followed by the ‘interesting’ sources, then the remaining sources in order of decreasing flux), it identifies the pixel position nearest to the source position, and extracts a slice through the time axis at that pixel. It also estimates the image rms in a box surrounding the pixel, at each timeslice, and reports this as the associated error bar. The results are stored to disc, and plotted for inspection. Figures 8 and 9 show the resulting light curves for the PARROT, while Figs 10 and 11 show a sample of light curves for three other sources, from observations U3 and L1 respectively.
4.5 Dynamic spectra extraction
In this section, we briefly describe the mathematical underpinnings of the DynSpecMS tool15, which we used to extract the dynamic spectra. The full approach (taking into account other effects such as the ddes) will be presented in Tasse et al. (in preparation), in the context of the exploitation of the LOFAR Two-Meter Sky Survey (LoTSS) data.
The inverse RIME states that each synthesized beam (in the dirty or residual image) can be viewed as the weighted sum of all visibilities. However, imaging all pixels for all times and frequencies in typical observation would require estimating a large number of pixels Nν × Nt × Npix, making this impractical. To address this issue, we select the few to hundreds directions of interest |$N^{\mathrm{sel}}_{\mathrm{pix}}$| and image |$N\nu \times N_t \times N^{\mathrm{sel}}_{\mathrm{pix}}$| pixels, using a Direct Fourier Transform (DFT). This approach is also used and described by Zic et al. (2019). Conceptually, this is similar to Multi-Object Spectroscopy used in the optical and near-infrared energy domains, where only a limited number of fibers are put in the focal plane of telescopes to acquire spectra. This technique can be extended to dynamic spectro-polarimetry, estimating the Stokes IQUV parameters for all available times and frequencies.
One challenge of image synthesis with interferometric data, as opposed to optical telescopes, is the sparse coverage of the uv-domain. This means that images built by Fourier-transforming the visibilities in the uv-domain must be deconvolved to interpret flux densities. The psf is non-zero even far from its origin, and sources can cross-contaminate each other. This is especially true when synthesizing images over narrow time-frequency domains with poor uv-coverage. This leads to pixels in a given direction in the time-frequency space having contributions from all time-frequency sidelobes of all sources in the field. To address this, we work exclusively with residual visibilities and assume that the majority of sources that exhibit variation in time-frequency space are compact, allowing us to interpret the peak flux in the residual image as a physical integrated flux density. Specifically, the residual corrected visibilities |${\boldsymbol \delta }^{{\bf v}^{c}}_{\mathbf {b}}$| on baseline b↔{pqtν} can be written as
where |${\bf v}^{c}_{\mathbf {b}}$| is the corrected visibility on baseline b, |$k^{\mathbf {s}}_{{\mathbf {b}}}$| is the geometric phase term of the RIME and |$\widehat {{\bf x}_{\mathbf {s}\nu }}$| is the sky model. The polarimetric dynamic spectrum xs, tν in a given direction s is then built as
where |$\overline{k}$| is the complex conjugate of k, and the term |${\boldsymbol \delta }^{{\bf x}}_{\mathbf {s},t\nu }$| is an IQUV-pixel for a given direction s, time t and frequency ν. It is the sum of all visibilities phased in that direction.
The noise in the dynamic spectra has a complex structure and can significantly vary from one (t, ν)-coordinate to another. This is mostly due to (i) the flagging fraction being very different across time and frequency. Assuming a known variance per visibility, we can have a variance dynamic spectra. But (ii) since we work with corrected data, the variance of the individual visibility is hard to estimate, and systematic effects are seen even after correcting for (i). So instead of estimating the variance assuming a statistical model, we directly measure it from the data. To do this, a fixed number of dynamic spectra are synthesized at ‘off’ positions selected at random within a 1° radius, and the variance of the dynamic spectra is measured from these realizations using the Median Absolute Deviation estimator.
Figures 12–15 show the resulting dynamic spectra for the PARROT.
5 MEERTRAP DETECTIONS AND PULSED DYNAMIC SPECTRA
The detection of 5 single pulses during the L2 observation of the transient source established its nature as a radio emitting neutron star, PSR J2009 − 2026 a.k.a. PARROT. The single pulses were detected using the Meer(more) TRansients and Pulsars (MeerTRAP) pipeline (Malenta et al. 2020; Rajwade et al. 2020) which is a real-time commensal mode backend running on MeerKAT observations. Details of how MeerTRAP is used to find Galactic sources are given in Bezuidenhout et al. (2022) and we will only summarize them here. Data from the MeerKAT F-engine (which channelizes the individual receiver data) are collected by the Filterbank BeamFormer User Supplied Equipment (FBFUSE) cluster (Chen et al. 2021) and it forms up to 768 coherent beams (CBs) on the sky, typically using about 40 dishes in the dense core region of MeerKAT. An incoherent beam (IB) is also formed using the sum of the data from up to 64 MeerKAT antennas. The beamformed data are transferred over the network to MeerTRAP’s computer cluster, Transient User Supplied Equipment (TUSE). For these observations, FBFUSE combines the data in frequency and time to give 1024 frequency channels, independent of observing band, and a sampling time of approximately 482 |$\mu$|s in the UHF band and approximately 306 |$\mu$|s in the L band. These data are then searched in real-time over a range of dispersion measures (DM) from 20 pc cm−3 (this lower limits is chosen to minimize the contributions from terrestrial RFI near dispersion measure of zero) up to a maximum of either 2500 pc cm−3 (UHF-band) or 5000 pc cm−3 (L-band) for pulses with S/N greater than seven (for these observations, this was later increased to eight).
MeerTRAP was not included in the original conjunction observation and did not detect any pulses during the L1 run when the transient was first placed at the phase centre. The change to the phase centre means that for this, and all future observations with MeerTRAP, the source would be expected to be seen in the first coherent beam (CB0). The pulses detected in L2 were found to have DMs in the range 21–27 pc cm−3, the reason for the wide range is likely due to the influence of the zero-DM filter (Eatough, Keane & Lyne 2009) that is applied to the data and can sometimes distort low-DM bright pulses. This may have also prevented us from detecting other pulses if the DM dropped below our DM threshold of 20 pc cm−3, or reduced the S/N too much. The pulses were found in an interval of approximately 1100 s with the first at UT 01:18 and the the remaining four in a two minute period centred on UT 01:35 (see Figs 8 and 9). This distribution of pulse arrival times allowed us to establish a period of 1.638(5) s.
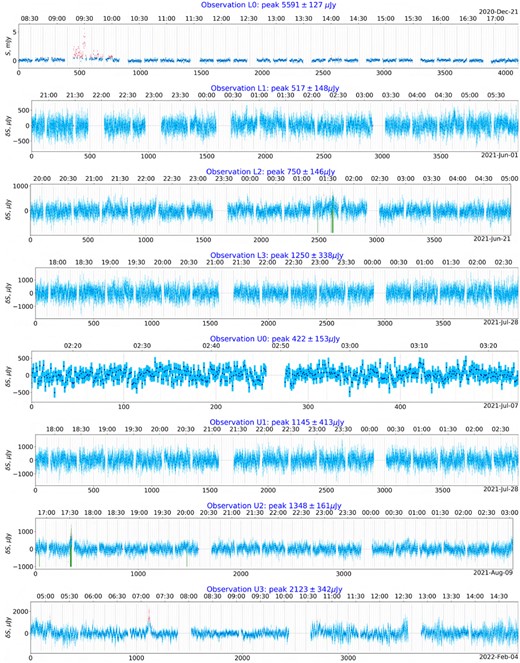
Light curves of the PARROT (mean-subtracted, for all observations except L0) at raw 8 s sampling, from all available observations (Table 1), including error bars. Recall that observations L3 and U1 were carried out simultaneously in split-array mode, and that U0 was short. Four-sigma excursions are highlighted. The vertical bars indicate MeerTRAP pulse detections. Bottom X axis is timeslot number, top X axis is time (UTC).
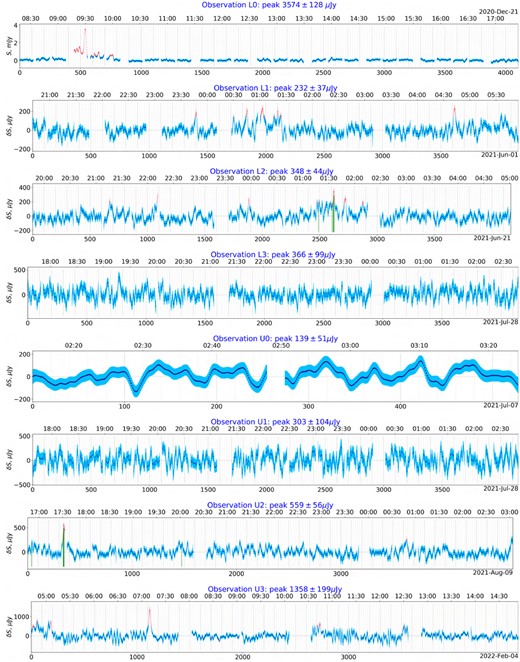
Light curves of the PARROT (mean-subtracted, for all observations except L0) smoothed with a 30 s Gaussian filter, from all available observations (Table 1). Layout and colour coding is as per previous figure.
No pulses were detected during U0, and MeerTRAP did not run during the L3/U1 observation. However, in the U2 observation, a total of 12 pulses were detected in the UHF band. The times of arrival of the pulses are again shown in Figs 8 and 9, with 10 of the 12 pulses happening in a 77 s interval that corresponds to the brightest epoch of U2 most clearly seen in Fig. 9. The lower frequency of the UHF band detections allowed us to determine an improved DM, but it is still constrained by the typical pulse width of around 50 ms and the sometimes double-peaked nature of the pulses. This suggests that the DM is closer to 20 pc cm−3, confirming the suspicion that some pulses may have been missed as they fell below our DM cutoff.
Having confirmed that the source is radio emitting neutron star of some type for observation U3 the PTUSE pulsar backend was used in parallel with the imaging observations. Details of PTUSE and how it is typically used can be found in Bailes et al. (2020). In U3, we used PTUSE in pulsar search mode, this allowed us to study the single pulse behaviour of the source and thereby establish whether there was strong pulse-to-pulse modulation as well as scintillation. The observations were made with 1024 channels across the UHF band and in full polarization mode with a sampling time of 67.7 |$\mu$|s. The MeerKAT B-engine was used to form the beams, which were phased up and polarization calibrated as described in Bailes et al. (2020).
We generated a series of single pulses from the PTUSE data using DSPSR (van Straten & Bailes 2011) and an ephemeris based on the best period and DM determined from the pulses detected during the U2 observation. These data were then manually cleaned of radio-frequency interference (RFI) using the psrzap from PSRCHIVE (Hotan, van Straten & Manchester 2004). To improve the period and DM, we then used PSRCHIVE to form an average profile for each of the 9 on-source scans made during the U3 run. Each average profile was split into 4 sub-bands of equal bandwidth in the UHF frequency range from 544–1088 MHz. We measured arrival times for each sub-band and each scan using pat from PSRCHIVE using an analytic template. The template was made by fitting von Mises functions to the profile with the highest S/N amongst all the scans with paas from PSRCHIVE. A fit to these arrival times using TEMPO2 (Hobbs, Edwards & Manchester 2006) results in the following best-fitting parameters: period=1.63847403(2) s and DM = 21.23(5) pc cm−3 at a reference MJD epoch of 59614.016. The DM corresponds to a distance of either 0.89 kpc (Cordes & Lazio 2002, NE2001) or 1.1 kpc (Yao, Manchester & Wang 2017, YMW16) with the usual uncertainty of between 20–30 per cent.
To compare the on-pulse flux with that seen in the images, we generated dynamic spectra from the PTUSE observations. As a compromise between frequency and time resolution and S/N, we chose to average the data to have 256 frequency sub-bands across the UHF band, giving a frequency resolution of 2.25 MHz and a time resolution of approximately 26 s. Using software developed for scintillation analysis (see e.g. Main et al. 2023), we used the average pulse profile from each of the nine 1-h duration scans to select the on-pulse region. This region was then used to calculate the S/N for each pulse profile to generate the dynamic spectra shown in Fig. 16. The frequency sub-bands that have been removed due to the presence of RFI are shown as single-valued horizontal bands.
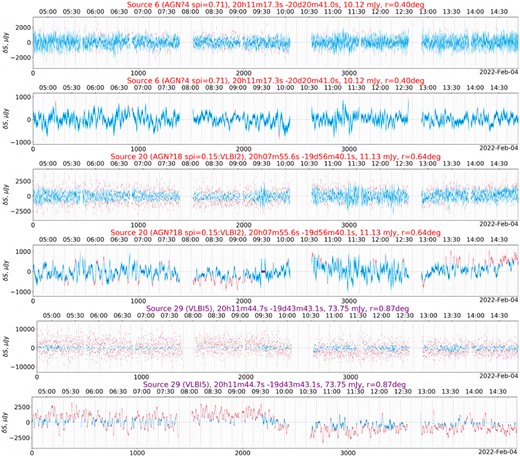
Mean-subtracted light curves for three selected other sources from observation U3. Alternating rows show light curves at the raw 8 s sampling, and smoothed with a 2-min Gaussian filter. Colour coding and axis layout is as per previous figures.
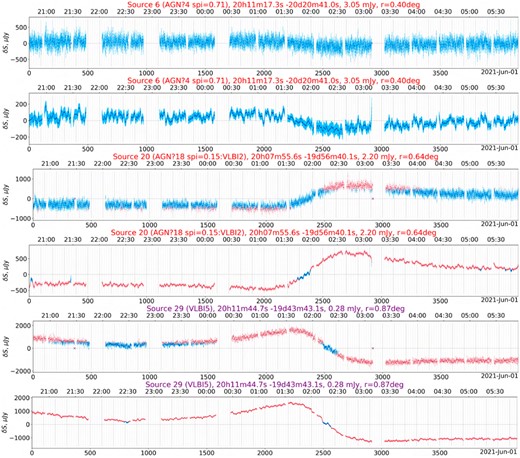
Mean-subtracted light curves from observation L1, for the same sources as in Fig. 10. Alternating rows show light curves at the raw 8 s sampling, and smoothed with a 2-minute Gaussian filter. Colour coding and axis layout is as per previous figures.
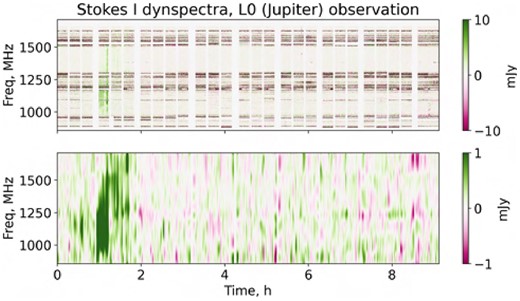
Raw and Gaussian-smoothed dynamic spectra of the PARROT in Stokes I, L0 (Jupiter) observation.
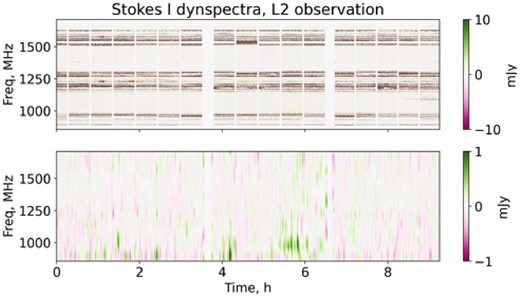
Raw and Gaussian-smoothed mean-subtracted dynamic spectra of the PARROT in Stokes I, L2 observation. Note the several clear detections just before and after 2 h, and between 4 and 6 h.
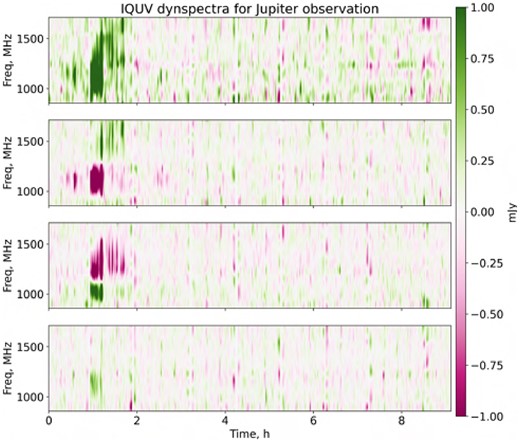
Gaussian-smoothed dynamic spectra of the PARROT in Stokes IQUV, L0 (Jupiter) observation.
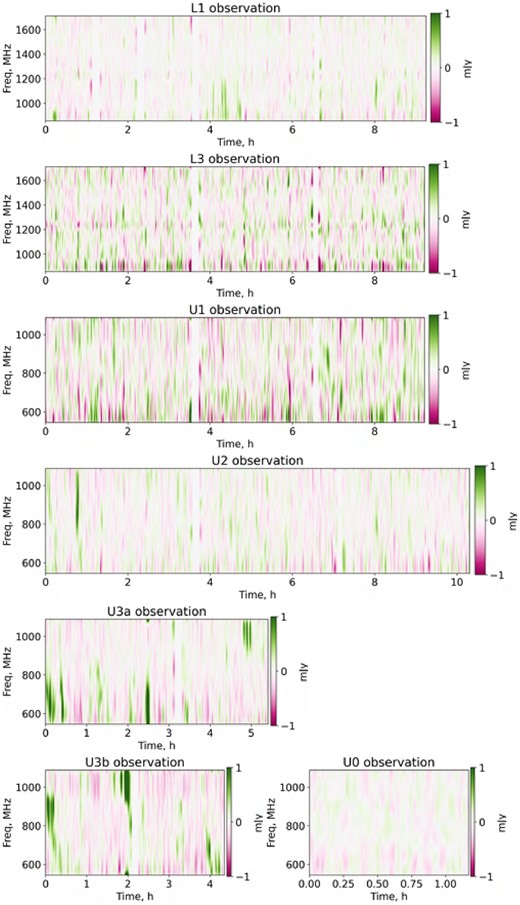
Gaussian-smoothed mean-subtracted dynamic spectra of the PARROT in Stokes I for other follow-up observations. Note detections in L1 and U2 (the latter coincident with a MeerTRAP pulse detection), and many strong detections in U3a/b.
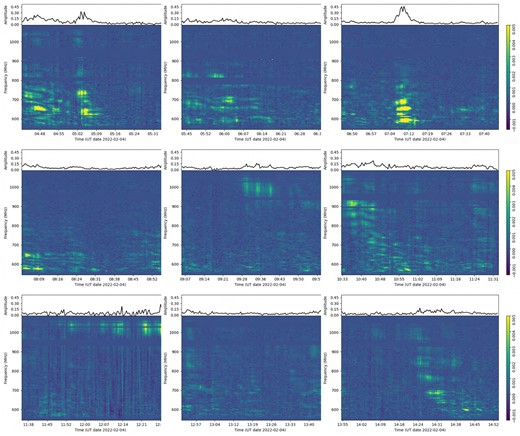
Dynamic spectra for the U3 observation derived from the PTUSE data showing the pulse S/N as a function of time and frequency. Each plot represents one scan on the target of approximately an hour duration. The single-valued blue horizontal bands correspond to where the data have been cleaned of RFI. The data have been averaged to have a bandwidth per channel of 2.125 MHz, and each time sample corresponds to approximately 26 s. The vertical stripes, in most cases, correspond to epochs when the pulsar was likely intrinsically weaker, but there may also be some influence from RFI.
The dynamic spectra are striking for their variety over the approximately 9 h that the observations span. We can see that there is strong frequency evolution in the scintillation bandwidth and duration as well as regions of significantly enhanced flux density, and all of that is seen to change throughout the observation. Inspection of the individual pulses during the bright scintillation epochs reveals that the pulsar shows modulation of factors of a few in intensity superposed on the scintillation. These changes are usually confined to a small, but different from pulse-to-pulse, phase range and only some pulses show these enhancements. We also note that there are some single pulse nulls as well, these are seen as the darker lines in the dynamic spectra (although there is some time domain RFI also present in the data). A full analysis of this single pulse variability will be undertaken in a future paper.
6 DISCUSSION
The dynamic spectra obtained via PTUSE from the U3 observation (Fig. 16) offer the best insights into the nature of the PARROT’s variability. The flux exhibits large variations over small time and frequency scales, and the radio-frequency scaling of the decorrelation bandwidth is similar to that observed in other radio pulsars, where the origin of the narrow-band intensity structure is understood in terms of interference arising from multipath scattering in the interstellar medium. The PTUSE dynamic spectra are broadly consistent with the visibility-derived dynamic spectra (Fig. 15, bottom two plots) but, unsurprisingly, show better SNR and detail. However, with the visibility-derived dynamic spectra, we can make a link to the other observations, and confirm the recurrence of similar bursts.
In the Great Conjunction observation (Figs. 12 and 14), we observe a particularly distinct ‘bursting’ phase lasting about 45 min – three scans – and a ‘quiescent’ phase, corresponding to all the other scans where the source is not detected in the per-scan images. However, if we make an image–plane mosaic of all the quiescent-phase scans, the source is detected with a mean flux density of 69 |$\mu$|Jy (this corresponds to 3.5σ in a per-scan image). This is consistent with the other detections in the L-band follow-up observations (Table 1). Presumably, the PARROT is always ‘on’ and emitting pulses, which are too weak to be detected individually in the quiescent phase, but their integrated flux can be detected as a point source in the images.
The dynamic spectrum of the original detection event (Figs. 12 and 14) shows a complex structure in frequency and time. The main magnification event is relatively wideband, around 500 MHz, but this is preceded and followed by a series of relatively narrower (100–150 MHz) bursts. There is also evidence of rapid (second-time-scale) variability within the bursts. By contrast, all follow-up detections show bursts that are more narrowband, and fainter (Figs. 13 and 15).
The main detection event is almost 100 per cent polarized, with 89 per cent linear and 11 per cent circular polarization. Thanks to the wideband nature of the event, we are able to do a simple fit of rotation measure to the QU signal (see Fig. 17). The estimated value |$\widehat {\mathrm{RM}}$| of the rotation measure RM is obtained by fitting a model ϕ = RM · λ2 + ϕ0 to the measured rotation angle |$\phi _m=0.5\arctan {U/Q}$|. The uncertainty on |$\widehat {\mathrm{RM}}$| is estimated by injecting 100 randomized samples of the noise distribution into the QU dynamic spectra (the noise is estimated independently in Q and U using a median absolute deviation in each channel), and fitting a model to each sample. The resulting mean RM of |$-43\ \mathrm{rad}\, \mathrm{m}^{-2}$| in both the quiescent and bursting phases is consistent with the Galactic RM map of Hutschenreuter et al. (2022), which gives a value of |$-36 \pm 10\ \mathrm{rad}\, \mathrm{m}^{-2}$| in the direction of the PARROT.
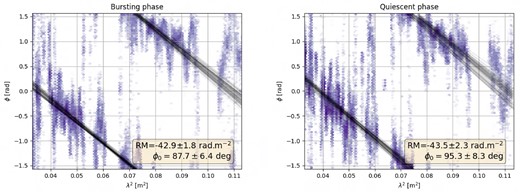
The left and right panels show the measured linear polarization rotation angle as a function of λ2 for the bursting and quiescent phases respectively. Using a single RM component model, we are able to fit the spectral behaviour of the rotation angle, and find similar RM values for both phases. The scattered points represent the random realizations of the rotation angle that we have used to estimate the uncertainties on |$\widehat {\mathrm{RM}}$|.
Broad-band light curves for the PARROT are shown in Figs 8 and 9. The L0 light curve was obtained by collapsing the Stokes I dynamic spectrum along the frequency axis, while for the other observations we used the image-based light curve extraction pipeline described in Section 4.4 (the pipeline assumes an observation with a fixed phase centre, so it was not suitable for use with the L0 observation.)
The cause of the bursts themselves remains unclear; what we observe is very different to any established phenomenology that we are aware of. We therefore defer a thorough analysis to Paper II, and only briefly discuss the ‘suspects’ here. The two crucial features of the bursts are the characteristic time-scales (minutes to tens of minutes) and the very strong brightening (almost a factor of 100 in the original detection event, and factors of 10 seen in all the follow-ups):
Ionospheric scintillation is consistent with the time-scales, but not with the large magnification factors. Furthermore, ionospheric scintillation affects sources up to a substantial angular scale (Thompson, Moran & Swenson 1991), so any unusual ionospheric activity would have imprinted a signature on the many other compact sources in the field, but we observe no such signatures (Figs 10 and 11). We can therefore discount this explanation.
Interplanetary scintillation (IPS) has to be a strong suspect, since the field is in the ecliptic. Furthermore, the observation closest to the Sun (U3) did show the most bursts. However, the characteristic timescale of normal IPS is ∼1 s (Thompson, Moran & Swenson 1991); furthermore, the modulation factors of ≤2 (Zeissig & Lovelace 1972) for normal IPS are two orders of magnitude too small to account for the behaviour of our source. We note that the normal IPS phenomenology is seen in our observations as a secondary effect. With MeerKAT’s wide field-of-view (particularly in UHF) and high sensitivity, we can expect to see plenty of IPS signatures on other compact sources. This is indeed born out by Fig. 10, which shows a sample of three light curves from the U3 observation. These sources show distinct rapid twinkling (up to 25–30 per cent variation) on the shortest measured time-scale of 8 s. On the face of it then, IPS cannot explain the longer-lasting high-magnification events – these would require refractive scattering by some larger, more persistent structures in the solar wind; in turn, such structures might leave an imprint on nearby compact sources. Further analysis of this possibility is deferred to Paper II.
Refractive scattering in the ISM typically manifests on far longer time-scales (days to months), and with low-fractional amplitudes (e.g. Rickett 1990). A small number of radio quasars display the phenomenon of intra-day variability (IDV), which is an unusually rapid form of interstellar scintillation – see, for example, the case of J1819+3845 (Dennett-Thorpe & de Bruyn 2002) and PKS 0405–385 (Kedziora-Chudczer et al. 1997) – that is more closely matched to the time-scales seen in the PARROT. However, the high magnification we observe is unprecedented for IDVs. Similarly, for pulsars, some of which exhibit wide-band variations on a time-scale comparable to the PARROT (e.g. Ridolfi et al. 2022) – the observed fractional amplitude of variations can be large, but nowhere near large enough to explain what we see. Indeed, we know of no instances in the astronomical literature of any type of radio source being magnified to the level displayed by the PARROT. Nor do we expect such large magnifications to arise during propagation through a turbulent medium, where the received electric field has the character of a random phasor sum. Instead, it appears necessary to arrange coherent addition of the electric fields from many Fresnel zones – smooth refracting structures, in other words.
Various types of intrinsic pulse modulation are known (giant pulses; mode-changing; nulling) that could potentially account for the wide range of fluxes that we observe from the PARROT. However, the chromatic nature of the PARROT’s bursts disfavours all intrinsic mechanisms because pulsar emission is very broad-band in character.
The most plausible explanation for what we see is therefore some kind of unusual, strongly refracting structure in either the solar wind, the local environment of the source, or in the intervening ISM. The somewhat extreme nature of the variability favours the former two options. Discriminating between these possibilities requires further analysis of the data, which we defer to a follow-up work. Note that, we also have instrumental variation to contend with – the longer-term trends in off-axis light curves are clearly due to the azimuthal rotation of the primary beam. This is particularly apparent at L-band (Fig. 11). With new primary beam measurements recently made available by de Villiers (2023), these can presumably be disentangled.
In terms of observational phenomenology then, our object seems to be neither quite a conventional pulsar, nor an RRAT. We propose to call it a PARROT (pulsar with anomalous refraction recurring on odd time-scales). The definition of what makes an RRAT varies, but we note that the fluctuations in the single pulse emission seen when the overall pulsar flux is scintillated up, of a factor of a few, over a narrow pulse range, mean that under some conditions of scintillation, such a source could be more likely seen as an RRAT rather than a pulsar. Most explanations for the intermittent nature of RRATs invoke intrinsic mechanisms, and assume that the pulse emission is truly ‘off’ during periods of non-detection. Our imaging observations show that the PARROT is always ‘on’, even when individual pulses fall below the detection threshold. However, if such anomalous refraction events are not unique, then it becomes interesting to speculate whether some known RRATs may, in fact, be PARROT-like objects. MeerKAT’s uniquely high sensitivity and ability to spatially localize such sources using imaging observations may perhaps yield new insights into the nature of RRATs and PARROTs.
What is perhaps useful to discuss at this point is how these results can inform new detection strategies for rapidly varying sources. The original PARROT discovery was the very definition of serendipity – it is very rare for radio astronomers to make ‘movies’ to begin with, and the PARROT went off in a part of the field that happened to be drawing a lot of human attention. However, its light curve signatures (Figs 8 and 9) are very distinct, particularly in the L0, U2, and U3 observations, even if the narrowband magnification events are somewhat diluted by the full-band flux measurements. The dynamic spectra are even more distinct yet again. While dynamic spectra are fairly expensive to process en masse, the light curve extraction pipeline described above is relatively inexpensive computationally, as well as embarrassingly parallel for most operations. It is therefore a reasonable undertaking to extract light curves for all sources detected in any given field routinely, with some sort of automatic detection scheme to flag up ‘interesting’ light curves. Our results suggest that this is a very promising avenue for future discoveries.
7 SUMMARY
We have conducted full-Stokes dynamic imaging observations of the Saturn–Jupiter Great Conjunction of 2020, using the MeerKAT L-band system. Despite the complex nature of the target, we achieved an image rms of 20 |$\mu$|Jy per each 15-min snapshot, and 7 |$\mu$|Jy in a full synthesis. The radiation belts of Jupiter were sufficiently time-variable that independent deconvolution was required per each 4-min interval of data. We have discussed a new dynamic imaging and polarization selfcal pipeline developed specifically to process this observation.
The resolution of MeerKAT at L band does not make Saturn a particularly compelling object of study. Jupiter’s radiation belts, on the other hand, are resolved in quite some detail, and the extremely high instantaneous sensitivity of MeerKAT means that the belts’ dynamics can be probed at time-scales as short as minutes.
Presented in ‘movie’ form, the observations revealed a transient source in close vicinity to Saturn, peaking at 5.6 mJy and remaining detectable for three scans, or 45 min. Dynamic spectra for the transient showed a complex frequency structure, with a series of narrowband ‘bursts’ pre- and post-peak, and a fairly wideband spectrum at the peak. The source was highly polarized, with 89 per cent linear and 11 per cent circular polarization. Linear polarization showed a rotation measure consistent with the Galactic RM in the direction of the source. By imaging a subset of the data excluding the burst, we detected a compact source with a ‘quiescent’ flux of 69 |$\mu$|Jy.
A series of follow-up observations centred on the transient position were then carried out using the L band and UHF systems. In all observations, we detected the source with a mean flux density of 58 ∼ 86 |$\mu$|Jy in L band, and 102 ∼ 231 |$\mu$|Jy in UHF, with its dynamic spectra and light curves exhibiting occasional short-duration magnification events (‘bursts’) of up to × 10. During two of these observations, the MeerTRAP backend detected periodic emission coincident with such a burst, which demonstrated the source to be a new radio pulsar, designated as PSR J2009−2026. An additional UHF-band observation was conducted commensally with the PTUSE backend which allowed us to refine the properties of the pulsar. We also determined that PSR J2009−2026 has a period of 1.6 s and a DM of 21.23(5) pc cm−3 and is thus at a distance of around 1 kpc. Follow-up observations will be required to determine its period-derivative and thus locate it relative to the known pulsar population. Further study is also required to understand the details of the pulse-to-pulse modulation properties of the source. PSR J2009−2026 shows clear signatures of scintillation in its variability; however, the magnification factors it exhibits are unprecedented, and the time-scales on which the scintillation pattern changes are also unusual.
8 CONCLUSIONS
Our observations of Jupiter have reliably detected its radiation belts. While this has not yet yielded any new scientific insights, further analysis of the data no doubt will. It will be particularly interesting to apply the tomographic technique developed by Sault et al. (1997) to make a 3D reconstruction of the belts, since MeerKAT provides slightly better resolution and far superior sensitivity and uv-coverage than the ATCA observations employed by these authors. The results of the self-calibration process discussed in Section 3.1 make it clear that we are detecting variations in the belts on minute time-scales, at high SNR, and that we have also obtained correspondingly deep polarimetry data. This is a rich vein of data awaiting further exploitation.
We have presented a new software pipeline for detection of variable sources and transients in imaging data, with dynamic spectra and light curves as the data products. This showcases MeerKAT’s capabilities for detecting minute-to-hour time-scale transients and variables, with full-band light curves reliably reaching an rms below 150 |$\mu$|Jy at 8 s cadence. Such sensitivity at short time-scales is truly unprecedented, and promises to open up a new window on the transient and variable radio Universe.
Further analysis is required to definitively establish the nature of the observed variability of the PARROT. The chromatic nature of the observed bursts favours some sort of strong refraction (‘lensing’) mechanism, albeit with magnifications that are sometimes extraordinary. There is no reason to think that this object is unique, however, it was only detected thanks to MeerKAT’s superb sensitivity. A targeted search of archival (and new) MeerKAT data can be expected to yield more such objects.
ACKNOWLEDGEMENTS
The MeerKAT telescope is operated by the South African Radio Astronomy Observatory, which is a facility of the National Research Foundation, an agency of the Department of Science and Innovation. We thank Andrew Jameson for assistance with the use of PTUSE and the data reduction. We thank Robert Main for providing the software that was used to produce the dynamic spectra from the PTUSE data. We thank Ana Corrochano Lopez for inspiring the original conjunction observation. We thank the anonymous referee for some very valuable feedback that has substantially improved the paper.
OMS’s research is supported by the South African Research Chairs Initiative of the Department of Science and Technology and National Research Foundation (grant no. 81737).
BWS, MC, KMR, and MeerTRAP acknowledge funding from the European Research Council (ERC) under the European Union’s Horizon 2020 research and innovation programme (grant agreement no. 694745).
PAW acknowledges financial support from the National Research Foundation and the University of Cape Town.
LR appreciates the support from the Swedish National Space Agency through grant 2021–00153.
DATA AVAILABILITY
The raw data underlying this article is publicly available via the SARAO archive17, under proposal ID SSV-20200715-SA-01. Additional data products, such as the conjunction movie, are available via https://doi.org/10.48479/shtp-2015. Processing recipes and scripts are available via https://ratt.center/parrot.
Footnotes
After reprocessing, pulses were also detected in observation L2, but this was not automatically picked up at the time of the observation.
The full configuration file used with caracal is available from the PARROT project page at https://ratt.center/parrot.
Multiscale cleaning did not produce any appreciable improvement in the images at any stage, and was a lot slower, so single-scale was used throughout the pipeline.
See also https://ratt.center/parrot
The value in the parentheses corresponds to the 1-sigma error on the last digit.
References
Author notes
Visiting Scientist at CSIRO Space and Astronomy, 26 Dick Perry Ave, Kensington WA 6151, Australia
ASTRON (retired)


