


ABSTRACT
Electron density profiles obtained from radio occultation experiments reveal significant ionization occurring at altitudes below 120 km in the Venusian ionosphere. The presence of such ionization remains unexplained when considering only major neutrals and the resulting ion chemistry. In this study, we investigate the role of minor neutrals, including NO, O2, C, Ar, H2, and H, in the lower altitudes of the Venusian ionosphere using a one-dimensional photochemical model and Akatsuki radio science measurements. We derive the density of minor neutrals from the profiles of major neutrals. Our analysis demonstrates that NO+ and O|$_2^+$| ions exhibit a notable presence below 140 km. When we incorporate the minor neutrals, electron density increases below 115 km but remains unchanged above this altitude. Specifically, the density of NO+ increases below 125 km, with corresponding reductions in O|$_2^+$|. The increase in NO+ above 115 km can be attributed to the charge-exchange reaction between O|$_2^+$| and NO. However, below 115 km, the photoionization of NO results in a net increase in NO+ and electron density. These findings highlight the significant role played by minor neutrals, particularly below 115 km, in shaping the Venusian ionosphere at low altitudes.
1 INTRODUCTION
Venus, our planetary neighbour, has been extensively explored due to its proximity to both Earth and the Sun. The exploration of Venus began with Mariner 2, a flyby mission in 1962, and has since included a series of missions, including flybys, atmospheric probes, orbiters, and landers, all aimed at uncovering the mysteries of Venus’s surface, atmosphere, and ionosphere. Notable missions in this endeavour include Mariner 5 and Mariner 10, Venera 9, Venera 10, Venera 15, and Venera 16, Pioneer Venus Oribiter (PVO), Venus Express, and Akatsuki. These missions were equipped with various instruments and probes designed to measure a wide range of features on Venus, spanning its surface, atmosphere, and ionosphere. Remote sensing techniques, such as radio occultation, were employed to obtain electron density profiles in the Venusian ionosphere under different solar activity and solar zenith angle conditions. Additionally, in situ probes were utilized to measure ion composition, density, and electric and magnetic fields, along with various other parameters. (Kliore et al. 1967, 1979; Bauer & Hartle 1974; Howard et al. 1974; Fjeldbo et al. 1975; Ivanov-Kholodny et al. 1979; Savich 1981; Brace & Kliore 1991; Russell et al. 2007; Tripathi et al. 2022a, 2023).
The Venus ionosphere results from processes such as photoionization, photoelectron impact ionization, and subsequent charge-exchange reactions. The primary ionospheric peak is typically located at around 140 km with a density of approximately 5 × 10¹¹ m−3. This peak, known as the V2 layer, is primarily composed of O|$_2^+$| ions formed through charge-exchange reactions involving CO|$_2^+$| and atomic oxygen (Cravens et al. 1981; Fox & Sung 2001). Both the peak plasma density (nmV2) and its corresponding height (hmV2) in the V2 layer exhibit variations in response to solar zenith angle and solar activity (Kliore et al. 1979; Kar et al. 1986; Brace & Kliore 1991; Girazian et al. 2015; Gérard et al. 2017, and references therein). However, it deviates from the ideal Chapman layer due to the solar zenith angle-induced variations in neutral density (Tripathi et al. 2023).
Below the V2 layer, at approximately 127 km, there exists a layer with lower electron density. It is known as the V1 layer. Analysis of over 200 electron density profiles from Venus Express radio science experiments revealed the presence of three types of V1 layers, ranging from gradual slope changes to distinct, well-defined layers (Girazian et al. 2015). Additionally, electron density enhancements have been observed below 120 km as well by both Venus Express and Akatsuki missions, now referred to as the V0 layer (Pätzold et al. 2009; Tripathi et al. 2022a). The exact cause of this density enhancement, observed in approximately 15 per cent of cases derived from Akatsuki radio occultation experiments, remains unclear.
Numerous models have provided support and explanations for these observations (Chen & Nagy 1978; Fox & Dalgarno 1979; Nagy et al. 1980; Cravens et al. 1981; Fox 1982, 2007; Nagy, Cravens & Gombosi 1983; Kim et al. 1989; Cravens 1991; Shinagawa et al. 1991; Fox & Kliore 1997; Fox & Sung 2001; Peter et al. 2014; Ambili, Babu & Choudhary 2019; Ambili et al. 2022). The simulation of Venus’s ionosphere was initially undertaken by McElroy (1968), who developed a basic photochemical model based on data from Mariner 5 and Venera 4 missions. A more comprehensive model for the Venus ionosphere was later formulated by Chen & Nagy (1978) and Nagy et al. (1980). This model involved the solution of coupled time-dependent continuity-momentum and energy balance equations for five ion species: CO|$_2^+$|, O|$_2^+$|, O+, He+, and H+. Later Cravens et al. (1981) extended the understanding by developing a photochemical model based on over 14 yr of data from the PVO mission. This model explained variations in the peak height of the ionospheric layer in relation to the solar zenith angle. The influence of solar activity on ion/electron density profiles was subsequently modelled by Kim et al. (1989), Dalgarno & Fox (1994), and Fox & Sung (2001). Fox (2007) further refined our understanding by simulating the behaviour of the Venus ionosphere near the terminator at equatorial latitudes. This simulation considered six major neutrals, seven minor neutrals, and 13 ion species, providing valuable insights into the complex nature of the Venus ionosphere.
Using a simplified model, known as IonA, Peter et al. (2014) conducted a comparative analysis using over 200 electron density profiles obtained from the Venus Express radio science experiment onboard Venus Express. Their findings revealed a significant difference of more than 5 km between the observed peak density height and the model-predicted height, with even greater disparities observed during the low solar activity period. A reason for such disparity was identified with the use of Venus Global Reference Atmospheric Model (Venus-GRAM) as the model input parameter for neutral densities in IonA calculations. Venus-GRAM is valid mostly for high solar activity periods. Ambili et al. (2019) re-examined the role of neutral density and chemical reactions in determining the variations of peak density and the corresponding height at different solar zenith angles. They concluded that the height of the peak plasma density in the Venus ionosphere is primarily controlled by the distribution of neutral density, while chemical reactions predominantly determine the peak plasma density.
Most of the models considered in these studies, except Fox (2007), incorporated major neutrals (CO2, N2, CO, O, N, and He) along with their corresponding ions. These models successfully demonstrated that their chosen chemical mechanisms adequately explained the observed variations in the V2 region, which primarily consists of O|$_2^+$| ions generated through charge-exchange reactions involving CO|$_2^+$| with O and CO2 with O+. The role of minor neutrals in shaping the plasma density distribution within the Venus ionosphere however has remained unexplored so far. Though Fox (2007) included minor neutrals in their model, but did not provide a separate discussion on the significance of minor neutrals’ chemistry in influencing vertical ion/electron profiles. In a later study, Ambili et al. (2022) looked into the relative importance of NO+ and O+ in determining the characteristics of the low-altitude layer, specifically the V1 layer. Their research demonstrated that these ions have comparable densities at lower altitudes and significantly influence the features of the low-altitude ionosphere. These ions primarily originate from charge-exchange reactions involving N|$_2^+$| and CO|$_2^+$| with ambient neutrals, but it is worth noting that direct photoionization of neutrals such as NO and O2 also plays a role. Interestingly, NO and O2 are minor neutrals within the Venus ionosphere, found mostly below 250 km. Additionally, there are a few more minor neutrals, including C, H, H2, and Ar (Fox & Sung 2001; Fox 2007).
In this paper, we have investigated the importance of minor neutrals and the resultant ions in the low-altitude regions of the Venus ionosphere. Using the one-dimensional photochemical model (1D-PCM), the importance of various chemical reactions, and the overall contribution of these neutrals and ions towards the electron density profile are discussed in detail. 1D-PCM results are compared with the electron density profiles, which are retrieved from Akatsuki radio science experiments. In the subsequent sections, we first discuss the derivation of minor neutrals’ density profile from the neutral density model. It is followed by a detailed discussion of the chemistry of the minor neutrals and the subsequent ions at the low-altitude regions using the 1D-PCM calculation and finally the conclusion.
2 OBSERVATION
To compare model results and understand the role of minor neutrals at lower altitudes, we have used electron density profiles retrieved from the Akatsuki radio science experiment. The Akatsuki orbiter, also known as the Venus Climate Orbiter, has been conducting radio occultation measurements of the Venus atmosphere and ionosphere since 2016 using its onboard radio science payload. It generates X-band (8410.932 MHz) radio signals with a stability of the order of 10−12 (Hz/Hz) over a 1–1000 s integration time, achieved through an ultra-stable oscillator (USO; Imamura et al. 2017). The radio occultation signals are tracked and received by ground-based deep space antennas at both the Indian Deep Space Network (IDSN), India, and the Usuda Deep Space Center (UDSC), Japan, either simultaneously or separately.
After eliminating phase variations arising from various sources, including the interplanetary medium, terrestrial atmosphere/ionosphere, and relative velocities between the planet, Earth, and the Sun (Tripathi & Choudhary 2022), the altitude profile of the refractive index is estimated using geometrical optics approximation (Fjeldbo, Kliore & Eshleman 1971). This estimation assumes spherical symmetry and homogeneity in the medium (Kliore et al. 1965; Phinney & Anderson 1968). The refractive index is later converted into the electron density profile of the ionosphere (Rishbeth & Garriott 1969). Using this method, the effective vertical resolution of the observed electron density profile is the radius of the first Fresnel zone, which is about 0.7 km for Akatsuki observations (Imamura et al. 2017; Tripathi & Choudhary 2022). Further details on the inversion algorithm and retrieval techniques for electron density can be found elsewhere (Ambili et al. 2022; Tripathi & Choudhary 2022; Tripathi, Choudhary & Jayalal 2022b; Tripathi et al. 2023).
For this specific study, we focused on a single observation case from 2017 May 26, using Akatsuki radio signals recorded at IDSN, Bangalore. On this particular day, Tripathi et al. (2023) reported the presence of a V0 layer in the Venus ionosphere, situated below 120 km. The maximum density within this layer was measured at 6.6 × 10⁹ m−3, with a corresponding altitude of 111 km. This finding indicates significant ionization occurring even below 120 km. For this specific day, minor neutral density profiles were derived from the VTS-3 major neutral density values. In the subsequent section, we provide a detailed account of the methodology used for deriving these minor neutral density profiles.
3 DERIVATION OF MINOR NEUTRAL DENSITY PROFILES
The density profiles of various neutrals of the Venus atmosphere were taken from VTS-3 neutral density model (Hedin 1983), which includes six major neutrals such as CO2 (carbon dioxide), N2 (nitrogen), CO (carbon monoxide), O (atomic oxygen), N (atomic nitrogen), and He (helium). The VTS-3, which is a global semi-empirical model of the Venus thermosphere, was developed based on the measurements from a Neutral Mass Spectrometer onboard PVO (Hoffman et al. 1980; Hedin 1983). It takes the local time, latitude, solar F10.7, and F10.7A (3-month average) flux of the particular day as inputs and generates the neutral density profiles from 80 to 700 km.
We derived minor neutral density profiles based on the density profiles of major neutrals. Specifically, we calculated density profiles for Ar, O2, H2, and H among six minor neutrals using a consistent method. In this approach, we determined the neutral density values at the bottom boundary, which is at 90 km, by considering the mixing ratio of each species. Then, we calculated the vertical distribution of these neutrals using the scale height, which depends on mass and neutral temperature. For the calculation, we adopted an O2 mixing ratio of 3 × 10⁻³, which was inferred from atomic carbon density profiles obtained from airglow intensities of the C i lines at 165.7 and 156.1 nm, measured by the PVO Ultraviolet Spectrometer (Stewart et al. 1979; Paxton 1985). We used an H2 mixing ratio of 1 × 10⁻⁷ at 150 km, as provided by the model of Yung & DeMore (1982). Above 150 km, the H2 density follows its own scale height distribution, while below 150 km, we assumed the atmosphere’s scale height. Considering the low solar activity in 2017 and 2018, we assumed an H density of 6 × 105 cm−3 at 160 km (Fox & Sung 2001). Above 160 km, the H density follows its own scale height, and below that, similar to H2, we used the atmosphere’s scale length. For both H and H2, the atmosphere’s scale length was considered below approximately 160 km, as eddy diffusion dominates over molecular diffusion up to that altitude. The mixing ratio of 40Ar is very small, approximately 33 ppm at 90 km. Above this altitude, a scale height distribution for Ar density is assumed (von Zahn et al. 1983; Fox & Sung 2001).
The density profiles of minor neutrals, namely NO and C, were calculated based on their local photochemistry. Tables 1 and 2 list all the production and loss reactions for NO and C. We obtained rate constants for these reactions from various sources (Brown & Winkler 1970; McElroy & McConnell 1971; Lee et al. 1978; Midey & Viggiano 1999; Chastaing, Le Picard & Sims 2000; Fox & Sung 2001). The primary reaction that leads to the formation of NO is the reactions of CO2 and O2 with atomic nitrogen, while its main loss mechanism is through reaction with atomic N. At lower altitudes, charge-exchange reactions involving |$\mathrm{ O}_2^+$| also play a significant role. On the other hand, atomic carbon is primarily formed through the photodissociation of CO and the dissociative recombination reaction of CO+. Its primary loss mechanism is through a reaction with O2.
Production and loss reactions of NO.
| Reactions | Rate constant (cm3 s−1) | References |
|---|---|---|
| Production | ||
| N + CO2 → NO + CO | 1.7 × 10⁻¹⁶ | Brown & Winkler (1970) |
| N + O2 → NO + O | |$1.5\times 10^{-14} \, T_\mathrm{ n} \, \mathrm{ e}^{-3270/T_\mathrm{ n}}$| | Baulch et al. (1994) |
| Loss | ||
| N + NO → N2 + O | 3.4 × 10⁻¹¹ | Lee et al. (1978) |
| |${\rm O}_2^+ + {\rm NO} \rightarrow {\rm NO}^+ + {\rm O}_2$| | 4.5 × 10⁻¹⁰ | Midey & Viggiano (1999) |
Note. Tn is the neutral temperature.
Production and loss reactions of C.
| Production reactions | Frequency (s−1)/rate constant (cm3 s−1) | References |
|---|---|---|
| CO + hν → C + O | 8.86 × 10⁻⁷ | Calculated in this studya |
| CO+ + e− → C + O | 1.80 × 10⁻⁷(300/Te)0.55 | Rosén et al. (1998) |
| Loss reactions | Rate constant (cm3 s−1) | References |
| C + CO2 → CO + CO | |$7.62\times 10^{-14}(T_\mathrm{ n}/300.0)^{0.5} \, \mathrm{ e}^{-3480/T_\mathrm{ n}}$| | McElroy & McConnell (1971) |
| C + NO → CN + O | 7.5 × 10⁻¹¹(Tn/300)−0.16 | Chastaing et al. (2000) |
| C + NO → CO + N | 7.5 × 10⁻¹¹(Tn/300)−0.16 | Chastaing et al. (2000) |
| C + O2 → CO + O | 4.9 × 10⁻¹¹(Tn/300)−0.32 | Chastaing et al. (2000) |
Note. Te is the electron temperature.
aProduction frequency values at 200 km altitude.
In Fig. 1, we show the vertical distribution of both major and minor neutral density profiles as of 2017 May 26. Continuous lines represent the major neutrals, while dashed lines represent the minor neutrals. As shown in the figure, below 160 km, CO2 and N2 dominate the neutral composition, and beyond this altitude, atomic oxygen becomes the dominant species. Molecular neutrals, including minor components like NO and O2, prevail below 250 km due to their higher molecular mass and lower scale height (Fox 2007). Above 250 km, atomic neutrals take precedence, including minor constituents such as C and H. It is worth noting that although Ar is an atomic species, its greater mass and very low mixing ratio result in a rapid decrease, rendering it negligible above 250 km. Conversely, H2, despite being a molecular species, can distribute to higher altitudes due to its lower molecular mass.
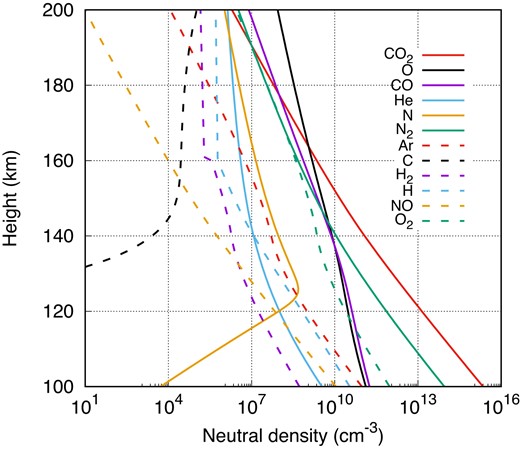
The vertical distribution of major (solid lines) and minor (dashed lines) neutral density.
4 REVISED 1D-PCM
In our in-house developed 1D-PCM, we solve the continuity equation to calculate ion and electron densities. The model incorporates six major neutral species: CO2, N2, CO, O, N, and He, with their density profiles determined using the VTS-3 neutral density model. Additionally, a critical component of the model is the solar flux in the X-ray and extreme ultraviolet (EUV) wavelength ranges, for which we use the SOLAR2000 (S2K) model version v2.38 by Tobiska et al. (2000) in the 5–1050 Å wavelength range, including 17 spectral lines and 23 wavelength bins. We solve the continuity equation under steady-state conditions, focusing on production and loss reactions. Specifically, we consider 11 ions: CO|$_2^{+}$|, CO+, C+, N2+, N+, He+, O+(2D), O+(2P), O+(4S), O|$_{2}^{+}$|, and NO+. As the ionospheric heights below 200 km are in photochemical equilibrium where the production and the loss reactions of the ions control the net electron density, the vertical transport of the plasma due to the eddy diffusion is not incorporated in the model (Fox & Sung 2001; Fox 2007; Ambili et al. 2019). Further details about the model, such as photoionization/dissociative ionization, photoelectron impact ionization reactions, ion–neutral charge-exchange reactions, radiative and dissociative recombination reactions of atomic and molecular ions, corrections for solar flux to account for Venus’s position, and the fundamental methodology for solving the equation, can be found in our earlier papers (Ambili et al. 2019, 2024).
For this study, we made improvements to the 1D-PCM. The updated model now includes the ions generated by six minor neutral species too. The additional minor neutrals are Ar, NO, O2, C, H2, and H. The presence of these minor neutrals, adds three additional ions, namely H+, H|$_2^+$|, and Ar+ in the calculations bringing the total number of ions to 14. The photoionization and photodissociative ionization of C, NO, and O2 lead to the production of ions like C+, NO+, N+, O+, and O|$_2^+$|. These reactions essentially contribute to their ion densities. As discussed in the previous section, the densities of these minor neutrals, particularly NO and O2, however are higher at lower altitudes. It is therefore important to account for the photoionization of these neutrals at lower altitudes in the calculations.
It is worth noting that NO exhibits a photoabsorption/ionization cross-section at the longer wavelength limit of the EUV spectrum, so we need to consider solar flux data up to 1350 Å. The solar flux model S2K provides photon flux in two modes with different spectral resolutions. One mode includes 39 EUV wavelength groups spanning from 18.6 to 29.5 Å and extending to 1000–1050 Å. The other mode offers a 10 Å spectral resolution, ranging from 5 to 107 Å. In a previous study, Ambili et al. (2022) reported that the height of unit optical depth for wavelengths between 5 and 15 Å is above 130 km because only shorter wavelengths can penetrate below 130 km with sufficient intensity after accounting for absorption at higher altitudes. Therefore, to capture radiation below 120 km, it is necessary to consider flux data below 5 Å at a much finer spectral resolution. However, the S2K model starts from a minimum flux of 5 Å with a spectral resolution of 10 Å. So we supplemented our analysis with the Flare Irradiance Spectral Model (FISM) to access data below 5 Å.
The FISM is an empirical model designed to estimate solar irradiance within a wavelength range spanning from 1 to 1900 Å, providing data at an impressive 1 Å resolution. FISM achieves this by utilizing six distinct proxies, each representing various emission lines emitted by the Sun. As a result, FISM can offer precise insights into solar irradiance variations, especially in the vacuum ultraviolet (VUV) spectrum, for any given day. The accuracy of the FISM is further enhanced by integrating measurements of EUV, X-ray ultraviolet (XUV), shorter EUV, and far-ultraviolet (FUV) irradiance. These measurements are sourced from instruments like the Solar EUV Experiment (SEE) aboard NASA’s TIMED satellite, Upper Atmosphere Research Satellite (UARS)-SOLar STellar Irradiance Comparison Experiment (SOLSTICE), and the Solar Radiation and Climate Experiment (SORCE) versions of the X-ray Photometer System (XPS). Comprehensive details about the FISM and its improvements are given in Chamberlin, Woods & Eparvier (2006, 2007). Since the FISM estimates flux at a distance of 1 au, we apply the required corrections to obtain flux values at Venus’s specific position. The specifics of how we make these corrections to account for the distance factor are elaborated upon in our earlier publication (Ambili et al. 2019).
4.1 Reactions involving minor neutrals and the resultant ions
In addition to direct photoionization, photodissociative ionization, and photoelectron impact ionization, the neutrals can also participate in charge-exchange reactions with existing ions, producing additional ions. Table 3 lists the direct photoionization, photodissociative ionization, and photoelectron impact ionization reactions of six minor neutrals. The listed production frequencies for different molecules are at the top of the atmosphere (taken as 200 km in the calculations). To estimate photoionization production frequencies, the standard photoionization equation (Schunk & Nagy 2009; Ambili et al. 2024) was used, assuming a solar zenith angle of 5|${_{.}^{\circ}}$|4 as for the case of 2017 May 26, and the FISM solar flux, corrected for the Venus distance. The neutral density profiles were based on the VTS-3 model (Hedin 1983). Additionally, the photoelectron impact ionization rates were also calculated in this study for the given conditions using the W-value approach (Ambili et al. 2019, 2024). Tables 4, 5, and 6 provide a comprehensive list of all the charge-exchange reactions incorporated into the model when these neutrals are present. As shown in Table 3, both the photoionization and photoelectron impact ionization of Ar result in the production of Ar+ ions. Additionally, charge-exchange reactions involving Ar and N|$_2^+$| lead to the formation of Ar+ ions (Table 5). Similarly, C+ ions are generated through photoionization and photoelectron impact ionization processes. However, charge-exchange reactions involving C produce C+ and CO+ ions at the expense of O+(4S) and O|$_2^+$| ions.
Photoionization, photodissociative ionization, and photoelectron impact ionization reactions involving Ar, C, H, H2, NO, and O2. Production frequency/rate are estimated in this study and the values correspond to 200 km altitude.
| Photoionization | Production frequency (s−1) |
|---|---|
| Ar + h|$\nu \, \rightarrow$| Ar+ + e− | 1.10 × 10⁻⁶ |
| C + h|$\nu \, \rightarrow$| C+ + e− | 1.49 × 10⁻⁶ |
| H + h|$\nu \, \rightarrow$| H+ + e− | 2.12 × 10⁻⁷ |
| H2 + h|$\nu \, \rightarrow$| H|$_2^+$| + e− | 1.75 × 10⁻⁷ |
| H2 + h|$\nu \, \rightarrow$| H+ + H + e− | 1.81 × 10⁻⁸ |
| NO + hν → NO+ + e− | 3.22 × 10⁻⁶ |
| NO + hν → N+ + O + e− | 5.97 × 10⁻⁸ |
| NO + hν → N + O+ + e− | 4.08 × 10⁻⁹ |
| O2 + hν → O|$_2^+$| + e− | 1.11 × 10⁻⁶ |
| O2 + hν → O+ + O + e− | 2.16 × 10⁻⁷ |
| Photoelectron impact ionization | Production rate (cm−3 s−1) |
| Ar + e|$^-\, \rightarrow$| Ar+ + 2e− | 1.45 × 10⁻³ |
| C + e|$^-\, \rightarrow$| C+ + 2e− | 2.06 × 10⁻² |
| H + e|$^-\, \rightarrow$| H+ + 2e− | 4.61 × 10⁻³ |
| H2 + e|$^-\, \rightarrow$| H|$_2^+$| + 2e− | 1.47 × 10⁻³ |
| H2 + e|$^-\, \rightarrow$| H+ + H + 2e− | 2.05 × 10⁻³ |
| NO + e− → NO+ + 2e− | 9.1 × 10⁻⁶ |
| NO + e− →N+ + O + 2e− | 0.43 × 10⁻⁶ |
| NO + e− →N + O+ + 2e− | 2.55 × 10⁻⁸ |
| O2 + e− → O|$_2^+$| + 2e− | 1.18 × 101 |
| O2 + e|$^-\, \rightarrow$| O+ + O + 2e− | 2.65 × 10⁻¹ |
Charge-exchange reactions involving Ar, C, H, and H2.
| Reactions | Rate constant (cm3 s−1) | References |
|---|---|---|
| Ar + N|$_2^+\, \rightarrow$| Ar+ + N2 | 1.10 × 10⁻¹¹e|$^{-2089/T_{\rm i}}$| | Anicich (1993) |
| C + O|$^+(^4{\rm S})\, \rightarrow$| C+ + O | 1 × 10⁻¹⁰ | Fox & Sung (2001) |
| C + O|$_2^+$| → C+ + O2 | 5 × 10⁻¹¹ | Prasad & Huntress (1980) |
| C + O|$_2^+$| → CO+ + O | 5 × 10⁻¹¹ | Prasad & Huntress (1980) |
| H + CO|$_2^+\, \rightarrow$| H+ + CO2 | 2.35 × 10⁻¹¹ | Scott et al. (1997) |
| H + CO|$^+\, \rightarrow$| H+ + CO | 4 × 10⁻¹⁰ | Scott et al. (1997) |
| H + O|$^+(^4{\rm S})\, \rightarrow$| H+ + O | 6.4 × 10⁻¹⁰ | Anicich (1993) |
| H + H|$_2^+\, \rightarrow$| H+ + H2 | 6.4 × 10⁻¹⁰ | Schunk & Nagy (2009) |
| H2 + O|$^+(^2{\rm P})\, \rightarrow$| H+ + OH | 6.93 × 10⁻¹¹ | Fox & Sung (2001) |
| H2 + O|$^+(^2{\rm D})\, \rightarrow$| H+ + OH | 1.5 × 10⁻¹¹ | Fox & Sung (2001) |
| H2 + O|$^+(^2{\rm P})\, \rightarrow$| H+ + O + H | 6.93 × 10⁻¹¹ | Fox & Sung (2001) |
| H2 + O|$^+(^2{\rm D})\, \rightarrow$| H|$_2^+$| + O | 4.5 × 10⁻¹¹ | Fox & Sung (2001) |
| H2 + O|$^+(^2{\rm P})\, \rightarrow$| H|$_2^+$| + O | 3.33 × 10⁻¹⁰ | Fox & Sung (2001) |
| H2 + H|$^+\, \rightarrow$| H|$_2^+$| + H | 1 × 10⁻⁹ | Schunk & Nagy (2009) |
| H2 + Ar+ → H|$_2^+$| + Ar | 1.78 × 10⁻¹¹ | Anicich (1993) |
Charge-exchange reactions involving NO.
| Reactions | Rate constant (cm3 s−1) | References |
|---|---|---|
| CO|$_2^+$| + NO → NO+ + CO2 | 1.23 × 10⁻¹⁰ | Anicich (1993) |
| N|$_2^+$| + NO → N2 + NO+ | 3.6 × 10⁻¹⁰ | Scott et al. (1997) |
| CO+ + NO → NO+ + CO | 4.2 × 10⁻¹⁰ | Anicich (1993) |
| O+ + NO → NO+ + O | 7 × 10|$^{-13} \left(\frac{300}{T_\mathrm{ i}} \right)^{0.66}$| for Ti ≤ 300 K | Dotan & Viggiano (1999) |
| 7|$\times \, 10^{-13} \left(\frac{T_\mathrm{ i}}{300} \right)^{0.66}$| for Ti ≥ 300 K | ||
| O+(2P) + NO → NO+ + O | 1.2 × 10⁻⁹ | Glosik et al. (1978) |
| O+(2D) + NO → NO+ + O | 1.2 × 10⁻⁹ | Glosik et al. (1978) |
| O|$_2^+$| + NO → NO+ + O2 | 4.5 × 10⁻¹⁰ | Midey & Viggiano (1999) |
| N+ + NO → NO+ + N | 4.72 × 10|$^{-10} \left(\frac{300}{T_\mathrm{ i}} \right)^{0.24}$| | Anicich (1993) |
| C+ + NO → NO+ + C | 7.5 × 10|$^{-10} \left(\frac{300}{T_\mathrm{ i}} \right)^{0.2}$| | Anicich (1993), Miller, Wetterskog & Paulson (1984) |
| Ar+ + NO → Ar + NO+ | 3.1 × 10⁻¹⁰ | Anicich (1993) |
| H+ + NO → H + NO+ | 1.9 × 10⁻⁹ | Fehsenfeld & Ferguson (1972) |
Note. |$T_\mathrm{ i}$| is the ion temperature.
Charge-exchange reactions involving O2.
| Reactions | Rate constant (cm3 s−1) | References |
|---|---|---|
| CO|$_2^+$| + O|$_2\, \rightarrow$| CO2 + O|$_2^+$| | |$5.5 \times 10^{-11} \left(\frac{300}{T_\mathrm{ i}} \right)^{0.82}$| for Ti ≤ 1500 K | Anicich (1993) |
| |$1.5 \times 10^{-11} \left(\frac{T_\mathrm{ i}}{1500} \right)^{0.75}$| for Ti ≥ 1500 K | Ferguson et al. (1992) | |
| N|$_2^+$| + O|$_2\, \rightarrow$| O|$_2^+$| + N2 | |$5.1 \times 10^{-11} \left(\frac{300}{T_\mathrm{ i}} \right)^{1.16}$| for Ti ≤ 1000 K | Scott et al. (1997), Dotan et al. (1997) |
| |$1.26 \times 10^{-11} \left(\frac{T_\mathrm{ i}}{300} \right)^{0.67}$| for 1000 ≥ Ti ≤ 2000 K | ||
| 2.39 × 10⁻¹¹ for T|$_\mathrm{ i}\, \ge$| 2000 K | ||
| CO+ + O|$_2\, \rightarrow$| O|$_2^+$| + CO | 1.5 × 10|$^{-10} \left(\frac{300}{T_\mathrm{ i}} \right)^{1.1}$| | Anicich (1993) |
| O+(4S) + O|$_2\, \rightarrow$| O|$_2^+$| + O | |$1.6 \times 10^{-11} \left(\frac{300}{T_\mathrm{ i}} \right)^{0.52}$| for Ti ≤ 900 K | Hierl et al. (1997) |
| |$9 \times 10^{-12} \left(\frac{T_\mathrm{ i}}{900} \right)^{0.92}$| for T|$_\mathrm{ i}\, \ge$| 900 K | ||
| O+(2P) + O|$_2\, \rightarrow$| O|$_2^+$| + O | 1.3 × 10⁻¹⁰ | Glosik et al. (1978) |
| O+(2P) + O|$_2\, \rightarrow$| O+ + O2 | 1.3 × 10⁻¹⁰ | Glosik et al. (1978) |
| O+(2D) + O|$_2\, \rightarrow$| O|$_2^+$| + O | 7 × 10⁻¹⁰ | Johnsen & Biondi (1980) |
| N+ + O|$_2\, \rightarrow$| O|$_2^+$| + N | |$2.02 \times 10^{-10} \left(\frac{300}{T_\mathrm{ i}} \right)^{-0.45}$| for Ti ≤ 1000 K | Dotan et al. (1997), Fox & Sung (2001) |
| 3.49 × 10⁻¹⁰ for Ti ≥ 1000 K | ||
| N+ + O|$_2\, \rightarrow$| O|$_2^+$| + N | |$8.65 \times 10^{-11} \left(\frac{300}{T_\mathrm{ i}} \right)^{-0.45}$| for Ti ≤ 1000 K | Dotan et al. (1997), Fox & Sung (2001) |
| 1.49 × 10⁻¹⁰ for Ti ≥ 1000 K | ||
| N+ + O|$_2\, \rightarrow$| NO+ + O | |$4.32 \times 10^{-11} \left(\frac{300}{T_\mathrm{ i}} \right)^{-0.45}$| for Ti ≤ 1000 K | Dotan et al. (1997), Fox & Sung (2001) |
| 7.47 × 10⁻¹¹ for Ti ≥ 1000 K | ||
| N+ + O|$_2\, \rightarrow$| NO+ + O | |$1.75 \times 10^{-10} \left(\frac{300}{T_\mathrm{ i}} \right)^{-0.45}$| for Ti ≤ 1000 K | Dotan et al. (1997), Fox & Sung (2001) |
| 3.02 × 10⁻¹⁰ for Ti ≥ 1000 K | ||
| N+ + O|$_2\, \rightarrow$| O+ + NO | |$4.34 \times 10^{-11} \left(\frac{300}{T_\mathrm{ i}} \right)^{-0.45}$| for Ti ≤ 1000 K | Dotan et al. (1997), Fox & Sung (2001) |
| 7.53 × 10⁻¹¹ for Ti ≥ 1000 K | ||
| H+ + O|$_2\, \rightarrow$| O|$_2^+$| + H | 1.17 × 10⁻⁹ | Huntress Kim & Theard (1974) |
| Ar+ + O|$_2\, \rightarrow$| O|$_2^+$| + Ar | |$4.9 \times 10^{-11} \left(\frac{300}{T_\mathrm{ i}} \right)^{0.78}$| for Ti ≤ 900 K | Midey & Viggiano (1998) |
| |$2.08 \times 10^{-11} \left(\frac{T_\mathrm{ i}}{900} \right)^{1.65}$| for T|$_\mathrm{ i}\, \ge$| 900 K | ||
| He+ + O|$_2\, \rightarrow$| O+ + O + He | 2.39 × 10⁻¹¹ | Bischof & Linder (1986) |
| He+ + O|$_2\, \rightarrow$| O|$_2^+$| + He | 9.2 × 10⁻¹² | Fox & Sung (2001) |
| He+ + O|$_2\, \rightarrow$| O+(2D) + O + He | 2.37 × 10⁻¹⁰ | Gerlich (1992) |
| He+ + O|$_2\, \rightarrow$| O+(2P) + O + He | 6.04 × 10⁻¹⁰ | Fox & Sung (2001) |
| He+ + O|$_2\, \rightarrow$| O+ + O + He | 4.6 × 10⁻¹¹ | Fox & Sung (2001) |
| C+ + O|$_2\, \rightarrow$| CO+ + O | 3.48 × 10⁻¹⁰ | Miller et al. (1984) |
| C+ + O|$_2\, \rightarrow$| CO + O+ | 5.22 × 10⁻¹⁰ | Anicich (1993) |
In the case of H, H+ ions are produced through a combination of photoionization, photoelectron impact ionization, and charge-exchange reactions involving CO|$_2^+$|, CO+, O+(4S), and H|$_2^+$|. When H2 undergoes photoionization, it leads to the generation of H|$_2^+$| ions, while photodissociative ionization results in H+ ions. The charge-exchange reactions of H2 can produce either H+ or H|$_2^+$| ions by interacting with O+(2D), O+(2P), H+, and Ar+ ions.
We conducted a detailed study on the chemical reactions involving NO and O2 in the Venus ionosphere to gain a deeper understanding of how they impact ion and electron density profiles. When NO is present in the Venus ionosphere, it can participate in various chemical processes such as photoionization, photodissociative ionization, photoelectron impact ionization, and charge-exchange reactions with other ions. These reactions generate NO+, N+, and O+ ions. Details of these reactions can be found in Tables 3 and 5. It is important to note that N+ and O+ ions are produced exclusively through photodissociative ionization and photoelectron impact ionization, while NO+ ions are formed through a combination of photoionization, photoelectron impact ionization, and charge-exchange reactions. Similarly, Tables 3 and 6 provide an overview of the reactions involving O2. Photoionization, photodissociative ionization, and photoelectron impact ionization of O2 yield O|$_2^+$| and O+ ions. O2 also partakes in charge-exchange reactions with different neutrals, leading to the production of O|$_2^+$| and other ions.
When an ion engages in charge exchange with a minor neutral, it results in the creation of a new ion too. Therefore, the same reaction contributes to both the loss of one ion and the production of another. We accounted for these reactions in the 1D-PCM while calculating both production and loss reactions. Additionally, we consider the loss reactions of the newly generated ions (Ar+, H+, and H|$_2^+$|) and the supplementary reactions involving NO+ and O|$_2^+$|. For a comprehensive list of loss reactions for Ar+, H+, and H|$_2^+$| ions, refer to Table 7.
Loss reactions of Ar+, H|$_2^+$|, and H+.
| Reactions | Rate constant (cm3 s−1) | References |
|---|---|---|
| Ar+ + CO|$_2\, \rightarrow$| Ar + CO2+ | 5 × 10⁻¹⁰ for Ti ≤ 700 K | Dotan, Midey & Viggiano (1999) |
| 5 × 10⁻¹⁰ (|$\frac{700}{T_{\rm i}}$|) for T|$_{\rm i}\, \ge$| 700 K | ||
| Ar+ + N|$_2\, \rightarrow$| Ar + N|$_2^+$| | |$1.1 \times 10^{-11} \left(\frac{T_{\rm i}}{300} \right)^{1.13}$| | Anicich (1993), Dotan & Lindinger (1982) |
| Ar+ + O|$_2\, \rightarrow$| Ar + O|$_2^+$| | |$4.9 \times 10^{-11} \left(\frac{300}{T_{\rm i}} \right)^{0.78}$| for T|$_{\rm i}\, \le$| 900 K | Midey & Viggiano (1998) |
| |$2.08 \times 10^{-11} \left(\frac{T_{\rm i}}{900} \right)^{1.65}$| for T|$_{\rm i}\, \ge$| 900 K | ||
| Ar+ + CO→ Ar + CO+ | |$3.7 \times 10^{-11} \left(\frac{300}{T_{\rm i}} \right)^{0.43}$| for T|$_{\rm i}\, \le$| 900 K | Midey & Viggiano (1998) |
| |$2.3 \times 10^{-11} \left(\frac{T_{\rm i}}{900} \right)$| for T|$_{\rm i}\, \ge$| 900 K | ||
| Ar+ + NO→ Ar + NO+ | 3.1 × 10⁻¹⁰ | Anicich (1993) |
| Ar+ + H|$_2\, \rightarrow$| Ar + H|$_2^+$| | 1.78 × 10⁻¹¹ | Anicich (1993) |
| Ar+ + e|$^-\, \rightarrow$| Ar + hν | |$4.8 \times 10^{-12} \left(\frac{250}{T_\mathrm{ e}} \right)^{0.7}$| | Schunk & Nagy (2009) |
| H|$_2^+$| + e|$^-\, \rightarrow$| H2 + hν | 1.6 × 10|$^{-8} \left(\frac{300}{T_\mathrm{ e}} \right)^{0.43}$| | Schunk & Nagy (2009) |
| H|$_2^+$| + H → H+ + H2 | 6.4 × 10⁻¹⁰ | Schunk & Nagy (2009) |
| H+ + O → H + O+ | 3.75 × 10⁻¹⁰ | |
| H+ + O|$_2\, \rightarrow$| H + O|$_2^+$| | 1.17 × 10⁻⁹ | Huntress et al. (1974) |
| H+ + NO → H + NO+ | 1.9 × 10⁻⁹ | Fehsenfeld & Ferguson (1972) |
| H+ + H|$_2\, \rightarrow$| H|$_2^+$| + H | 1 × 10⁻⁹ | Schunk & Nagy (2009) |
| H+ + e|$^-\, \rightarrow$| H + hν | |$3.5 \times 10^{-12} \left(\frac{300}{T_\mathrm{ e}} \right)^{0.7}$| | Schunk & Nagy (2009) |
In a previous study by Ambili et al. (2022), the production and loss reactions of NO+ were estimated when only major neutrals were considered. However, when NO is introduced into the system, it leads to additional reactions that generate NO+. All the reactions responsible for this additional production of NO+ can be found in Tables 3 and 5. Notably, despite the multiple reactions that yield NO+, the ion experiences only one loss process, which is the dissociative recombination reaction. Regarding O|$_2^+$|, apart from the loss reactions discussed in the work of Ambili et al. (2022), the inclusion of minor neutrals introduces three new loss reactions for O|$_2^+$|. These additional loss reactions are as follows:
O|$_2^+$| + C → CO+ + O; |$5 \times 10^{-11}\, \mathrm{ cm}^3 \, \mathrm{ s}^{-1},$|
O|$_2^+$| + C → C+ + O2; |$5 \times 10^{-11}\, \mathrm{ cm}^3 \, \mathrm{ s}^{-1},$|
O|$_2^+$| + NO → NO+ + O2; |$4.5 \times 10^{-10}\, \mathrm{ cm}^3 \, \mathrm{ s}^{-1}.$|
Among these three reactions, the one involving NO prevails due to its effectiveness at lower altitudes. This is primarily attributed to the high density of NO compared to C, coupled with a significantly higher rate constant for this particular reaction. We have integrated all the aforementioned reactions into the 1D-PCM to compute the density profiles of 14 ions, ultimately determining the resulting electron density.
5 RESULTS
We utilized the 1D-PCM to calculate electron and ion density profiles both with and without the inclusion of minor neutrals. Fig. 2 provides a detailed comparison between the simulated and observed electron density profiles. In this figure, the thick black dotted line at 1.5 × 10⁹ m−3 represents the minimum detectable limit of the Akatsuki radio occultation experiment. The left panel of the figure (Fig. 2a) shows the comparison of electron density profiles derived from the Akatsuki radio occultation results, the 1D-PCM model considers major neutrals alone (indicated by the green line), and the 1D-PCM model adds additional minor neutrals (represented by the red line). The figure clearly shows that the 1D-PCM performs well in reproducing the V2 layer peak density (nmV2) and its corresponding height (hmV2), showing minimal deviations. However, the model exhibits discrepancies below hmV2, particularly in the vicinity of the V1 peak and below 120 km, where the observed profile displays a density enhancement. As reported in Ambili et al. (2022), the S2K model underestimates soft X-rays by a factor of 2–4, and as a result, the model struggles to capture the V1 peak without increasing the solar flux in the soft X-ray wavelength range. Similar challenges are encountered when using the FISM within the 1D-PCM framework, as it also underestimates soft X-ray fluxes. Consequently, the model simulations underestimate both the V1 peak and ionization below 120 km.
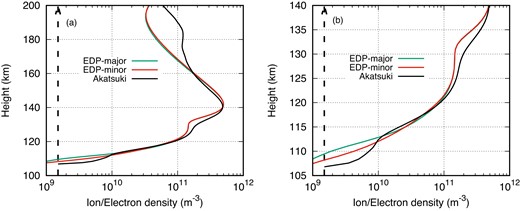
Comparison of electron density profile (EDP) with only major neutrals and minor neutrals with the Akatsuki observation (a) between 100 and 200 km, and (b) its zoomed portion between 105 and 140 km.
The model used in this study to replicate the electron density in the Venus ionosphere has some shortcomings. One of them is its inability to reproduce the peak-like structure observed at around 180 km, called the V3 region. This could be due to the assumption made about the electron temperature in the model, which assumes that the electron and neutral temperatures remain constant up to 200 km. However, the electron and neutral temperatures may vary, especially beyond the V2 peak, as suggested by Fox (2007). In this study, since our primary focus is to understand the impact of minor neutrals on the simulated electron density in the lower regions of the Venus ionosphere and not to address the discrepancy in reproducing electron density below 140 km by enhancing the soft X-ray flux or by adjusting electron temperature above 160 km, so we do not address those shortcomings further. None the less, it is worth mentioning that the 1D-PCM aligns more closely with observations when we incorporate the electron temperature derived from the analytical expression (not shown).
One feature that is quite visible after incorporating minor neutrals in calculations is the density enhancement below 115 km. The zoomed portion of the left panel of Fig. 2, between 105 and 140 km, is shown as the right panel of this figure. Though the electron density remains unchanged elsewhere after including the minor neutrals, there is a noteworthy enhancement in the electron density below 115 km. The model however is still not able to capture the feature enhancements in the electron density associated with the V0 layer. This could be due to underestimation of soft X-ray flux in the FISM. Further discussions on the origin of the V0 layer is beyond the scope of this presentation. However, we may note that the enhancement in the electron density below 115 km is quite evident after the inclusion of minor neutrals in the calculation.
To understand the ion density and their relative variations, in Figs 3(a) and (b) we show the individual ion density profiles under the two conditions, namely (a) with only major neutrals, and (b) after adding minor neutrals. As shown in the top-left panel (Fig. 3a), when only major neutrals are considered, there were 11 ions, out of which O|$_2^+$| is the major ion near the V2 peak and NO+ is the second major ion at the lower altitudes. After including the minor neutrals, shown in the top-right panel of the figure (Fig. 3b) there are three additional ions (H+, H|$_2^+$|, and Ar+) and the total number of ions increases to 14. It may be noted that though the addition of six minor neutrals leads to only three additional ions, the three neutrals (C, NO, and O2) act as an additional photoionization source for the existing ions (C+, NO+, and O|$_2^+$|), those were otherwise getting produced by charge-exchange reactions of the ions with the background. Compared to NO+ and O|$_2^+$|, the contribution of other ions towards the total electron density is very minimal.
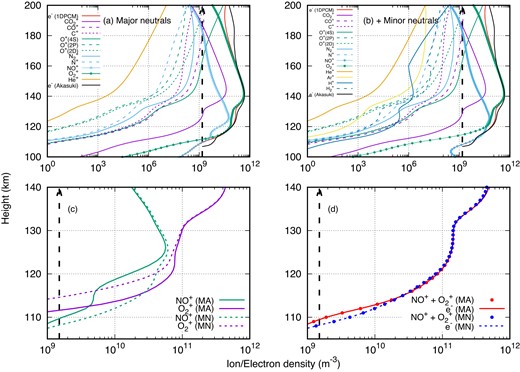
(a) Ion density profiles if only major neutrals are considered; (b) ion density profiles after adding additional minor neutrals; (c) NO+ and O|$_2^+$| densities with only major neutrals (solid lines) and after adding minor neutrals (dashed lines), and (d) sum of NO+ and O|$_2^+$| and the electron density with minors (MN) and major (MA) neutrals.
The lower panels of Fig. 3 demonstrate the relative variations of NO+ and O|$_2^+$| after incorporating minor neutrals. The solid lines represent the ion densities in the presence of major neutrals (MA), while the dotted lines are for the case after adding additional minor neutrals (MN). As previously reported by Ambili et al. (2022), the sum of NO+ and O|$_2^+$| (dots) reproduces the total electron density (shown in the bottom-right panel of Fig. 3). It shows that these two ions are the main contributors to the electron density at lower altitudes. It may also be noted that after including the minor neutrals, although the densities of NO+ and O|$_2^+$| ions change, the total electron density only shows deviations below 115 km. NO+ density increases below 125 km after including minor neutrals (green dotted line), whereas O|$_2^+$| shows a decrease (magenta dotted line). Below 120 km, NO+ becomes a major ion, and the total electron density (blue and red dotted curves) also increases below 115 km.
6 DISCUSSION
In Fig. 3, we observe that below the V2 peak, NO+ and O|$_2^+$| are the dominant ions, and the total electron density is essentially the sum of these ion densities. Notably, the introduction of minor neutrals leads to changes in electron density only below 115 km, while densities remain consistent above that altitude. Specifically, the profiles of NO+ and O|$_2^+$| exhibit variations below 125 km, with NO+ increasing and O|$_2^+$| decreasing.
To better understand ion chemistry, we examine the total production and loss rates of NO+ and O|$_2^+$| in Fig. 4. When considering only major neutrals, NO+ production is primarily attributed to charge-exchange reactions, as depicted by the magenta line in Fig. 4 (Ambili et al. 2022). However, the introduction of minor neutrals results in an increased total production of NO+ below 125 km (magenta dotted line). In the presence of minor neutrals, the total production is governed by two processes: (a) direct photoionization of NO (PI, represented by the red dotted line) and (b) charge-exchange reactions. Below 125 km, an uptick in charge-exchange reactions is observed, while below 115 km, photoionization of NO contributes significantly to NO+ density. The loss rate of NO+ shows only marginal changes, resulting in a net increase in NO+ below 125 km.
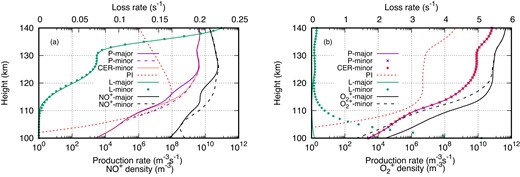
(a) Production rate, loss rate, and density of NO+ and (b) production rate, loss rate, and density of O|$_2^+$| in the presence of only major neutrals and including minor neutrals. P-major: production rate in the presence of only major neutrals; P-minor: production rate including minor neutrals; CER-minor: production rate due to charge-exchange reactions in the presence of minor neutrals; PI: production rate due to direct photoionization; L-major: loss rate in the presence of only major neutrals; L-minor: loss rate including minor neutrals; NO+-major: NO+ density due to major neutrals; NO+-minor: NO+ density after including minor neutrals; O|$_2^+$|-major: O|$_2^+$| density due to major neutrals; O|$_2^+$|-minor: O|$_2^+$| density after including minor neutrals.
Conversely, the O|$_2^+$| profile exhibits a different pattern. Even with the inclusion of minor neutrals, there is no change in the production rate of O|$_2^+$|, and direct photoionization plays a minimal role in its production rate. However, the loss rate of O|$_2^+$| increases in the presence of minor neutrals. As discussed earlier, among the three additional loss reactions in the presence of minor neutrals, the charge-exchange reaction with NO is the most prominent, leading to an enhanced loss rate at lower altitudes. The increased loss rate leads to a net decrease in O|$_2^+$| density below 125 km. This analysis indicates that below 125 km (at the V1 peak), the presence of sufficient NO density neutralizes O|$_2^+$| and produces NO+. The reduction in O|$_2^+$| is reflected as an increase in NO+, maintaining a constant total electron density below 125 km, up to 115 km. However, below 115 km, increased photoionization of NO generates additional NO+ ions, resulting in a net increase in electron density.
Two remaining points warrant discussion: the source of ionization for NO at lower altitudes and the limited contribution of direct photoionization of O2 to the production rate. To explain this, we need to consider the degradation of radiation flux in the Venus ionosphere and the height at which these radiations reach unit optical depth. In Fig. 5, we represent short wavelengths with red lines, the EUV range with black lines, and the longer EUV wavelength range with magenta lines. A clear observation from the figure is that only X-rays and longer EUV radiation can penetrate to altitudes below 130 km. Most EUV fluxes are absorbed above 130 km. X-rays can penetrate due to their higher intensity and lower photoionization cross-section for all neutrals. As for longer EUV radiation, apart from NO, none of the neutrals have ionization/absorption cross-sections above 1000 Å. Consequently, these radiations can penetrate to lower altitudes where the NO density is sufficient to provide an additional source of NO+ ions. This phenomenon is reflected in the height at which unit optical depth is reached, where only X-rays and longer EUV have values below 125 km. This height corresponds to the altitude of maximum radiation absorption and subsequently maximum ionization. In contrast, O2 has an ionization limit at 911 Å. Most of these fluxes are absorbed near the V2 peak, with very little radiation penetrating to lower altitudes for ionization. Therefore, direct photoionization of O2 plays a limited role in the overall ion production rate.

(a) Degradation of the flux in the wavelength range 1–1350 Å. (b) The height of the unit optical depth corresponding to each radiation.
7 CONCLUDING REMARKS
The Akatsuki radio science experiment has observed notable ionization occurring below 120 km in multiple radio occultation profiles. This enhanced ionization poses a challenge to our existing understanding of major neutrals and their associated chemistry. To gain insight into this phenomenon, we used the 1D-PCM to investigate the influence of minor neutrals in the lower altitude regions. Our findings highlight the crucial roles played by NO and O2 in shaping the ion and electron density profiles. At lower altitudes, NO and O2 become important minor neutrals. However, even after the inclusion of minor neutrals, the change in electron density remains minimal above 115 km, while below that altitude, we observe an increase. The NO+ density rises below 125 km, coinciding with a reduction in O|$_2^+$| density. This shift is attributed to the charge-exchange reaction between O|$_2^+$| and NO, which decreases O|$_2^+$| and increases NO+ density. Below 115 km, the increase in both NO+ ion density and electron density results from additional photoionization of NO. In the lower altitudes of the Venus ionosphere, NO+ ions might dominate the total ion density. It is however worth mentioning that while minor neutrals have significant control over ion chemistry below the V1 peak, their contribution to total electron density remains minimal. None the less, they can induce significant ionization below 115 km through direct photoionization of NO. The prominence of minor neutrals may become even more pronounced during space weather events characterized by a substantial increase in X-ray radiation.
ACKNOWLEDGEMENTS
This work was supported by the Indian Space Research Organisation, Department of Space, Government of India. We appreciate the help and support of the ground station teams at IDSN, India, and UDSC, Japan, to track the Akatsuki spacecraft. Special thanks go to Umang Parikh, Manager, D32 Antenna, and P. Gunashekhar, Manager, ISSDC at Byalalu, India, for their proactive support during experiments.
DATA AVAILABILITY
The Akatsuki radio occultation data are available in JAXA’s data archive (https://darts.isas.jaxa.jp/planet/project/akatsuki/rs.html.en). The electron density retrieved from the Akatsuki radio science experiment and 1D-PCM results are archived in https://spl.gov.in/SPLv2/index.php/spl-metadata.html with the subtitle ‘Minor-Venus’.
