


ABSTRACT
Warm dark matter (WDM) particles with masses (∼ kilo electronvolt) offer an attractive solution to the small-scale issues faced by the cold dark matter (CDM) paradigm. The delay of structure formation in WDM models and the associated dearth of low-mass systems at high redshifts makes this an ideal time to revisit WDM constraints in light of the unprecedented datasets from the JWST. Developing a phenomenological model based on the halo mass functions in CDM and WDM models, we calculate high redshift (|$z \gtrsim 6$|), the stellar mass functions (SMF) and the associated stellar mass density (SMD) and the maximum stellar mass allowed in a given volume. We find that: (i) WDM as light as 1.5 keV is already disfavoured by the low-mass end of the SMF (stellar mass |$M_* \sim 10^7\,\rm M_\odot$|) although caution must be exerted given the impact of lensing uncertainties; (ii) 1.5 keV WDM models predict SMD values that show a steep decrease from 108.8 to |$10^{2}\,\rm M_\odot \rm cMpc^{-3}$| from z ∼ 4 to 17 for |$M_* \gtrsim 10^8\,\rm M_\odot$|; and (iii) the 1.5 keV WDM model predicts a sharp and earlier cut-off in the maximum stellar masses for a given number density (or volume) as compared to CDM or heavier WDM models. For example, with a number density of |$10^{-3}\,\rm {cMpc^{-3}}$|, 1.5 (3) KeV WDM models do not predict bound objects at |$z \gtrsim 12$| (18). Forthcoming JWST observations of multiple blank fields can therefore be used as a strong probe of WDM at an epoch inaccessible by other means.
1 INTRODUCTION
The nature of dark matter (DM) remains a key outstanding question in the field of physical cosmology. Small-scale issues of the standard cold DM (CDM) paradigm (for a review, see e.g. Weinberg et al. 2015) have motivated an entire zoo of ‘DM candidates beyond CDM’ including warm DM (WDM; e.g. Blumenthal, Pagels & Primack 1982; Bode, Ostriker & Turok 2001), fuzzy DM (FDM) consisting of ultralight (∼10−22 eV) boson or scalar particles (Hu, Barkana & Gruzinov 2000; Marsh & Silk 2014), interacting DM (Spergel & Steinhardt 2000) and decaying DM (Wang et al. 2014). A key property of these ‘beyond-CDM’ models is their ability to smear out small-scale power, thereby suppressing the formation of low-mass structures. Focusing on WDM, the Lyman-alpha (Lyα) forest power spectrum measured from high-resolution quasar spectra at redshifts z ∼ 2–5 yield a WDM particle mass |$\, m_x\gtrsim 1.9-3.9$| keV (e.g. Viel et al. 2013; Iršič et al. 2017; Garzilli et al. 2021; Villasenor et al. 2023) depending on the exact assumptions made regarding the intergalactic medium (IGM) temperature–density relation. Further, the image positions and flux ratios of gravitationally lensed quasars have been used to infer |$\, m_x\gtrsim 5.2-5.58$| keV (Gilman et al. 2020; Hsueh et al. 2020), while combinations of strong lensing and Milky Way satellite populations have been used to infer the most stringent constraints with |$\, m_x\gtrsim 6.04-9.7$| keV (Enzi et al. 2021; Nadler et al. 2021).
Since structure formation proceeds hierarchically and WDM smears-out small-scale power, the effects of WDM are expected to be manifested most strongly through a decrease in the number density of low-mass haloes and an associated delay in the assembly of more-massive systems. A growing body of work is focusing on extending constraints on |$\, m_x$| into the first billion years at z > 7: analytic models, based on the halo mass function (HMF), have been compared to high-redshift observations to obtain constraints of |$\, m_x\gt 1.3-2.9$| keV (Schultz et al. 2014; Menci et al. 2016; Corasaniti et al. 2017; Rudakovskyi et al. 2021) with others making predictions of the ultraviolet luminosity function (UV LF) and redshift evolution of the stellar mass density (SMD) that can be tested with the JWST (e.g. Dayal, Mesinger & Pacucci 2015; Lovell et al. 2018; Stoychev et al. 2019; Kurmus et al. 2022; Lapi et al. 2022; Maio & Viel 2023). Further, the reported detection of a global 21-cm signal by the EDGES (Experiment to Detect the Global Epoch of Reionization Signature) collaboration from the epoch of reionization (EoR; although see Singh et al. 2022) has been used to constrain |$\, m_x\gtrsim 3-6.1$| keV (e.g. Schneider 2018; Chatterjee et al. 2019). These are now being supplemented by a new generation of small-scale (∼203 Mpc3) hydrodynamic (e.g. Maio & Viel 2015; Villanueva-Domingo, Gnedin & Mena 2018) and zoom-in simulations (e.g. Stoychev et al. 2019). A key caveat, however, is that uncertainties in baryonic physics remain degenerate with the underlying DM model used (for a discussion, see e.g. Dayal & Ferrara 2018; Villanueva-Domingo et al. 2018; Giri & Schneider 2021).
Over the past few months, the JWST has provided unprecedented views of galaxy formation in the first billion years, yielding a number of galaxy candidates between z ∼ 9–16.5 given its exquisite sensitivity (Bradley et al. 2023; Naidu et al. 2022b; Adams et al. 2023; Atek et al. 2023; Austin et al. 2023; Donnan et al. 2023). Indeed, the evolving (rest-frame 1500 Å) UV LF has now been mapped out between z ∼ 5–16.5 (e.g. Bouwens et al. 2021, 2023; Harikane et al. 2022, 2023; Naidu et al. 2022b) although caution must be exerted when using the LF at |$z \gtrsim 12$| where the redshift and nature of the sources remain debated (e.g. Naidu et al. 2022a; Adams et al. 2023; Arrabal Haro et al. 2023). In terms of stellar mass, the JWST has yielded galaxy candidates with masses between |$10^{8} -10^{11}\,\rm M_\odot$| at z ∼ 7–10 (Labbe et al. 2023; Navarro-Carrera et al. 2023).
In this work, our aim is to use the latest data sets from the JWST to revisit constraints on the WDM particle mass in the first billion years using a simple phenomenological model that links galaxy stellar masses to their host DM haloes. We note that the analysis carried out here can be applied to any DM model for which HMFs can be calculated within the first billion years.
We present our methodology for calculating the HMFs for different cosmologies in Section 2 before presenting our phenomenological model for the star formation efficiency in Section 2.1. We compare our theoretical stellar mass functions (SMFs) and the associated SMD to observations in Section 3.1 before discussing the maximum stellar mass allowed in any DM model for a given number density (or volume) in Section 3.2, before concluding in Section 4. Finally, throughout this work, we assume cosmological parameters in accord with Planck Collaboration VI (2020) such that Ωm = 0.315, Ωb = 0.049, σ8 = 0.813, ns = 0.963, and h0 = 0.673. We quote all length-scales in comoving Mpc (cMpc).
2 THE THEORETICAL MODEL
In this work, we use a phenomenological model based on the evolving HMF. Our aim is to explore constraints on the WDM particle mass using the (maximal) stellar masses allowed in different DM cosmologies. We start by constructing the HMF with the extended Press–Schechter approach (e.g. Giri & Schneider 2022). In brief, the halo number density n per unit halo mass (Mh) is defined as,
where ν ≡ δc(z)/σ(R), R is the halo radius, and |$\bar{\rho }$| is the mean background density. Further, δc(z) ≈ 1.686/D(z), where D(z) is linear growth factor, and |$M_h=(4\pi /3)\bar{\rho }(cR)^3$|, where c = 3.3 (Parimbelli et al. 2021). We use the Sheth–Tormen form (Sheth & Tormen 1999) for the first-crossing distribution f(ν), which can be written as,
with A = 0.3222 and p = 0.3. The variance is given by
where PL and WF(k, R) are the linear matter power spectrum and the smooth-k window function, respectively. This window function is defined as [1 + (kR)β]−1, where β is set to 4.8 (Leo et al. 2018; Parimbelli et al. 2021). Leo et al. (2018) showed that the smooth-k filter effectively addresses the limitations of both top-hat and sharp-k window functions in accurately reproducing the HMF derived from WDM N-body simulations, particularly at low masses. We use the publicly available code, class (Lesgourgues & Tram 2011), to model PL for the cosmologies (CDM and |$\, m_x\sim 1.5$| and 3 keV WDM) studied in this work.
The suppression scale in the WDM power spectrum (PL) can be quantified using the half-mode length-scale (e.g. Schneider et al. 2012),
Here, Ωx is the WDM background overdensity and λhm is the scale below which the WDM power spectrum is suppressed 4 times below CDM. This length-scale corresponds to the half-mode mass scale given as |$M_\mathrm{hm}=\frac{4\pi }{3}\rho _m\left(\frac{\lambda _\mathrm{hm}}{2}\right)$|, where ρm is the mean matter density. For values of |$\, m_x\sim 1.5$| (3) keV, λhm is found to be ∼0.6 (0.3) cMpc, respectively, at z = 0. In WDM cosmologies with |$\, m_x\sim 1.5$| (3) keV, the number of haloes is suppressed below the half-mode mass Mhm ∼ 109.7 (108.7) |$\rm M_\odot$| at z = 6–15.
We refer interested readers to Schneider et al. (2012) for a detailed comparison of the analytical formalism used here to N-body simulations.
2.1 The stellar masses of early galaxies in different cosmologies
These HMFs above are used to obtain SMFs and the associated SMD at z ∼ 4–20 as now detailed. We start by assuming each halo to contain gas mass that is linked to the halo mass through the cosmological ratio such that Mg = (Ωb/Ωm)Mh. We then study two different star formation efficiency (ϵ*) models to calculate the stellar mass as M* = ϵ*Mg:
Model A: in the first case, ϵ* is chosen to match to the high-mass (|$M_* \gtrsim 10^9 \rm M_\odot$|) end of the observed SMF at z ∼ 6–10. This requires a star formation efficiency that decreases with increasing redshift such that ϵ* = fn(z) = 0.15 − 0.03(z − 6) at z ∼ 6–10; we assume the star formation efficiency to saturate to ϵ* = 0.03 at z > 10 given the paucity of observational data at these early epochs.
Model B: in this maximal model, which presents a physical upper limit to the stellar mass contained in any halo, we assume a 100 per cent efficiency for the conversion of gas into stars, that is, ϵ* = 1. This simple calculation yields an upper limit to the SMD and the maximum stellar mass possible in any given volume at each z.
We use HMFs down to a minimum mass of |$10^{6.5}\,\rm M_\odot$| in all the cosmologies considered in this work. Since we do not include any suppression of the gas mass or star formation in our models, all of these haloes contribute when considering the ‘total’ SMD value at any redshift.
Observationally, the stellar mass is inferred by fitting to the observed photometry or spectroscopy, if available, and requires making a number of assumptions regarding the star formation history, the initial mass function (IMF), the dust attenuation, the impact of nebular emission lines and stellar binarity, to name a few. The assumed star formation history and the IMF can have significant consequences leading to stellar masses varying by as much as on order of magnitude (e.g. Topping et al. 2022; Wang et al. 2023) which can exceed the scatter from different spectral energy distribution (SED) fitting codes (Wang et al. 2023). Theoretically, however, the stellar mass can directly be inferred from the gas mass assuming an efficiency of star formation. The associated mass-to-light ratio (M/L) depends on a number of parameters including the IMF, the age, and metallicity of the stellar population and the dust content, to name a few. Indeed, for a given stellar mass, age, and metallicity, the UV luminosity is higher by about an order of magnitude assuming a top-heavy IMF (e.g. Fardal et al. 2007, with a slope of −1) as compared to a Salpeter IMF (Salpeter 1955) between |$0.1-100\, \rm M_\odot$|. On the other hand, the stellar mass calculated only depends on the assumptions of (i) a constant baryon-to-DM ratio; (ii) the redshift and mass dependence of ϵ*; and (iii) the assumed HMF evolution holding to redshifts as high as z ∼ 15–20. This is why, in this work, we choose to compare stellar masses – we note that the observationally inferred stellar masses used in this work have all been renormalized to a Salpeter IMF. We also use stellar masses since these offer a promising tool to be able to differentiate between CDM and non-CDM models (Dayal et al. 2015; Kurmus et al. 2022; Maio & Viel 2023) and since a number of previous works (Dayal et al. 2015; Lovell et al. 2018) have shown that luminosity-based indicators such as the UV LF are not a good probe of the underlying dark matter model. The higher mass-to-light ratios in non-CDM models partially compensate for the dearth of small-mass haloes, making the resulting UV LFs closer to CDM than expected from simple estimates of halo abundances.
3 THE STELLAR MASSES OF EARLY GALAXIES – CONSTRAINTS ON THE WDM PARTICLE MASS
We now use the star formation efficiency models above to obtain the evolving SMF at z ∼ 6–15, the redshift evolution of the associated SMD and the maximum stellar mass expected for a given number density (or volume) cut, as detailed in what follows.
3.1 The redshift evolution of the stellar mass function and stellar mass density
We show the evolving SMF between z ∼ 6–15 for CDM, 3 and 1.5 keV WDM in Fig. 1. Starting with Model A, where ϵ* = fn(z), independent of the DM model used, matching to the massive-end (|$M_* \gtrsim 10^9\,\rm M_\odot$| at) of the observed SMF requires a star formation efficiency that decreases with z. Indeed, we find |$\epsilon _* \sim 15~{{\ \rm per\ cent}}$| at z ∼ 6 which decreases to |$\epsilon _* \sim 6~{{\ \rm per\ cent}}$| by z ∼ 9, in accord with theoretical expectations of |$\epsilon _* \sim 8\,\mathrm{ per\,cent}-10~{{\ \rm per\ cent}}$| at these redshifts (e.g. Dayal et al. 2014, 2022). Matching to observations at the low-mass end (|$M_* \lesssim 10^9\, \rm M_\odot$|) in the CDM and 3 keV WDM models requires ϵ* to progressively decrease with decreasing mass. Physically this is driven by a combination of the shallow potential wells of such low-mass haloes that limit their star formation efficiency (e.g. Dayal et al. 2014) as well as supernova and reionization feedback that could have suppressed their gas masses well below the cosmological ratio (e.g Choudhury & Dayal 2019; Hutter et al. 2021). Due to a lack of low-mass haloes, the 1.5 keV WDM model shows a turnover at about |$10^8\,\rm M_\odot$| at z ∼ 6–9 that shifts to about |$10^7\, \rm M_\odot$| by z ∼ 15.
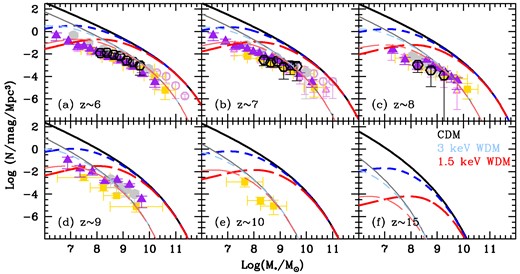
The SMF at z ∼ 6–15, as marked in panels (a)–(f). In each panel, the solid (black), short-dashed (blue), and long-dashed (red) lines show the SMFs for CDM, 3 and 1.5 keV WDM models, as marked in panel (f). Thin and thick lines show the results assuming ϵ* = fn(z) and ϵ* = 1 (Models A and B; Section 2.1); the latter model shows a physical upper limit to the SMF. Points show the observed data sets from Duncan et al. (2014, open circles at z ∼ 6–7), Song et. al. (2016, open triangles at z ∼ 6–7), Bhatawdekar et al. (2019, filled circles at z ∼ 6–9), Kikuchihara et al. (2020, filled triangles at z ∼ 6–9), Stefanon et al. (2021, filled squares at z ∼ 6–10), and recent JWST estimates from Navarro-Carrera et al. (2023, empty hexagons). All these data sets have been renormalized to a Salpeter IMF (Stefanon et al. 2021). The last (f) panel shows the upper limit to the predicted SMFs at z ∼ 15.
In the ‘maximal ϵ*’ case (Model B), the SMFs from both the 3 and 1.5 keV WDM scenarios converge to CDM for massive galaxies, with |$M_* \gtrsim 10^{10}\,\rm M_\odot$|. Further, as might be expected, the CDM model overpredicts the observed SMF at all z ∼ 6–15. As for the WDM models, they show a progressive deficit of lower mass systems with decreasing |$\, m_x$|. For example, the 1.5 (3) keV SMF start peeling away from the CDM SMF at |$M_* \sim 10^{9.5} ~(10^{8.5})\, \rm M_\odot$| at all z ∼ 6–15.
In terms of observations, lensing magnifications have allowed the SMF to be mapped out to masses as low as |$10^{6.5-7}\,\rm M_\odot$| at z ∼ 6–7 and |$10^{7}\,\rm M_\odot$| at z ∼ 8–9 (Bhatawdekar et al. 2019; Kikuchihara et al. 2020). As seen from Fig. 1 even allowing for error bars, the amplitude of the low-mass end of the observed SMF (|$\lesssim 10^7 \rm M_\odot$|) is only marginally consistent with Model A noted above and is already above the limits predicted by the ‘maximal’ model at z ∼ 6–7 in the 1.5 keV WDM scenario. Further, these observational data points approach the upper limits of the 3 keV model, at least at z ∼ 6–7. While at face value, this might be interpreted as ruling out WDM as light as 1.5 keV, this result must be treated with caution. We note that the observed SMFs collected by the different groups noted (renormalized to a Salpeter IMF by Stefanon et al. 2021) agree exceedingly well over 2.5 orders of magnitude in mass (|$M_* \sim 10^{7.5-10}\,\rm M_\odot$|) at z ∼ 6–8; such agreement is not an obvious expectation, given the different data-sets and methodologies used to infer the stellar mass. Indeed, the lensing amplification has been used to reach down to stellar masses as low as |$M_* \lesssim 10^7\,\rm M_\odot$| (Bhatawdekar et al. 2019; Kikuchihara et al. 2020) have a number of associated systematics that might propagate into estimates of the stellar mass (Bouwens et al. 2017; Atek et al. 2018). Further, all of the above works used parametrized star formation histories that are either constant or increase/decrease as a function of time. However, this assumption can lead to stellar masses being underestimated by as much as a factor of 10, especially for low-mass objects, as has been shown using non-parametric star formation histories to model Atacama Large Millimetre Array REBELS (Reionization Era Bright Emission Line Survey) data at z ∼ 7 (Topping et al. 2022). In any case, robust SMFs at |$M_* \lesssim 10^{7}\,\rm M_\odot$| offer an interesting pathway to constraining |$\, m_x$| at these early epochs.
We now discuss the associated SMD for both ϵ* models, exploring the values for all galaxies and integrating above stellar mass limits of 108 and |$10^{11}\,\rm M_\odot$|, as shown in Fig. 2. Starting with Model A for the star formation efficiency, integrating over all galaxies CDM predicts an SMD value that drops by about three orders of magnitude, from 108.8 to |$10^{5.7}\,\rm M_\odot \rm cMpc^{-3}$| between z ∼ 4 and 20. Limiting the integration to |$M_*\gtrsim 10^8\,\rm M_\odot$| systems results in a much steeper drop of the SMD, from 108.3 to |$10^{3}\,\rm M_\odot \rm cMpc^{-3}$| between z ∼ 4 and 13. The overprediction of the low-mass end of the SMF with this model results in a similar overprediction when compared to the observed SMD by about 0.5–0.75 dex. Finally, we find that rare, massive systems with |$M_* \gtrsim 10^{11}\rm M_\odot$| contain only about 0.6 per cent of the total SMD by z ∼ 4. As might be expected, compared to CDM, the SMD values for the 1.5 and 3 keV models show the largest differences (which increase with increasing redshift) when integrating overall systems. In this case, the 1.5 (3) keV models show a fourth (half) of the SMD of CDM at z ∼ 4 which drops by 3.6 (2) orders of magnitude by z ∼ 14. We note that the SMDs in CDM and 3 keV WDM effectively show no difference integrating for |$M_* \gtrsim 10^8\,\rm M_\odot$| systems; while the 1.5 keV model has about a third less SMD compared to CDM for an integration limit of |$M_* \gtrsim 10^8\,\rm M_\odot$|, the values all converge when considering the most massive systems with |$M_* \gtrsim 10^{11}\,\rm M_\odot$|.
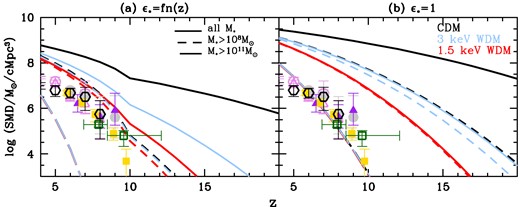
The redshift evolution of the SMD from z ∼ 4–20 for both star formation efficiency models considered in this work (see Section 2.1): panel (a) shows ϵ* = fn(z), while panel (b) shows results for ϵ* = 1, the physical upper limit to the SMD. As marked, black, blue, and red lines show the results for CDM, 3 and 1.5 keV WDM, respectively. Lines show results for all galaxies (solid lines) and integrating down to stellar mass limits of: |$10^8\, \rm M_\odot$| (short-dashed lines) and |$10^{11} \rm M_\odot$| (long-dashed lines). For reference, points show the observed SMD inferred by integrating down to |$10^8\, \rm M_\odot$| by Duncan et al. (2014, open circles), Song et. al. (2016, open triangles), Bhatawdekar et al. (2019, filled circle), Kikuchihara et al. (2020, filled triangles), and Stefanon et al. (2021, filled squares); finally, the empty squares show the latest JWST GLASS Early Release Science program results from Santini et al. (2023) and from Navarro-Carrera et al. (2023, empty hexagons).
This qualitative picture remains unchanged in the ‘maximal ϵ* model’ (panel b of the same figure) which yields an upper limit to the SMD in any of the DM scenarios considered. In this case, integrating above |$10^8\,\rm M_\odot$|, we predict a maximum SMD value that decreases from 109.1 to |$10^{5.1}\, \rm M_\odot \rm cMpc^{-3}$| from z ∼ 4 to 17 for CDM; over the same redshift range, the 1.5 keV WDM model shows a much steeper decline from 108.8 to |$10^{2}\, \rm M_\odot \rm cMpc^{-3}$|. This offers a first test of the nature of DM using early galaxies: for example, integrating above |$10^8\rm M_\odot$|, an observationally inferred SMD value that exceeds |$10^7~(10^{7.5})\, \rm M_\odot \rm cMpc^{-3}$| at z ∼ 10 could be used to rule out WDM as light as 1.5 (3) keV.
3.2 The redshift evolution of the maximal stellar masses in different DM models
We now show the maximum stellar mass allowed (using ϵ* = 1) for a given number density (or volume) for the different DM models, in Fig. 3. Given our assumption of each dark matter halo hosting one galaxy, the number density values quoted correspond to the number density of the host halo. Considering a number density of |$10^{-3}\, \rm {cMpc^{-3}}$|, CDM yields a maximum stellar mass of |$M_* \sim 10^{11.1} ~ (10^{7.7})\,\rm M_\odot$| at z ∼ 4 (20). Considering lower number densities of |$10^{-7} \rm {cMpc^{-3}}$|, these values increase to |$M_* \sim 10^{12.8} ~ (10^{8.9})\,\rm M_\odot$| at z ∼ 4 (20). JWST CEERS (Cosmic Evolution Early Release Science) observations have been used to assemble a sample of 13 massive galaxies with |$M_* \sim 10^{9.2-10.4}\rm M_\odot$| at z ∼ 6.5–9.08 (Labbe et al. 2023) as shown in the same figure. The survey area (40 arcmin2) and redshift uncertainty (Δz ∼ 1) yield a number density of about |$10^{-4.9}\, \rm {cMpc^{-3}}$| for these sources. Within error bars, all of these sources are below the upper limits predicted by CDM for a number density of |$10^{-5}\, \rm {cMpc^{-3}}$|, offering a sanity check to our calculations.
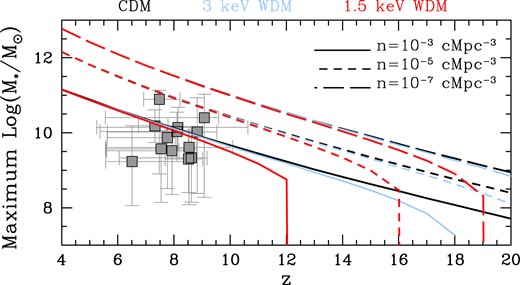
As a function of redshift, we show the maximum stellar mass allowed for CDM (black lines), 3 keV WDM (blue lines), and 1.5 keV WDM (red lines). The different lines show results for number densities of |$10^{-3} \rm cMpc^{-3}$| (solid lines), |$10^{-5} \rm cMpc^{-3}$| (short-dashed lines), and |$10^{-7} \rm cMpc^{-3}$| (long-dashed lines), as marked. The data points show the stellar masses derived by Labbe et al. (2023) using JWST CEERS program data; the error bars account for both the random and systematic uncertainties quoted in their table 2.
As might be expected, for a given number density, these upper limits to the stellar mass are in accord for all three DM models at |$z \lesssim 8$|. However, the progressive lack of structure formation with increasing redshifts leads to a ‘cut-off’ of the maximum stellar mass values allowed in light WDM models – for example, with a number density of |$10^{-3}\,\rm {cMpc^{-3}}$|, 1.5 keV WDM models do not predict bound objects at |$z \gtrsim 12$|. Decreasing number density limits (i.e. larger volumes) of 10−5 and |$10^{-7}\,\rm {cMpc^{-3}}$| result in a cut-off at increasing redshifts of z ∼ 16 and 19, respectively. These results imply that, for a given number density (volume) limit, the presence of objects above a certain stellar mass could be used to rule out light WDM models. Given the expected impact of cosmic variance in the small JWST fields of view (e.g. Ucci et al. 2021), one would ideally like to carry out this experiment across multiple blank fields: for example, for a number density of |$10^{-3} \,\rm {cMpc^{-3}}$|, the detection of systems, in multiple blank fields, with measurable stellar mass at |$z \gtrsim 12$| (18) could be used to rule out 1.5 (3) keV WDM.
4 CONCLUSIONS AND DISCUSSION
The nature of DM, and especially limits on the WDM particle mass (|$\, m_x$|), remain a key outstanding question in the field of physical cosmology. In this work, we use model-independent phenomenological calculations to revisit WDM particle mass constraints in view of the unprecedented data sets being yielded by the JWST. We use HMFs in CDM and WDM (|$\, m_x= 1.5$| and 3 keV) cosmologies to calculate the stellar masses associated with any halo assuming a cosmological baryon-to-DM ratio. We explore two models for the star formation efficiency (ϵ*): (i) in Model A, ϵ* is chosen to match to the massive-end of the observed SMF at z ∼ 6–10; (ii) in Model B, we use ϵ* = 1 to calculate the ‘maximal’ stellar masses associated with any halo. Our key findings are:
Independent of the DM model considered, matching to the massive-end (|$M_* \gtrsim 10^9\,\rm M_\odot$|) of the SMF requires ϵ* to decrease with z, from about 15 per cent at z ∼ 6 to 6 per cent by z ∼ 9. Matching to the faint end requires an ϵ* value that decreases with decreasing mass, hinting at the role of feedback in decreasing the gas masses and/or star formation efficiencies of low-mass haloes.
Lensing magnifications (that must be treated with caution) are allowing stellar masses to be probed down to |$10^{6.5-7}\,\rm M_\odot$| at z ∼ 6–9. The observed number densities for these objects are already in tension with 1.5 keV WDM models, that lack such low-mass systems.
Integrating over systems more massive than |$10^8\,\rm M_\odot$|, we predict SMD values that show a steep decrease from 108.8 to |$10^{2}\, \rm M_\odot \rm cMpc^{-3}$| from z ∼ 4 to 17 for 1.5 keV WDM; the corresponding values range between 109.1 to |$10^{5.1}\, \rm M_\odot \rm cMpc^{-3}$| for CDM. Observed SMD values above the limits predicted by the 1.5 keV WDM model would offer a strong constraint on the minimum |$\, m_x$| value allowed by high-z observations.
Finally, we calculate the maximum stellar mass allowed (using ϵ* = 1) for a given number density (or volume) for the different DM models considered. Given the dearth of low-mass haloes, the 1.5 keV WDM model predicts a sharp and earlier cut-off in such maximum masses as compared to the 3 keV or CDM models. For example, with a number density of |$10^{-3}\, \rm {cMpc^{-3}}$|, 1.5 (3) KeV WDM models do not predict bound objects at |$z \gtrsim 12$| (18). At this number density, the detection of stellar masses in multiple blank fields |$z \gtrsim 12$| (18) could therefore be used to rule out 1.5 (3) keV WDM.
Over the near future, JWST programs such as CEERS (PI: Finkelstein), Cosmos-Webb (PI: Kartaltepe), PANORAMIC (PIs: Willaims and Oesch), and PRIMER (PI: Dunlop) will be crucial in carrying out our proposed experiment. Although less stringent than the lower redshift limits of |$\, m_x\gtrsim 5.2$| keV (e.g. Gilman et al. 2020; Hsueh et al. 2020; Enzi et al. 2021; Nadler et al. 2021), such experiments will be crucial in extending constraints on |$\, m_x$| to an era inaccessible by any other means.
ACKNOWLEDGEMENTS
PD acknowledges support from the NWO grant 016.VIDI.189.162 (‘ODIN’) and from the European Commission’s and University of Groningen’s CO-FUND Rosalind Franklin program. The authors thank Atrideb Chatterjee, Paola Santini, and Mauro Stefanon for their inputs and data sharing and Ivo Labbe and Laura Pentericci for discussions. Nordita is supported in part by NordForsk.
DATA AVAILABILITY
Data available on request to the corresponding author.
