


ABSTRACT
Isolated galaxies are the ideal reference sample to study the galaxy structure minimizing potential environmental effects. We selected a complete sample of 14 nearby, late-type, highly inclined (i ≥ 80°), isolated galaxies from the Catalogue of Isolated Galaxies (CIG) which offers a vertical view of their disc structure. We aim to study extraplanar Diffuse Ionized Gas (eDIG) by comparing the old and young disc components traced by near-infrared (NIR) and ultraviolet (UV) imaging with the Hα emission structure. We obtained Hα monochromatic maps from the Fabry–Perot (FP) interferometry, while the old and young discs structures are obtained from the photometric analysis of the 2MASS Ks band, and GALEX NUV and FUV images, thereby identifying the stellar disc and whether the eDIG is present. The Hα morphology is peculiar in CIG 71, CIG 183, and CIG 593 showing clear asymmetries. In general, geometric parameters (isophotal position angle, peak light distribution, and inclination) measured from Hα, UV, and NIR show minimal differences (e.g. Δi ≤ ±10°), suggesting that interaction does not play a significant role in shaping the morphology, as expected in isolated galaxies. From Hα maps, the eDIG was detected vertically in 11 out of 14 galaxies. Although the fraction of eDIG is high, the comparison between our sample and a generic sample of inclined spirals suggests that the phenomenon is uncorrelated to the galaxy environment. As suggested by the extraplanar UV emission found in 13 out of 14 galaxies the star formation extends well beyond the disc defined by the Hα map.
1 INTRODUCTION
Galaxy interactions dramatically impact several galaxy properties, such as their morphology and star formation history (see e.g. Rampazzo et al. 2016, and references therein). The idea of gathering catalogues of isolated galaxies has been developed at least since the 1970s [e.g. the Catalogue of Isolated Galaxies (CIG), Karachentseva 1973] as a baseline for comparison with galaxies located in denser environments subject to interaction-induced phenomena. In the last decades, catalogues of isolated galaxies, selected from very low galaxy density regions, have been either implemented or revised using redshift measurements (Verdes-Montenegro et al. 2005; Karachentseva et al. 2010; Argudo-Fernández et al. 2013, 2015). A recent H i study of isolated galaxy samples suggests a picture of ‘nurture free’ galaxies (Jones et al. 2018). Other works (see e.g. Rampazzo et al. 2020) have shown that isolated elliptical galaxies suffered past interactions from which they still show the ‘scars’, although they have probably not experienced gravitational influences from their close neighbours over the past billion years.
This paper concentrates on the stellar versus Hα components in isolated spiral galaxies seen nearly edge-on (i ≥ 80°). This galactic configuration relative to the sky plane provides more information on the vertical structure of the disc (e.g. Burstein 1979; Fraternali & Binney 2006; Kamphuis et al. 2007; Peters et al. 2017) revealing the extraplanar Diffuse Ionized Gas (eDIG), detected in galaxies with relatively high star formation rate (SFR) surface densities (Rossa & Dettmar 2003a, b). The eDIG is usually traced at optical wavelengths using the Hα recombination line (e.g Rosado et al. 2013). In addition, as the eDIG might be spatially correlated with the star formation (SF)-gas relations, it has been observed to trace regions of H i dominance within galactic discs, especially those located outside active star-forming regions, making the 21-cm emission line a helpful tool for the eDIG detection (e.g. Zschaechner, Rand & Walterbos 2015). Ultraviolet (UV) imaging can also detect the low-intensity outer SF disc by detecting OB stars located in very low SFR density regions (e.g. Hoopes, Walterbos & Bothun 2001; Thilker et al. 2002, 2005, 2007; Gil de Paz et al. 2005, 2007b). From the comparison between the Hα and the UV images of spiral galaxies with low inclination (i ≤ 80°), Thilker et al. (2007) showed that the near-ultraviolet (NUV) emitting component is radially more extended than the emission of the old stellar population in at least 30 per cent of galaxies from the Local Universe (z ≈ 0.02). In high inclined galaxies, in cases where an eDIG layer does exist, the UV haloes tend to form a thick disc having a similar morphology to the UV halo and occurring in about the same place (Hodges-Kluck, Cafmeyer & Bregman 2016). Moreover, it has been observed that the Hα-UV flux ratio is lower in the eDIG than in H ii regions, indicating that the field OB stars, which are situated outside the star-forming regions, are important contributors to the eDIG ionization in most of the galaxies, and even in some galaxies they may be the dominant ionization source (Hoopes et al. 2001; Hodges-Kluck et al. 2016; Jo et al. 2018).
The eDIG morphology shows a wide variety of local morphological features (Rand 1998; Rossa & Dettmar 2003b; Rosado et al. 2013) such as prominent layers of diffuse gas, filamentary structures, or just one or a few patches of extraplanar emission (Rand 1998; Rossa & Dettmar 2003b; Rosado et al. 2013). Some eDIG originating phenomena have been proposed, such as interstellar medium (ISM) activity in the galaxy disc (e.g. Heald et al. 2006a, b, 2007; Rosado et al. 2013; Ho et al. 2016; Bizyaev et al. 2017; Jones et al. 2017), intergalactic medium accretion (e.g. Putman, Peek & Joung 2012; Putman 2017; Levy et al. 2019; Bizyaev et al. 2022), satellite galaxies interaction (e.g. Walker, Mihos & Hernquist 1996; Zschaechner et al. 2015) and accretion or intracluster interaction (e.g. Tomičić et al. 2021; Boselli, Fossati & Sun 2022; Sardaneta et al. 2022). In parallel, several studies have demonstrated that the UV halo emission is consistent with a reflection nebula produced by dust in the halo (e.g. Hodges-Kluck & Bregman 2014; Shinn & Seon 2015; Hodges-Kluck et al. 2016; Jo et al. 2018; Shinn 2019). Various mechanisms have been suggested as potential sources for diffuse-and-global UV haloes, including galactic radiation, magnetohydrodynamic phenomena, and dust accretion from the circumgalactic or intergalactic medium (see Shinn & Seon 2015, for a comprehensive examination). The contribution of each process over cosmic time is still unclear as they both produce hot and cold components that occupy roughly the same space (e.g. Hodges-Kluck & Bregman 2014).
Several studies from large surveys such as SAMI1 (Ho et al. 2016), MaNGA2 (Bizyaev et al. 2017, 2022; Jones et al. 2017) and CALIFA3 (Levy et al. 2019), and from specific surveys as CHANG-ES4 (Lu et al. 2023) have employed various environmental definitions in the selection of their samples of edge-on galaxies, contributing to varying interpretations of the relationship between extraplanar gas properties and their host galaxies. For instance, they have either discarded major mergers with clear tidal features (Ho et al. 2016; Bizyaev et al. 2022), rejected galaxies that have another object in the field, including stars (Bizyaev et al. 2017) or excluded galaxies with distorted discs in their Hα images (Lu et al. 2023). Recently, two studies agreed that the eDIG could be a consequence of the accretion of the circumgalactic medium (CGM, Levy et al. 2019; Bizyaev et al. 2022) which has also been proposed as probable UV halo origin (e.g. Hodges-Kluck & Bregman 2014; Shinn & Seon 2015). However, most of the literature still lacks a general agreement on the sources of ionization for eDIG. Since the eDIG may be related to the CGM, Bizyaev et al. (2022) visually examined the outer regions of each galaxy of their sample aiming to locate environmental structures that might be connected to the eDIG. Their findings ranged from small satellites lacking noticeable structure to large satellites even larger than the primary object. Therefore, the consensus or discrepancy in explaining the eDIG origin is likely a consequence of the different definitions of environment adopted. As a reference study case, isolated star-forming galaxies with the possibility of edge-on observations is needed.
In order to study the environmental effects on the eDIG distribution, we selected a sample of isolated nearby late-type, high-inclined galaxies from the CIG catalogue (Karachentseva 1973). Indeed, nearby galaxies are better resolved, late-type galaxies are those which contain the most Hα emission, and almost edge-on galaxies are those for which it is easier to detect the gas emission at high galactic latitude and for which the column density is higher, even in the disc outskirts. The extraplanar gas is commonly defined as the detectable Hα emission where the stellar continuum is not detected. This could be done from the continuum-subtracted emission-line image which delimits the stellar disc (e.g. Miller & Veilleux 2003; Rosado et al. 2013; Levy et al. 2019; Tomičić et al. 2021). This is typically what is done when observations with narrow- and broad-band filters around Hα emission are combined. Alternatively, the old stellar disc in spiral galaxies (Population II stars) could be better defined from redder broad band in the near-infrared (NIR, e.g. Kamphuis et al. 2007; Ho et al. 2016; Bizyaev et al. 2017, 2022) and young stellar population from bluer broad band, for example, in the UV, which traces the young stellar populations of ages up to tenths of Myrs (Hoopes et al. 2001; Thilker et al. 2007; Bianchi 2011; Kennicutt & Evans 2012). We used this method in this work. We present the Hα emission maps of a sample of galaxies. The net Hα maps (i.e. continuum free) were obtained using the scanning Fabry–Perot spectroimager (FP) named GHASP instrument, providing complete two-dimensional coverage of very extended line emission regions, ideal for studying the faint diffuse gas emission. We compared Hα FP monochromatic maps with NIR, NUV, and far-UV (FUV) images available in the literature. We defined a certain threshold in the NIR image under which the stellar density is low and consider that the eDIG is the Hα emission below this limit. The geometric parameters of the galaxies, such as the isophotal position angle (PA), peak light distribution, and inclination, are obtained from the photometric analysis of the UV and NIR images, and will serve as reference when studying the Hα kinematics in a forthcoming paper.
The paper is structured as follows. In Section 2, we provide details about the sample selection. In Section 3, we describe the data acquisition and reduction processes. In Section 4, we explain how the stellar disc and the extraplanar components are identified. In Section 5, we present the individual results of the photometric analysis of each galaxy in our sample. In Section 6, we discuss our main results. Finally, in Section 7, we provide a summary and the conclusions of our results. In order to compare our results with previous surveys, throughout this work we assumed a Hubble constant of |$H_{0}=70\, \, \, \mathrm{km\, s^{-1}\, Mpc^{-1}}$| (e.g. Thilker et al. 2007; Ho et al. 2016; Levy et al. 2019).
2 THE SAMPLE SELECTION
Isolated galaxies have been the subject of selection and study for many decades. Evidences are accumulating that over at least a few billion years the evolution of isolated galaxies has not been driven by interactions with physically associated companions (see e.g. Verdes-Montenegro et al. 2005; Karachentseva et al. 2010; Karachentsev et al. 2011; Rampazzo et al. 2020, and references therein). In this sense, isolated galaxies are the ideal reference sample to study internal galactic forces and galaxy morphological, dynamical, and photometric evolution minimizing possible environmental effects.
The CIG catalogue (Karachentseva 1973) and its more recent revisions (Verdes-Montenegro et al. 2005; Verley et al. 2007b; Argudo-Fernández et al. 2013) are examples of a successful attempt to compile a sample of isolated galaxies. Historically, Karachentseva (1973) obtained her catalogue from the visual inspection of the Digitized Sky Survey (DSS) images of the 27 837 galaxies – and of their surroundings – (at Galactic latitudes |b| ≥ 20°) contained in the CGCG.5 A list of 1050 galaxies were found to meet the isolation criterion she adopted (see also Karachentseva et al. 2010).
Since we are looking for the incidence of eDIG among isolated galaxies we have selected a sample from the CIG catalogue (Karachentseva 1973) of late-type galaxies (spirals with morphologycal type >5, i.e. Sb to be checked, see Buta et al. 2019) dominated by Population I stars that satisfy the following additional characteristics we derived from the NED data base:
- galaxies with high inclination (i ≥ 80°) computed with the expression(1)$$\begin{eqnarray} i=\cos ^{-1}(b/a), \end{eqnarray}$$
where b and a are the apparent optical major and minor axes of the galaxy, respectively;
galaxies with redshift z ≤ 0.02 to ensure that the emission of the redshifted Hα line fits in the optical wavelength;
galaxies with apparent Ks-band magnitude Ks ≤ 12. The NIR is sensitive to nuclear rings and large-scale bars, which might fuel active nuclei (e.g. Kormendy & Illingworth 1982; Eskridge et al. 2002; Jarrett et al. 2003).
A complete sample of 14 nearby isolated late-type edge-on galaxies was obtained. General parameters of the galaxies in our sample are listed in Table 1 and they are shown in Fig. 1.


Superposition of the respective FP Hα monochromatic map and GALEX NUV image of the galaxies in our sample. The ellipses fitted to the surface brightness level at 1σ and 3σ of the typical background noise (see e.g. Jarrett et al. 2000) of the respective 2MASS Ks-band image are overlain on the respective map. To distinguish the extraplanar material of each galaxy, the old stellar disc plane is traced by the ellipse fitted to the 3σ surface brightness level. We have masked the nearest and brightest field stars to each galaxy in the UV-band images. At the distance of each galaxy (see Table 1), the kpc measure equivalent to 30 arcsec is indicated with an arrow.
General parameters of the highly inclined isolated galaxies sample.
| CIG | Other | RA (J2000) | Dec. (J2000) | Vsys | Distance | i | Ks | D25(B) | Type | S60 | S100 | LFIR |
|---|---|---|---|---|---|---|---|---|---|---|---|---|
| name | name | (hh mm ss) | (° ′ ″) | (|$\mathrm{km\, s^{-1}}$|) | (Mpc) | (deg) | (mag) | (kpc) | (Jy) | (Jy) | (|$10^{43}\, \mathrm{erg\, s^{-1}}$|) | |
| (1) | (2) | (3) | (4) | (5) | (6) | (7) | (8) | (9) | (10) | (11) | (12) | (13) |
| 71 | UGC 01391 | 01 55 15.8 | + 10 00 49.2 | 5901 | 84.3 | 83.8 | 10.8 | 35.4 | Sc | 0.66 | 1.38 | 6.79 |
| 95 | UGC 01733 | 02 15 20.6 | + 22 00 22.0 | 4418 | 63.1 | 86.5 | 11.6 | 33.4 | Sc-w | 0.22 | 0.64 | 1.49 |
| 159 | UGC 03326 | 05 39 37.1 | + 77 18 44.9 | 4121 | 58.9 | 85.4 | 9.6 | 60.8 | *Scd: | 1.10 | 3.57 | 3.26 |
| 171 | UGC 03474 | 06 32 37.6 | + 71 33 39.5 | 3634 | 51.9 | 84.0 | 10.1 | 33.8 | *Scd: | 0.57 | 1.43 | 4.40 |
| 183 | UGC 03791 | 07 18 31.8 | + 27 09 28.7 | 5090 | 72.7 | 80.4 | 11.4 | 26.0 | *Sd: | 0.49 | 1.38 | 2.78 |
| 201 | UGC 03979 | 07 44 31.0 | + 67 16 24.9 | 4061 | 58.0 | 80.9 | 10.6 | 31.4 | SA(rs)c | 1.18 | 2.86 | 3.39 |
| 329 | UGC 05010 | 09 24 55.1 | + 26 46 28.8 | 4096 | 58.5 | 81.3 | 9.3 | 42.8 | SA(rs)b | 0.30 | 1.34 | 1.61 |
| 416 | UGC 05642 | 10 25 41.8 | + 11 44 20.8 | 2322 | 33.2 | 81.1 | 11.6 | 18.0 | Sd -pec | 0.52 | 1.16 | 2.69 |
| 593 | UGC 08598 | 13 36 40.7 | + 20 12 00.5 | 4909 | 70.1 | 83.2 | 10.8 | 35.5 | SBx(s)b: | 0.09 | 0.40 | 0.53 |
| 847 | UGC 11 132 | 18 09 26.2 | + 38 47 39.9 | 2837 | 40.5 | 81.2 | 10.7 | 24.6 | *Sb | 0.59 | 1.98 | 5.74 |
| 906 | UGC 11 723 | 21 20 17.5 | −01 41 03.6 | 4899 | 70.0 | 80.9 | 10.0 | 37.9 | Sbc | 1.97 | 5.95 | 11.51 |
| 922 | UGC 11 785 | 21 39 26.8 | + 02 49 37.6 | 4074 | 58.2 | 84.2 | 11.0 | 29.4 | Scd-w | 0.31 | 1.62 | 2.57 |
| 936 | UGC 11 859 | 21 58 07.4 | + 01 00 32.3 | 3011 | 43.0 | 85.7 | 11.4 | 38.7 | Sc: | 0.71 | 1.49 | 1.13 |
| 1003 | UGC 12 304 | 23 01 08.3 | + 05 39 15.7 | 3470 | 49.6 | 82.5 | 10.3 | 22.9 | Scd | 2.06 | 4.57 | 15.07 |
Notes. Columns: (1) CIG galaxy name; (2) UGC galaxy name; (3) and (4) wcs coordinates (J2000); (5) Vsys: systemic velocity from NED; (6) heliocentric distance to the galaxy; (7) i: inclination computed using the relation 1 (see the text); (8) Ks: apparent Ks-band magnitude from NED; (9) D25(B): optical diameter in the B band from NED; (10) Hubble classification from Buta et al. (2019) and, if not available, from NED (*); (11) and (12) flux densities at 25, 60, and 100 |$\, \mu$|m in Jy from Lisenfeld et al. (2007); (13) FIR luminosity computed with equation (4) (see Section 6.2).
2.1 Isolation degree
To be an isolated galaxy, the CIG catalogue required that no similar size neighbours were found close to the galaxy. This requirement can be described as follows: a galaxy with a standard angular diameter denoted as a1 is classified as isolated when the angular separation X1i between the galaxy and its ith neighbour with angular diameter |$a_{i}\, \epsilon \, [0.25,\, 4]\cdot a_{1}$|, meets or exceeds a threshold of |$X_{1i}\ge 20\, a_{i}$| (see equations 1 and 2 in Karachentseva et al. 2010). Since galaxies from the CIG catalogue were collected by visual inspection of DSS images, the companion galaxies are expected to be faint or mostly dwarf galaxies. Recently, the CIG catalogue has been refined using new quantification methods (e.g. Verley et al. 2007b) and modern tools like images with higher resolution than the plates of Palomar (e.g. Argudo-Fernández et al. 2013) and new images from H i emission data (e.g. Jones et al. 2018). In this section, we discuss how effectively our galaxy sample selected from the CIG catalogue meets these new isolation checks. However, even if a subset of our sample does not meet the strictest isolation criteria, all galaxies in our sample still represent a significant part of the overall isolated galaxy sample.
In the frame of the long-term AMIGA project (Analysis of the interstellar Medium of Isolated GAlaxies6), Verley et al. (2007a, b) revised all the positions of the CIG galaxies based upon the digitized photographic plates from the First and Second Palomar Observatory Sky Survey (POSS-1 and POSS-2) providing a quantification of the degree of isolation of CIG galaxies with the local number density of neighbour galaxies (ηk), and the tidal strength (Qk) affecting the central galaxy by its neighbourhood. These parameters depend on the position, diameter, and mass of the primary galaxy and its k-h neighbour. Thus, these parameters provide a clear picture of the environment around the isolated galaxies: the presence of one single similar size neighbour at a small distance to the CIG galaxy would result in a high value of the tidal strength (Qk) estimation, while the local number density (ηk) remains quite low as it is averaged over more nearest neighbours (Verley et al. 2007b). In Table 2, we list the number of neighbours and the nearest-neighbour distance to each galaxy in our sample according to Verley et al. (2007a). Then, Argudo-Fernández et al. (2013) re-evaluated the isolation criteria of AMIGA galaxies within a field radius of 1 Mpc using both photometric and spectroscopic data available from the Sloan Digital Sky Survey (SDSS) to refine the ηk and Qk parameters.
Number of neighbours of galaxies in our sample and the distance to the nearest one measured by Verley et al. (2007a).
| CIG | Neighbours | Distance | |
|---|---|---|---|
| name | (arcsec) | (kpc) | |
| (1) | (2) | (3) | (4) |
| 71 | 4 | 941 | 384.6 |
| 95 | 71 | 362 | 110.7 |
| 159 | 34 | 456 | 130.2 |
| 171 | 91 | 152 | 38.2 |
| 183 | 25 | 784 | 276.3 |
| 201 | 57 | 109 | 30.6 |
| 329 | 101 | 316 | 89.6 |
| 416 | 168 | 362 | 58.3 |
| 593 | 26 | 739 | 251.2 |
| 847 | 79 | 644 | 126.4 |
| 906 | 28 | 391 | 132.7 |
| 922 | 97 | 197 | 55.6 |
| 936 | 88 | 234 | 48.8 |
| 1003 | 77 | 118 | 28.4 |
Notes. Columns: (1) CIG galaxy name; (2) number of neighbours in a physical radius of 0.5 Mpc; (3) and (4) distance to the nearest neighbour in arcseconds and kpc, respectively, given the heliocentric galactic distance listed in Table 1.
Fig. 2 shows the comparison between the local number density (ηk) and tidal strength (Qk) of the galaxies in our sample making the distinction between the results of Verley et al. (2007b) and Argudo-Fernández et al. (2013). From Fig. 2 and Table 2, we observe that some galaxies classified as isolated in the AMIGA sample have its nearest neighbour at an angular distance of twice or three times their optical diameters, for example, CIG 171 and 201. According with Verley et al. (2007a), most of the neighbouring galaxies of CIG galaxies have a diameter ≤0.25a1, implying they are dwarf companions which were not took into account by Karachentseva (1973) when collecting the CIG catalogue but perhaps they can influence the evolution of the main galaxy. Therefore, if CIG 171 and 201 are in region of bona fide isolated galaxies in the AMIGA sample, we may infer that the nearest neighbours are small enough to not exert significant gravitational perturbations on the main galaxy. On the other hand, Verley et al. (2007b) had already determined that the galaxies of our sample, CIG 71 and CIG 936, were outside this region, excluding both galaxies from the AMIGA sample. As Argudo-Fernández et al. (2013) improved the quantification of the isolation degree, another galaxy of our sample, CIG 1003, is also out of the area of isolated galaxies in the Qk − ηk plane. In this way, 3 out of 14 galaxies in our sample failed the isolation criteria of the AMIGA sample, probably because they have some faint companions previously undetected by Karachentseva (1973).
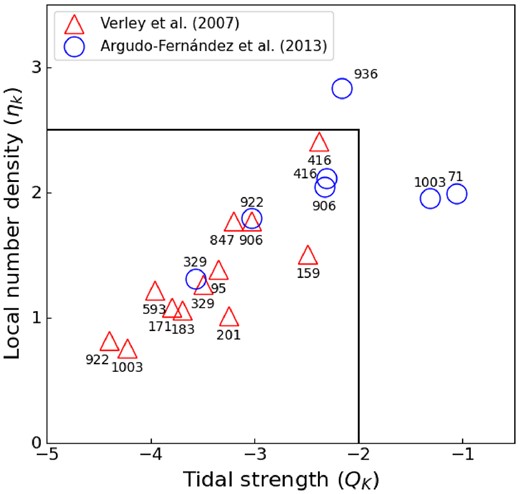
Comparison between the local number density (ηk) and tidal strength (Qk) parameters for the CIG galaxies in our sample. These parameters were obtained first, based on digitized photographic plates from POSS-1 and POSS-2 (Verley et al. 2007a, b, triangles) and later, on available photometric and spectroscopic data from SDSS-DR9 (Argudo-Fernández et al. 2013, circles). The CIG catalogue numbers are indicated on top the circles and below the triangles. According to Verley et al. (2007b), the horizontal (ηk = 2.4) and vertical (Qk = −2) lines enclose the region of bona fide isolated galaxies in the AMIGA sample.
Later, Jones et al. (2018) provided integrated H i fluxes of AMIGA galaxies by presenting a catalogue of H i single-dish observations. With these new data, Jones et al. (2018) included a review of integral features of AMIGA galaxies allowing to ensure isolation level of the AMIGA catalogue. Since the Argudo-Fernández et al. (2013) work is limited to the SDSS data, Jones et al. (2018) adopted the criteria of Verley et al. (2007b), and excluded all sources with heliocentric velocities below 1500 |$\mathrm{km\, s^{-1}}$|, removed all dwarf galaxies that were in the CIG, and discarded all sources with potentially spurious spectral parameters, leaving a final sample of 544 CIG galaxies. In these terms, 8 out of 14 galaxies in our sample would not be considered well isolated: CIG 71, 159, 171, 201, 416, 922, 936, and 1003.
While some members of our sample, selected from the CIG catalogue (Karachentseva 1973), may not fully meet the strictest current isolation criteria, it is important to stress that all galaxies in our sample are still classified as isolated galaxies. The different arguments stated above make us aware of the different degrees of isolation of the galaxies in our sample. However, previous studies indicate that late-type galaxies are usually located in very low-density environments. In this context, we decided not to exclude any galaxy a priori but rather discuss each of them knowing their isolation properties.
3 THE DATA
3.1 Hα observations and data reduction
Observations of the Hα emission line were performed using the scanning FP interferometer, GHASP, attached at the Cassegrain focus of the 1.93-m telescope at the Observatoire de Haute-Provence (OHP, see Table 3). A GaAs Image Photon Counting System (IPCS) is used to reach low detection levels, offering a total FoV (field of view) of about 5.8 × 5.8 arcmin2 with a pixel scale of ∼ 0.68 arcsec pixel−1 (Gach et al. 2002). Since the IPCS has no readout noise, exposures of 10 s were chosen for each of the 32 scanning steps required to cover the GHASP’s free spectral range (FSR). In order to detect the eDIG emission, the scanning sequence was typically repeated ∼35 times, resulting in a total exposure time per galaxy of ∼180 min. We used narrow-band interference filters (mainly full width at half-maximum, FWHM≃15 Å and in a few cases slightly larger up to 24 Å) enabling to select the redshifted Hα line of ionized hydrogen (6562.78 Å). The scanning FP interferometer we used, with an interference order of p ≃798 and a finesse |$\mathcal {F}\simeq$|13 at Hα, allowed GHASP to reach a typical spectral resolution of |$R\sim 10\, 000$|.
Instrumental and observational parameters.
| Parameter | Value |
|---|---|
| Telescope | 1.93 m OHP |
| Aperture ratio of the focal reducer | f/3.9 |
| Instrument | GHASP |
| Detector type | IPCS GaAs system |
| Detector size (pixel2) | 512 × 512 |
| Image scale (arcsec pixel−1) | 0.68 |
| Field of view (arcmin2) | 5.9 × 5.9 |
| Interference order at Hα | 798 |
| FSR at Hα (Å (|$\mathrm{km\, s^{-1}}$|)−1) | 8.23/376 |
| Finesse observed | ∼13 |
| Resolution | ∼ 10 000 |
| Spectral sampling at Hα (Å (|$\mathrm{km\, s^{-1}}$|)−1) | ∼0.26/∼11.5 |
Two calibration cubes were obtained, one at the beginning and another at the end of the observation, using a neon lamp with selected narrow line at 6598.95 Å, close to the redshifted nebular wavelength in order to minimize phase shift effect (e.g. Gómez-López et al. 2019). The observation date, filter’s central wavelength, and FWHM, the total exposure time and the astronomical seeing of each galaxy are listed in Table 4.
Journal of observations.
| CIG | Date | λc | FWHM | texp | Seeing | Resolution |
|---|---|---|---|---|---|---|
| N=name | (aaaa/mm/dd) | (Å) | (Å) | (min) | (arcsec) | (kpc arcsec−1) |
| (1) | (2) | (3) | (4) | (5) | (6) | (7) |
| 71 | 2019/10/26 | 6700 | 24 | 176 | 4.4 | 2.0 |
| 95 | 2019/10/27 | 6665 | 15 | 192 | 2.4 | 1.0 |
| 159 | 2021/01/13 | 6655 | 15 | 181 | 2.6 | 1.0 |
| 171 | 2021/01/14 | 6645 | 15 | 187 | 2.8 | 0.9 |
| 183 | 2021/01/21 | 6675 | 15 | 213 | 3.0 | 1.3 |
| 201 | 2021/01/16 | 6655 | 15 | 187 | 3.3 | 1.1 |
| 329 | 2021/01/13 | 6655 | 15 | 181 | 3.8 | 1.2 |
| 416 | 2021/01/21 | 6615 | 15 | 187 | 4.1 | 0.7 |
| 593 | 2021/03/09 | 6675 | 15 | 219 | 2.9 | 1.2 |
| 847 | 2019/10/29 | 6630 | 20 | 187 | 2.3 | 0.6 |
| 906 | 2019/10/26 | 6675 | 15 | 187 | 1.9 | 0.9 |
| 922 | 2019/10/25 | 6655 | 15 | 192 | 2.2 | 0.8 |
| 936 | 2019/10/27 | 6630 | 20 | 187 | 3.0 | 0.8 |
| 1003 | 2019/10/26 | 6645 | 15 | 187 | 2.5 | 0.8 |
Notes. Columns: (1) CIG galaxy name; (2) date of observation; (3) λc: non-tilted filter central wavelength; (4) FWHM: non-tilted full width half-maximum; (5) texp: total exposure time; (6) seeing in arcs; (7) final spatial resolution in kpc per arcseconds after having applied a spatial Gaussian smoothing on the Hα wavelength data cubes (see Section 3.1).
For the data reduction, we used the packages based on homemade idl7 routines, reduc-wizard and compute-everything (see e.g. Epinat, Amram & Marcelin 2008). The data reduction technique has been widely reported in Daigle et al. (2006b). In summary, it consists in the following steps: (1) integration with guiding correction of the total data cubes obtained during the observation; (2) application of a Hanning spectral smoothing on the data cube; (3) calibration in wavelength of the integrated data cubes through the computation of a parabolic phase map which is computed from the calibration cube in order to obtain the reference wavelength for the line profile observed inside each pixel, creating a wavelength-sorted data cube by applying the phase map correction to the interferogram data cube; (4) subtraction of the OH sky-lines emission; (5) a Gaussian spatial smoothing with an FWHM selected on the wavelength data cubes; and (6) computation of Hα monochromatic, continuum, radial velocity, and velocity dispersion maps for each wavelength calibrated cube. Finally, astrometric information was attached to the processed files by using the idl task koords from the karma package (Gooch 1996). In Table 4, we also listed the seeing and the final spatial resolution in kpc arcsec−1 after the spatial Gaussian smoothing of the Hα maps.
We performed two separate processes on the wavelength data cube. First, we applied Gaussian spatial smoothing, and then, independently, we performed adaptive spatial binning using a Voronoi tessellation (VT) with a target signal-to-noise ratio, SNR≃5. To ensure an SNR ≥ 5 in the Gaussian smoothed data cube, we compared the monochromatic Hα maps derived from both processes and set a threshold for the emission detected in the Gaussian smoothed maps. For an SNR ≃ 5, the GHASP surface brightness detection limit is |$F=2.5\times 10^{-17}\, \mathrm{erg\, sec^{-1}\, cm^{-2}\, arcsec^{-2}}$| (see Epinat et al. 2008; Gómez-López et al. 2019; Sardaneta et al. 2022). As no Hα calibrated image of any galaxy in our sample has been previously published, we followed the calibration procedure outlined by Epinat et al. (2008) to determine the total Hα flux for the GHASP data (see Appendix B).
The data analysis was made with the program adhocw8, iraf9 tasks, the SAO Image DS9 software,10 and our own python scripts.
3.2 Archival data
The DSS is available at the site of the Space Telescope Science Institute (STScI)11. The DSS |$6.5\times 6.5\, \mathrm{deg^{2}}$| plates have been scanned using a modified Photometric Data System (PDS) microdensitometer with a binned pixel scale of about ∼1.0 arcsec pixel−1. In this work, we use the DSS R-band images (5900–7150 Å) of our galaxy sample as a reference to provide a large-band optical view of the target. However, we do not calibrate these images in flux since their zero-point magnitude is currently unknown. The average seeing obtained from the image headers was ∼1.5 arcsec.
The Two Micron All-Sky Survey (2MASS, Jarrett et al. 2000) project uses two highly automated 1.3 m telescopes, one at Mt. Hopkins, Arizona, and the other at Cerro Tololo, Chile. Each telescope is equipped with a three-channel camera, each channel consisting of a 256 × 256 pixel2 array of HgCdTe detectors, capable of observing the sky simultaneously at J (1.24 |$\mu$|m), H (1.66 |$\mu$|m), and Ks (2.16 |$\mu$|m) NIR bands with an angular resolution of 2.0 arcsec and a pixel size of 1.0 arcsec pixel−1. Owing to the transparency of interstellar dust within the galaxies and to the dominance of late-type stellar populations in producing galactic NIR flux, the 2MASS galaxy images trace the overall stellar mass distribution in these galaxies.12 To calibrate in flux, the zero-point conversion values are published in the Explanatory Supplement to the 2MASS All Sky Data Release and Extended Mission Products.13 In this work, we use the Ks-band images of the nearby isolated late-type edge-on galaxies selected to sketch the stellar Population II.
Galaxy Evolution Explorer (GALEX) was the first UV all-sky survey covering an FoV of ∼1.25 deg using microchannel plate detectors to obtain direct images in the NUV (λeff = 2271 Å) and FUV (λeff = 1528 Å) with a resolution of 4.2/5.3 arcsec (FUV/NUV) and a pixel scale of 1.5 arcsec pixel−1 (Bianchi 2011).14 Conversion values between GALEX count rates, fluxes, and AB magnitudes are available in the GALEX Guest Investigator Web Site.15 We use GALEX–NUV and FUV images as tracers of stellar Population I in galaxies in our sample.
Thus, in this work we study Hα, NIR, and UV images, each one with different resolutions. In the case of the Hα emission data, the seeing conditions varied across the sample of galaxies, with different galaxies experiencing different levels of atmospheric turbulence due to the diversity of observational conditions during data gathering (see Table 4). For example, the closest galaxy, CIG 71, experienced the worst seeing conditions with a resolution of ∼4.4 arcsec (1.8 kpc), as did the most distant galaxy, CIG 416, with a resolution of ∼4.1 arcsec (0.7 kpc). However, CIG 922, a galaxy located at an average distance, had relatively average seeing conditions with a resolution of ∼2.2 arcsec (0.6 kpc). The seeing for the NIR (2 arcsec) and NUV/FUV (4.2/5.3 arcsec) images is considered constant for the whole sample. However, it is important to be aware that the different seeing disc sizes combined with the different distances of the galaxies blur the data and impact the spatial physical resolution making it more difficult to distinguish fine details such as eDIG filaments or patches.
Finally, since the Infrared Astronomical Satellite (IRAS) did not cover the whole sample of CIG galaxies, Lisenfeld et al. (2007) reprocessed the IRAS MIR/FIR survey data using the ADDSCAN/SCANPI utility for 1030 out of 1050 CIG galaxies as part of the AMIGA project. In this work, we use the IR flux densities at 60 and 100 |$\, \mu \mathrm{ m}$| from AMIGA survey (see Table 1).
4 IDENTIFYING THE STELLAR DISC
To disentangle the galactic disc from the gaseous extraplanar component, we performed a photometric analysis of the 2MASS 2.2 |$\mu$|m image, tracer of the old stellar population, and of the GALEX NUV and FUV images, connected to the young stellar population in the galaxy. Because of the particular characteristics of the images in each band, to derive the surface brightness profile, we used two different software packages, the ellipse task from the iraf stsdas package (Jedrzejewski 1987) and the isophote package from the python photutils package16 (Bradley et al. 2020). Both programs fit an ellipse via an iterative method (devised by Jedrzejewski 1987) as well as quantify the distortion from a perfect ellipse by means of higher order Fourier harmonics:
where μ0 is the surface brightness averaged over the ellipse as a function of the azimuthal angle θ and, An and Bn the higher order Fourier coefficients. The first- and second-order coefficients (A1, B1, A2, and B2) indicate the errors in the fitting procedure, being zero for a best-fitting ellipse, while the third-order coefficients (A3 and B3) characterize the deviation of the fitted ellipse from the isophote shape. The coefficient B4 measures symmetric distortions from pure ellipticity (ε): when B4 > 0, the isophotes have a ‘disc-like’ (circular) shape and, when B4 < 0, the isophotes have a ‘boxy’ (rectangular) shape. The inclination angle (i) with respect to the sky plane of the galactic disc can be measured through the ε of the fitted ellipse. Using diverse tracers of the stellar population serves as a crucial means to differentiate between the particular cases presenting UV extended discs or UV haloes which represent at least one-third of the galaxies in the Local Universe (Thilker et al. 2007) and, as we will show for our sample in Section 5, approximately two-thirds of the late-type isolated high-inclined galaxies.
The analysis of edge-on galaxies is more difficult than the analysis of galaxies with lower inclination because the high inclination affects the apparent shape of the galaxy along the line of sight. In photometric analysis of low-inclination galaxies, a smooth bulge–disc transition is typically observed in the resulting plots (e.g. Marino et al. 2010). However, in highly inclined galaxies, the brightness of the inner regions is dominated by the bulge with a small contribution from the thin disc. As the radius increases, the contribution from the disc becomes more important, leading to an abrupt bulge–disc transition in the resulting plots. This provides a noisier behaviour at small radii in the photometric analysis for highly inclined galaxies.
Considering that in late-type galaxies old and young stellar populations are mixed in the disc (e.g. Nersesian et al. 2019), we define the stellar homogeneous disc by using the ellipse delimiting the locus of the stars belonging to the old stellar population since they trace the bulk of the mass and probe the global potential of the disc galaxy.
4.1 NIR emission
For the 2MASS 2.2 |$\mu$|m image, we applied the method of elliptical isophote fitting using the task ellipse (Jedrzejewski 1987) from the iraf stsdas package. As initial parameters we set the galaxy coordinates as the centre, the B-band optical diameter (D25) as the maximum semi-major axis length, and the optical PA and ε published in the NED (see Table 1). We used logarithmic radial sampling with an initial step of ∼0.5 pixel along the semimajor axis in order to derive the surface brightness profile of each galaxy in an iterative process. The centre, PA, and ε of the ellipse were allowed to vary in each iteration.
Jarrett (2000) defined the isophotal aperture r20, derived from the Ks-band isophote at |$\mu _{K}=20\, \mathrm{mag\, arcsec^{-2}}$|, as the 2MASS standard aperture, corresponding to roughly 1σ of the typical background noise in the K-band images. However, because of the high levels of background noise in the 1–2 |$\mu$|m atmospheric windows, the 2MASS is not as sensitive to low surface brightness emission from galaxies (Jarrett 2000). In consequence, the Ks-band benchmark of |$\mu _{K}=20 \, \mathrm{mag\, arcsec^{-2}}$| elliptical isophote aperture might underestimate the total flux between 10 per cent and 20 per cent, depending on the radial distribution according to the Hubble type (Jarrett 2000; Jarrett et al. 2003). On the other hand, discrepancies in the measurements at the |$\mu _{K}=20 \, \mathrm{mag\, arcsec^{-2}}$| level between the 2MASS and other Ks-band surveys (see e.g. Fingerhut et al. 2010) have suggested potential errors in the 2MASS data reduction process. In fact, Jarrett (2000) explained that systematic components such as H-band airglow variations were not well understood by then and might have induced large errors in the photometry.17 Consequently, the choice of a brighter isophote to define the galactic disc boundaries, beyond the 1σ level at |$\mu _{K}=20 \, \mathrm{mag\, arcsec^{-2}}$|, may help to mitigate potential data reduction errors in the 2MASS data set.
To be consistent with previous optical photometric results, Jarrett et al. (2003) derived some galactic properties from the 3σ isophote, such as the ε and PA, in the 2MASS Large Galaxy Atlas (LGA) and the 2MASS Extended Source Catalogue. These photometric parameters are consistent with our Ks-band results as well (see Table 5). Furthermore, the Ks elliptical isophotal photometry should include the core, bulge, and disc components, capturing most of the flux from a galaxy (e.g. Jarrett et al. 2000). Therefore, to ensure that a significant portion of the galaxy’s light is captured and to avoid empty sky background noise, hereafter we use the ellipse at 3σ on the background as reference for the disc traced by the stellar Population II. Although this value may not represent the true galactic radii, it is a practical starting point to define the old population stellar disc boundaries.
Photometric parameters resulting from the ellipse fitting to the 2MASS Ks band and GALEX NUV and FUV images.
| Ks band, 1σ | Ks band, 3σ | NUV | FUV | |||||||||
|---|---|---|---|---|---|---|---|---|---|---|---|---|
| CIG | r | PA | ε | r | PA | ε | r | PA | ε | r | PA | ε |
| name | (arcsec) | (deg) | (arcsec) | (deg) | (arcsec) | (deg) | (arcsec) | (deg) | ||||
| (1) | (2) | (3) | (4) | (5) | (6) | (7) | (8) | (9) | (10) | (11) | (12) | (13) |
| 71 | 33.1 | 179.1 | 0.76 | 18.7 | 178.8 | 0.77 | 61.0 | 177.9 | 0.80 | 34.6 | 177.9 | 0.84 |
| 95 | 25.6 | 128.8 | 0.83 | 12.0 | 126.2 | 0.71 | 73.3 | 127.3 | 0.85 | 60.2 | 126.4 | 0.90 |
| 159 | 74.4 | 68.9 | 0.87 | 42.0 | 66.2 | 0.860 | 114.0 | 67.0 | 0.90 | 53.1 | 71.0 | 0.90 |
| 171 | 59.1 | 159.9 | 0.77 | 44.4 | 159.7 | 0.858 | 110.9 | 156.9 | 0.83 | 64.9 | 160.0 | 0.90 |
| 183 | 28.9 | 19.8 | 0.82 | 13.5 | 16.6 | 0.74 | 66.2 | 19.8 | 0.72 | 48.8 | 18.0 | 0.73 |
| 201 | 36.4 | 150.9 | 0.78 | 20.5 | 151.7 | 0.79 | 85.8 | 151.2 | 0.69 | 81.6 | 151.6 | 0.86 |
| 329 | 63.6 | 115.1 | 0.76 | 35.9 | 115.4 | 0.77 | 86.8 | 110.0 | 0.79 | 71.3 | 113.0 | 0.80 |
| 416 | 23.2 | 97.9 | 0.75 | 11.9 | 95.0 | 0.63 | 59.7 | 97.8 | 0.43 | 48.3 | 97.1 | 0.78 |
| 593 | 27.8 | 167.0 | 0.73 | 14.1 | 165.5 | 0.67 | 73.5 | 165.0 | 0.81 | 44.8 | 168.0 | 0.75 |
| 847 | 33.1 | 140.8 | 0.71 | 20.5 | 140.2 | 0.77 | 87.5 | 142.0 | 0.73 | 76.7 | 142.0 | 0.87 |
| 906 | 45.0 | 28.3 | 0.72 | 31.3 | 32.8 | 0.80 | 60.6 | 35.0 | 0.63 | 52.3 | 31.8 | 0.88 |
| 922 | 34.7 | 61.1 | 0.83 | 19.6 | 60.0 | 0.84 | 72.1 | 61.5 | 0.82 | 55.4 | 61.5 | 0.88 |
| 936 | 19.8 | 52.3 | 0.58 | 12.3 | 61.6 | 0.64 | 111.7 | 61.0 | 0.86 | 71.4 | 61.1 | 0.90 |
| 1003 | 45.5 | 127.3 | 0.80 | 25.7 | 124.7 | 0.80 | 52.8 | 129.4 | 0.54 | 53.3 | 119.4 | 0.81 |
Notes. CIG galaxy name listed in column (1). Major axis length (r), position angle (PA) measured from the north to the east and ellipticity (ε) of the ellipses fitted to the Ks-band image at 1σ level on the background are listed in columns (2), (3), and (4), respectively, and at 3σ level in columns (5), (6), and (7). Same parameters determined for the NUV image are listed in columns (8), (9), and (10), and for the FUV image in columns (11), (12), and (13).
The older stellar population in spiral galaxies points out internal structures such as spiral arms, bulges, warps, rings, and bars (Jarrett et al. 2003). Bars play a major role in the secular evolution of galaxies and, through vertical resonances, drive stars above the plane to form peanut/box-shaped pseudo-bulges (Combes & Sanders ). The non-axisymmetry of the bars produces the gas to flow inwards fuelling SF in the central regions of their host galaxies (see e.g. Kim et al. 2021, and references therein). Bottom frame of panel (d) of Fig. 3, and from Figs E1–E13, shows the variation of the B4 parameter with respect to the galactic semi-major axis (radius). From these graphics, we found that the only one galaxy in our sample that presents a coefficient B4 < 0 is CIG 329 (see Fig. E6) implying it has a ‘boxy’ bulge.
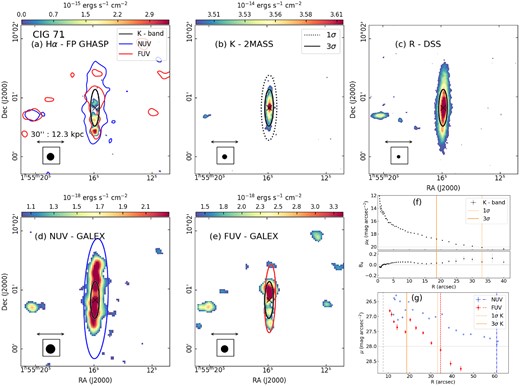
Example of the layout of the graphs and maps of each galaxy. CIG 71 (UGC 1301). Multiwavelength maps of the galaxy: (a) the Hα monochromatic map from FP-GHASP data; (b) the 2MASS Ks-band image; (c) the DSS R-band image; (d) and (e) the GALEX NUV and FUV images, respectively. In panels (f) and (g), the surface brightness profile of the Ks-band and NUV/FUV emissions are plotted, respectively. In both panels, vertical lines mark the surface brightness level at 1σ (dotted line) and 3σ (solid line) of the Ks-band image. In panel (g), vertical lines indicate the radii corresponding to the isophotes at a surface brightness level at μNUV, FUV = 28 mag arcsec−2 for the NUV (dotted–dashed line) and FUV (dashed line) maps, respectively. Additionally, the vertical loosely dashed line at ∼5 arcsec shows the approximate FWHM of the GALEX point spread function (see e.g. Marino et al. 2010). The ellipses fitted to these isophotes are superimposed on the corresponding map. The common elements in in panels (a), (b), (d), and (e) are: a colour bar indicating the flux in units of |$\mathrm{erg\, sec^{-1}\, cm^{-2}}$|, the arrow tracing a scale of 30 arcsec, a filled circle embedded in a box indicating the spatial resolution of the image, a ellipse representing the surface brightness level at 3σ on the background of the Ks-band image and, a cross (×) pointing the location of the NIR band peak light distribution. At the bottom of panel (f), we show the relationship between the coefficient B4 and the radius using the Ks-band map to determine if the isophotes tend to have ‘disc-like’ (B4 < 0) or ‘boxy’ (B4 > 0) shape (see Section 4). Finally, in panel (a), on the Hα monochromatic map were overlaid the 1σ isophotes on the background of the NUV and FUV images.
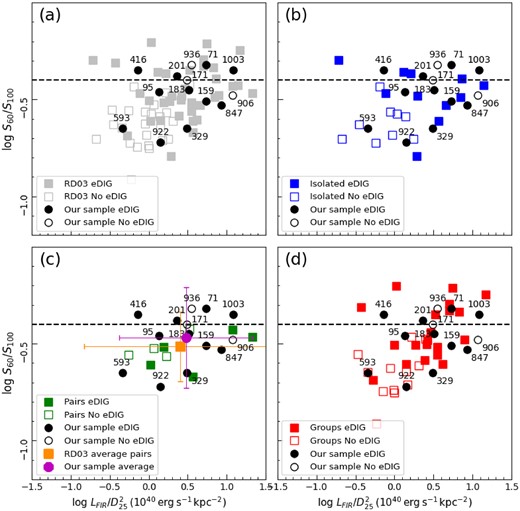
DDD (Rossa & Dettmar 2003a) showing the flux densities ratio at 60 and 100 µm (S60/S100) versus the ratio of the FIR luminosity (LFIR) divided by the optical diameter of the |$25^{th}\, \mathrm{mag\, \mathrm{arcsec^{-1}}}$| isophote squared (|$D_{25}^{2}$|) in units of |$10^{40}\, \mathrm{\, ergs\, s^{-1}kpc^{-2}}$|. The horizontal dashed line marks the threshold for warm galaxies at S60/S100 ≥ 0.4. We compare our sample (black circles with the CIG catalogue numbers indicated) with the whole sample (frame a) of Rossa & Dettmar (2003a) (squares) labelled RD03. Then, we use the hierarchy published in databases to distinguish whether the galaxies in the Rossa & Dettmar (2003a) sample are isolated (frame b), in pairs (frame c) or in groups (frame d) (see Table F1). Due to the low number of galactic pairs in the Rossa & Dettmar (2003a) sample, in panel (c) we also compare the mean values and confidence intervals (see Gehrels 1986) of this subsample (square) and that of our sample (circle). In all panels, we distinguish between galaxies that have (filled markers) or do not have eDIG (empty markers).
4.2 UV emission
The ellipse task from iraf works in an iterative manner, if there is contamination such as stars and H ii regions or regions of too low SNR, the program continues generating ellipses but it outputs parameters with undefined values. To overcome this difficulty, other fitting software was used to derive the surface brightness profiles of the NUV and FUV images. The isophote package from photutils (Bradley et al. 2020), provides tools to fit elliptical isophotes to a galaxy image using an iterative method described by Jedrzejewski (1987, see equation 2) for each ellipse as well. The isophote package can also work in an iterative manner by measuring a maximum acceptable relative error in the local radial intensity gradient (typically 0.5). However, when two consecutive isophotes exceed the value specified by the parameter the program prevents ellipses either from prematurely stopping due to the stellar contamination or from growing in low SNR regions. None the less, if the maximum semi-major axis is specified, the intensity gradient is set to ‘none’ and the algorithm proceeds inwards to the galaxy centre. Although it is not the general case and may not be the best fit, this procedure allows to analyse data with too low SNR in the inner regions of the galaxy, such as in some GALEX NUV and FUV images of galaxies in our sample. This fit algorithm is quite sensitive to the initial guesses. The iteration begins by giving a fixed semi-major axis length selected initially to grow linearly with steps of 0.5 pixel and specifying the initial value of the galactic centre, PA, and ε, then the algorithm proceeds to fit isophotes inwards to the galaxy centre.
We initialized the fitting parameters using the galaxy coordinates as the centre, the optical PA, and ε obtained from the NED database, and the B-band optical diameter (D25) as the maximum length of the semi-major axis obtained from the NED database (see Table 1). To overcome any discrepancies between the optical and UV radii, we made adjustments to the initial parameters by comparing the UV radius measured using the DS9 image analysis software with the optical radius, and modifying the corresponding initial parameter values if the optical radius was smaller than the UV radius. For most of our targets, we allowed the centre position, ε, and PA to vary during the fitting process. Some galaxies (CIG 71, 95, 847, 906, and 1003) present the NUV/FUV brightest knots beyond ∼10 arcsec from the peak light distribution of the NIR emission, this last position is assumed the center of the galactic disc and it is probable that the NIR emission is shadowing the actual peak of the UV light. Hence, for these galaxies, we fixed the centre position at the NIR peak light distribution, assuming it indicates the galactic centre, and we allowed the ε and PA to vary during the fitting process. Thus, we ensure that the fitted ellipses accurately reflect the morphology of the target galaxies, taking into account any deviations from the ideal elliptical shapes.
We computed the isophotal radii at surface brightness levels of |$\mu _{\mathrm{{\it \mathrm{ NUV}}, {\it \mathrm{ FUV}}}}=28\, \mathrm{mag\, arcsec^{-2}}$| in NUV and FUV, which roughly correspond to the average surface brightness at the optical diameter (see e.g. Gil de Paz et al. 2007a; Marino et al. 2010; Cortese et al. 2012), using the limit AB magnitude in NUV of 20.08 mag and in FUV of 18.82 mag.18
4.3 Photometric and geometric parameters at different wavelengths
Photometric parameters, such as the PA and galaxy inclination, are useful observational constraints to reveal galaxy peculiarities when the galaxy configuration is examined, particularly when different wavelengths are considered. In Table 5, we list the photometric parameters resulting from the ellipse fitting process. Panel (g) of Fig. 3 and Figs E1–E13 shows the surface brightness profiles of GALEX NUV and FUV images, while the resulting ellipses were overlaid on the NUV (panel e) and FUV (panel f) images, respectively (see e.g. Fig. 3). The 1σ NUV and FUV isophotes computed after applying a Gaussian spatial smoothing of σ ≈ 4.5 arcsec (3 pixel) on the NUV and FUV images were overlaid on the Hα monochromatic map (panel a) in order to allow a better comparison of the morphology traced at different wavelengths.
Inclination plays a critical role in the analysis of galaxy structure as it is used to correct its main parameters as the brightness (e.g. Stone, Courteau & Arora 2021) and the rotation velocity (e.g. Epinat et al. 2010). Assuming that the image of a spiral galaxy is the projection of a disc with the shape of an oblate spheroid, the inclinations of spiral galaxies can be roughly derived from the ε of apertures used for photometry. If the thickness of a disc is neglected the relation between the inclination (i) to the celestial plane and the apparent diameter ratio can be described using the relation (1). If the thickness is taken in consideration, the inclination can be estimated using the expression:
where ε = 1 − b/a is the ellipticity at the isophotal radius and q0 = c/a is the flattening, in this case a, b, and c are the three spheroid’s axes (see e.g. Barbosa et al. 2015). Many works have shown that the flattening is type dependent (see e.g. Haynes & Giovanelli 1984). In this sense, Hall et al. (2012) determined an intrinsic flattening for spiral galaxies, q0 = 0.13, by studying the relationship between the axial ratios in the i band versus the g − i galaxy colour computed at the effective radius for 871 edge-on galaxies from the SDSS. They showed that, although q0 increases with redder, progressively bulge dominated galaxies, the q0 distribution was rather flat for late-type galaxies only with an upturn in the transition between Sa to S0 galaxies.
None the less, deriving the inclination from ε may be problematic. For instance, prominent bulges can dominate the axial ratio measurement or in other cases, galaxies may not be axially symmetric owing to tidal effects or high surface brightness bars embedded in low surface brightness discs (Epinat et al. 2008, 2010; Hall et al. 2012; Kourkchi et al. 2019; Stone et al. 2021). All these rather common configurations can lead to large errors. Some solutions have been proposed, for example, in order to avoid contamination due to clumps of SF, Epinat et al. (2010) suggested that the inclination should be preferentially derived from broad-band images with high resolution, as in the NIR rest frame of the galaxy tracer of the old stellar disc.
In addition to photometric techniques, to compute the galaxy inclination, some studies use visual inspection to evaluate the inclinations. For example, to select the high inclined galaxies from SDSS and CALIFA surveys, Bizyaev et al. (2017) and Levy et al. (2019), respectively, used the visibility of the dust lane in optical images of the galaxies to confirm the edge-on nature of the galaxies, excluding galaxies with dust lanes that were not centred in the mid-lane or displaying any visible track of spiral arms, bars, or other features. Kourkchi et al. (2019) evaluated this technique by designing an online graphical tool, achieving uncertainties of ±4° and suggesting to replace the human eye with a machine learning algorithm to compute more accurate inclinations.
In this work, the galactic inclination i was one of the selection paramaters (see Section 2) for our sample. First, the inclination of the CIG galaxies in our sample was computed by the relation (1) using the galactic apparent major and minor axes from the optical wavelength published in the NED. Next, we computed the inclinations of galaxies in our sample applying the relation (3), for the the 2.22 |$\mu$|m and NUV emission images we employed the ε obtained from the ellipse fitting performed to them, and for the optical wavelength image, we used the galactic apparent major and minor axes from the NED. In all cases, we used the constant flattening q0 = 0.13 determined by Hall et al. (2012). In the case of the NIR image, we have computed the inclination of both 1σ and 3σ isophotal levels.
In Table 6, we compare the inclinations obtained. Equation (3) has a lower threshold of effectiveness depending on the flattening value (q0) considered. Since Hall et al. (2012) determined the flattening value q0 in the i band, in the optical band we obtained inconsistent results for some galaxies in our sample having ellipticity 1 − ε ≥ q0 = 0.13. Therefore, in the following we will discuss the inclination calculated considering the galaxy as infinitesimally thin only in the optical band (see relation 1). Excluding particular cases, the inclination computed with the ellipse fitted to the NIR 3σ isophotal level has an averaged difference of ∼2° with respect to the optical inclination, while the inclination from the NIR 1σ isophotal level has an averaged difference of ∼4° and the mean difference with the inclination from the NUV emission is ∼3°. Hence, the inclinations computed with the parameters of the ellipse fitted to the NIR image at the 3σ isophotal level are the most congruent with the optical inclination, and following Epinat et al. (2010), this may be the best estimation to measure the galaxy inclination.
Inclinations computed with different methods and wavelengths.
| CIG | iOptic | |$i_{{\it \mathrm{ NIR}},\, 1\sigma }$| | |$i_{{\it \mathrm{ NIR},\, 3\sigma }}$| | iNUV | |
|---|---|---|---|---|---|
| (1) | (2) | (3) | (4) | (5) | (6) |
| 71 | 83.8 | … | 78.4 | 78.6 | 81.2 |
| 95 | 86.5 | … | 83.3 | 75.0 | 85.4 |
| 159 | 85.4 | … | 90.0 | 86.9 | 90.0 |
| 171 | 84.0 | … | 78.7 | 86.6 | 83.7 |
| 183 | 80.4 | 84.0 | 82.9 | 76.9 | 75.5 |
| 201 | 80.9 | 84.8 | 79.9 | 80.6 | 73.6 |
| 329 | 81.3 | 85.5 | 78.4 | 79.1 | 80.4 |
| 416 | 81.1 | 85.2 | 77.4 | 69.3 | 56.0 |
| 593 | 83.2 | … | 76.4 | 72.3 | 81.7 |
| 847 | 81.2 | 85.4 | 74.6 | 79.2 | 76.2 |
| 906 | 80.9 | 84.8 | 75.7 | 81.3 | 69.6 |
| 922 | 84.2 | … | 83.5 | 84.6 | 82.6 |
| 936 | 85.7 | … | 66.6 | 70.2 | 86.4 |
| 1003 | 82.5 | 89.1 | 81.1 | 81.5 | 63.5 |
Notes. Column (1): CIG name. Columns (2) and (3): inclination computed assuming a flat disc (see equation 1) and taking into account the galactic thickness (see equation 3), respectively, using the optical ellipse’s semi-axes available in NED in both cases. Columns (4)–(7) inclination computed taking into account the galactic thickness (see the relation 3), using the ellipses fitted to the 1σ and 3σ level of the NIR image and to the one fitted to the brightness level |$\mu _{\mathrm{{\it \mathrm{ NUV}}}}=28\, \mathrm{mag\, arcsec^{-2}}$| of the NUV image. In column (3), by using the flattening constant q0 = 0.13 determined by Hall et al. (2012), the lower limit of ellipticity 1 − ε = 0.13, for which equation (3) is valid, is exceeded by some of the galaxies in our sample in the optical band.
When computing the inclination, particular cases showing Δi ≳ 10° with respect to the optical inclination were detected. Inclinations computed with the NIR 3σ isophotal level presented four particular cases: CIG 95, 416, 593, and 936, which have a bright central bulge dominating the NIR emission. In the case of the NUV emission, the particular cases are CIG 201, 416, 906, and 1003, which have the most extended UV haloes and the largest filaments above the disc. In contrast, CIG 936 is the only one particular case obtained for the NIR 1σ isophotal level. The galaxy CIG 936 (Fig. E12) is an extreme case in our sample displaying its NIR and Hα emission concentrated in the inner central ∼30 arcsec (∼6.3 kpc) of a disc with optical diameter of D25(B) = 185.4 arcsec (∼38.9 kpc). This galaxy might be compared with the Sombrero galaxy (NGC 4594), an S0 galaxy whose bulge governs the axial ratio (e.g. Hall et al. 2012), though we cannot consider CIG 936 an early-type system whilst its disc is dominated by the UV emission, tracer of the young stellar population. The results previously described seem to indicate that the apparent discrepancies in the inclination values determined using images in different wavelengths are due to actual asymmetries of the old stellar disc and the presence of an extended UV disc and halo.
In conclusion, inclination measurement is essential for unravelling the complex structures of galactic components, in particular UV extended discs and haloes. By applying different stellar population tracers, this study allowed us to better separate these different components.
5 RESULTS
In this section, we present individual results obtained by comparing properties of the DSS R-band, the 2MASS Ks-band, the GALEX NUV and FUV images versus the Hα monochromatic map from FP GHASP data. For each galaxy, we indicate the old stellar population disc using the ellipse fitting to the isophotal level at 3σ on the background of the 2MASS Ks-band image, and we trace the young stellar population using both the ellipse corresponding to the |$\mu _{\mathrm{{NUV}, {FUV}}}=28\, \mathrm{mag\, arcsec^{-2}}$| and the 1σ isophote of the GALEX NUV and FUV images. An example is shown in Fig. 3.
CIG 71 (UGC 1391). The Hα monochromatic map shows a discontinuous disc mainly shifted southwards from the photometric centre of the NIR band exceeding the radius of the old stellar disc. A prominent and luminous knot is observed at ∼30 arcsec southwards from the NIR photometric centre. The Ks-band image shows a symmetrical disc within the ellipse fitted to the 3σ brightness level, but the disc becomes more extended and warped towards the south. The FUV emission is concentrated near the galactic disc centre and then spreads southwards at lower brightness. This map also shows an FUV emission cloud in the north. The NUV emission displays a continuous disc extended along the major axis beyond the old stellar population disc. The photometric centre does not match with the Hα, NUV, and FUV emission maxima. The isolation criteria of Verley et al. (2007b) placed CIG 71 outside the isolation plane (see Fig. 2), which was confirmed using H i emission by Jones et al. (2018). Moreover, we observed that CIG 71 has common features observed in interacting galaxies (e.g. NGC 5258 from KPG 389, Fuentes-Carrera et al. 2019). Likely, this galaxy experienced an interaction despite its nearest neighbour is 384 kpc away (see Table 2).
Remaining galaxies are discussed in Appendix D.
6 DISCUSSION
In the following, we discuss our findings at the light of the current literature focusing on three aspects: the stellar and warm gas emission in the disc, the detection of extraplanar warm gas emission and the extension of the UV emission with respect to NIR and Hα emission.
6.1 The emission in the disc
In this work, we have examined the location of both the old and young stellar population in order to determine the boundaries of the galactic disc in highly inclined galaxies to reveal the existence or lack of a gaseous extraplanar component. Since in late-type galaxies the old and young stellar populations are mixed in the disc and arms, and to be consistent with previous photometric results (see e.g. Jarrett et al. 2003), we normalized the stellar disc using the ellipse fitted to the 3σ on the background level of the NIR image, which delimits the region occupied by both old and young stellar populations.
None the less, the definition of the galactic disc, which is used to find an extraplanar component, is not immediately obvious. In Figs 3, and Figs E1–E13, we plot the DSS R-band image of galaxies in our sample to compare images in different wavelengths with the optical one. We observe that the radius of the R-band image is larger than the radius of the isophotal |$20 \, \mathrm{mag\, arcsec^{-2}}$| radius in Ks band. In fact, Jarrett (2000) compared the Ks-band to optical-band (B-band) imaging properties (size, total flux, central surface brightness, and elongation) in order to understand the stellar light coming from different components. He found that the K-band elliptical isophotal diameter corresponding to |$\mu _{K}=20 \, \mathrm{mag\, arcsec^{-2}}$| surface brightness (D20) represents about 70 per cent of the optical radius measured at |$\mu _{B}=25 \, \mathrm{mag\, arcsec^{-2}}$|, showing that the NIR sensitivity decreases for the later-type (i.e. ‘blue’) galaxies, and concluding that as late-type galaxies evolve, their cores gradually shift towards reddening and brightening, resembling early-type discs or spheroids. Certainly, the Ks band predominantly traces the oldest stellar population (stars older than ∼4 Gyr, Fingerhut et al. 2010, and references therein), while optical bands like R or B band are more sensitive to the younger, bluer stars. Therefore, it is expected that Ks-band measurements correspond to a smaller region. Since our main goal is to study the extraplanar ionized gas component in edge-on galaxies, we use 2MASS Ks-band imagery looking specifically the location of the old stellar population, tracer of the galactic fundamental structure, with the aim of isolating the oldest stars from the effects of young, blue stars.
On the other hand, the Wide-field Infrared Survey Explorer (WISE) have completed an MIR survey of the entire sky in bands centered at wavelengths of 3.4, 4.6, 12, and 22 |$\mu$|m. However, its angular resolution of 6.1, 6.4, 6.5, and 12.0 arcsec at these bands respectively (e.g. Wright et al. 2010; Jarrett et al. 2012), is notably inferior compared to the higher angular resolution of 2.0 arcsec achieved by the 2MASS for the Ks-band images. Therefore, the selection of the narrow-band Ks-band imagery for our analysis offers a clear advantage over the DSS R-band or WISE data, as it allows a more precise distinction of the galactic components we are interested in studying in the galaxies in our sample. This choice allows us to discriminate between galactic disc emission and extraplanar emission, providing us with more solid basis for our analysis and interpretation of the eDIG in galaxies of our sample.
Considering that the mass of our galaxy sample ranges between 109 and |$10^{10}\, {\rm M}_{\odot }$| (see Table 7), one might infer that our galaxies are dwarf galaxies with fainter emission in older stellar populations. To explore the classification of dwarf galaxies, we compare our sample with the dwarf irregular (dI) galaxies from Fingerhut et al. (2010)’s survey. First, it is worth noting that most of these dI galaxies were too faint to be detected by the 2MASS, implying magnitudes of K ≥ 13.5 mag (Jarrett 2000; Jarrett et al. 2000, 2003). Secondly, the mass range of their dI sample falls between 107 to |$10^{9}\, {\rm M}_{\odot }$| (McCall et al. 2012). In contrast, our sample consists of galaxies with apparent Ks-band magnitude K ≤ 13.5 mag (see selection criteria in Section 2), exhibiting masses one order magnitude higher and having been previously studied in the context of the 2MASS LGA and the 2MASS Extended Source Catalogue. This prior analysis ensures that our galaxies are indeed extended objects with bright NIR photometry. Therefore, in the context of Fingerhut et al. (2010), our sample does not align with the category of dwarf galaxies. Since we are not studying dwarf galaxies, we could claim that the surface brightness isophote at 3σ of the Ks-band image, selected to trace the stellar disc, encompasses the light of both the bulge and the disc.
Maximum radial (r) and vertical (z) distance reached by the extraplanar component in UV and Hα emission.
| MIR | NUV | FUV | Hα | Hα | Morphological | ||||
|---|---|---|---|---|---|---|---|---|---|
| CIG | M* | z | r | z | r | z | r | eDIG morphology | features |
| name | (109 M⊙) | (kpc) | (kpc) | (kpc) | (kpc) | (kpc) | (kpc) | ||
| (1) | (2) | (3) | (4) | (5) | (6) | (7) | (8) | (9) | (10) |
| 71 | 14.1 | 4.2 | 8.8 | 2.0 | 3.9 | 1.2 | 4.7 | E(r) | A, Ph, UV, |
| 95 | 3.6 | 1.8 | 12.1 | 1.8 | 12.1 | 1.8 | 10.4 | E(r), H ii-R | Ph, UV |
| 159 | 3.8 | 1.4 | 10.7 | ... | 1.7 | 0.5 | 9.6 | E(r), H ii-R | W, L(Hα), L(FUV), T |
| 171 | 1.4 | 1.9 | 6.2 | ... | 5.6 | ... | 4.8 | E(r), H ii-R | A, UV |
| 183 | 8.1 | 4.5 | 8.0 | 2.6 | 8.0 | 2.8 | 8.0 | E(r)(z), H ii-R, P | A, W, K, Ph |
| 201 | 5.1 | 2.3 | 10.0 | 2.3 | 8.9 | 1.8 | 8.7 | E(r)(z), P, F | A, K |
| 329 | 31.8 | 3.3 | 8.1 | 1.8 | 6.2 | 1.7 | 4.1 | E(r)(z), F | B, A, UV |
| 416 | 2.6 | 1.2 | 7.1 | 1.1 | 6.2 | 1.0 | 2.9 | E(r)(z), H ii-R, F | A, K, UV |
| 593 | 12.1 | 2.5 | 13.0 | 2.1 | 11.0 | 1.6 | 9.3 | H ii-R | A, W, UV, L(Hα) |
| 847 | 11.9 | 0.9 | 8.3 | 1.0 | 8.6 | 0.3 | 4.3 | E(r), H ii-R | W, K, Ph |
| 906 | 5.1 | 3.1 | 8.0 | 2.9 | 8.0 | ... | 1.4 | F | Ph, UV, L(Hα) |
| 922 | 4.3 | 1.9 | 9.1 | 1.5 | 9.1 | 1.0 | 4.5 | E(r), H ii-R | A, W, UV |
| 936 | 1.0 | 1.7 | 18.4 | ... | 17.7 | ... | 1.4 | H ii-R | UV, L(Hα), T |
| 1003 | 6.0 | 3.2 | 4.4 | 1.3 | 1.2 | 1.2 | ... | E(z), F | A, W, K, UV |
Notes. Columns: (1) CIG galaxy name; (2) stellar mass (M*) computed with WISE data at MIR band (see equation C1); (3) and (4), (5) and (6), and (7) and (8) averaged maximum radial (r) and vertical (z) distance reached by the extraplanar component at NUV, FUV, and Hα emission, respectively; (9) morphological description of the extraplanar warm gas component or eDIG: E: extended emission in radial (r)- or vertical (z)-direction mostly, P: patches, F: filaments, H ii-R: extraplanar H ii region; (10) morphological features in different wavelengths: B: bar, A: asymmetric disc, W: warped disc, K: multiple inner emission knots, Ph: unmatching photometric maxima, UV: disc dominated by the UV halo, L(λ): Low emission detected in the wavelength band λ. T: thin disc structure.
Inside the ellipses fitted to the 3σ level of the 2.22 |$\mu$|m images, we observed regular discs, while the isophote at 1σ level shows that the old stars at the borders follow the shape of the halo. For instance, the faintest NIR emission in CIG 71 suggests that the old stars are displaced to the south as well as the Hα emission, and in CIG 201 the faint old stars trace the same shape of the filamentary structure outlined by the Hα and UV emission. Regarding the behaviour of the B4 parameter versus the major axis relation (see Section 4), in most galaxies the pattern of the curve changes increasing its dispersion from the radial position of the 3σ level. This is more evident in CIG 71, 171, 329, 847, and 936. While a similar break in the UV surface brightness profiles is traced at the radial position of the isophote at 1σ level of the Ks-band image, as observed in CIG 171, 201, and 906. This break in the surface brightness profiles could define the edge of the stellar disc, however, we still relay in our selection because of the better resolution of the 2MASS than the one of the GALEX images (see Section 3). Moreover, for some galaxies as CIG 329, 922, or 1003, if the stellar disc is defined by the the isophote enclosing |$\mu _{K}=20\, \mathrm{mag\, arcsec^{-2}}$| (1σ level), they would appear to be dominated by an old stellar disc and no extraplanar gas would have been detected. In this way, besides to the environmental criteria adopted for selecting a sample, the paradox in selecting the edge of the stellar disc might be another parameter causing discordance in the published results regarding the detection of eDIG.
We have found a variety of morphologies in different wavelengths in galaxies of our sample. With respect to the old stellar population disc, most of the Ks-band images (12 out of 14) showed regular discs with a central bulge and some small filaments along the disc that do not break the stellar disc symmetry in general. Two galaxies showed an asymmetric or perturbed stellar disc: CIG 416 (Fig. E7) presenting a tail shape drawn in its Ks-band image, and CIG 593 (Fig. E8) with a truncated old stellar disc that follows the morphology of the disturbed and faint Hα disc.
On the other hand, the only one galaxy in our sample reliably identified as LINER (low-ionization nuclear emission-line region, Sabater et al. 2012) and whose photometric analysis revealed a coefficient B4 < 0 suggesting a ‘boxy’ bulge is CIG 329 (Fig. E6). Although it is difficult to detect a bar in edge-on galaxies, a plausible explanation could be that there is a bar in CIG 329 which may have undergone a vertical bending instability to form this box-shaped bulge. It is well known that two-thirds of star-forming disc galaxies in the Local Universe are barred (e.g. Eskridge et al. 2000; Whyte et al. 2002; Aguerri, Méndez-Abreu & Corsini 2009; Masters et al. 2011). Numerical simulations of isolated galaxies have shown that a stellar bar can be formed spontaneously (see e.g. Miller, Prendergast & Quirk 1970; Hohl 1971; Combes & Sanders 1981; Sellwood & Wilkinson 1993; Athanassoula 2003; Athanassoula, Machado & Rodionov 2013; Sellwood 2013; Saha & Elmegreen 2018; Ghosh et al. 2023), but also, that a bar can be formed by a 1:1 prograde flyby interaction and remain several Gyr after the interaction when galaxies are already separated by several Mpc (e.g. Lang, Holley-Bockelmann & Sinha 2014). If the stellar bar of CIG 329 was formed by a secular process, why has no bar formed in other galaxies in our sample? It might be that these galaxies are hostile to bar formation or that the bar has been destroyed in the course of their evolutionary pathways. Indeed, the presence of a massive central bulge can suppress the bar instability (e.g. see Kataria & Das 2018; Saha & Elmegreen 2018). Alternatively, bars can be destroyed by a massive central mass concentration and/or inflow of the interstellar gas in the central region (e.g. see Pfenniger & Norman 1990; Shen & Sellwood 2004; Athanassoula, Lambert & Dehnen 2005; Bournaud, Combes & Semelin 2005; Hozumi & Hernquist 2005; Athanassoula et al. 2013). Furthermore, recent study by Ghosh et al. (2021) revealed that a minor merger can lead to a substantial weakening of bars, and in extreme cases, even a complete destruction of bars in galaxies.
Since most of the galaxies in our sample showed extraplanar material in both UV and Hα emission, in the next sections, we discuss some general results from the sample in order to understand the origin of the eDIG and UV-haloes detected.
6.2 The eDIG detection
In general, not all edge-on galaxies show detectable eDIG emission, that is, a gaseous halo above the layer of H ii regions associated with the disc. The presence of eDIG in late-type spirals is a direct consequence of SFR in the underlying galactic disc (e.g Rossa & Dettmar 2000, 2003a). It has been found that the prominence of gaseous haloes correlates with tracers of SF in the disc, such as the surface density of FIR emission, the SFR determined by Hα luminosity, and dust temperatures (e.g. Heald et al. 2006a; Lu et al. 2023). For instance, Rossa & Dettmar (2000) constructed a diagnostic DIG diagram (DDD) that shows the ratio of the flux densities at 60 and 100 |$\, \mu$|m expressed as S60/S100 versus the ratio of the FIR luminosity (LFIR) divided by the optical diameter of the |$25\, \mathrm{mag\, arcsec^{-2}}$| isophote squared (|$D_{25}^{2}$|), with which they demonstrated that galaxies suggesting features associated with starburst activity as S60/S100 ≥ 0.4 and |$L_{\mathrm{ FIR}}/D_{25}^{2}\simeq 1\times 10^{40}\mathrm{erg\, s^{-1}\, kpc^{-2}}$| are candidates to display eDIG layers.
In order to locate our sample in the DDD, we computed the FIR luminosity using the expression:
with Sν(60) and Sν(100) in Jy (obtained from Lisenfeld et al. 2007 and presented in Table 1) and d the distance to the galaxy in Mpc (Rossa & Dettmar 2003a). The term |$D_{25}^{2}$| was expressed in kpc2.
From our maps, showed in Section 5 and Appendix E, we detected galaxies showing one or more morphological eDIG features (see e.g. Rossa & Dettmar 2003a; Heald et al. 2006a; Rosado et al. 2013), summarized in Table 7. The brightest H ii regions in Local Group galaxies have a surface brightness detection between magnitude orders of 10−14 and |$10^{-15}\, \mathrm{erg\, s^{-1}\, cm^{2}\, arcsec^{-2}}$| (e.g. Hodge & Lee 1990; Azimlu, Marciniak & Barmby 2011; Cedrés et al. 2012), while the estimated mean sensitivity for the eDIG observed in other galaxies, such as NGC 891 or NGC 4565, is on the order of |$10^{-18}\, \mathrm{erg\, s^{-1}\, cm^{2}\, arcsec^{-2}}$| (e.g. Rand 1996; Rossa & Dettmar 2003b; Ho et al. 2016; Jones et al. 2017). For this work, the surface brightness detection limit of GHASP is |$2.5\times 10^{-17}\, \mathrm{erg\, s^{-1}\, cm^{2}\, arcsec^{-2}}$| (Epinat et al. 2008; Gómez-López et al. 2019; Sardaneta et al. 2022), which is shallower than needed for detection of the faintest eDIG, but still within an acceptable range of sensitivity to offer a reliable perspective for our study.
By discriminating the Hα emission in z-direction from the galaxies displaying Hα emitting gas extended radially, almost all the galaxies in our sample showed Hα emitting gas extended radially outside from the stellar disc, CIG 1003 being the only exception, whose Hα emission is concentrated in the central regions drawing a cone shape and ionized gas filaments. In the vertical direction, the Hα monochromatic maps display eDIG configurations such as filamentary structures in CIG 71, 329, 593, and 1003; layers of diffuse gas in CIG 201, 329, and 416; and patches or detached clouds of ionized gas emission in CIG 95, 159, 593, 922, 847, and 1003. In some cases, the ionized gas falls in the outskirts of the stellar disc tracing a warped structure likely from a recent interaction as in CIG 71 and 183. We have not detected any extraplanar Hα emission in the vertical direction in CIG 171, 906, and 936.
As shown in the top left panel of Fig. 4, we compare the position in the DDD of our galaxies with those in the Rossa & Dettmar (2003a) sample which contains 62 spiral galaxies with inclination i > 76°, an optical diameter of 3 ≤ D25 ≤ 12 and radial velocity |$V_{\mathrm{ rad}}\le 6000\, \mathrm{km\, s^{-1}}$|, all of them detected with IRAS in the FIR. We must consider that when defining extraplanar emission, Rossa & Dettmar (2003a) did not distinguish between radially or vertically extended Hα emission. In this case, all our galaxies would have eDIG. To ensure a more reliable comparison, in Fig. 4, we differentiate between galaxies in our sample with and without vertically extended Hα emission.
Fig. 4 shows that 6 out of 14 galaxies (42 per cent) of our sample lie above the threshold of warm galaxies at S60/S100 ≥ 0.4 (horizontal dashed line). Half of these galaxies, namely CIG 71, 936, and 1003, are located outside the region of bona fide isolated galaxies of the AMIGA sample (see Fig. 2). In this context, we explore the possibility that eDIG incidence is correlated with the environment. In fact, Lisenfeld et al. (2007) found that the value of S60/S100 of the AMIGA sample is lower than the one of interacting samples from the literature indicating that the interaction can increase the dust temperature. The panel (a) of Fig. 4 also shows that our sample and the Rossa & Dettmar (2003a) sample share a similar distribution: galaxies with eDIG from both samples populate the entire plane.
Rossa & Dettmar (2003a) rejected galaxies in compact groups but included widely spaced pairs of galaxies. We associated an environmental classification to their sample using NED and Simbad19 databases, by distinguishing groups, galaxy pairs and relatively isolated galaxies, whereby galaxies with siblings at a distance at d < 1° were included in galaxies belonging to a galactic group and, galaxies with siblings at d > 1° and galaxies with no record were considered isolated (see Table F1). These subsamples are plotted in the (b)–(d) panels of Fig. 4. Rossa & Dettmar (2003a) detected eDIG in 5 out of 9 (56 per cent) paired galaxies and in 21 out of 34 (62 per cent) galaxies in groups: that is, in 26 out of 45 (58 per cent) interacting galaxies, while, for the subsample of isolated galaxies, the eDIG was detected in 10 out of 19 (53 per cent) targets. If we do not distinguish between radial and vertically extended emission, we detected Hα emission extended outside the disc in all galaxies in our sample. However, due to the inaccuracies that may exist in the definition of the stellar disc (see Section 4), we consider having detected eDIG only in 11 out of 14 galaxies (79 per cent) where the diffuse ionized gas extends out of the disc vertically.
From the comparison with the entire sample of Rossa & Dettmar (2003a), we suggest that the environment is not connected with the presence of the eDIG. Confirming that the incidence of eDIG in late-type spirals is a direct consequence of the SFR in the underlying galactic disc as found by Rossa & Dettmar (2003a). The interaction could trigger the SFR for a short period of time. However, we also detect eDIG in a high percentage of galaxies that have been isolated for a long period of time.
6.3 The UV halo
From the comparison between the Hα and the UV imagery, Thilker et al. (2007) discovered that 30 per cent of low inclined galaxies (i < 80°) in the Local Universe present extended UV emission in the extreme outer disc where the number of H ii regions expected is negligible with respect to the UV emission regions. In the case of high inclined galaxies (i > 80°), extended diffuse UV emission up to 15–20 kpc above the disc mid-plane has been detected (e.g. Hodges-Kluck & Bregman 2014), which always coincides with the presence of the extraplanar Hα emission, although sometimes the ionized gas component is only detected at lower heights (Hodges-Kluck et al. 2016; Jo et al. 2018).
From the individual maps displayed in Fig. 3 and Figs E1–E13, we found that all galaxies in our sample present radial or vertically extended NUV emission, that all galaxies have radially extended FUV emission, and that 11 out of 14 galaxies show vertically extended FUV emission. These 11 galaxies displaying UV halo agree with the galaxies in our sample showing diffuse ionized gas extended out of the disc vertically (eDIG, see Table 7). We also observed that in most galaxies in our sample presenting the ionized gas extraplanar component, the Hα and UV emissions have very similar morphology and the UV halo persists reaching larger heights where the ionized gas is no longer detected, as observed previously by Hoopes et al. (2001) and Hodges-Kluck et al. (2016). And, finally, even in galaxies where we did not observe any extraplanar (z-axis direction) Hα emission (CIG 159, 171, and 936), we still have detected an UV halo in the NUV emission.
We found that 7 out of 14 (50 per cent) galaxies of our sample showing a radially extended UV disc presented at least one feature of what could be perceived as a recent interaction such as disturbed ionized gas disc (CIG 71, 95, 171, 183, 416, 593, and 847) and/or mismatch of the gaseous and stellar maxima (CIG 71, 95, 183, 593, and 847) suggesting that the environment might be a potential cause of these events, even within isolated galaxies. From studies to low-inclined galaxies, it has been proposed that the extended UV disc might be a consequence of young stars associated with low-mass stellar associations located at large galactocentric distances (Gil de Paz et al. 2007b) which were likely triggered by recent/ongoing interaction events or a high specific rate of gas accretion (Thilker et al. 2007). However, it is assumed that isolated galaxies have not experienced gravitational influences from its close neighbours over the past few billion years (e.g. Verdes-Montenegro et al. 2005; Karachentseva et al. 2010; Rampazzo et al. 2016). Moreover, the lack of signals from a short-term event as a past major merger implies that the mechanism that supplies the gas needed to form the UV extension has been working for a prolonged duration to achieve this level of richness (Thilker et al. 2007). Studying UV photometry of cluster galaxies, Cortese et al. (2012) interpreted the extended UV emission as the result of the consumption of their H i reservoir, inferring that this growth could be stopped and even reversed if the atomic hydrogen is removed via some kind of environmental effect. Therefore, the observed UV extension could potentially be the result of scattering dust particles stemming from ongoing regions of SF (see e.g. Shinn & Seon 2015), potentially introducing attenuation effects that shape the observed UV emission.
We observed that the UV halo (vertically extended UV emission) in galaxies CIG 201, 329, and 1003 does not trace a structured disc, these haloes are more extensive and have complex filamentary structures that match the Hα and NIR morphology. Moreover, the NIR, Hα, and UV emission detected in CIG 201 and 1003 shows signs of a cone-shape suggesting the presence of a central outflow (see individual galaxy notes in the Appendix D). From the comparison between UV and NIR imagery, it has been shown that UV halo along the major axis relative to the optical radius R25 is unrelated to the prominence of the bulge and, therefore, the radially concentrated UV haloes are unlikely light from the bulge outskirts (Hodges-Kluck et al. 2016). In the case of CIG 201, 329, and 1003, the UV diffuse emission might be expected as a result of scattered UV light that escape from the disc dust (diffuse extraplanar dust, eDust) or emission from hot core-helium-burning stars (Hoopes et al. 2005). The simultaneity between the eDust and the extraplanar Hα emission suggests that a large fraction of the Hα emission could be originated from the galactic plane and is scattered by the eDust into the galactic halo (Hoopes et al. 2005; Seon et al. 2011; Jo et al. 2018).
On the other hand, the existence of an UV halo does not always mean the existence of eDust (e.g. Shinn 2019). We observed that in 10 out of 14 galaxies (71 per cent) of our sample presenting an UV halo (CIG 71, 95, 159, 171, 183, 416, 593, 847, 906, and 922), the UV light reveals an intense brightness and a vertical extension above the galactic centre, which gradually decreases with increasing distance from the galactic centre, rather indicating a disc extended structure. Other possible mechanisms producers of diffuse-and-global UV haloes are galactic radiation, (magneto-)hydrodynamic phenomena or accretion from the CGM or ICM (Hodges-Kluck & Bregman 2014; Shinn & Seon 2015; Hodges-Kluck et al. 2016; Shinn 2019). Conversely, Hodges-Kluck et al. (2016) observed that the UV haloes are brightest over the parts of the disc with bright Hα, X-ray, or radio emission, suggesting that they are connected to SF in the disc, but not necessarily in a way that requires ionizing photons or winds to escape the disc.
Previous studies about the origin of the eDIG have found regions consistent with mixed OB and hot low-mass evolved stars (HOLMES), and OB–shock ionization as the primary driver of eDIG ionization (Flores-Fajardo et al. 2011; Jones et al. 2017; Levy et al. 2019; Rautio et al. 2022). The NUV light is dominated by stars in the turn-off point in the Hertzprung-Russel diagram (turn-off stars), while, the FUV emission of old ‘normal’ stellar populations is dominated by post-asymptotic giant branch (PAGB) stars (e.g. Marino et al. 2011b). HOLMES, which include PAGB stars and white dwarfs, are found abundantly in the thick discs and lower haloes of galaxies. Their considerable vertical distribution compared to OB stars and their significant contribution to the UV radiation of galaxies (see e.g. Rautio et al. 2022, and references therein), make them candidates to be a source of eDIG ionization and, consequently, of UV haloes.
However, while late-type galaxies in nearby groups, observed from various inclination angles (ranging from 58° to 90°), display FUV and NUV images practically identical (e.g. Marino et al. 2010), our isolated galaxies, as previously noted in early-type galaxies, reveal that the FUV emission appears more compact and luminous compared to the NUV emission (e.g. Jeong et al. 2007, 2009; Rampazzo et al. 2007; Gil de Paz et al. 2007a; Marino et al. 2010, 2011a, b). Following Cortese et al. (2012), if the extended UV emission arises from the conversion of atomic hydrogen gas into new stars, it suggests that the stellar population is becoming younger or more metal poor. As a result, the turn-off stars shift to bluer colours and higher luminosity, increasing the NUV emission. Simultaneously, the contribution to the FUV from PAGB stars decrease because, despite their higher luminosity, the duration of the PAGB phase gets much shorter due to decreased available fuel (Marino et al. 2011b).
In summary, the nature of UV haloes in galaxies are subject to a complex interplay of factors, including SF, ionization processes, and possible CGM or ICM contributions. Further investigation of the specific mechanisms driving UV haloes is needed to fully understand their origin and importance in different galactic environments.
7 SUMMARY AND CONCLUSIONS
Isolated galaxies constitute a reference model to study the environmental influence on galaxy evolution. In this work, we studied the environmental impact on the incidence of eDIG in a sample of 14 nearby (z ≤0.02) isolated late-type edge-on (i ≥ 80°) galaxies from the CIG (Karachentseva 1973). We presented the Hα emission maps of galaxies in our sample with data obtained from the scanning FP interferometer, GHASP, offering a complete two-dimensional coverage of the emitting line region. We aimed to determine the galactic plane and to examine the distribution of the warm gaseous component with respect to the old and young stellar populations. Thus, we compared monochromatic Hα images with the NIR 2MASS Ks-band and UV from GALEX archive images.
We started by defining the stellar disc using the ellipse fitted to the 3σ on the background level of the 2MASS Ks-band image, which delimits the region occupied by both old and young stellar populations. However, we are aware of selecting the boundary of the stellar disc might be another parameter causing discordance in the published results regarding the detection of eDIG. Thus, we consider having detected eDIG only in the 11 out of 14 galaxies (79 per cent) where the diffuse ionized gas extends out of the disc vertically. If we do not distinguish between radial and vertically extended emission, we would have detected Hα emission extended outside the disc in all galaxies in our sample. In this case, we demonstrated that our sample is comparable to the broader sample studied by Rossa & Dettmar (2003a) when studying the incidence of eDIG.
We found that all galaxies in our sample present extraplanar NUV emission in both radial and vertical directions. While 11 out of 14 galaxies (79 per cent) have vertically extended FUV emission, the same galaxies presenting eDIG. Because we showed that at least 79 per cent (∼2/3) of isolated late-type, high inclined galaxies have both extended UV discs and haloes, our study reinforces the observations made by Thilker et al. (2007) who found that one-third of the low-inclined galaxies in the Local Universe have extended UV discs. Hence, suggesting that the oldest SF occurring between ∼10 and 100 Myr extends well beyond the disc defined by the Hα map which only traces the most recent SF (younger than 10 Myr).
We find that the PA obtained with NIR, optical, and NUV images varies on average ΔPA≃ ±2.5°, which is expected for galaxies that have not experienced strong interactions in the last billions of years. However, when computing the inclination, some cases showed Δi ≃ ±10° with respect to the optical inclination as a consequence of the presence of old stellar population centralized discs and UV extended discs and haloes.
Our study suggests that the eDIG is revealed in a significant fraction of galaxies (79 per cent of the galaxies presented Hα emission vertically extended) which have been isolated from a long period of time. When compared with the generic sample of highly inclined galaxies by Rossa & Dettmar (2003a) we did not find evidence that the environment plays a role in the presence of the eDIG incidence. This confirms that the presence of eDIG in late-type spirals is a direct consequence of the SFR in the underlying galactic disc as suggested by Rossa & Dettmar (2003a).
We foresee to discuss the Hα kinematics of the galaxies in our sample in a forthcoming paper. Furthermore, since GALEX images are quite faint we are acquiring Astrosat-UVIT (Tandon et al. 2017) pointed observations of our galaxies in the FUV band.
ACKNOWLEDGEMENTS
Based on observations taken with the GHASP spectrograph at the Observatoire de Haute Provence (OHP, France), operated by the French CNRS. The authors acknowledge the technical assistance provided by the late Olivier Boissin ✝ from LAM and the OHP team before and during the observations, namely the night team: Jean Balcaen, Stéphane Favard, Jean-Pierre Troncin and Didier Gravallon, and the day team led by François Moreau. This research has made use of the NASA/IPAC Extragalactic Database (NED), which is operated by the Jet Propulsion Laboratory, California Institute of Technology, under contract with the National Aeronautics and Space Administration. This research has made use of the SIMBAD database, operated at CDS, Strasbourg, France. MMS thanks the ‘Programa de Becas Posdoctorales en la UNAM’ of DGAPA-UNAM. MR acknowledges the project CONACYT CF-86367. IFC acknowledges the financial support of SIP-IPN grant no. 20232054.
DATA AVAILABILITY
The data used in this work can be found online on the data servers of The STScI DSS,20 2MASS,21 and GALEX.22 The FP data underlying this article will be shared on reasonable request to the corresponding author.
Footnotes
Sydney-AAO Multi-object Integral field spectrograph (SAMI).
Mapping Nearby Galaxies at Apache Point (MaNGA).
Calar-Alto Legacy Integral Field Area (CALIFA).
Continuum haloes in Nearby Galaxies – an EVLA Survey (CHANG-ES).
Catalogue of galaxies and of clusters of galaxies (CGCG, Zwicky, Herzog & Wild 1968), (https://cdsarc.cds.unistra.fr/viz-bin/cat/VII/190).
Analysis of the interstellar Medium of Isolated GAlaxies (AMIGA, http://www.iaa.es/AMIGA.html/).
Interactive Data Language, ITT Visual Information Solutions (https://www.l3harrisgeospatial.com/Software-Technology/IDL).
‘Analyse et Depouillement Homogene des Observations Cigale for Windows’ (http://cesam.lam.fr/fabryperot/index/softwares) developed by J. Boulesteix at Marseille Observatory in 2005.
‘Image Reduction and Analysis Facility’ (http://iraf.noao.edu/).
SAO Image DS9. An image display and visualization tool for astronomical data (Joye & Mandel 2003) (https://sites.google.com/cfa.harvard.edu/saoimageds9).
The DSSs were produced at the STScI under U.S. Government grant NAG W-2166. The images of these surveys are based on photographic data obtained using the Oschin Schmidt Telescope on Palomar Mountain and the UK Schmidt Telescope. The plates were processed into the present compressed digital form with the permission of these institutions (https://archive.stsci.edu/cgi-bin/dss_form).
2MASS Data Release Documentation, (https://irsa.ipac.caltech.edu/data/2MASS/docs/releases/docs.html).
Section VI.4.a of the Explanatory Supplement to the 2MASS All Sky Data Release and Extended Mission Products (https://www.ipac.caltech.edu/2mass/releases/allsky/doc/sec6_4a.html).
Section Instrument and Calibration of the GALEX Guest Investigator Web Site (https://asd.gsfc.nasa.gov/archive/galex/FAQ/counts_background.html).
photutils is an open source python package affiliated of astropy that primarily provides tools for detecting and performing photometry of astronomical sources (https://photutils.readthedocs.io/en/stable/index.htmlhttps://photutils.readthedocs.io/en/stable/api/photutils.isophote.Ellipse.html).
Explanatory Supplement to the 2MASS All Sky Data Release and Extended Mission Products IV (https://www.ipac.caltech.edu/2mass/releases/allsky/doc/explsup.html). 2MASS Data Processing. 5. Extended Source Identification and Photometry (https://www.ipac.caltech.edu/2mass/releases/allsky/doc/sec4_5e.html).
GALEX Guest Investigator Web Site (https://asd.gsfc.nasa.gov/archive/galex/FAQ/counts_background.html).
‘The SIMBAD astronomical database’ (Wenger et al. 2000).
The STScI Digitized Sky Survey (https://archive.stsci.edu/cgi-bin/dss_form).
Two Micron All Sky Survey (2MASS) (https://irsa.ipac.caltech.edu/Missions/2mass.html).
Galaxy Evolution Explorer (GALEX) (https://archive.stsci.edu/missions-and-data/galex).
The Herschel Reference survey (HRS; Boselli et al. 2010).
A Virgo Environmental Survey Tracing Ionised Gas Emission (VESTIGE; Boselli et al. 2018).
References
APPENDIX A: SPATIAL SIGNAL ENHANCEMENT
To enhance the spatial SNR, we employed two techniques on the wavelength data cubes. First, we implemented adaptive spatial binning through VT (Cappellari & Copin 2003; Daigle et al. 2006a, b), aiming for a target SNR of approximately 5 or 7. Additionally, we applied a Gaussian smoothing with an FWHM ≃ 2 arcsec (3 pixel). To maintain an SNR threshold above 5 in the Gaussian smoothed data cube, we performed a comparison between both Hα monochromatic maps and we set a limit for the detected emission in the Gaussian smoothed maps. Since we aim to study the morphology of the eDIG, traced by the Hα line emission, we opted to utilize the Hα monochromatic map resulting from Gaussian smoothing. This map yields a more comprehensive representation of the morphology of the detected Hα emitting gas, in comparison to the map obtained through spatial binning via VT. To illustrate this technique, Fig. A1 presents the Hα monochromatic map for CIG 847 (UGC 11132).
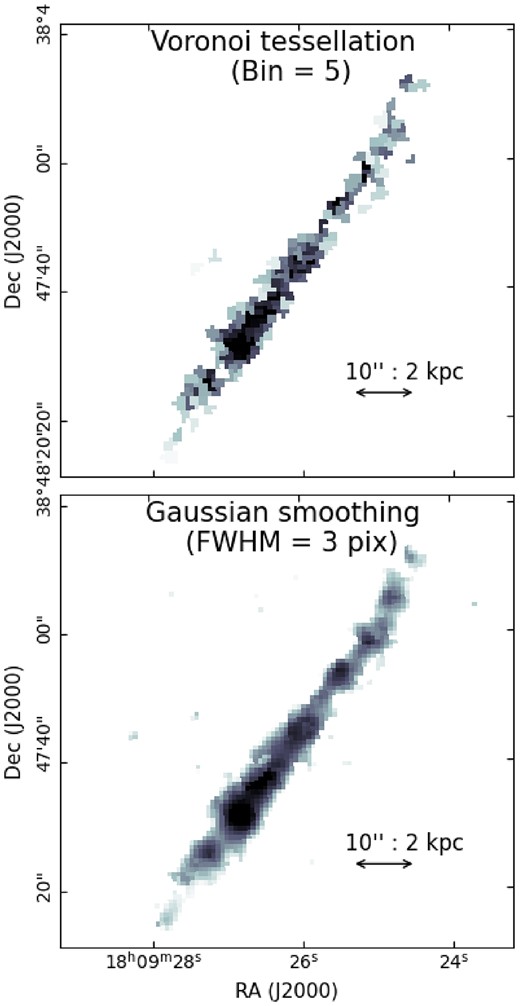
Hα monochromatic map of CIG 847 (UGC 11132) obtained after being applied a VT with SNR ≃ 5 (top panel) and a spatial Gaussian smoothing with FWHM ≃ 2 arcsec (3 pixel) (bottom panel). We use the VT binned map to mask the Gaussian smoothed map to ensure that all regions of this map have SNR ≥5.
APPENDIX B: CALIBRATION OF THE TOTAL Hα FLUX
As indicated by Epinat et al. (2008), our major scientific goal is not to use the FP technique to make photometric studies but kinematic ones. Therefore, during the observations, we decided not to calibrate our data, saving observing time. On the other hand, there is no Hα calibrated images of galaxies in our sample in the literature yet to compare our targets which would provide us with a more accurate flux range. However, to obtain the total Hα flux of our galaxies, we can follow previous total Hα flux indirect calibrations made by Epinat et al. (2008) and by Gómez-López et al. (2019) for large galaxy samples observed with the same instrument, GHASP.
Epinat et al. (2008) calibrated the total Hα flux of more than 200 galaxies from the GHASP sample by making a linear regression of the comparison between monochromatic FP images of 69 galaxies and images with calibrated fluxes from narrow-band filters including Hα and [N ii] which had been already published. The coefficient of the resulting line is |$0.48\pm 0.06\times 10^{-16}\, \mathrm{W\, m^{-2}\, ph^{-1}\, s}$|, the fitting was forced to pass through the origin for obvious physical reasons. Later, Gómez-López et al. (2019) studied the kinematics of a sample of 152 late-type galaxies from the HRS catalogue.23 In this context, they calibrated indirectly the FP monochromatic Hα maps, this time using the calibrated fluxes from Boselli et al. (2015), obtaining a similar coefficient of the resulting line fitted and a GHASP surface brightness detection limits of |$\sim 2.5\pm 0.2\times 10^{-17}\, \mathrm{ergs\, s^{-1}\, cm^{-2}\, arcsec^{-2}}$| for 2 h exposure time, resulting in objects with an average lower threshold of SNR≥5. This value of surface brightness detection limit was also obtained by Sardaneta et al. (2022) when, studying the kinematics of the eDIG in the ram-pressure stripped Virgo galaxy NGC 4330, compared the GHASP Hα monochromatic image of this galaxy with the deep CFHT Hα image from VESTIGE survey.24
Thus, from the results obtained for galaxies observed with the FP GHASP, we estimated the integrated flux of each galaxy in the sample studied in this work. We list these integrated fluxes in Table B1.
| CIG | Flux | ||
|---|---|---|---|
| name | (photon s−1) | (10−16 W m−2) | (10−15 erg s−1 cm−2) |
| 71 | 0.61 | 0.29 | 2.93 |
| 95 | 0.30 | 0.14 | 1.42 |
| 159 | 0.42 | 0.20 | 2.03 |
| 171 | 0.34 | 0.16 | 1.64 |
| 183 | 0.44 | 0.21 | 2.14 |
| 201 | 1.80 | 0.86 | 8.62 |
| 329 | 0.83 | 0.40 | 3.97 |
| 416 | 0.36 | 0.17 | 1.74 |
| 593 | 0.06 | 0.03 | 0.28 |
| 847 | 0.19 | 0.09 | 0.93 |
| 906 | 0.20 | 0.10 | 0.96 |
| 922 | 0.36 | 0.17 | 1.74 |
| 936 | 0.19 | 0.09 | 0.93 |
| 1003 | 0.26 | 0.12 | 1.23 |
APPENDIX C: STELLAR MASS FROM MIR
WISE is a NASA-funded Medium-Class Explorer mission that consists of a 40 cm space infrared telescope, whose science instrumentation includes 1024 × 1024 pixel2 arrays of Si:As and HgCdTe. WISE mapped the entire sky at 3.4 |$\mu$|m (W1), 4.6 |$\mu$|m (W2), 12 |$\mu$|m (W3), and 22 |$\mu$|m (W4). Each band covers an FoV of |$47\times 47\, \, \mathrm{arcmin^{2}}$| with an angular resolution of 6.0 arcsec in the short bandpass and 12.0 arcsec in the longest one and a 1.375 arcsec pixel scale (Jarrett et al. 2012). We infer the stellar mass using the mass-to-light (M/L) ratio of galaxies (e.g. Korsaga et al. 2019). For low-z galaxies, the stellar M/L has a linear trend with WISE|$W_{1}\, (3.4\, \mu \mathrm{m})-W_{2}\, (4.6\, \mu \mathrm{m})$| colour (Cluver et al. 2014):
with |$L_{W1}(L_{\odot })=10^{- 0.4(M-{\rm M}_{\odot })}$|, where M is the absolute magnitude of the source in W1, M⊙ = 3.24 mag, and W1 − W2 is the rest-frame colour of the source. MIR magnitudes and stellar masses are listed in Table C1.
Stellar mass and luminosity computed with the MIR and FIR magnitudes, respectively.
| CIG | W1 (|$3.4\, \mu$|m) | W2 (|$4.6\, \mu$|m) | M* |
|---|---|---|---|
| name | (mag) | (mag) | (|$10^{10}\, \mathrm{{\rm M}_{\odot }}$|) |
| (1) | (2) | (3) | (4) |
| 71 | 11.42 | 11.32 | 1.41 |
| 95 | 12.59 | 12.53 | 0.36 |
| 159 | 11.06 | 10.93 | 0.38 |
| 171 | 11.58 | 11.18 | 0.14 |
| 183 | 11.99 | 12.01 | 0.81 |
| 201 | 11.10 | 11.01 | 0.51 |
| 329 | 10.46 | 10.53 | 3.18 |
| 416 | 12.40 | 12.28 | 0.26 |
| 593 | 11.44 | 11.48 | 1.21 |
| 847 | 11.28 | 11.18 | 1.19 |
| 906 | 10.83 | 10.58 | 0.51 |
| 922 | 12.03 | 11.95 | 0.43 |
| 936 | 11.57 | 11.36 | 0.10 |
| 1003 | 11.00 | 10.75 | 0.60 |
Notes. Columns: (1) CIG galaxy name; (2) and (3) WISE 3.4 and 4.6 |$\mu$|m colour, respectively; and (4) stellar mass computed using the relation (C1).
APPENDIX D: INDIVIDUAL GALAXIES
We provide the individual notes as discussed in Section 5.
D1 CIG 95 (UGC 1733)
Fig. E1: the Hα map shows a detached cloud from the disc that exceeds radially the old stellar population disc observed in the NIR-band emission. The brightest Hα emission region is much wider than the old stellar disc and exceeds it in the z-direction. The 2.22 |$\mu$|m image reveals a central bulge surrounded by an asymmetric warped old stellar population disc that extends southward. The FUV emission displays an extended and warped disc. The NUV emission traces a well-bound large disc with a brighter southeastern tip and a sharpened, fainter northwestern tip. The Hα, FUV, and NUV emissions match in maxima emission, but it is located to the southeastern edge of the old stellar population disc. From the SDSS optical images, Buta et al. (2019) defined CIG 95 as an Sc warped (see Table 1). Although the galaxy appears to be slightly pulled to the south-east, indicating a possible interaction, CIG 95 meets all the isolation criteria of the AMIGA sample (see Section 2).
D2 CIG 159 (UGC 3326)
Fig. E2: the Hα emission displays a discontinuous disc composed of bright clouds uniformly distributed along the major axis with a size similar to that of the Ks-band 1σ isophote. The Ks-band image of the galaxy shows a large thin warped disc with a central bulge. The GALEX FUV image shows a few faint clouds mostly at the photometric centre. The NUV emission draws a warped disc brighter on the east side than on the west side. The GALEX NUV and FUV images have low SNR which may yield spurious surface brightness profiles. The location of the Hα emission is consistent with the NUV emission. The emission maxima of the four emissions presented in Fig. E2 coincide within ∼5 arcsec. Further spectral data and deeper, higher resolution UV images are required to draw a conclusion about the morphology of this apparently quiescent galaxy. However, Jones et al. (2018) found that in the H i emission CIG 159 is a not an isolated galaxy
D3 CIG 171 (UGC 3474)
Fig. E3: the Hα emission is brighter in the south than the north likely shadowed by dust and stars emitting in UV. In the south, the ionized gas has a dense distribution, while in the north it traces detached clouds. The old stellar population disc is mostly symmetric with feathering along the edges. The NUV and FUV emissions trace a slightly warped disc brighter in the north than in the south of the NIR photometric centre. The UV surface brightness profiles are flat in the inner ∼60 arcsec and fall exponentially outward. There is no Hα emission over the stellar disc in the z-direction, but the Hα and UV discs are more extended radially than the old stellar population disc. The maximum emissions of NIR, Hα, NUV, and FUV agree within a ∼5 arcsec at the centre of the galaxy. Jones et al. (2018) classified CIG 171 as not isolated using H i emission data.
D4 CIG 183 (UGC 3791)
Fig. E4: the Hα emission displays an asymmetric disc displaced to the north-east outwards of the old stellar population disc. It also shows two big bright regions located at the north of the photometric centre and several remnant clouds that draw two tails in both sides of the Hα disc. The 2.22 |$\mu$|m emission shows a mostly symmetrical disc with a bulge and two plumes at the ends of the galactic major axis. The NUV and FUV emissions agree with the structure of the Hα monochromatic map. The maxima of the NUV, FUV, and 2.22 |$\mu$|m emissions match within a circle of ∼5 arcsec radius in the galactic centre. No additional spectral or photometric data are available yet in the literature to allow a conclusion about the morphology of this galaxy.
D5 CIG 201 (UGC 3979)
Fig. E5: the Hα emission map reveals a concentrated distribution of ionized gas, forming bright knots predominantly located in the central region of the galaxy. A filamentary structure displayed by the ionized gas is consistently observed across all wavelengths. The Ks-band image shows a small disc that is symmetric but outwardly warped, tracing a similar shape to the Hα and UV emission. The NUV, FUV, and Hα maps display extended discs that exceed more than twice the area occupied by the NIR emission. The location of the Hα bright knots match with the brightest knots seen in NUV and FUV emissions. The plateau shape of the NUV and FUV surface brightness profiles in the inner ∼40 arcsec may be due to the emission of these bright regions uniformly distributed within a specified area. All the maps of CIG 201, presented in Fig. E5, outline the same filamentary structure and display a cone shape at the galactic centre pointing eastwards reaching different heights above the stellar disc. From SDSS data, Buta et al. (2019) classified CIG 201 as an SAc galaxy and identified an inner pseudoring (see Table 1). In addition, from H i emission data, Jones et al. (2018) determined that this galaxy is not interacting. The multiwavelength morphology of CIG 201 suggests that the galactic disc may host a galactic wind.
D6 CIG 329 (UGC 5010)
Fig. E6: the Hα emission is distributed in a nearly symmetric ring structure. Indeed, Buta et al. (2019) classified it as an SAb galaxy identifying an inner pseudo-ring (see Table 1). The 2.22 |$\mu$|m emission displays a long and symmetric disc with a central bulge and dust lane, with filaments along the edge. Following the photometric analysis of the Ks-band image, this galaxy has a ‘boxy’ bulge (B4 < 0). The brightest FUV emission regions agree with the Hα emission, while the faintest ones draw a filamentary warped disc and few detached clouds in the north. The NUV emission reveals a central dense distribution of the young stellar population, the NUV brightest clouds are consistent with the 2.22|$\mu$|m emission and the faintest draw filaments along the disc and the northern cloud traced by the FUV emission. Based on the SDSS spectroscopy, Sabater et al. (2012) classified CIG 329 as an LINER. CIG 329 satisfies all the AMIGA sample isolation criteria (see Section 2).
D7 CIG 416 (UGC 5642)
Fig. E7: the Hα emission map displays an asymmetric filamentary wide and radially extended disc with a tail-shape at the western tip and a few detached ionized gas clouds. The Ks-band image of this galaxy shows a small disc dominated by a bright central bulge. Beyond the Ks-band isophotal perimeter of the 3σ level, the old stellar population disc is asymmetric with a filamentary structure and a tail shape pointing northwards at the west extreme. The phenomenon triggering the western tail could be the reason for the non-linear relationship the B4 parameter and the radius, however, neither the graphics nor the Ks-band image show the presence of a bar. The NUV and FUV images show even more extended asymmetric discs and larger detached clouds than the Hα emission image. The images of these three bands present bright knots inside the disc. The photometric centre of the Hα, NIR, NUV, and FUV emissions match quite well. The asymmetric disc is also observed at the optical wavelength, since Buta et al. (2019) classified CIG 416 as Sdm peculiar using SDSS data. CIG 416 meets the isolation criteria of AMIGA sample in the optical band, none the less, it does not accomplish these criteria using radio band data (Jones et al. 2018). Therefore, the asymmetries, removed clouds, filaments and tails may be a signature of a past interaction.
D8 CIG 593 (UGC 8598)
Fig. E8: despite of a long exposure of 223 min (∼4 h), we only detected a few faint Hα clouds tracing an asymmetric and truncated ionized gas distribution only visible on the north side, slightly displaced with respect to the major axis of the old stellar population. It looks an ‘integral sign arm’ starting from a small bar. Indeed, Buta et al. (2019) classified this galaxy as a strongly barred (SB, see Table 1). The stellar disc shows a central bright bulge. The most diffuse NIR emission displays an asymmetric and truncated disc. The extended NUV emission disc covers the entire galaxy and draws a warped disc as the one traced by the NIR emission. The FUV emission brightest knots at the north are located in the same position as the Hα clouds. The maxima of the NUV, FUV, and NIR emissions are displaced by ∼10 arcsec in the galactic centre. CIG 593 meets all the AMIGA sample isolation criteria (see Section 2).
D9 CIG 847 (UGC 11132)
Fig. E9: the Hα emission depicts a radially extended asymmetric and warped disc more prominent and brighter towards the south than to the north along the major axis with the maximum located towards the south-east from the NIR photometric centre. The galaxy has a ionized gas tail-shape at the southern tip and a detached cloud at the northern edge. The 2.22 |$\mu$|m emission reveals an almost symmetric elongated disc with small warp. The FUV emission only shows large disengaged clouds along the major axis instead of a dense disc giving as a result an inaccurate surface brightness profile. The NUV emission traces a long and warped disc with feathering along the borders of the disc, populating mainly the north-west and with the maximum immediately to the north of the NIR photometric centre. Both Hα and NUV emissions trace a tail-shape at the southeastern tip. The maxima of the NUV and NIR emissions match within ∼5 arcsec in the galactic centre, while the FUV and Hα emission maxima are located ∼10 and ∼15 arcsec southwards from them, respectively. Using the H i image of CIG 847, Jones et al. (2018) found that this galaxy fulfills the most strict isolation criteria of AMIGA sample (see Section 2).
D10 CIG 906 (UGC 11723)
Fig. E10: after an exposure of 186 min (∼3 h) with FP GHASP, only faint Hα clouds as knots were detected along the galactic major axis. A faint ionized gas cloud is located over the northern edge of the stellar disc. The Ks-band image shows an old stellar population disc elongated and symmetrical with some filaments along the disc and a plume at the south-west edge and a well-defined dust lane. The NUV and FUV emission display wider and brighter discs than the NIR one, both show filaments all along the edges of the disc and even some detached clouds. The surface brightness profiles of NUV and FUV emission show a discontinuity between the ellipses fitted to the 1σ and 3σ brightness levels of the Ks-band image, this is from ∼30 and 45 arcsec. The maxima of the Hα, NUV, and FUV emissions are displaced ∼10 arcsec southwards from the NIR one. Despite Buta et al. (2019) classified CIG 906 as Sbc, our analysis to the surface brightness profile of the 2.22 |$\mu$|m image showed a ‘disc-like’ shape. According with Jones et al. (2018), from H i data, CIG 906 is a well isolated galaxy.
D11 CIG 922 (UGC 11785)
Fig. E11: the Hα emission disc is asymmetric and warped, it dominates the Northern galactic region and it is composed by large detached clouds. The ionized gas disc is wider and longer than the old stellar disc. The Hα cloud furthest north is faint and exceeds radially the old stellar disc tracing an arrow-shape, while to the south, there are two Hα detached bright knots just outside of the NIR disc edge. The old stellar population disc is mostly symmetric and elongated, it has a central bulge. The faintest NIR emission shows a warp at the northeastern and a plume outside the southwestern tip of the stellar disc, both peculiarities are pointing to the south-east. The FUV emission traces a wider and denser disc than the Hα emission disc but both match in shape: the rounded southern tip and the northern arrow-shaped. The NUV emission displays the most extended disc, with large plumes at one side of the disc pointing to the north-west, and a detached cloud at the northern tip. The maxima of the four emissions matches within the central ∼5 arcsec. Buta et al. (2019) classified CIG 922 as Scd warped galaxy (see Table 1) and, from H i data, Jones et al. (2018) determined that this galaxy is not strictly isolated: the morphology of CIG 922 might be a result of some interaction.
D12 CIG 936 (UGC 11859)
Fig. E12: the Ks-band and most of Hα emissions were detected in the central 30 arcsec of a galaxy with an optical diameter of D25(B) = 185.4 arcsec (see Table 1 and Fig. E12a). The Hα monochromatic image shows most of the warm gas compressed at the centre within the old stellar population disc, drawing a cone-shape. The Ks-band image shows an asymmetric disc with a central bulge. The FUV emission draws an extended thin disc (isophotal radius rFUV = 47.6 arcsec, see Table 5) whose tips are warped pointing to the north-west. The NUV disc emission is wider than the FUV one, with filaments mainly along the southeastern side of the disc with the largest and broadest filament at the galactic centre. At ∼70 arcsec southwards from the galactic centre, there is an NUV bright knot on the disc matching with the DSS R-band image and a faint Hα cloud, which is probably an SF region because it is not detected at the NIR emission. The maxima of the four emissions matches in the galactic centre. Jones et al. (2018) classified this galaxy as H i-not-isolated (see Section 2).
D13 CIG 1003 (UGC 12304)
Fig. E13: the ionized gas is compressed in the central region of the disc which presents three bright knots, one at the centre and the other two symmetrically placed ∼15 arcsec away. The Hα emission map displays filaments of ionized gas in all the edges, but the most prominent of them are around the central knot tracing a cone-shape pointing to the south-west. The Ks-band image shows an elongated and symmetric stellar disc with a central bulge. The diffuse NIR emission displays a cone-shape at the galactic centre pointing south-west and a hook-shaped extension at the northern tip pointing north-east. The NUV emission image shows a prominent filament of ∼15 arcsec length pointing to the south-west; in addition, the cone-shape in the central region is more noticeable in this emission. The FUV and NUV emission maps reveal very extended asymmetric and warped discs. Also, the brightest knots in these bands, match the southern Hα knot. All the photometric centres defined by the ellipse fitting lay on the central Hα knot agreeing within ∼5 arcsec. CIG 1003 displays thinner discs northwards and wider southwards in the NIR, FUV, and NUV emissions. CIG 1003’s multiwavelength morphology, position on the region of bona fide isolated galaxies (see Fig. 2) and H i classification as not isolated (Jones et al. 2018), suggest that it has a galactic wind, possibly due to a recent interaction.
APPENDIX E: INDIVIDUAL MAPS

CIG 95 (UGC 1733). Same as Fig. 3.
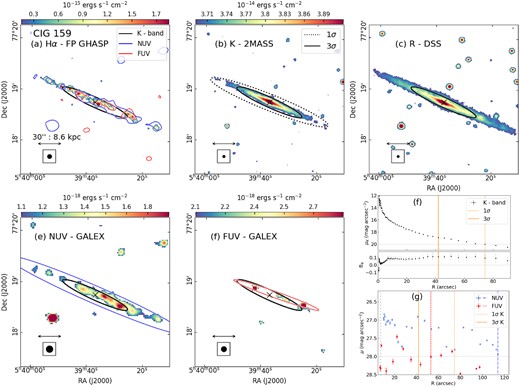
CIG 159 (UGC 3326). Same as Fig. 3.

CIG 171 (UGC 3474). Same as Fig. 3.
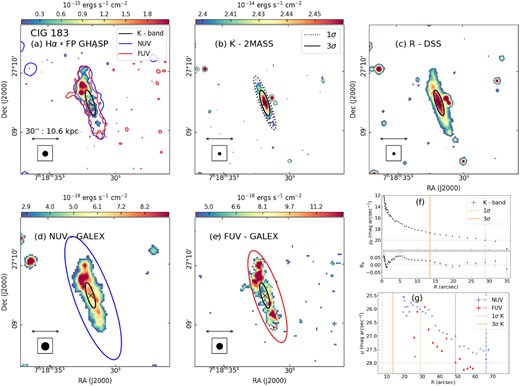
CIG 183 (UGC 3791). Same as Fig. 3.
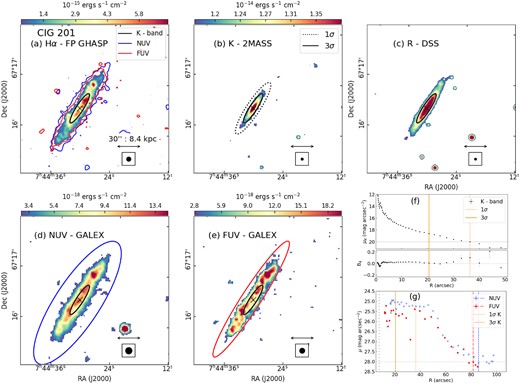
CIG 201 (UGC 3979). Same as Fig. 3.
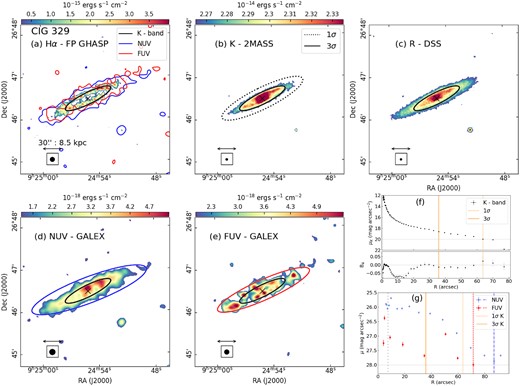
CIG 329 (UGC 5010). Same as Fig. 3.
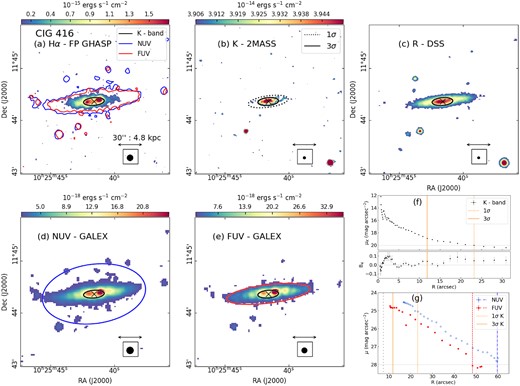
CIG 416 (UGC 5642). Same as Fig. 3.
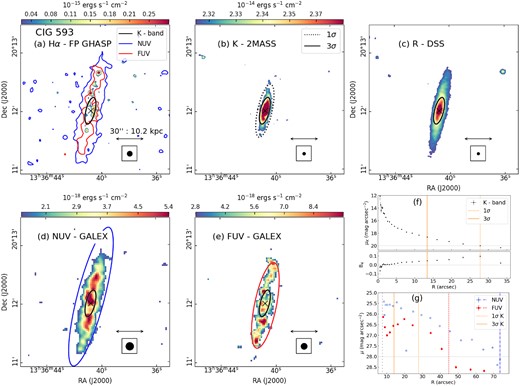
CIG 593 (UGC 8598). Same as Fig. 3.
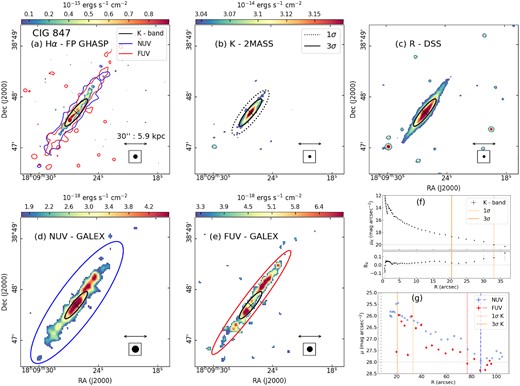
CIG 847 (UGC 11132). Same as Fig. 3.
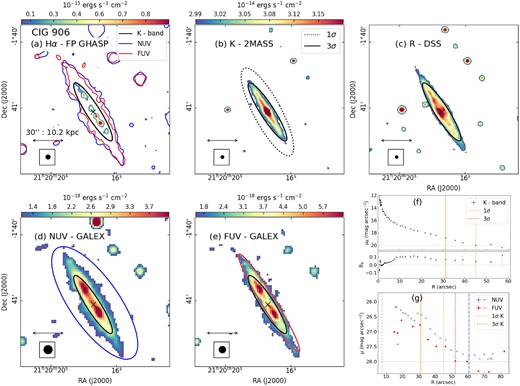
CIG 906 (UGC 11723). Same as Fig. 3.
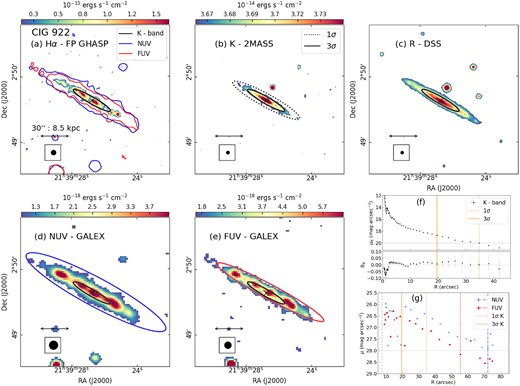
CIG 922 (UGC 11785). Same as Fig. 3.
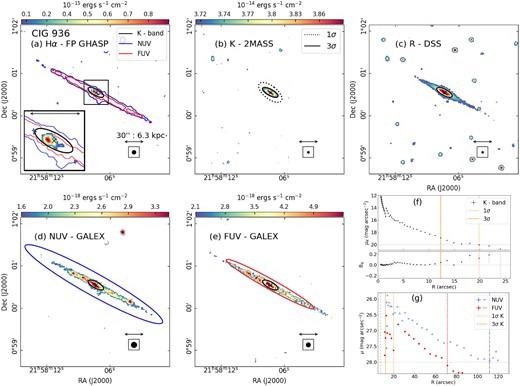
CIG 936 (UGC 11859). Same as Fig. 3.
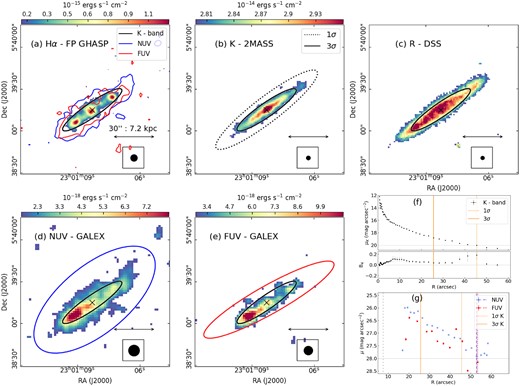
CIG 1003 (UGC 12304). Same as Fig. 3.
APPENDIX F: ROSSA & DETTMAR (2003A) SAMPLE

The sample of Rossa & Dettmar (2003a).
| Object name | RA | Dec. | Hubble | Vsys | log10 M* | L|$_{\mathrm{ FIR}}/D_{25}^{2}$| | S60/S100 | eDIG | Interact | Ref. |
|---|---|---|---|---|---|---|---|---|---|---|
| J2000.0 | J2000.0 | type | (|$\mathrm{km\, s^{-1}}$|) | (M⊙) | (|$stae043_ieqn076.gif0^{40}\, \mathrm{\, ergs\, s^{-1}kpc^{-2}}$|) | |||||
| (1) | (2) | (3) | (4) | (5) | (6) | (7) | (8) | (9) | (10) | (11) |
| NGC 24 | 00h09m56.54s | −24d57m47.3s | Sc | 554 | 8.0 | 0.77 | 0.3396 | p | (i) | |
| NGC 100 | 00h24m02.84s | + 16d29m11.0s | Sc | 844 | 8.3 | 0.21 | 0.1971 | i | (i) | |
| UGC 260 | 00h27m02.92s | + 11d35m01.7s | Sc | 2134 | 9.8 | 3.30 | 0.3761 | * | p | (i) |
| ESO 540–16 | 00h42m14.69s | −18d09m42.5s | SBcd | 1559 | 10.0 | 0.64 | 0.3692 | * | i | (ii) |
| NGC 360 | 01h02m51.45s | −65d36m35.9s | Sc | 2306 | 8.9 | 1.94 | 0.1609 | * | i | (iii) |
| NGC 669 | 01h47m16.15s | + 35d33m47.9s | Sab | 4674 | 8.0 | 1.04 | 0.2455 | g | (i) | |
| NGC 891 | 02h22m33.41s | + 42d20m56.9s | Sb | 528 | 5.9 | 3.19 | 0.2089 | * | g | (i) |
| UGC 2082 | 02h36m16.15s | + 25d25m25.8s | Sc | 708 | 5.5 | 0.35 | 0.2356 | i | (i) | |
| IC 1862 | 02h51m58.80s | −33d20m24.6s | Sbc | 6395 | 7.0 | 2.48 | 0.3357 | g | (i) | |
| NGC 1247 | 03h12m14.32s | −10d28m52.0s | Sab | 3947 | 8.8 | 2.92 | 0.3604 | * | g | (i) |
| ESO 117–19 | 04h02m32.13s | −62d18m56.2s | SBbc | 5335 | 6.2 | 3.51 | 0.2759 | * | g | (ii) |
| IC 2058 | 04h17m54.35s | −55d55m58.4s | Sc | 1379 | 5.1 | 1.15 | 0.2982 | p | (i) | |
| ESO 362–11 | 05h16m38.80s | −37d06m09.1s | Sbc | 1345 | 7.6 | 2.63 | 0.3295 | * | g | (ii) |
| IC 2135 | 05h33m12.90s | −36d23m55.8s | Sc* | 1312 | 7.3 | 7.28 | 0.4051 | * | i | (ii) |
| ESO 121–6 | 06h07m29.85s | −61d48m27.3s | Sc | 1203 | 10.2 | 7.05 | 0.3256 | * | i | (ii) |
| NGC 2188 | 06h10m09.53s | −34d06m22.3s | SBcd | 747 | 8.4 | 1.63 | 0.4301 | * | i | (iii) |
| ESO 209–9 | 07h58m15.01s | −49d51m05.1s | SBc | 1126 | 9.1 | 4.56 | 0.2948 | * | i | (ii) |
| UGC 4559 | 08h44m07.61s | + 30d07m08.9s | Sb | 2085 | 7.8 | 0.89 | 0.2721 | i | (iii) | |
| NGC 2654 | 08h49m11.87s | + 60d13m16.0s | SBab | 1339 | 7.3 | 0.57 | 0.1882 | i | (i) | |
| NGC 2683 | 08h52m41.33s | + 33d25m18.3s | Sb | 411 | 3.7 | 1.76 | 0.1976 | i | (i) | |
| NGC 3003 | 09h48m36.05s | + 33d25m17.4s | SBc | 1480 | 6.7 | 1.65 | 0.3434 | g | (i) | |
| NGC 3044 | 09h53m40.88s | + 01d34m46.7s | Sbc* | 1289 | 9.9 | 6.72 | 0.4633 | * | g | (i) |
| NGC 3221 | 10h22m19.98s | + 21d34m10.5s | SBcd | 4111 | 10.5 | 13.80 | 0.3738 | * | i | (iii) |
| NGC 3600 | 11h15m52.01s | + 41d35m27.7s | Sab | 703 | 9.3 | 1.30 | 0.4362 | * | i | (i) |
| NGC 3628 | 11h20m16.97s | + 13d35m22.9s | Sb | 846 | 8.9 | 5.02 | 0.4694 | * | g | (i) |
| NGC 3877 | 11h46m07.70s | + 47d29m39.6s | Sc | 895 | 6.8 | 4.15 | 0.2486 | * | g | (i) |
| NGC 3936 | 11h52m20.59s | −26d54m21.2s | SBbc | 2013 | 9.4 | 2.03 | 0.2447 | g | (i) | |
| ESO 379–6 | 11h53m03.27s | −36d38m19.8s | Sbc | 2944 | 8.8 | 3.67 | 0.2452 | * | i | (ii) |
| NGC 4206 | 12h15m16.81s | + 13d01m26.3s | Sc | 703 | 10.7 | 0.53 | 0.2054 | * | g | (i) |
| NGC 4216 | 12h15m54.44s | + 13d08m57.8s | SBab | 131 | 10.6 | 0.59 | 0.1221 | g | (i) | |
| NGC 4235 | 12h17m09.88s | + 07d11m29.7s | Sa | 2263 | 8.7 | 0.37 | 0.4896 | * | g | (i) |
| NGC 4256 | 12h18m43.09s | + 65d53m53.7s | Sb | 2489 | 4.6 | 0.71 | 0.1794 | g | (i) | |
| NGC 4302 | 12h21m42.48s | + 14d35m53.9s | Sc* | 1098 | 8.5 | 3.69 | 0.2136 | * | p | (i) |
| NGC 4388 | 12h25m46.75s | + 12d39m43.5s | Sb | 2524 | 10.5 | 5.53 | 0.6127 | * | g | (i) |
| NGC 4402 | 12h26m07.65s | + 13d06m48.0s | Sb* | 237 | 7.0 | 7.82 | 0.3320 | * | g | (i) |
| NGC 4634 | 12h42m40.96s | + 14d17m45.0s | Sbc* | 139 | 5.0 | 11.84 | 0.3720 | * | p | (i) |
| NGC 4700 | 12h49m08.15s | −11d24m35.5s | SBc | 1409 | 8.3 | 4.99 | 0.5074 | * | g | (i) |
| NGC 4945 | 13h05m27.48s | −49d28m05.6s | SBc | 563 | 4.8 | 14.79 | 0.5661 | * | g | (i) |
| NGC 5170 | 13h29m48.79s | −17d57m59.1s | Sc* | 1501 | 8.8 | 0.34 | 0.2796 | g | (i) | |
| NGC 5290 | 13h45m19.18s | + 41d42m45.3s | Sbc | 2549 | 7.8 | 2.57 | 0.3139 | * | g | (i) |
| NGC 5297 | 13h46m23.67s | + 43d52m20.4s | SBbc | 2409 | 7.2 | 1.69 | 0.2714 | p | (i) | |
| IC 4351 | 13h57m54.26s | −29d18m56.6s | Sb* | 2674 | 7.9 | 1.48 | 0.1947 | g | (i) | |
| NGC 5775 | 14h53m57.60s | + 03d32m40.0s | SBc | 1676 | 6.4 | 21.49 | 0.3415 | * | p | (i) |
| ESO 274–1 | 15h14m13.43s | −46d48m33.1s | Sd | 524 | 8.6 | 0.19 | 0.5055 | * | i | (ii) |
| NGC 5965 | 15h34m02.46s | + 56d41m08.2s | Sb | 3377 | 6.3 | 0.55 | 0.2769 | p | (i) | |
| UGC 10288 | 16h14m24.80s | −00d12m27.1s | SABc | 2044 | 8.5 | 0.89 | 0.2370 | g | (i) | |
| IC 4837 | 19h15m14.64s | −54d39m41.1s | Sab | 2668 | 8.3 | 2.42 | 0.2605 | * | g | (i) |
| NGC 6875 | 20h13m12.47s | −46d09m41.9s | SBc | 3121 | 9.0 | 1.56 | 0.3048 | * | p | (i) |
| MCG-01-53-012 | 20h49m52.23s | −07d01m18.5s | Sc | 6024 | 8.6 | 0.94 | 0.2067 | i | (ii) | |
| IC 5052 | 20h52m05.57s | −69d12m05.9s | SBcd | 584 | 9.5 | 1.00 | 0.3112 | * | g | (i) |
| IC 5071 | 21h01m19.74s | −72d38m33.8s | SABb | 3123 | 8.0 | 1.41 | 0.2472 | * | g | (i) |
| IC 5096 | 21h18m21.54s | −63d45m38.4s | Sbc | 3144 | 7.4 | 1.42 | 0.2280 | g | (i) | |
| NGC 7064 | 21h29m02.98s | −52d46m03.4s | SBc | 767 | 5.1 | 1.06 | 0.6250 | * | g | (i) |
| NGC 7090 | 21h36m28.86s | −54d33m26.4s | SBc | 847 | 4.6 | 1.95 | 0.3287 | * | g | (i) |
| NGC 7184 | 22h02m39.82s | −20d48m46.2s | SBc | 2623 | 9.6 | 1.38 | 0.2588 | i | (iii) | |
| IC 5171 | 22h10m56.70s | −46d04m53.3s | SBb | 2847 | 7.8 | 1.86 | 0.3101 | * | g | (ii) |
| IC 5176 | 22h14m55.93s | −66d50m57.9s | SBbc | 1748 | 5.9 | 3.51 | 0.3044 | * | g | (ii) |
| NGC 7361 | 22h42m17.91s | −30d03m27.6s | Sc* | 1249 | 7.8 | 1.07 | 0.2669 | i | (i) | |
| UGC 12281 | 22h59m12.80s | + 13d36m24.0s | Sc | 2562 | 5.3 | 0.98 | 0.1830 | g | (i) | |
| NGC 7462 | 23h02m46.49s | −40d50m06.9s | SBbc | 1064 | 10.0 | 3.34 | 0.4492 | * | g | (i) |
| NGC 7640 | 23h22m06.58s | + 40d50m43.5s | SBc | 369 | 8.1 | 0.45 | 0.2259 | g | (i) | |
| ESO 240–11 | 23h37m49.42s | −47d43m38.4s | Sb | 2836 | 5.9 | 1.00 | 0.1776 | g | (ii) |
Notes. Columns: (1) object name; (2) and (3) wcs coordinates (J2000);
(4) Hubble type from Rossa & Dettmar (2003b), when unavailable, marked by (*) from HyperLeda (HyperLEDA 2016);
(5) heliocentric velocity (Vsys);
(6) logarithm of the stellar mass computed with MIR-band photometry (see equation C1);
(7) and (8) DDD parameters from Rossa & Dettmar (2003a): FIR luminosity (LFIR) divided by the optical diameter of the |$25^{th}\, \mathrm{mag/\mathrm{arcsec}}$| isophote squared (|$D_{25}^{2}$|) and flux densities ratio at 60 and 100 µm (S60/S100), respectively;
(9) cases where the eDIG was detected by Rossa & Dettmar (2003a);
(10) hierarchy reported so far in the literature: i: isolated or no records, p: pair member, g: group member;
(11) hierarchy reference: (i) NED, (ii) SIMBAD, and (iii) there is no record.
