


ABSTRACT
The eROSITA X-ray telescope on board the Spectrum-Roentgen-Gamma (SRG) spacecraft observed the field of the UKIDSS Ultra-Deep Survey (UDS) in August–September 2019, during its flight to Sun–Earth L2 point. The resulting eROSITA UDS (or eUDS) survey was thus the first eROSITA X-ray imaging survey, which demonstrated the capability of the telescope to perform uniform observations of large sky areas. With a moderate single-camera exposure of 150 ks, eUDS covered ∼5 deg2 with the limiting flux ranging between 4 × 10⁻¹⁵ and 5 × 10⁻¹⁴ erg s−1 cm−2 in the 0.3–2.3 keV band. We present a catalogue of 647 sources detected at likelihood >10 (∼4σ) during the eUDS. The catalogue provides information on the source fluxes in the main energy band 0.3–2.3 keV and forced photometry in a number of bands between 0.3 and 8 keV. Using the deeper 4XMM-DR12 catalogue, we have identified 22 strongly variable objects that have brightened or faded by at least a factor of ten during the eROSITA observations compared to previous observations by XMM–Newton. We also provide a catalogue of 22 sources detected by eROSITA in the hard energy band of 2.3–5 keV.
1 INTRODUCTION
The Ultra Deep Survey (UDS) is the deepest component of the UKIRT.1 Infrared Deep Sky Survey (UKIDSS; Lawrence et al. 2007), covering 0.77 deg2 in the near-IR band. It was designed to shed light on the growth of supermassive black holes (SMBHs) during the Cosmic Dawn (z > 6) and Cosmic Noon (z ∼ 2). The UDS is located in the Subaru/XMM–Newton Deep Survey (SXDS) field, which is a deep optical and X-ray survey covering more than 1 deg2 (Furusawa et al. 2008; Ueda et al. 2008). This field has a wide range of multiwavelengh data available, including deep radio observations by the Very Large Array (VLA) at 1.4 GHz (Simpson et al. 2006), submillimeter mapping from the SCUBA Half-Degree Extra-galactic Survey (SHADES) survey (Coppin et al. 2006), SCUBA-2 Cosmology Legacy Survey (S2CLS, Geach et al. 2017), and ALMA observations (Stach et al. 2019). Infrared coverage comes from both ground-based and orbital facilities: Spitzer observed UDS within the SWIRE survey (Lonsdale et al. 2003) and more recently within the Spitzer Legacy Survey (SpUDS; PI: J. Dunlop, see e.g. Caputi et al. 2011); Herschel conducted a part of the HerMES legacy programme in the UDS field (Oliver et al. 2012). Ground-based IR facilities observed the UDS field with the UKIRT WFCAM (Casali et al. 2007) and VISTA as part of the VIDEO survey (Jarvis et al. 2013). The UDS field also has coverage with the Hubble Space Telescope (Galametz et al. 2013).
X-ray surveys in general, and in particular in the UDS field, constitute a major component of multiwavelengh observational campaigns and have their own scientific scope. They are a powerful tool to trace the cosmological evolution of active galactic nuclei (AGNs) and clusters/groups of galaxies. Deep X-ray surveys have resolved the bulk of the Cosmic X-ray Background (CXB) into AGNs (for a review see e.g. Brandt & Hasinger 2005). The deep X-ray coverage of the UDS with XMM–Newton (Ueda et al. 2008) has been significantly enhanced by the Chandra Legacy Survey (X-UDS, Kocevski et al. 2018) and hard X-ray NuSTAR observations (Masini et al. 2018).
In this paper, we present an X-ray survey of the UDS field with the eROSITA telescope on board the SRG satellite. This survey (named eUDS) was performed as part of the SRG Calibration and Performance Verification (Cal-PV) phase during the flight of the observatory to the Sun–Earth second Lagrange point (L2) in 2019. We provide the catalogue of X-ray sources detected with high detection likelihood in the 0.3–2.3 keV energy band and carry out a detailed comparison of this catalogue with the deep XMM–Newton survey of the same field based on the 4XMM-DR12 catalogue (Webb et al. 2020). The paper is organized as follows. Section 2 briefly describes the SRG mission, its observing modes and the eUDS survey. Details of the eROSITA data analysis are presented in Section 3. The construction of the X-ray source catalogue is described in Section 4. In Section 5, we summarize the results of this study.
2 OBSERVATIONS
The SRG observatory (Sunyaev et al. 2021), launched on 2019 July 13 from the Baikonur Cosmodrome to the Sun–Earth L2 point, carries two co-aligned telescopes, eROSITA (Predehl et al. 2021), sensitive in the 0.2–8 keV energy band, and the Mikhail Pavlinsky Astronomical Roentgen Telescope-X-ray Concentrator (ART-XC; Pavlinsky et al. 2021), with energy coverage in the 4–30 keV band. Both instruments are grazing incidence X-ray telescopes, each containing seven independent modules with their own X-ray mirror assemblies and focal plane detectors. eROSITA has the largest grasp in the soft X-ray energy band among imaging X-ray telescopes that have operated in orbit so far, which makes it a highly efficient instrument for surveying the X-ray sky (Brunner et al. 2022).
SRG observing strategy supports three regimes. In the survey mode, the pointing direction of the spacecraft traces great circles in the sky with a speed of 90° per hour while the rotation axis is approximately directed towards the Sun. The field-scanning mode is designed to cover large rectangular sky regions of size up to 12.5° × 12.5° (Sunyaev et al. 2021; Krivonos et al. 2022). Finally, there is the pointing mode for observations of individual targets.
The region of the UDS field was used as a blank field for technological operations with SRG during the ART-XC stage of the Cal-PV phase, which lasted until 2019 September 15, when eROSITA started its own Cal-PV program. However, already beginning 2019 August 22, some of the eROSITA cameras began to be cooled down and switched on for commissioning (Predehl et al. 2021). In this work, we use data from the eROSITA telescope only. Table 1 lists the time periods when different eROSITA cameras were operating during the UDS observations. The net exposure time, which can be used for science analysis, is about 150 ks. Most of that time (108 ks) was collected with the sixth camera (TM6), either in pointed (51 ks) or scanning (57 ks) mode observations. Each SRG scan begins with a special pointing observation, necessary to stabilize the spacecraft. Despite the relatively small exposure, these so-called ‘scan parkings’ can be used for science analysis just as usual pointing observations.
SRG/eROSITA CalPV observations of the UDS field.
| id | Start (UTC) | End (UTC) | TM | Typea | T, ks | ObsID | ΔRAb [arcsec] | ΔDecb [arcsec] |
|---|---|---|---|---|---|---|---|---|
| N01 | 2019-09-08 19:30 | 2019-09-08 21:29 | 1 | P | 7.1 | 11 900 102 042 | +4.76 | +0.07 |
| N02 | 2019-08-31 19:37 | 2019-08-31 22:00 | 5 | P | 8.6 | 11 900 102 034 | +2.77 | –2.74 |
| N03 | 2019-09-01 15:17 | 2019-09-01 18:50 | 5 | P | 12.8 | 11 900 102 035 | +3.88 | –3.65 |
| N04 | 2019-08-26 19:34 | 2019-08-26 20:40 | 6 | SP | 4.0 | N/A | +0.28 | +0.03 |
| N05 | 2019-08-26 20:40 | 2019-08-27 00:37 | 6 | S | 14.2 | 00 003 011 001 | +0.65 | –0.78 |
| N06 | 2019-08-27 00:40 | 2019-08-27 01:18 | 6 | SP | 2.2 | N/A | –0.38 | +0.27 |
| N07 | 2019-08-27 01:18 | 2019-08-27 05:15 | 6 | S | 14.2 | 00 003 011 002 | +0.04 | –0.35 |
| N08 | 2019-08-27 05:20 | 2019-08-27 05:55 | 6 | SP | 2.15 | N/A | +0.58 | –0.22 |
| N09 | 2019-08-27 05:55 | 2019-08-27 09:53 | 6 | S | 14.2 | 00 003 011 003 | +1.35 | –0.56 |
| N10 | 2019-08-27 09:57 | 2019-08-27 10:32 | 6 | SP | 2.1 | N/A | +0.56 | +0.36 |
| N11 | 2019-08-27 10:32 | 2019-08-27 14:30 | 6 | S | 14.2 | 00 003 011 004 | +1.08 | –0.62 |
| N12 | 2019-08-27 14:33 | 2019-08-27 19:00 | 6 | P | 16.0 | 11 900 102 030 | –0.56 | –1.56 |
| N13 | 2019-08-31 20:01 | 2019-08-31 21:57 | 6 | P | 7.0 | 11 900 102 034 | +0.19 | –1.03 |
| N14 | 2019-09-01 15:16 | 2019-09-01 19:00 | 6 | P | 13.4 | 11 900 102 035 | +1.03 | –1.99 |
| N15 | 2019-09-05 21:00 | 2019-09-05 23:33 | 7 | P | 9.2 | 11 900 102 039 | +0.88 | –1.66 |
| N16 | 2019-09-06 15:35 | 2019-09-06 17:45 | 7 | P | 7.8 | 11 900 102 040 | +2.74 | –0.52 |
Notes. aSP – scan parking, a special technological pointed observation before scanning; S – scanning observation; P – pointing observation.
bLinear translation in RA and Dec coordinates applied to event files.
Fig. 1 shows the eUDS exposure map in the 0.3–2.3 keV energy band, corrected for vignetting. Fig. 2 demonstrates an exposure-corrected and adaptively smoothed 0.3–8.0 keV image of the entire region.
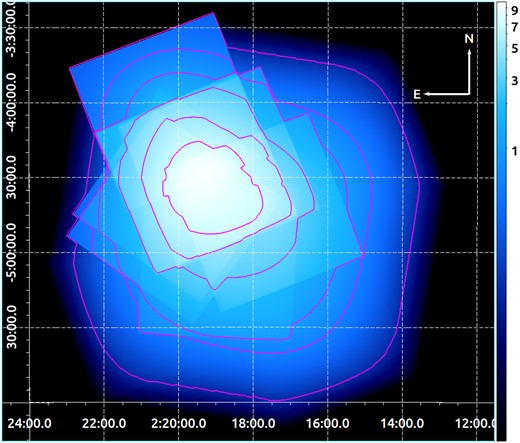
0.3–2.3 keV vignetting corrected exposure map in units of ks. Contours (from the exterior to the interior) show increasing exposure levels of 0.1, 0.6, 1, 3, 5, and 7 ks. The exposure has been normalized to the seven telescope modules, i.e. the total exposure accumulated with TM1, TM5, TM6, and TM7 in different observations (see Table 1) was divided by 7.
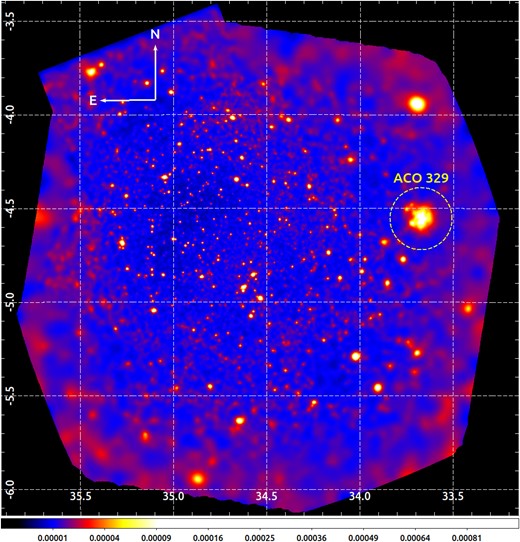
SRG/eROSITA 0.3–8.0 keV map of the UDS field in units of cts s−1. The image has been exposure-corrected (with vignetting applied) and adaptively smoothed with the dmimgadapt task from CIAO-4.15 using a Gaussian kernel. The image is shown in the square-root scale colour map (‘b’ in DS9 notation, see Joye & Mandel 2003) ranging from zero (black) to 0.001 (white). The white grid indicates equatorial coordinates in degrees, and the compass sign shows the image alignment. The position of the ACO 329 galaxy cluster is shown with the yellow R = 10 arcmin circle.
3 DATA ANALYSIS
In this section, we describe eROSITA data processing with the eROSITA Science Analysis Software System (eSASS). In the data analysis procedures, we generally follow Brunner et al. (2022), who presented the eROSITA Final Equatorial Depth Survey (eFEDS) with a detailed description of eSASS.
3.1 Data flow and initial processing
Science and telemetry data from the ART-XC and eROSITA telescopes on board SRG are received by the Russian ground-control complex, operated by NPO Lavochkin (Khimki, Russia), and transferred to the Space Research Institute (aka ‘IKI’, Moscow, Russia), as described by Sunyaev et al. (2021). The eROSITA-specific data are transferred from IKI to the eROSITA Data Centre at the Max Planck Institute for Extraterrestrial Physics (MPE) in Garching, Germany, for initial processing and converting to FITS format. Finally, the data are sent to IKI, where it is processed in the form of calibrated X-ray event files ready for scientific analysis.
We processed the Cal-PV data of the UDS field using eSASS version 211201. The originally packed data in 4-hour chunks (‘erodays’) were merged using eSASS evtool command into observations according to the SRG scheduling program available at the mission’s website.2
After initial inspection of images, we found two artefacts in the data (refer Table 1). First, during observations N13 and N14, high instrumental background was registered in part of the TM6 camera. To filter out this region, we marked all pixels with RAWX >250 as BAD to skip them in the following analysis. Second, TM7 observations N15 and N16 were partially damaged with scattered sunlight. This issue is known for TM5 and TM7 as ‘light leak’ (see Predehl et al. 2021; Brunner et al. 2022), with characteristic contamination at very low energies. To suppress this effect, we set the lower energy border at 0.3 keV for all the cameras.
In order to perform uniform processing of the whole data set, we modified meta information for each observation, in particular, 1) set observing mode POINTING and SURVEY to staring and scanning observations, respectively, and 2) re-centred original events files to the same coordinates (RA = 34.5342, Dec = −4.7957) using eSASS command radec2xy.
3.2 Source detection for astrometry correction
In order to account for any systematic uncertainty in the eROSITA astrometry due to telescope pointing, we compared the positions of X-ray sources detected in each observation listed in Table 1 with the (more accurate) positions of their optical/IR couterparts in the Gaia-unWISE AGN catalogue (Shu et al. 2019).
We begin by generating an event list in the 0.3–2.3 keV energy band using the evtool command. This energy band is most efficient for source detection according to the eROSITA energy response function (Predehl et al. 2021). Then, a preliminary catalogue of sources is generated with the erbox command and background maps (erbackmap) in a three-step iterative procedure, described in Brunner et al. (2022). We then input this catalogue into the PSF-fitting procedure ermldet, which selects reliable sources from it. We run ermldet in photon-mode with the PSF-fitting radius (cutradius) and multiple-source searching radius (multrad) of 20 pixels; a detection likelihood threshold (likemin) and extent likelihood threshold (extlikemin) of 5 and 6, respectively; and an extent range between 2 and 15 pixels allowing up to four sources in simultaneous fitting, but splitting no more than two sources.
We then cross-correlate the output catalogue of the PSF-fitting procedure with the Gaia-unWISE AGN catalogue (Shu et al. 2019) to find unique counterparts for eROSITA non-extended (EXT_LIKE = 0) sources with detection significance DET_LIKE_0 >10 and position uncertainty RADEC_ERR <5 arcsec and allowing a maximum offset of 30 arcsec from the source position. We find an optimal astrometry solution with respect to the Gaia-unWISE AGN sky reference frame by minimizing the position differences in terms of χ2, i.e. taking the position uncertainties into account. As a result, we determined linear translations for all the eROSITA observations (Table 1). The astrometry correction was calculated in the 0.3–2.3 keV energy band and applied to all other considered energy bands. We modified the attitude information stored in the CORRATTn extention of the eROSITA event file and computed new equatorial sky coordinates for each event with the eSASS evatt command. Using radec2xy, we updated the X and Y sky pixel coordinates corresponding to the RA and DEC (J2000) event coordinates in order to assemble X-ray images with evtool.
3.3 Creation of sky mosaics and final source detection
We merged the astrometry-corrected event lists of individual observations into combined data sets in each energy band from the list in Table 2. We repeated the source detection procedure described in the previous Section 3.2 on the combined data sets. Fig. 3 demonstrates the positional uncertainty of the sources detected in the 0.3–2.3 keV band with DET_LIKE > 10 as a function of their detection likelihood. We again cross-matched the list of significantly (DET_LIKE >10) detected non-extended (EXT_LIKE = 0) eROSITA sources with the Gaia-unWISE AGN catalogue (Shu et al. 2019). The list of unique pairs within 30 arcsec of the eROSITA source positions contains 176 objects. The mean residual astrometry difference in equatorial coordinates is ΔRA = −0.42 arcsec and ΔDEC = −0.17 arcsec.
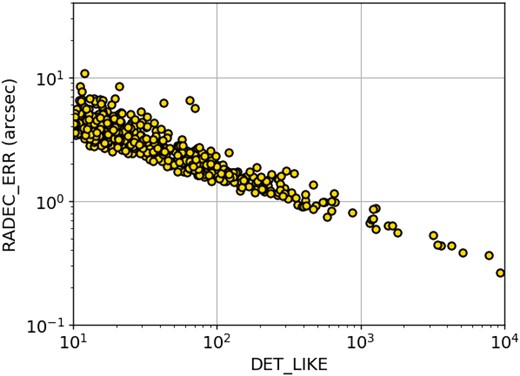
Positional uncertainty of the eUDS non-extended sources as a function of their detection likelihood in the 0.3–2.3 keV energy band.
The list of the utilized energy bands.
| id | Band (keV) | ECFa (cm2 erg−1) | Notes |
|---|---|---|---|
| E0 | 0.3–2.3 | 1.091 × 10¹² | The highest efficiency |
| E1 | 0.3–0.6 | 1.073 × 10¹² | Soft band |
| E2 | 0.6–2.3 | 1.090 × 10¹² | Medium band |
| E3 | 2.3–5.0 | 1.147 × 10¹¹ | Hard band |
| E4 | 5.0–8.0 | 2.776 × 10¹⁰ | Ultra Hard band |
Note. aECF denotes the Energy Conversion Factor, used to convert measured count rates to energy fluxes.
4 CATALOGUE OF X-RAY SOURCES
The eUDS X-ray catalogue consists of sources detected at likelihood DET_LIKE >10. Fig. 4 shows the distribution of their fluxes in the 0.3–2.3 keV band. To convert source count rates obtained with the PSF-fitting procedure ermldet to physical units (erg s−1 cm−2), we used energy conversion factors (ECF) listed in Table 2. The ECFs are calculated as the ratio of the count rate of XSPEC fake spectra, corrected for the PSF fraction, to the model flux assuming an absorbed power law with a slope of Γ = 2 and a Galactic absorbing column density of 2 × 1020 cm−2 (tbabs) observed in the direction of the eUDS field (HI4PI Collaboration et al. 2016).
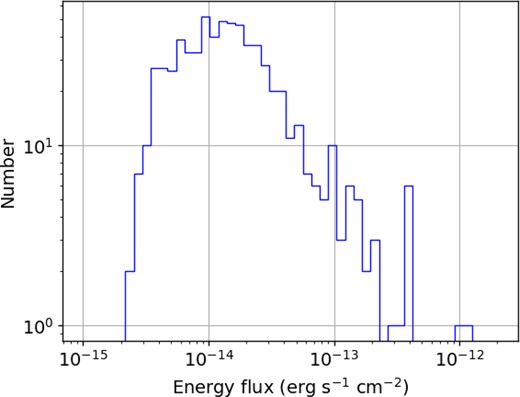
Distribution of derived fluxes of the detected sources in the 0.3–2.3 keV energy band.
We also calculated the eUDS sensitivity map for detection of point sources in the 0.3–2.3 keV energy band, using ersensmap. The black solid curve in Fig. 5 shows the resulting sky coverage as a function of limiting flux for the detection threshold DET_LIKE >10. At this threshold, the peak sensitivity of eUDS is 4.0 × 10⁻¹⁵ erg s−1 cm−2; with 10 and 90 per cent of the survey’s area being covered with sensitivity better than 5.0 × 10⁻¹⁵ and 3.5 × 10⁻¹⁴ erg s−1 cm−2, respectively. The geometric area of the survey is 5.1 deg2 at flux above 5.0 × 10⁻¹⁴ erg s−1 cm−2.
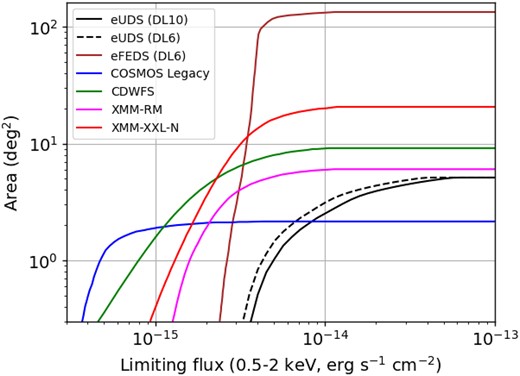
eUDS sky coverage area (black) as a function of the 0.5–2 keV flux calculated for the detection thresholds DET_LIKE>10 (solid) and DET_LIKE > 6 (dashed). The sky coverage of selected previous extragalactic X-ray surveys are shown for comparison, based on Brunner et al. (2022).
We compare these characteristics in Fig. 5 with those of previous extragalactic X-ray surveys, in particular eFEDS (Brunner et al. 2022), a significantly larger survey (∼100 deg2) performed by SRG/eROSITA during the Cal-PV phase. To enable direct comparison with this survey, whose results have been reported for a detection threshold of DET_LIKE > 6, we also computed the eUDS sky coverage curve for this (low) detection threshold. Apart from eFEDS, we show (based on Brunner et al. 2022) the sky coverage curves of a number of deep Chandra and XMM–Newton surveys, namely the XMM-XXL North survey (Liu et al. 2016), the Chandra COSMOS Legacy survey (Civano et al. 2016), the XMM-RM survey (Liu et al. 2020), and the CDWFS survey (Masini et al. 2020). The comparison is done in the 0.5–2 keV energy.
4.1 Extended sources
The PSF-fitting procedure for eROSITA source detection (ermldet) is capable of probing the spatial extent of sources by comparing an extended beta model with a δ function via calculating an extent likelihood value, EXT_LIKE. Sources with EXT_LIKE > 5 were fitted with the beta model. We chose this relatively low threshold to achieve high completeness with respect to extended sources, at the cost of allowing a number of point sources to be designated as extended. Additionally, we limited the extent likelihood by setting the spatial size between 8 and 140 arcsec (parameters extmin = 2 and extmax = 35 in 4 arcsec pixels). Table 3 lists the detected extended objects, sorted by their extent likelihood.
List of extended eROSITA sources detected with EXT_LIKE >5.0.
| Name | RA | Dec | DET_LIKE | EXT_LIKE | EXT | Redshift | Notes |
|---|---|---|---|---|---|---|---|
| (J2000) | (J2000) | (arcsec) | |||||
| SRGe J021440.5-043322 | 33.6689 | −4.5562 | 216.69 | 92.68 | 71.89 ± 4.74 | 0.351 | ACO 329, X-CLASS 578 |
| SRGe J021528.7-044047 | 33.8695 | −4.6796 | 73.10 | 29.99 | 34.73 ± 5.08 | 0.351 | X-CLASS 343 |
| SRGe J021612.2-041423 | 34.0509 | −4.2398 | 114.25 | 31.06 | 22.19 ± 3.40 | 0.154 | X-CLASS 349 |
| SRGe J022144.9-034616 | 35.4371 | −3.7712 | 103.82 | 8.82 | 20.80 ± 4.22 | 0.432 | X-CLASS 3120 |
| Spatial confusion | |||||||
| SRGe J021734.7-051321a | 34.3945 | −5.2224 | 24.81 | 12.75 | 41.21 ± 7.48 | – | – |
| SRGe J021945.6-045314b | 34.9399 | −4.8871 | 20.25 | 12.53 | 23.83 ± 4.91 | – | – |
| SRGe J021929.9-043228c | 34.8745 | −4.5411 | 52.35 | 5.66 | 9.92 ± 2.30 | – | – |
| SRGe J021929.5-051228d | 34.8728 | −5.2079 | 20.02 | 6.26 | 9.39 ± 3.48 | – | – |
Note. a 4XMM J021738.8-051257 and 4XMM J021733.8-051311. b fixed position at 4XMM J021945.2-045331. c fixed position at 4XMM J021929.4-043224. d 4XMM J021929.4-051220 and 4XMM J021930.7-051225.
The brightest extended source in the eUDS field is the rich cluster of galaxies ACO 329 at z = 0.14 from the catalogue of Abell, Corwin & Olowin (1989). We cross-matched our list of extended objects with the XMM Cluster Archive Super Survey (X-CLASS; Clerc et al. 2012; Koulouridis et al. 2021), which is a serendipitous survey of galaxy clusters detected in XMM–Newton archival observations until August 2015. All identified X-CLASS clusters have reliable spectroscopic redshifts, as shown in Table 3.
The remaining four extended sources, not identified in the X-CLASS catalogue, prove to be the result of spatial confusion of point X-ray sources. We manually inspected and cross-matched these extended sources with the 4XMM-DR12 catalogue (Webb et al. 2020), which allowed us to split them into multiple sources with fixed positions. This step required running the ermldet command in a forced mode (see details below) for selected XMM–Newton sources in the reference E0 energy band. The information about the XMM–Newton sources with eROSITA forced X-ray photometry is included in the final eUDS catalogue.
The final eUDS catalogue is composed of 643 unconfused point sources and four clusters of galaxies. The total number of X-ray sources detected with DET_LIKE > 10 is 647.
4.2 Forced photometry
We performed forced PSF-fitting photometry in the 0.3–0.6 (E1), 0.6–2.3 (E2), 2.3–5.0 (E3), and 5.0–8.0 keV (E4) energy bands in the positions of the sources detected in the main 0.3–2.3 keV (E0) band.
This procedure begins with the construction of a background map for each energy band, using the erbackmap task. The preliminary catalogue of sources obtained in the E0 band (the same as was utilized in the PSF-fitting procedure) is used as an input to erbackmap. To generate the background maps in the hard bands E3 and E4, we use flat (unvignetted) exposure. Forced PSF-fitting is performed with vignetted exposure for all the bands to measure vignetting-corrected fluxes. The final catalogue of sources obtained with the PSF-fitting procedure in the E0 band is used as an input to ermldet in each energy band with fixed source coordinates (fitpos_flag = no) and without spatial extension (fitext_flag = no), while disabling source spitting (nmulsou = 1).
4.3 Cross-match of eUDS with the 4XMM-DR12 catalogue
We cross-matched the eUDS point sources with the 4XMM-DR12 catalogue (Webb et al. 2020), using a fixed search radius of 15 arcsec, which conservatively includes the positional error (Fig. 3) and the remaining systematics after astrometry correction (Section 3.2). We expect less than five spurious matches, which is less than 1 per cent of our catalogue. This number has been estimated by assuming a uniform distribution of 4XMM-DR12 sources in the eUDS footprint, namely as the area of the search region divided by the eUDS total area (5 deg2) and multiplied by the number of eUDS point-like sources (643) and by the number of 4XMM-DR12 sources (3603). As a result, 613 eUDS sources have 4XMM-DR12 counterparts, including 593 unique and 20 double cross-matches, i.e. when two 4XMM-DR12 counterparts are found for a given eUDS source.
Table A1 provides the list of 30 eUDS sources that have no 4XMM-DR12 counterparts within 15 arcsec. For the majority of this subsample, the XMM–Newton flux upper limits are a factor of few lower than the fluxes measured by eROSITA, i.e. these sources have become brighter during eUDS. For the remaining sources, the XMM–Newton upper limits are comparable to the eROSITA fluxes. A search in public astronomical databases have revealed plausible counterparts for four objects on this list, as indicated in the last column of Table A1. Specifically, we regard an association as likely if the optical position is within 1.5 × RADEC_ERR, which approximately corresponds to the 90 per cent X-ray position error. Two of these objects are AGNs and another one is a star from the Gaia Data Release 3 catalogue (Gaia Collaboration et al. 2021), at a distance of 108 pc (Bailer-Jones et al. 2021). However, given the large surface density of Gaia objects, we cannot exclude that this latter association is spurious.3 The fourth object, SRGe J022204.7−043247, which is listed as a point source in our eUDS catalogue and in 4XMM-DR12, actually appears to be associated with a known cluster of galaxies. We plan to carry out a more thorough multi-wavelength analysis of the entire eUDS source catalogue in our follow-up paper.
It is interesting to compare the numbers of sources detected independently by XMM–Newton and eROSITA in the eUDS field above some common flux threshold, e.g. 4 × 10⁻¹⁴ erg s−1 cm−2 (0.3–2.3 keV), which corresponds to the sensitivity achieved by eROSITA over 95 per cent of the eUDS field. There are 84 such bright sources in the 4XMM-DR12 catalogue (at exposure greater than 100 s) and also 84 sources detected by eROSITA. Therefore, the surface densities of XMM–Newton and eROSITA sources in the eUDS field are consistent with each other. The cross-match list contains 53 objects detected in both catalogues with F0.3–2.3 keV > 4 × 10⁻¹⁴ erg s−1 cm−2.
4.4 Forced photometry of the 4XMM-DR12 catalogue
XMM–Newton has provided a wide and deep coverage of the UDS field, which fully overlaps with our eROSITA observations. In this work, we use the 12th4 data release of the Fourth XMM–Newton Serendipitous Source Catalogue (4XMM; Webb et al. 2020), which comprises X-ray sources serendipitously detected with XMM–Newton over the mission lifetime.
In addition to cross-matching the eUDS catalogue with 4XMM-DR12 (see Section 4.3), we performed forced eROSITA photometry on the 4XMM-DR12 catalogue to study the long-term variability of X-ray sources. To this end, we constructed an input list of sources for the ermldet task with the parameters described in the previous section. The resulting catalogue of forced PSF-fitting fluxes in the five energy bands (Table 2) contains 3603 XMM–Newton sources with the eUDS exposure of more than 100 s. Table A2 provides a description of the columns in this catalogue. To warn about the potential impact of spatial confusion with a nearby bright source on the result of eROSITA forced photometry, we added a confusion flag, which is true if the source is located within 60 arcsec of a brighter eROSITA source with the 0.3–2.3 keV flux >2 × 10⁻¹⁴ erg s−1 cm−2 or within 120 arcsec of a very bright source (>9 × 10⁻¹³ erg s−1 cm−2). As a result, 111 sources are labelled as possibly affected by confusion.
A total of 776 sources from the 4XMM-DR12 catalogue have the eROSITA forced photometry detection likelihood DET_LIKE > 10 in the 0.3–2.3 keV band. This number exceeds the number of sources with DET_LIKE > 10 in the main eUDS catalogue, because the detection significance of a source with known position is higher compared to a blind search. We calculated the XMM–Newton fluxes in the 0.2–2.0 keV band by adding up the fluxes in the 0.2–0.5, 0.5–1.0, and 1.0–2.0 keV bands provided by the 4XMM-DR12 catalogue and converted it to the eROSITA 0.3–2.3 keV band assuming an absorbed power law with slope Γ = 2 and the Galactic absorption column density of 2 × 1020 cm−2. As a byproduct, we estimated the average 4XMM-DR12 flux error in the eUDS area as ∼1 × 10⁻¹⁵ erg s−1 cm−2 in 0.3–2.3 keV band.
Fig. 6 compares the X-ray fluxes of the 4XMM-DR12 sources in the eUDS field as measured by XMM–Newton and by eROSITA forced photometry. Only the 776 sources detected with DET_LIKE > 10 are shown, while the eROSITA flux upper limits for 2827 4XMM-DR12 sources are not shown in this diagram.

Comparison of the fluxes (0.3–2.3 keV) of 4XMM-DR12 sources and their respective eROSITA fluxes obtained by forced photometry in the eUDS field (for sources detected by eROSITA with DET_LIKE >10). The constant flux ratios of 0.1, 1, and 10 are shown by the dotted, solid, and dashed line, respectively.
4.4.1 Sources in outburst during the eUDS
A number of sources demonstrate a dramatic change in flux between the XMM–Newton and eROSITA observations. Table A3 lists the sources whose flux had increased during the eUDS survey by more than an order of magnitude compared to the exposure-averaged flux during the XMM–Newton observations. We have excluded confusion-flagged 4XMM-DR12 sources located in the vicinity of a bright eUDS source.
As a result, five sources show a flux increase by at least a factor of 10. The highest variability amplitude of 15.3 is demonstrated by 4XMM J022026.2−041624, associated with the eUDS source SRGe J022026.4−041625. This and two other sources are known to be AGNs, and for two of them spectroscopic redshifts are available: z = 0.6287 and 0.3311 (see references in Table A3). Another source is likely associated with a star at a distance of 118 pc (Bailer-Jones et al. 2021), and for one object there is no obvious counterpart yet.
4.4.2 Sources in a dim state during the eUDS
We similarly investigated 4XMM-DR12 sources that had weakened by at least a factor of 10 during the eROSITA observation compared to the exposure-averaged flux during the XMM–Newton observations. We restricted this analysis to regions with the eUDS exposure >0.6 ks (as shown by the second contour in Fig. 1). Table A4 provides the resulting list of 17 sources. There was one more source, 4XMM J021911.8−034422, satisfying the same criteria, but it is likely to be associated with the cluster of galaxies and extended X-ray source XMMXCS J021911.4−034416.1 (Wilcox et al. 2015; Zou et al. 2021), hence we excluded it from consideration.
Our search for plausible counterparts in external catalogues has revealed that six of the objects in Table A4 are AGNs, with the spectroscopic redshifts ranging between 0.431 and 1.424 for five of them and one redshift remaining unknown. Another object, 4XMM J021932.2−040153, is a star, which is discussed below. This source is also the only one in this subsample that has been detected by eROSITA. For the other 16 sources, there are only upper limits on the eROSITA flux.
4XMM J021932.2−040153 was observed on 2017 January 1 with XMM–Newton (ObsID 0793580201) at a relatively high flux of (1.11 ± 0.08) × 10−13 erg s−1 cm−2 in the 0.3–2.3 keV band. According to the XMM–Newton online catalogue5, the EPIC-pn spectrum of the source is well fit with an absorbed (WABSNH = 2 × 1021 cm−2) power law with a photon index Γ = 2.8. The position of 4XMM J021932.2−040153 is 1.6 arcsec away from the eUDS source SRGe J021932.4−040154 detected with a flux of 1.1 ± 0.2 × 10⁻¹⁴ erg s−1 cm−2 in the 0.3–2.3 keV band. The source is associated with a star (Melnyk et al. 2013), which corresponds to the Gaia DR3 object 2489887138146547456 at a distance of 344 ± 5 pc (Bailer-Jones et al. 2021). This implies that this star was observed with XMM–Newton in 2017 during an outburst with an X-ray luminosity of (1.6 ± 0.1) × 1030 erg s−1, and then in a much dimmer state with a luminosity of (1.6 ± 0.3) × 1029 erg s−1 by eROSITA in 2019.
4.5 Source detection in hard bands
Because we performed the detection of sources in the relatively soft 0.3–2.3 keV energy band, some highly absorbed sources or sources with intrinsically hard spectra could avoid detection. To address this issue, we repeated the source detection procedure in the harder band of 2.3–5 keV. The resulting list of detected sources with detection likelihood DET_LIKE > 10 contains 21 objects and is given in Table A5. The table includes information on the hardness ratio, which we define as (F2.3–5 keV − F0.3–2.3 keV)/(F0.3–2.3 keV + F2.3–5 keV). Most of these sources have already been detected in the main 0.3–2.3 keV energy band, except for three, for which we provide a 1σ upper limit on the flux in this energy band, based on the sensitivity map.
In particular, the source SRGe J021712.1–044248 is detected in the 2.3–5 keV band at DET_LIKE ≈ 26 and not detected in the 0.3–2.3 keV band. We can link this source with 4XMM J021712.2−044246 at an offset of 3.5 arcsec, which is associated with the known AGN SDSS J021712.23−044246.5 at z = 0.13989 (Menzel et al. 2016).
Another similar source, SRGe J021855.2–044332, is detected at DET_LIKE ≈ 25 in the 2.3–5 keV band. Its 4XMM-DR12 counterpart is 4XMM J021855.0−044328, which is associated with the bright radio galaxy FIRST J021855.1−044329 at z = 0.8834 (Vardoulaki et al. 2008; Simpson et al. 2012). These objects likely have strong intrinsic absorption in the soft X-ray band.
Finally, we ran the source detection procedure in the ultra-hard energy band of 5–8 keV and detected only one source with DET_LIKE > 10. It is located at RA = 34.02625, Dec = −5.29052 (with an uncertainty of 4 arcsec at 68 per cent confidence), which is consistent with the position of the bright eUDS source SRGe J021605.7−051724 detected in the 0.3–2.3 keV band and with the source 4XMM J021606.0−051722 (Webb et al. 2020). This object is a known AGN at z = 0.055642 (Menzel et al. 2016).
4.6 Compilation of the final catalogue
Based on the list of 647 sources detected with DET_LIKE > 10 in the E0 band, we built the final eUDS source catalogue (see Table A6 for a description of the columns). This catalogue contains 643 point-like and four extended (see Section 4.1) sources. For the four cases of spatial confusion that were discussed in Section 4.1, we included information about the 4XMM-DR12 sources whose positions have been used to resolve the blended eUDS sources. As was explained in Section 4.2, the list of sources detected in the E0 band has been used as an input for forced PSF-fitting photometry in the E1–E4 energy bands. The results of this analysis are also included in the final eUDS catalogue.
5 SUMMARY
The field of the UKIDSS Ultra-Deep Survey (UDS; Lawrence et al. 2007) was targeted during the initial switch-on and in-flight tests of the eROSITA cameras at the Cal-PV phase of the SRG mission in 2019. This was the first wide-angle survey conducted by the eROSITA telescope. The eROSITA UDS survey (eUDS) demonstrated the capability of the telescope to perform uniform observations of large sky areas. With the total exposure of 150 ks, eUDS covered ∼5 deg2 down to a limiting flux of 4 × 10⁻¹⁵ erg s−1 cm−2 in the 0.3–2.3 keV energy band. The resulting catalogue, presented in this paper, is composed of 647 X-ray sources registered with a high detection likelihood >10 (∼4σ).
In the eUDS catalogue, we provide information on the positions and extent of the sources, their fluxes in the main energy band 0.3–2.3 keV and the forced photometry in a number of energy bands between 0.3 and 8 keV. In addition, we have constructed a catalogue of 22 sources detected in the hard energy band of 2.3–5 keV above a detection likelihood of 10.
We cross-matched the eUDS sources with the 4XMM-DR12 catalogue (Webb et al. 2020), which fully covers the eUDS footprint with deeper sensitivity and thus provids an excellent database of X-ray sources in the same energy band as eROSITA. A total of 30 eUDS sources do not 4XMM-DR12 counterparts (within 15 arcsec radius). A comparison of the eROSITA forced-photometry fluxes in the positions of 4XMM-DR12 sources has allowed us to identify strongly variable objects that have brightened or faded by at least 10 times, which may be of interest for follow-up studies.
ACKNOWLEDGEMENTS
This work is based on observations with eROSITA telescope onboard SRG observatory. The SRG observatory was built by Roskosmos in the interests of the Russian Academy of Sciences represented by its Space Research Institute (IKI) in the framework of the Russian Federal Space Program, with the participation of the Deutsches Zentrum für Luft-und Raumfahrt (DLR). The SRG/eROSITA X-ray telescope was built by a consortium of German Institutes led by MPE, and supported by DLR. The SRG spacecraft was designed, built, launched, and is operated by the Lavochkin Association and its subcontractors. The science data are downlinked via the Deep Space Network Antennae in Bear Lakes, Ussurijsk, and Baykonur, funded by Roskosmos. The eROSITA data used in this work were processed using the eSASS software system developed by the German eROSITA consortium and proprietary data reduction and analysis software developed by the Russian eROSITA Consortium. This research has made use of data obtained from the 4XMM serendipitous source catalogue compiled by the XMM–Newton Survey Science Centre consortium. This work was supported by the Russian Science Foundation within scientific project no. 19-12-00396.
DATA AVAILABILITY
The catalogues presented in this article are available at the SRG mission’s website.6 They also will be made publicly available via the VizieR7 system. SRG/eROSITA spectra and light curves of the sources published in this paper can be made available upon a reasonable request.
Footnotes
United Kingdom Infrared Telescope.
Namely, we expect ∼2 Gaia stars to be found by chance within 10 arcsec of the 30 sources in Table A1.
After we had finished most of this study, the 13th version of 4XMM catalogue was released. Nevertheless, we continued to use DR12 in this work, because no new observations have been conducted in the UDS field after 2015, and the preceding period is fully covered by the 12th version.
References
APPENDIX: AUXILIARY SOURCE TABLES
Table A1 lists sources detected by eROSITA in the 0.3–2.3 keV energy band in the eUDS field that do not have counterparts in the 4XMM-DR12 catalogue (Webb et al. 2020). To estimate XMM–Newton flux upper limits, we use the FLIX8 sensitivity estimator, provided by the XMM–Newton Survey Science Centre at IRAP. FLIX estimates detection thresholds by using the algorithm described by Carrera et al. (2007). Specifically, we estimated the upper limits for a detection likelihood threshold of 10 (∼4σ) and an aperture of 30 arcsec radius. For each source, we selected the most stringent upper limit among those provided for all available XMM–Newton observations and EPIC cameras.
eUDS sources detected in the 0.3–2.3 keV energy band with detection likelihood DET_LIKE > 10 and without a 4XMM-DR12 counterpart within 15 arcsec.
| SRGe name | RA | Dec | RADEC_ERR | DET_LIKE | Fluxa) | XMM ULb) | Notes |
|---|---|---|---|---|---|---|---|
| (J2000) | (J2000) | (arcsec) | (0.3–2.3 keV) | (0.3–2.3 keV) | |||
| J021620.5-041529 | 34.08527 | −4.25799 | 4.53 | 11.58 | 12.85 ± 4.11 | 4.42 | – |
| J021625.1-044550 | 34.10446 | −4.76381 | 2.76 | 22.55 | 10.76 ± 2.58 | 4.03 | – |
| J021732.2-045751 | 34.38423 | −4.96416 | 3.79 | 11.81 | 5.22 ± 1.64 | 1.46 | – |
| J021748.1-044407 | 34.45059 | −4.73531 | 2.89 | 15.33 | 5.28 ± 1.39 | 2.35 | – |
| J021749.3-051541 | 34.45526 | −5.26147 | 3.21 | 21.84 | 13.44 ± 3.13 | 1.70 | – |
| J021755.4-043720 | 34.48091 | −4.62234 | 2.38 | 24.87 | 6.19 ± 1.32 | 2.60 | – |
| J021802.0-044125 | 34.50821 | −4.69039 | 3.49 | 11.97 | 4.36 ± 1.20 | 2.98 | – |
| J021841.4-053250 | 34.67247 | −5.54710 | 7.62 | 13.18 | 21.30 ± 5.84 | 2.81 | – |
| J021854.0-044647 | 34.72501 | −4.77983 | 4.14 | 11.13 | 3.77 ± 1.05 | 3.05 | AGNc) |
| J021904.6-051446 | 34.76907 | −5.24613 | 4.67 | 11.21 | 6.99 ± 2.23 | 1.53 | – |
| J021910.9-041417 | 34.79530 | −4.23795 | 3.63 | 13.75 | 4.51 ± 1.19 | 2.79 | – |
| J021912.2-044257 | 34.80074 | −4.71577 | 3.78 | 19.36 | 4.48 ± 1.02 | 2.85 | – |
| J021916.3-044756 | 34.81790 | −4.79894 | 3.96 | 10.97 | 3.58 ± 1.02 | 3.83 | – |
| J021922.6-044706 | 34.84414 | −4.78513 | 2.77 | 33.95 | 6.34 ± 1.18 | 4.00 | – |
| J021923.2-041436 | 34.84647 | −4.24336 | 3.59 | 12.45 | 3.77 ± 1.06 | 2.88 | – |
| J021925.8-043408 | 34.85761 | −4.56899 | 2.70 | 17.00 | 3.29 ± 0.82 | 3.50 | – |
| J021937.1-042941 | 34.90459 | −4.49470 | 4.59 | 15.39 | 3.85 ± 0.95 | 3.43 | – |
| J021939.7-044238 | 34.91538 | −4.71047 | 3.04 | 13.58 | 3.70 ± 0.97 | 3.36 | – |
| J021943.5-044854 | 34.93117 | −4.81507 | 5.09 | 11.63 | 3.75 ± 1.07 | 2.02 | – |
| J021945.5-040058 | 34.93961 | −4.01602 | 5.66 | 10.56 | 7.53 ± 2.11 | 2.91 | – |
| J021949.3-042907 | 34.95531 | −4.48518 | 1.42 | 131.41 | 12.29 ± 1.46 | 2.87 | – |
| J021953.7-043008 | 34.97364 | −4.50216 | 3.44 | 11.41 | 2.62 ± 0.78 | 2.75 | AGNd) |
| J022022.7-043200 | 35.09464 | −4.53317 | 3.35 | 14.14 | 3.26 ± 0.92 | 2.55 | Stare) |
| J022026.9-052437 | 35.11202 | −5.41041 | 4.99 | 13.58 | 19.96 ± 5.91 | 1.93 | – |
| J022035.3-054332 | 35.14713 | −5.72546 | 7.00 | 11.48 | 55.64 ± 18.50 | 4.97 | – |
| J022059.3-053617 | 35.24724 | −5.60464 | 10.71 | 15.18 | 46.94 ± 14.29 | 3.61 | – |
| J022117.5-035824 | 35.32308 | −3.97327 | 3.72 | 16.06 | 19.58 ± 5.65 | 3.70 | – |
| J022147.6-035613 | 35.44819 | −3.93699 | 4.32 | 23.26 | 35.54 ± 8.83 | 2.14 | – |
| J022148.1-043018 | 35.45026 | −4.50488 | 4.26 | 16.64 | 26.63 ± 6.53 | 2.34 | – |
| J022204.7-043247 | 35.51956 | −4.54651 | 10.29 | 14.62 | 44.20 ± 11.76 | 2.74 | Galaxy clusteri) |
Notes. aThe SRG/eROSITA flux is given in units of 10−15 erg s−1 cm−2.
bThe 4XMM-DR12 upper limit is given in units of 10−15 erg s−1 cm−2.
c2XLSSd J021854.5-044649 at 5 arcsec, zphot = 0.8654 (Melnyk et al. 2013).
d2XLSSd J021953.7-043011 at 3 arcsec, zphot = 2.2618 (Melnyk et al. 2013).
eGaia DR3 2489806835142590208 at 2 arcsec, distance D = 107.7 ± 0.4 pc.
iX-CLASS 169 at 13 arcsec, zspec = 0.32 (Koulouridis et al. 2021).
Table A2 describes the columns of the catalogue of 4XMM-DR12 sources in the eUDS field with forced eROSITA photometry.
Description of columns of the list of sources from the 4XMM-DR12 catalogue (Webb et al. 2020) with forced SRG/eROSITA photometry.
| Column | Units | Description |
|---|---|---|
| 4XMM-DR12 original data | ||
| DR12_IAU_NAME | ... | Source IAU name |
| DR12_SRCID | ... | Source ID number (64-bit integer) |
| DR12_RA | (°) | Right ascension (J2000) |
| DR12_DEC | (°) | Declination (J2000) |
| DR12_RADEC_ERR | arcsec | Positional error |
| SRG/eROSITA forced PSF-fitting in five energy bands (Band=0,1,2,3,4); 5 × 9 columns | ||
| DET_LIKE_Band | ... | Detection likelihood |
| ML_RATE_Band | cts s−1 | Source count rate measured by PSF-fitting |
| ML_RATE_ERR_Band | cts s−1 | 1 − σ count rate error |
| ML_CTS_Band | cts | Source net count estimated from count rate |
| ML_CTS_ERR_Band | cts | 1 − σ source count error |
| ML_FLUX_Band | erg cm−2 s−1 | Source flux in a given energy band measured by PSF-fitting |
| ML_FLUX_ERR_Band | erg cm−2 s−1 | 1 − σ source flux error |
| ML_EXP_Band | s | Vignetted exposure time in source position |
| ML_BKG_Band | cts arcmin−2 | Background in source position |
| CONF | – | True if source is located within 60 arcsec from another source with 0.3–2.3 keV flux >10−14 erg s−1 cm−2 |
Table A3 lists 4XMM-DR12 sources whose flux has increased at least tenfold in the eUDS survey compared to 4XMM-DR12. In addition to the average 4XMM-DR12 flux, we report information on individual XMM–Newton detections. 4XMM-DR12 sources with spatial confusion in eUDS has been removed from the list (see Section 4.4).
List of 4XMM-DR12 sources whose forced eUDS flux has increased by at least a factor of 10 with respect to the 4XMM-DR12 catalogue.
| 4XMM name | 4XMM fluxa) | eUDS fluxb) | Ratio | N|$_{\rm det}^{\rm c)}$| | Dated) | Notes |
|---|---|---|---|---|---|---|
| J021826.2–044126 | 0.74 ± 0.37 | 7.99 ± 1.35 | 10.85 | 2 | – | |
| 2.12 ± 0.91 | – | – | 2000-08-06 | – | ||
| 0.48 ± 0.40 | – | – | 2017-01-02 | – | ||
| J021913.3–052656 | 7.89 ± 0.69 | 100.04 ± 9.60 | 12.68 | 3 | AGN, zspec = 0.628724 | |
| 8.36 ± 0.84 | – | – | 2002-08-09 | SDSS J021913.32-052656.3 | ||
| 7.30 ± 1.47 | – | – | 2006-07-31 | (Menzel et al. 2016) | ||
| 8.25 ± 2.40 | – | – | 2016-07-04 | – | ||
| J021940.7–042043 | 0.63 ± 0.27 | 8.26 ± 1.25 | 13.08 | 4 | Star, D = 118.3 ± 0.5 pc | |
| 4.09 ± 1.57 | – | – | 2003-01-26 | HD 14417 | ||
| 4.29 ± 1.58 | – | – | 2007-01-08 | – | ||
| 0.26 ± 0.38 | – | – | 2016-07-03 | – | ||
| 0.58 ± 0.42 | – | – | 2016-07-03 | – | ||
| J022026.2-041624 | 1.84 ± 0.35 | 28.10 ± 2.63 | 15.31 | 5 | AGN, zspec = 0.331135 | |
| 1.96 ± 0.62 | – | – | 2003-01-25 | SDSS J022026.28-041623.6 | ||
| 1.17 ± 0.51 | – | – | 2016-07-03 | (Menzel et al. 2016) | ||
| 3.12 ± 0.90 | – | – | 2016-07-05 | – | ||
| 6.17 ± 3.05 | – | – | 2017-01-01 | – | ||
| 8.04 ± 2.51 | – | – | 2017-01-03 | – | ||
| J022131.1–050027 | 1.53 ± 0.32 | 21.37 ± 5.88 | 13.97 | 4 | – | AGN, zphot = 1.9844 |
| 3.12 ± 1.01 | – | – | 2003-07-24 | 2XLSSd J022131.2-050035 | ||
| 2.89 ± 0.65 | – | – | 2016-07-06 | (Melnyk et al. 2013) | ||
| 3.73 ± 1.33 | – | – | 2017-01-03 | – | ||
| 0.88 ± 0.46 | – | – | 2017-01-16 | – |
Notes. aThe weighted mean flux and fluxes in individual observations provided by the 4XMM-DR12 catalogue and converted to the 0.3–2.3 keV band (Section 4.4). The first line for each source is the average flux of all the detections of the source weighted by the errors. The flux is given in units of 10−15 erg s−1 cm−2.
bThe 0.3–2.3 keV eUDS flux is given in units of 10−15 erg s−1 cm−2.
cNumber of detections of the source in the 4XMM-DR12 catalogue.
dDates of the 4XMM-DR12 observations.
Table A4 lists 4XMM-DR12 sources whose flux has decreased at least tenfold in the eUDS survey compared to 4XMM-DR12.
List of 4XMM-DR12 sources whose forced eUDS flux has decreased by at least a factor of 10 with respect to the 4XMM-DR12 catalogue.
| 4XMM name | 4XMM fluxa) | eUDS fluxb) | Ratio | N|$_{\rm det}^{\rm c)}$| | Dated) | Notes |
|---|---|---|---|---|---|---|
| J021522.0−043700 | 10.13 ± 5.57 | <0.97 | >10.44 | 1 | 2008-07-03 | – |
| J021606.6−050316 | 22.85 ± 1.77 | 1.40 ± 2.46 | 16.32 | 1 | 2002-08-12 | – |
| J021619.3−044143 | 12.63 ± 4.41 | <0.94 | >13.44 | 1 | 2007-01-08 | – |
| J021652.9−051059 | 11.37 ± 0.82 | <1.04 | >10.93 | 2 | – | AGN 259, zspec = 1.424 |
| 11.98 ± 1.11 | – | – | – | 2002-08-08 | (Ueda et al. 2008; Nobuta et al. 2012) | |
| 10.61 ± 1.22 | – | – | – | 2002-08-12 | – | |
| J021706.3−050839 | 23.97 ± 1.07 | <0.44 | >22.40 | 2 | – | – |
| 24.46 ± 1.32 | – | – | – | 2002-08-08 | – | |
| 23.54 ± 1.83 | – | – | – | 2002-08-12 | – | |
| J021733.8−051311 | 50.83 ± 3.61 | <2.85 | >17.83 | 3 | – | – |
| 40.68 ± 6.06 | – | – | – | 2000-08-01 | – | |
| 56.40 ± 6.43 | – | – | – | 2000-08-03 | – | |
| 57.48 ± 6.77 | – | – | – | 2002-08-08 | – | |
| J021800.4−040650 | 12.17 ± 0.74 | <1.07 | >11.38 | 3 | – | AGN, zspec = 1.048411 |
| 9.63 ± 1.11 | – | – | – | 2007-01-08 | SDSS J021800.49-040649.2 | |
| 13.41 ± 1.75 | – | – | – | 2016-07-02 | (Menzel et al. 2016) | |
| 15.19 ± 1.22 | – | – | – | 2015-02-07 | – | |
| J021846.2−034754 | 13.16 ± 1.62 | <1.23 | >10.70 | 1 | 2007-01-10 | AGN, zphot = 1.650 |
| – | – | – | – | – | (Melnyk et al. 2013; Pierre et al. 2016) | |
| – | – | – | – | – | XMMXCS J021911.4-034416.1 (Wilcox et al. 2015; Zou et al. 2021) | |
| J021932.2−040153 | 111.50 ± 8.09 | 11.00 ± 2.09 | 10.14 | 1 | 2017-01-01 | Star Gaia DR3 2489887138146547456, D = 344 ± 5 pc |
| J021935.4−044815 | 12.00 ± 5.02 | <0.28 | >42.86 | 1 | 2002-08-14 | – |
| J021938.9−042102 | 19.04 ± 6.30 | <0.49 | >38.86 | 1 | 2016-07-03 | – |
| J022005.7−033919 | 12.64 ± 1.54 | <1.20 | >10.53 | 2 | – | AGN, zspec = 1.134424 (Menzel et al. 2016) |
| 11.30 ± 2.27 | – | – | – | 2002-08-15 | SDSS J022005.81-033919.2 | |
| 13.80 ± 2.09 | – | – | – | 2007-01-10 | – | |
| J022016.8−045646 | 12.30 ± 0.88 | <0.90 | >13.66 | 2 | – | AGN, zspec = 0.516915 (Menzel et al. 2016) |
| 11.12 ± 0.97 | – | – | – | 2000-08-05 | SDSS J022016.86-045646.3 | |
| 17.69 ± 2.08 | – | – | – | 2002-08-14 | – | |
| J022037.4−044924 | 14.96 ± 6.71 | <0.85 | >17.60 | 1 | 2017-01-01 | – |
| J022127.4−050402 | 12.21 ± 4.76 | <1.20 | >10.17 | 1 | 2016-07-06 | – |
| J022150.5−041915 | 13.73 ± 0.87 | <1.25 | >10.98 | 4 | – | – |
| 16.22 ± 1.31 | – | – | – | 2016-07-07 | – | |
| 20.61 ± 2.52 | – | – | – | 2016-07-07 | – | |
| 12.27 ± 1.78 | – | – | – | 2016-07-29 | – | |
| 7.78 ± 2.15 | – | – | – | 2016-07-29 | – | |
| J022152.9−040547 | 10.71 ± 0.65 | <1.07 | >10.00 | 4 | AGN, zspec = 0.431445 (Menzel et al. 2016) | |
| 12.25 ± 1.46 | – | – | – | 2006-07-07 | SDSS J022152.93-040546.7 | |
| 9.09 ± 0.90 | – | – | – | 2016-07-07 | – | |
| 18.04 ± 1.86 | – | – | – | 2016-07-29 | – | |
| 10.13 ± 1.87 | – | – | – | 2017-01-04 | – |
Notes. aThe weighted mean flux and fluxes in individual observations provided by the 4XMM-DR12 catalogue and converted to the 0.3–2.3 keV band (Section 4.4). The first line for each source is the average flux of all the detections of the source weighted by the errors. The flux is given in units of 10−15 erg s−1 cm−2.
bThe 0.3–2.3 keV eUDS flux is given in units of 10−15 erg s−1 cm−2. The upper limits are given for 1σ confidence.
cNumber of detections of the source in the 4XMM-DR12 catalogue.
dDates of the 4XMM-DR12 observations.
Table A5 lists eUDS sources detected with eROSITA in the 2.3–5 keV energy band with detection likelihood DET_LIKE > 10.
List of sources detected in the 2.3–5 keV energy band with detection likelihood DET_LIKE > 10.
| SRGe name | RA | Dec | DET_LIKE | Fluxa) | Fluxa) | HRb) |
|---|---|---|---|---|---|---|
| (J2000) | (J2000) | (2.3–5 keV) | (0.3–2.3 keV) | |||
| J021839.1-042046 | 34.66302 | −4.34599 | 159.45 | 178.28 ± 19.40 | 375.59 ± 7.45 | −0.36 ± 0.04 |
| J021606.0-051723 | 34.02506 | −5.28966 | 93.49 | 628.55 ± 98.78 | 1043.83 ± 33.83 | −0.25 ± 0.06 |
| J022105.4-044100 | 35.27257 | −4.68339 | 83.88 | 238.50 ± 33.44 | 300.32 ± 9.21 | −0.11 ± 0.06 |
| J021817.5-045114 | 34.57307 | −4.85384 | 58.01 | 121.06 ± 19.12 | 219.19 ± 6.12 | −0.29 ± 0.06 |
| J021808.2-045848 | 34.53414 | −4.98009 | 41.16 | 130.30 ± 25.56 | 418.58 ± 11.47 | −0.53 ± 0.06 |
| J022006.0-042450 | 35.02516 | −4.41398 | 32.63 | 53.02 ± 11.42 | 32.03 ± 2.35 | 0.25 ± 0.14 |
| J022000.6-043948 | 35.00231 | −4.66321 | 26.42 | 41.03 ± 9.73 | 99.68 ± 3.87 | −0.42 ± 0.08 |
| J021712.1-044248 | 34.30023 | −4.71345 | 26.37 | 83.12 ± 19.89 | <7 | – |
| J021855.2-044332 | 34.73002 | −4.72543 | 25.02 | 58.69 ± 12.40 | <5 | – |
| J022013.3-045115 | 35.05546 | −4.85426 | 24.18 | 57.88 ± 14.01 | 73.62 ± 3.85 | −0.12 ± 0.11 |
| J022011.1-042003 | 35.04636 | −4.33412 | 22.96 | 67.77 ± 15.14 | 361.28 ± 7.83 | −0.68 ± 0.05 |
| J021952.0-040922 | 34.96665 | −4.15618 | 19.25 | 58.87 ± 14.61 | 102.50 ± 4.72 | −0.27 ± 0.10 |
| J021822.0-043454 | 34.59163 | −4.58158 | 18.79 | 47.56 ± 11.50 | 29.84 ± 2.19 | 0.23 ± 0.16 |
| J022016.5-040447 | 35.06876 | −4.07984 | 15.62 | 76.87 ± 20.04 | 7.71 ± 1.82 | 0.82 ± 0.31 |
| J021923.5-045148 | 34.84787 | −4.86341 | 14.36 | 56.11 ± 14.36 | 109.13 ± 4.25 | −0.32 ± 0.10 |
| J021642.4-043556 | 34.17664 | −4.59902 | 13.67 | 77.23 ± 22.82 | 26.37 ± 3.41 | 0.49 ± 0.25 |
| J021832.1-041346 | 34.63371 | −4.22933 | 11.35 | 47.43 ± 14.73 | 127.22 ± 5.31 | −0.46 ± 0.10 |
| J021942.0-042809 | 34.92518 | −4.46922 | 11.30 | 23.63 ± 7.39 | 30.03 ± 2.05 | −0.12 ± 0.14 |
| J021945.3-052235 | 34.93884 | −5.37636 | 11.16 | 133.24 ± 42.66 | <10 | |
| J021921.8-043642 | 34.84074 | −4.61154 | 11.04 | 25.60 ± 7.87 | 26.24 ± 1.95 | −0.01 ± 0.16 |
| J021944.8-044155 | 34.93659 | −4.69859 | 10.28 | 28.42 ± 8.96 | 40.84 ± 2.50 | −0.18 ± 0.14 |
Note. aThe flux is given in units of 10−15 erg s−1 cm−2. b) Hardness ratio, calculated as (F2.3-5 keV − F0.3-2.3 keV)/(F0.3-2.3 keV + F2.3-5 keV).
Table A6 described the columns of the main eUDS catalogue.
Description of columns in the eUDS catalogue.
| Column | Units | Description |
|---|---|---|
| PSF-fitting source detection in the 0.3–2.3 keV band; 18 columns | ||
| ID_SRC | ... | Source ID |
| NAME | ... | Source name in format SRGe JHHMMSS.s+/-DDMMSS based on input RA and Dec. |
| RAa | (°) | Right ascension (J2000) |
| DECa | (°) | Declination (J2000) |
| RADEC_ERRa | arcsec | Positional error (68 % confidence) |
| EXT | arcsec | Extension of the source |
| EXT_ERR | arcsec | Extent uncertainty |
| EXT_LIKE | ... | Extent likelihood |
| DET_LIKE | ... | Detection likelihood |
| ML_RATE | cts s−1 | Source count rate measured by PSF-fitting |
| ML_RATE_ERR | cts s−1 | 1 − σ count rate error |
| ML_CTS | cts | Source net counts estimated from the count rate |
| ML_CTS_ERR | cts | 1 − σ source count error |
| ML_FLUX | erg cm−2 s−1 | Source flux in the 0.3–2.3 keV band measured by PSF-fitting |
| ML_FLUX_ERR | erg cm−2 s−1 | 1 − σ source flux error |
| ML_EXP | s | Vignetted 0.3–2.3 keV exposure time at source position |
| ML_BKG | cts arcmin−2 | Background at source position |
| DR12_IAU_NAME | ... | 4XMM-DR12 source name used for forced photometry |
| Forced PSF-fitting for four energy bands (Band = 1,2,3,4); 4 × 9 = 36 columns | ||
| DET_LIKE_Band | ... | Detection likelihood |
| ML_RATE_Band | cts s−1 | Source count rate measured by PSF-fitting |
| ML_RATE_ERR_Band | cts s−1 | 1 − σ count rate error |
| ML_CTS_Band | cts | Source net count estimated from the count rate |
| ML_CTS_ERR_Band | cts | 1 − σ source count error |
| ML_FLUX_Band | erg cm−2 s−1 | Source flux in a given energy band measured by PSF-fitting |
| ML_FLUX_ERR_Band | erg cm−2 s−1 | 1 − σ source flux error |
| ML_EXP_Band | s | Vignetted exposure time at source position |
| ML_BKG_Band | cts arcmin−2 | Background at source position |
Note. aIn case of fixed source positions (column DR12_NAME is not empty), these values are taken from the 4XMM-DR12 catalogue (Webb et al. 2020).
