


ABSTRACT
We report the discovery of 40 new satellite dwarf galaxy candidates in the sphere of influence of the Sombrero Galaxy (M104), the most luminous galaxy in the Local Volume. Using the Subaru Hyper Suprime-Cam, we surveyed 14.4 deg2 of its surroundings, extending to the virial radius. Visual inspection of the deep images and galfit modelling yielded a galaxy sample highly complete down to Mg ∼ −9 (|$L_{g}\sim 3\times 10^{5}\ \mathrm{ L}_\odot$|) and spanning magnitudes −16.4 < Mg < −8 and half-light radii 50 pc < re < 1600 pc assuming the distance of M104. These 40 new candidates, out of which 27 are group members with high confidence, double the number of potential satellites of M104 within the virial radius, placing it among the richest hosts in the Local Volume. Using a principal component analysis, we find that the entire sample of candidates is consistent with an almost circular on-sky distribution, more circular than any comparable environment found in the Illustris TNG100-1 (The Next Generation) simulation. However, the distribution of the high-probability sample is more oblate and consistent with the simulation. The cumulative satellite luminosity function is broadly consistent with analogues from the simulation, albeit it contains no bright satellite with Mg < −16.4 (|$L_{g}\sim 3 \times 10^{8}\ \mathrm{ L}_\odot$|), a |$2.3\, \sigma$| occurrence. Follow-up spectroscopy to confirm group membership will begin to demonstrate how these systems can act as probes of the structure and formation history of the halo of M104.
1 INTRODUCTION
1.1 Background
The Lambda cold dark matter (ΛCDM) model is the predominant and generally accepted cosmological model predicting the formation of galactic structures and has been well studied through observations (Abbott et al. 2018; Planck Collaboration VI 2020; Alam et al. 2021; Brout et al. 2022) and simulations (Springel et al. 2008; Vogelsberger et al. 2014; Schaye et al. 2015; Griffen et al. 2016; Pillepich et al. 2017). Central to the ΛCDM paradigm is the mechanism through which collisionless dark matter forms gravitationally bound haloes with a continuous spectrum of masses. Baryonic matter then generally becomes bound to these underlying dark matter haloes in sufficient quantities to form observable stars and galaxies, from massive host L* galaxies to gravitationally bound satellite dwarf galaxies (Klypin et al. 1999; Moore et al. 1999; Springel et al. 2008; Garrison-Kimmel et al. 2014; Griffen et al. 2016; Kelley et al. 2019). Large-scale cosmological simulations have provided a critical test bed for detailed comparisons with the Universe as it is observed, providing the means to evaluate the importance of the various physical mechanisms that influence star formation and the assembly of observable galaxies.
These comparisons have previously revealed numerous interesting and surprising discrepancies between observations and simulations. Here, we focus on issues at scales involving single L* host galaxy and small galaxy group environments and the satellite dwarf galaxies, which are bound to them, generally on the scales smaller than 1 Mpc. The most discussed issues historically included the ‘missing satellites’, ‘core-cusp’, and ‘too-big-to-fail’ (TBTF) problems (see Bullock & Boylan-Kolchin 2017 for a review), but have since been alleviated by the addition of baryon physics in cosmological zoom-in simulations (Ogiya & Mori 2011; Buck et al. 2018; Garrison-Kimmel et al. 2019; Wheeler et al. 2019).
The inclusion of baryon physics alone, however, does not resolve a fourth problem known as the ‘disc-of-satellites’ or ‘satellite plane’ phenomenon. A satellite plane is a co-orbiting, aligned flattened distribution of satellite galaxies, which is known to exist in the Local Group (Lynden-Bell 1976; Kroupa, Theis & Boily 2005; Metz, Kroupa & Jerjen 2007; Pawlowski, Pflamm-Altenburg & Kroupa 2012; Conn et al. 2013; Ibata et al. 2013; Pawlowski & Kroupa 2019) and the Centaurus A (Cen A)/M83 Group (Tully et al. 2015; Müller et al. 2018a, 2019; Kanehisa et al. 2023). Indications of satellite planes also exist in the NGC253 (Martínez-Delgado et al. 2021), M81 (Chiboucas et al. 2013), M101 (Müller et al. 2017), and M83 systems (Müller, Rejkuba & Jerjen 2018b). All of these host galaxies together reside in the Local Sheet, a large-scale planar structure of nearby galaxy groups, which are collectively moving towards the Virgo cluster (Tully et al. 2008). While surveys for planar systems outside of the Local Sheet are ongoing (such as the Mass Assembly of early-Type GaLAxies with their fine Structures survey, or MATLAS; Heesters et al. 2021), nearly all have been confined to be within this cosmological structure.
A number of landmark studies find that observations of anisotropic, flattened satellite systems clash with results from ΛCDM simulations, which do not commonly produce planar alignments of satellite galaxies about hosts, let alone display co-orbiting behaviour (Metz, Kroupa & Jerjen 2009a; Ibata et al. 2013; Müller et al. 2018a; Pawlowski & Kroupa 2019; Pawlowski 2021). Solutions have been put forward, first of a physical nature in which satellite galaxies are formed or accreted within the ΛCDM paradigm that are rare or not properly reproduced. Such proposals include galaxy accretion along flattened or narrow cosmic filaments (Libeskind et al. 2010; Lovell et al. 2011), group infall of dwarf galaxies (Metz et al. 2009b) and galactic fragments, or tidal dwarf galaxies, rotating in thin planes emerging from galactic interactions (Kroupa, Theis & Boily 2005; Metz & Kroupa 2007; Kroupa 2012; Pawlowski et al. 2012; Hammer et al. 2013). However, these solutions present implications that are mostly unobserved, including the width of cosmic filaments and patterns in star formation histories (see Pawlowski 2018 for a review). Cautun et al. (2015) made a number of statistical arguments that the analyses of these extraordinary observations of planar satellite systems have been influenced by the ‘look-elsewhere’ effect and method selection bias. That is, methods and results were tuned such that statistical significance was maximized and that when appropriately accounted for, the significance drops from |$3 \sigma \! \! - \! \! 5 \sigma$| to ∼2σ. More recent hypotheses found that the rare analogues in simulations that possessed a thin co-rotating satellite plane were transient and suggested that the observed satellite planes are not stable structures (Bahl & Baumgardt 2014; Gillet et al. 2015; Buck, Dutton & Macciò 2016; Shao, Cautun & Frenk 2019). However, Pawlowski & Kroupa (2019) and Pawlowski & Sohn (2021) found that proper motions from Gaia Data Release 2 and Hubble Space Telescope (HST) data indicate that the co-rotating thin planes are stable. On the other side of the discussion, artificially elevated subhalo destruction in simulations for satellites with small orbital pericentres was used to suggest that the Milky Way satellite plane is a transitory structure consistent with ΛCDM simulations (Sawala et al. 2022).
This discussion surrounding satellite planes is ongoing and has always been advanced by the introduction of more, and higher resolution proper motions and distances of satellite galaxies. However, a uniting and conclusive finding that explains satellite planes eludes the discussion, where often the presence or absence of a co-rotating plane relies solely on the motions of one or two satellites. More complete analyses that move beyond re-analysis of the same Local Group satellite galaxies are elusive, primarily due to data limitations, but the few larger scale comparisons suggest that the so far largely unaccounted-for cosmological structures hosting nearby galaxies (namely, the Local Sheet) could introduce some bias (Libeskind et al. 2019). How strongly does the cosmological web influence the structure of a satellite plane? Is the presence of a satellite plane dependent on host galaxy mass and morphology? Are the Local Group and the satellite planes it contains a cosmological outlier? These questions cannot be fully answered with our current understanding and data.
This is motivating further surveys of satellite galaxy systems, to work towards building a data set free from statistical biases, and representative of the diversity of host galaxies, their satellite systems, and the varied cosmological environments in which they reside.
1.2 This work
In our study, we search for satellite galaxies in the surroundings of the most massive galaxy in the Local Volume, the Sombrero Galaxy (M104, also known as NGC4594 or PGC42407). We report 40 galaxies as new satellite candidates of M104 judged on their morphology, photometric properties, angular size, and structural parameters. We further derive stellar parameters for all 75 currently known satellite candidates using our deep Subaru Hyper Suprime-Cam (HSC) imaging data. M104 is a luminous and massive galaxy of an unusual morphology with a dominant spheroid and a prominent disc (see table 2 of Kang et al. 2022 for a compilation of morphological classifications), in many respects similar to Cen A. Historically, M104 has been classified as an SA(s)a spiral galaxy (A unbarred spiral galaxy with tight arms, Corwin, Buta & de Vaucouleurs 1994); however, recent analysis of its globular cluster system revealed a spatially segregated cluster population with a bimodal colour distribution more consistent with early-type galaxies, built through numerous accretion events with metal-poor dwarf galaxies (Kang et al. 2022). Additionally, M104 also possesses a huge stellar spheroid more consistent with elliptical galaxies rather than spiral galaxies (Gadotti & Sánchez-Janssen 2012). It is suggested that M104 acquired its unique characteristic and iconic disc recently after a merger with a gas-rich galaxy (Diaz et al. 2018; Kang et al. 2022).
M104 resides at a distance of 9.55 ± 0.34 Mpc (McQuinn et al. 2016) from the Milky Way and is located in the foreground of the Virgo cluster’s southern extension (Tully 1982; Kourkchi & Tully 2017). It is largely isolated from other host galaxies and resides within the Local Volume, a spherical region of space with a radius of ≈10 Mpc around the Milky Way (Karachentsev et al. 2015). Karachentsev et al. (2020) pointed out that ‘Many galaxies in the Virgo Southern Extension have radial velocities similar to that of Sombrero, but lie at greater distances typical of the Virgo cluster (15–20 Mpc).’
We estimate the virial radius R200 of M104 using the equation
from Kravtsov (2013), where M200 is the mass within that radius and ρcrit(z) is the critical density of the Universe as a function of redshift. M200 is estimated using M104’s stellar mass M* = 17.9 × 10¹⁰ M⊙ (Muñoz-Mateos et al. 2015) and the average M*/M200 ratio of 43.6 from selected galaxies in the TNG100-1 simulation (The Next Generation 100-1, Pillepich et al. 2017; Nelson et al. 2019), where the selection criteria and simulation are described in more detail in Section 5.2. This ratio from simulations agrees well with measured ratios from weak lensing, where Heymans et al. (2006) measured |$M_{*}/M_{\mathrm{ vir},\, (z=0)}=34\pm 12$|. In Table 1, we use the M*/M200 ratio from the TNG100-1 simulation to estimate the virial mass. We calculated the critical density at z = 0 using the expression
To be consistent with large-scale cosmological simulations, the adopted Hubble constant H0 above is that presented in Planck Collaboration VI (2020) (H0 = 67.4 km s−1 Mpc−1). With these parameters, the virial radius of M104 is estimated to be R200 ≈ 420 kpc. A complete list of basic parameters for M104 is given in Table 1.
Basic parameters of the host galaxy M104.
| Morphology | SA(s)a | Corwin et al. (1994) |
| RA(J2000) | 12:39:59.4 | |
| Dec.(J2000) | −11:37:23 | |
| v⊙ | 1095 km s−1 | Tully, Courtois & Sorce (2016) |
| D25 | |$8{_{.}^{\prime}} 7= 24.2\,$| kpc | Corwin et al. (1994) |
| Distance (TRGB) | |$9.55\pm 0.34\,$| Mpc | McQuinn et al. (2016)a |
| (m − M) | 29.90 ± 0.08 | McQuinn et al. (2016) |
| |$M_{B_T,0}$| | −21.51 mag | Corwin et al. (1994) |
| |$v_{\rm rot}^{\rm max}$| | 345 km s−1 | Schweizer (1978) |
| M* | 1.8 × 10¹¹ M⊙ | Muñoz-Mateos et al. (2015) |
| M200 | 7.8 × 10¹² M⊙ | This study |
| R200 | |$420\,$| kpc | This study |
Distance measurements from various techniques are given in table 2 of McQuinn et al. (2016).
2 OBSERVATIONS
We obtained CCD images of the M104 region in the HSC-g band using the HSC (Miyazaki et al. 2018) at the 8.2 m Subaru telescope at the Mauna Kea Observatories. The data acquisition was conducted as part of the observing proposal S18B0118QN (PI: H. Jerjen) on 2019 January 30–31. This proposal called for accompanying HSC-r2 imaging; however, this could not be completed due to poor weather conditions during one night. The average seeing for the HSC-g-band observations was 1.26 ± 0.39 arcsec. The HSC is equipped with an array of 104 4k × 2k science CCD detectors, with an angular diameter of 1.5° and a pixel scale of 0.169 arcsec at the centre of the field (Miyazaki et al. 2018). At the distance of M104, this angular diameter corresponds to a physical size of |$\sim\!\! 258\,$| kpc.
During the observing run, seven HSC pointings were observed in a hexagonal pattern, with the central field on M104, extending the survey area out to a complete spherical volume with radius |$\sim\!\! 380\,$| kpc at the distance of M104, which is approximately the virial radius of M104. Fig. 1 shows the survey footprint, nearby L* host galaxies, as well as known dwarf galaxies, and the new satellite candidates of M104. This observing configuration was chosen to achieve our scientific goal of detecting low surface brightness dwarf galaxies out to the virial radius of M104. Each HSC pointing consisted of three exposures: a short 30 s exposure for photometric calibration purposes and two 150 s exposures, dithered by half a CCD in RA and Dec. directions. This strategy allows us to detect satellite galaxies and low surface brightness dwarf galaxies down to a mean effective surface brightness of |${\sim \!\! 27.5\ \text{mag}\, \text{arcsec}^{-2}}$| as shown in Section 4.4.
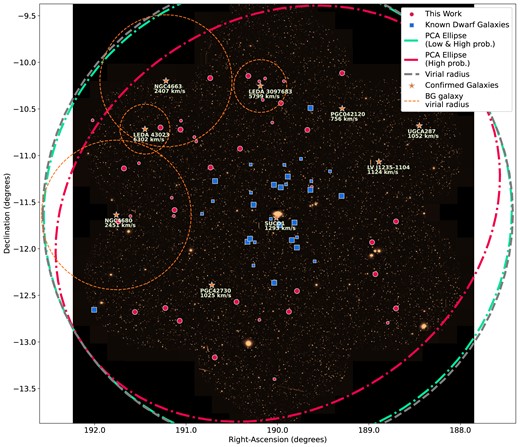
Map showing the HSC survey footprint centred around M104. Previously known dwarf satellite galaxy candidates are shown with squares, while new candidates from this workwith circles. The size of the symbols is proportional to the M104 group membership probability as determined in our analysis (see Section 4.1). Dark black areas are outside of the region captured by the telescope. The dashed line represents the approximate virial radius of M104, and the dash–dotted line represents the best-fitting PCA ellipse of the 2D satellite distribution as described in Section 5.2. The star symbols indicate the location of galaxies with measured LOS velocities and the smaller dotted circles about them denote the regions corresponding to the virial radius of background galaxies discussed in great detail in Section 4.5, which may be the source of low-probability candidates in that region.
We produced our final processed images from the raw telescope images using the data reduction pipeline described in our previous paper, Crosby et al. (2023). In short, the pipeline utilizes the hscpipe software (Bosch et al. 2018), which is based on the pipeline being developed for the Legacy Survey of Space and Time (LSST) Data Management system.The Panoramic Survey Telescope and Rapid Response System 1 (Pan-STARRS1) reference catalogue (Flewelling et al. 2020) is used for photometric calibration, with uncertainty in the photometric zero-point of σext = 0.087 mag.
3 KNOWN SATELLITE GALAXIES AND CANDIDATES
Previous studies have been conducted to search for satellite galaxies around M104 (Karachentsev et al. 2000, 2020; Javanmardi et al. 2016; Carlsten et al. 2020). Karachentsev et al. (2000) started building a list of dwarf satellite candidates of M104 with analysis of the European Southern Observatory/Science and Engineering Research Council (ESO/SERC) Southern Sky survey photographic plates, covering the entire field of M104 (−18° < δ < 0°), but had a shallow surface brightness limit of |$\mu \sim 25\!\!-\!\!26\ \text{mag}\, \text{arcsec}^{-2}$|. Javanmardi et al. (2016) used a network of small-diameter amateur telescopes to find satellite candidates in the central |$0.7\deg \, \times \, 0.7\deg$| (|$\sim\!\! 0.5\ {\deg }^2$|) area around M104, with a surface brightness limit of |$\mu \sim 27.5\ \text{mag}\, \text{arcsec}^{-2}$|. Carlsten et al. (2020) used archival Canada–France–Hawaii Telescope (CFHT) images, covering 70 per cent of the central 150 kpc region (|$\sim\!\! 2\ {\deg }^2$|) with a central surface brightness limit of |$\mu _{i,0}\sim 26\, \text{mag}\, \text{arcsec}^{-2}$|. Our survey, while possessing a surface brightness limit of μlim = 27.5 mag arcsec−2 (see Section 4.4 for details), has a total survey area of |$\sim\!\! 14.4\ {\deg }^2$|.
However, these surveys have either small fields of view, or magnitude limits capable of detecting only the brightest dwarf galaxies. In total, there are 35 known candidates within our survey footprint. Photometric, structural, and spatial parameters have been derived by us for all of them and are given in Table 2. It is important to note that our HSC images extend to approximately 1 virial radius of M104, as we are searching for dwarf galaxies that are confidently bound to the halo of M104. Other surveys may be searching for dwarf galaxies in a wider volume, up to 2–3 virial radii from M104. In those cases, it could be a survey of the M104 group, as in Karachentsev et al. (2020), where some of those dwarf galaxies may in reality reside in the field as unbound field dwarfs, without being strictly bound to M104. In the case of M104, there also exists a nearby galaxy group with an approximate Line Of Sight (LOS) velocity of ∼1400 km s−1, including NGC4700, NGC4742, NGC4781, NGC4804, and LEDA 43345, and may possess a wealthy system of satellites by itself. Extending the survey to the 2–3 virial radii regime, without LOS velocities for the dwarf galaxies in that region, risks misinterpreting dwarf galaxies as satellites of M104, which could actually be satellites of this background galaxy group.
Fundamental parameters and spatial information of all satellites and candidates of the M104 system. Photometric and structural properties are extracted from best-fitting galfit models as described in Section 4.2. Each column is as follows: (1) Galaxy name; (2) right ascension, RA(J2000); (3) declination, Dec.(J2000); (4) Galaxy morphology; (5) total g-band apparent magnitude; (6) g-band absolute magnitude corrected for Galactic extinction; (7) half-light radius in arcsec; (8) half-light radius in kiloparsec; (9) mean g-band surface brightness within the effective radius; (10) axis ratio b/a; (11) Sérsic index; (12) projected distance from M104; (13) group membership probability; and (14) low membership probability justification. For all satellites, we assume that the distance modulus is that of M104, μ = 29.9 ± 0.03 mag (McQuinn et al. 2016).
| Galaxy | RA | Dec. | Morph. | mg | Mg,0 | re | re | 〈μe, g〉 | Ax. ratio | n | ΔM104 | Memb. | Just. |
|---|---|---|---|---|---|---|---|---|---|---|---|---|---|
| name | (hh:mm:ss) | (hh:mm:ss) | type | (mag) | (mag) | (arcsec) | (kpc) | (mag) | – | – | (kpc) | prob. | – |
| (1) | (2) | (3) | (4) | (5) | (6) | (7) | (8) | (9) | (10) | (11) | (12) | (13) | (14) |
| UGCA287 | 12:33:55 | −10:40:48 | dIrr | 14.39 | −15.63 | 30.64 | 1.42 | 23.82 | 0.53 | 0.85 | 297.92 | Conf. | – |
| dw1234−1238 | 12:34:49 | −12:38:24 | dSph | 18.98 | −11.15 | 12.39 | 0.57 | 26.44 | 0.71 | 0.68 | 274.49 | High | – |
| dw1234−1142 | 12:34:49 | −11:42:25 | dTran | 17.3 | −12.77 | 12.25 | 0.57 | 24.74 | 0.65 | 0.74 | 216.34 | High | – |
| dw1235−1247 | 12:35:11 | −12:47:42 | dSph | 21.45 | −8.65 | 6.56 | 0.3 | 27.53 | 0.46 | 0.46 | 280.1 | Low | (iii) |
| LV J1235−1104 | 12:35:39 | −11:04:01 | BCD | 15.31 | −14.72 | 5.99 | 0.28 | 21.19 | 0.7 | 0.55 | 203.08 | Conf. | – |
| dw1235−1216 | 12:35:43 | −12:16:23 | dIrr | 17.86 | −12.26 | 10.79 | 0.5 | 25.02 | 0.4 | 0.4 | 208.55 | High | – |
| dw1235−1155 | 12:35:52 | −11:55:52 | dSph | 17.65 | −12.45 | 9.17 | 0.42 | 24.46 | 0.57 | 0.61 | 179.69 | High | – |
| dw1237−1006 | 12:37:10 | −10:06:58 | dSph | 18.03 | −11.97 | 15.69 | 0.73 | 26.0 | 0.46 | 0.77 | 277.37 | High | – |
| dw1237−1125 | 12:37:12 | −11:25:59 | dSph | 18.33 | −11.71 | 8.0 | 0.37 | 24.84 | 0.7 | 0.78 | 120.74 | High | – |
| PGC042120 | 12:37:14 | −10:29:46 | dIrr | 15.66 | −14.34 | 32.9 | 1.52 | 25.24 | 0.44 | 0.73 | 220.37 | Conf. | – |
| dw1237−1110 | 12:37:42 | −11:10:08 | dIrr | 18.44 | −11.32 | 6.71 | 0.31 | 24.83 | 0.51 | 1.25 | 121.86 | Low | (i), (iii), (v) |
| dw1238−1208 | 12:38:22 | −12:08:06 | dSph | 22.77 | −7.27 | 3.06 | 0.14 | 27.19 | 0.81 | 0.76 | 108.81 | Low | (ii), (iii) |
| dw1238−1120 | 12:38:30 | −11:20:10 | dSph | 22.07 | −7.96 | 3.24 | 0.15 | 26.62 | 0.7 | 0.52 | 78.58 | Low | (ii), (iii) |
| dw1238−1116 | 12:38:31 | −11:16:26 | dSph | 21.31 | −8.72 | 5.81 | 0.27 | 27.12 | 0.78 | 0.7 | 84.54 | Low | (iii) |
| KKSG31 | 12:38:33 | −10:29:24 | N-dSph | 16.73 | −13.56 | 24.26 | 1.12 | 25.36 | 0.9 | 0.9 | 198.12 | High | – |
| dw1238−1122 | 12:38:34 | −11:22:05 | dIrr | 19.2 | −10.83 | 5.78 | 0.27 | 25.01 | 0.64 | 0.84 | 73.26 | High | – |
| dw1238−1043 | 12:38:42 | −10:43:30 | dSph | 21.67 | −8.35 | 5.37 | 0.25 | 27.31 | 0.52 | 0.59 | 159.19 | High | – |
| dw1238−1102 | 12:38:58 | −11:02:10 | dSph | 20.88 | −9.14 | 5.08 | 0.24 | 26.4 | 0.79 | 0.55 | 106.68 | Low | (i), (iii) |
| dw1239−1227 | 12:39:09 | −12:27:14 | dSph | 21.56 | −8.54 | 4.48 | 0.21 | 26.81 | 0.96 | 0.57 | 142.91 | High | – |
| dw1239−1152 | 12:39:09 | −11:52:37 | dSph | 21.7 | −8.36 | 7.37 | 0.34 | 28.03 | 0.47 | 0.25 | 55.04 | Low | (iii) |
| dw1239−1159 | 12:39:09 | −11:59:13 | dSph | 19.24 | −10.81 | 13.34 | 0.62 | 26.87 | 0.88 | 1.14 | 70.04 | High | – |
| dw1239−1143 | 12:39:15 | −11:43:08 | N-dSph | 16.45 | −13.7 | 15.82 | 0.73 | 24.36 | 0.66 | 0.91 | 34.59 | High | – |
| dw1239−1154 | 12:39:22 | −11:54:25 | dSph | 21.42 | −9.22 | 7.05 | 0.33 | 27.08 | 0.9 | 0.4 | 53.93 | High | – |
| dw1239−1240 | 12:39:30 | −12:40:30 | N-dSph | 16.48 | −13.6 | 17.79 | 0.82 | 24.71 | 0.49 | 1.17 | 176.56 | High | – |
| NGC4594-DGSAT-3 | 12:39:33 | −11:13:34 | dSph | 18.08 | −11.95 | 16.42 | 0.76 | 26.15 | 0.91 | 0.6 | 68.71 | High | – |
| dw1239−1118 | 12:39:37 | −11:18:32 | dSph | 22.12 | −7.91 | 3.81 | 0.18 | 27.02 | 0.68 | 0.46 | 54.54 | Low | (ii), (iii) |
| dw1239−1106 | 12:39:42 | −11:05:60 | dSph | 21.15 | −8.88 | 4.64 | 0.21 | 26.48 | 0.64 | 0.51 | 88.04 | Low | (iii) |
| dw1239−1012 | 12:39:43 | −10:12:07 | dSph | 18.23 | −11.8 | 5.68 | 0.26 | 24.0 | 0.94 | 1.44 | 237.17 | Low | (i), (iii) |
| dw1239−1026 | 12:39:51 | −10:26:17 | dIrr | 20.17 | −9.85 | 7.88 | 0.36 | 26.65 | 0.61 | 0.99 | 197.63 | High | – |
| NGC4594-DGSAT-2 | 12:39:51 | −11:20:28 | dSph | 19.61 | −10.42 | 6.9 | 0.32 | 25.8 | 0.89 | 0.73 | 47.34 | High | – |
| NGC4594-DGSAT-1 | 12:39:55 | −11:44:46 | dSph | 17.15 | −12.91 | 28.36 | 1.31 | 26.41 | 0.75 | 1.03 | 20.74 | High | – |
| SUCD1 | 12:40:03 | −11:40:05 | UCD | 18.06 | −12.01 | 1.13 | 0.05 | 20.32 | 0.93 | 0.86 | 7.91 | Conf. | – |
| dw1240−1323 | 12:40:08 | −13:23:56 | dSph | 19.75 | −10.31 | 3.32 | 0.15 | 24.35 | 0.79 | 0.82 | 296.17 | Low | (iii), (v) |
| KKSG33 | 12:40:09 | −12:21:54 | dSph | 17.79 | −12.27 | 14.2 | 0.66 | 25.55 | 0.92 | 0.61 | 123.84 | High | – |
| dw1240−1118 | 12:40:09 | −11:18:50 | N-dSph | 15.87 | −14.19 | 15.53 | 0.72 | 23.8 | 0.94 | 1.17 | 51.96 | High | – |
| dw1240−1038 | 12:40:14 | −10:38:46 | dIrr | 20.5 | −9.47 | 8.24 | 0.38 | 27.13 | 0.52 | 1.07 | 163.16 | Low | (i), (iii), (v) |
| dw1240−1140 | 12:40:18 | −11:40:44 | dSph | 20.46 | −9.61 | 7.42 | 0.34 | 26.81 | 0.87 | 0.28 | 15.6 | Low | (vi) |
| dw1240−1010 | 12:40:32 | −10:10:23 | dIrr | 19.75 | −10.28 | 8.23 | 0.38 | 26.32 | 0.7 | 0.87 | 242.81 | Low | (iii), (v), (vi) |
| dw1240−1024 | 12:40:39 | −10:24:11 | dSph | 20.1 | −9.92 | 5.71 | 0.26 | 25.88 | 0.53 | 0.75 | 205.19 | Low | (i), (iii) |
| dw1240−1245 | 12:40:48 | −12:45:47 | dSph | 20.15 | −9.9 | 3.47 | 0.16 | 24.85 | 0.97 | 0.86 | 192.94 | Low | (iii), (v) |
| dw1240−1012 | 12:40:48 | −10:12:14 | dSph | 20.91 | −9.13 | 3.59 | 0.17 | 25.68 | 0.82 | 0.98 | 238.93 | Low | (iii) |
| dw1240−1155 | 12:40:60 | −11:55:48 | dIrr | 19.0 | −11.06 | 4.14 | 0.19 | 24.08 | 0.64 | 0.62 | 65.99 | Low | (iii), (v) |
| dw1241−1131 | 12:41:03 | −11:31:41 | N-dSph | 19.1 | −10.97 | 12.74 | 0.59 | 26.6 | 0.96 | 0.7 | 46.77 | High | – |
| dw1241−1210 | 12:41:03 | −12:10:48 | dSph | 19.82 | −10.26 | 3.73 | 0.17 | 24.67 | 0.61 | 0.72 | 102.81 | Low | (i), (iii), (v) |
| dw1241−1123 | 12:41:10 | −11:23:53 | dSph | 21.02 | −9.04 | 8.11 | 0.38 | 27.56 | 0.95 | 1.21 | 61.44 | Low | (iii) |
| dw1241−1105 | 12:41:10 | −11:05:49 | dSph | 21.83 | −8.16 | 2.69 | 0.12 | 26.01 | 0.81 | 0.71 | 100.52 | Low | (ii), (iii) |
| dw1241−1153 | 12:41:12 | −11:53:31 | dSph | 18.29 | −11.78 | 16.44 | 0.76 | 26.37 | 0.92 | 0.72 | 67.54 | High | – |
| dw1241−1008 | 12:41:17 | −10:08:46 | dSph | 19.9 | −10.12 | 5.83 | 0.27 | 25.72 | 0.83 | 1.06 | 251.99 | High | – |
| KKSG34 | 12:41:19 | −11:55:30 | N-dSph | 17.43 | −12.65 | 17.9 | 0.83 | 25.69 | 0.94 | 0.56 | 74.56 | High | – |
| dw1241−1055 | 12:41:38 | −10:55:34 | dSph | 19.61 | −10.42 | 17.84 | 0.83 | 27.86 | 0.8 | 0.8 | 134.96 | High | – |
| dw1241−1234 | 12:41:48 | −12:34:12 | dSph | 21.16 | −8.91 | 5.11 | 0.24 | 26.7 | 0.78 | 0.5 | 174.77 | High | – |
| dw1242−1116 | 12:42:44 | −11:16:26 | N-dSph | 19.01 | −11.07 | 11.65 | 0.54 | 26.33 | 0.76 | 0.89 | 128.14 | High | – |
| dw1242−1309 | 12:42:45 | −13:09:58 | dSph | 20.81 | −9.26 | 10.96 | 0.51 | 28.0 | 0.54 | 0.91 | 281.65 | High | – |
| PGC42730 | 12:42:49 | −12:23:24 | dSph | 13.72 | −16.36 | 35.44 | 1.64 | 23.45 | 0.71 | 1.28 | 173.77 | Conf. | – |
| dw1242−1129 | 12:42:50 | −11:29:20 | dSph | 21.18 | −8.9 | 3.63 | 0.17 | 25.98 | 0.78 | 0.46 | 120.27 | Low | (iii), (v) |
| dw1242−1107 | 12:42:56 | −11:07:41 | dSph | 19.21 | −10.83 | 16.52 | 0.76 | 27.3 | 0.91 | 0.86 | 147.57 | High | – |
| dw1242−1010 | 12:42:57 | −10:10:08 | dIrr | 20.97 | −9.05 | 7.98 | 0.37 | 27.47 | 0.69 | 0.53 | 271.83 | High | – |
| dw1243−1137 | 12:43:18 | −11:37:30 | dSph | 21.16 | −8.91 | 7.96 | 0.37 | 27.66 | 0.5 | 1.33 | 137.85 | Low | (iii) |
| dw1243−1050 | 12:43:33 | −10:50:56 | dSph | 19.01 | −11.03 | 5.27 | 0.24 | 24.61 | 0.57 | 1.29 | 196.73 | Low | (i), (iii) |
| dw1243−1048 | 12:43:38 | −10:48:07 | dSph | 20.95 | −9.09 | 2.28 | 0.11 | 24.73 | 0.91 | 0.66 | 204.55 | Low | (ii), (iii), (v) |
| dw1244−1037 | 12:44:13 | −10:37:34 | dIrr | 19.15 | −10.91 | 6.08 | 0.28 | 25.06 | 0.75 | 1.05 | 242.33 | Low | (iii), (v) |
| dw1244−1043 | 12:44:15 | −10:43:19 | dSph | 20.94 | −9.12 | 5.64 | 0.26 | 26.69 | 0.84 | 0.69 | 232.29 | High | – |
| dw1244−1246 | 12:44:17 | −12:46:23 | dSph | 20.39 | −9.68 | 8.32 | 0.39 | 26.99 | 0.82 | 0.52 | 262.08 | High | – |
| dw1244−1135 | 12:44:30 | −11:35:06 | dIrr | 20.85 | −9.22 | 5.72 | 0.26 | 26.63 | 0.45 | 0.65 | 188.14 | High | – |
| dw1244−1138 | 12:44:32 | −11:38:53 | dSph | 22.45 | −7.61 | 2.89 | 0.13 | 26.75 | 0.92 | 0.89 | 189.58 | Low | (ii), (iii) |
| dw1244−1127 | 12:44:38 | −11:27:11 | dIrr | 16.5 | −13.56 | 13.46 | 0.62 | 24.14 | 0.5 | 0.5 | 195.27 | Low | (i) |
| dw1244−1238 | 12:44:54 | −12:38:10 | dSph | 19.14 | −10.92 | 12.79 | 0.59 | 26.67 | 0.68 | 0.72 | 265.5 | High | – |
| dw1245−1041 | 12:45:07 | −10:41:56 | dTran | 18.44 | −11.59 | 7.38 | 0.34 | 24.78 | 0.59 | 0.9 | 263.44 | High | – |
| dw1246−1104 | 12:46:04 | −11:04:55 | dTran | 16.46 | −13.6 | 4.96 | 0.23 | 21.93 | 0.57 | 0.6 | 268.66 | Low | (i), (ii), (v) |
| dw1246−1240 | 12:46:14 | −12:40:44 | dSph | 19.42 | −10.64 | 7.2 | 0.33 | 25.7 | 0.59 | 0.75 | 314.33 | High | – |
| dw1246−1139 | 12:46:26 | −11:39:00 | dSph | 21.31 | −8.73 | 3.52 | 0.16 | 26.04 | 0.88 | 0.53 | 268.63 | Low | (iii) |
| dw1246−1108 | 12:46:43 | −11:08:17 | dSph | 21.02 | −9.02 | 4.07 | 0.19 | 26.06 | 0.75 | 0.56 | 291.85 | High | – |
| dw1246−1142 | 12:46:58 | −11:42:25 | dSph | 20.2 | −9.85 | 9.1 | 0.42 | 26.99 | 0.48 | 0.64 | 290.95 | High | – |
| KKSG37 | 12:48:01 | −12:39:18 | N-dSph | 16.87 | −13.18 | 24.9 | 1.15 | 25.87 | 0.77 | 0.77 | 376.44 | High | – |
| dw1248−1037 | 12:48:06 | −10:37:19 | dSph | 21.12 | −8.94 | 7.52 | 0.35 | 27.5 | 0.34 | 0.96 | 376.64 | Low | (iii) |
Despite these challenges, Karachentsev et al. (2020) considered galaxies within an angular radial distance of 6° or ∼1 Mpc in the characterization of M104 satellite galaxies, where within this region there may be ∼10 bright dIrrs (dwarf Irregulars) whose recessional velocities suggest that they are satellites of M104 or at least members of the M104 group. For the purposes of this paper, we consider just the system of satellites within the 1 virial radius cut-off for consistency with our HSC images and to avoid the currently unmanageable challenges of associating dwarf galaxies to the correct host in the wider region.
Prior to our study, there were 5 confirmed M104 satellites and 30 candidates within the virial radius limit. The confirmed dwarf satellites are UGCA287 (v⊙ = 1052 ± 9 km s−1; Corwin et al. 1994), LV J1235−1104 (v⊙ = 1124 ± 45 km s−1; Jones et al. 2009), PGC042120 (v⊙ = 756 ± 2 km s−1; Huchtmeier, Karachentsev & Karachentseva 2009), SUCD1 (v⊙ = 1293 ± 10 km s−1; Hau et al. 2009), and PGC42730 (v⊙ = 1025 ± 45 km s−1; Jones et al. 2009). These 35 objects have been classified by us as 5 ‘confirmed’, 16 ‘high’-probability, and 14 ‘low’-probability members. We describe what constitutes a ‘high’- or ‘low’-probability object in Section 4.1. The five unambiguous satellites of M104 were confirmed through follow-up spectroscopy. Of the remaining galaxies, still awaiting membership confirmation, the high-probability candidates are predominately early-type dwarf galaxies, with a number of them possibly possessing bright nuclear star clusters.
4 SEARCH FOR NEW M104 SATELLITE GALAXIES
In order to find new satellite galaxy candidates in the extended halo of M104, we search for unresolved, low surface brightness objects in our HSC observations. We employ this approach through a meticulous independent inspection of the entire survey area by three members of the team by-eye (as in Park et al. 2017; Habas et al. 2020; Müller & Jerjen 2020). The entire data set is also reviewed multiple times and possible objects are logged and categorized based on their morphology. The images of known dwarf galaxies in the M104 system (Fig. 3) serve as a guidance to the appearance of potential new satellite galaxies. Our strategy is a conservative one, we only present satellite galaxies here that are unlikely to be false-positive candidates. With this strategy, we can expect a success rate of 60–80 per cent (Müller et al. 2018a, 2019).
4.1 Visual detection of dwarf galaxy candidates
The full process for registering dwarf galaxy detections and the challenges associated with separating satellite candidates from background or foreground galaxies in the absence of distance and velocity measurements is described in our paper on the NGC2683 system (Crosby et al. 2023), but to summarize here satellite candidates are primarily detected through visual inspection of the morphology of extended objects resembling galaxies. Quenched early-type dwarf galaxies such as dSphs (dwarf Spheroidals) or dEs (dwarf Ellipticals) are often located in high-density galactic environments (Binggeli, Tammann & Sandage 1987) or nearby a host galaxy and thus are often safely categorized as satellites. By the same phenomenon, star-forming late-type dwarf galaxies including dIrr and transition-type dTran (dwarf Transition) galaxies preferentially inhabit the low-density environments, also known as field, outside of the influence of a host galaxy, such that it is inherently more difficult to categorize these galaxies as satellites of a host galaxy as they could reside in the outskirts of a group (Putman et al. 2021). Unresolved, small angular-sized dwarf galaxies such as blue compact dwarfs (BCDs) or ultra-compact dwarfs (UCDs) are also likely to remain hidden as their morphologies closely resemble background galaxies or foreground stars. M104 is known to possess at least one UCD (SUCD1, re = 1.13 arcsec; Hau et al. 2009), and one BCD (LV J1235−1104; Jones et al. 2009) companions. Any other similar satellite galaxies of M104 are likely to be missed in our survey. However, BCDs are thought to form only 5 per cent of the population of star-forming dwarf galaxies, being transient starburst systems (Lee et al. 2009), whereas UCDs are most probably the stripped nuclei of dEs (Bekki et al. 2003). Thus, even if our survey may be biased against BCDs and UCDs, we are not going to miss an important fraction of the dwarf galaxy population. Accounting for all of these factors, we apply a simple qualitative scheme to categorize the new detections between ‘high’ probability and ‘low’ probability of being satellites of M104. We use the following criteria to characterize a high-probability satellite:
The candidate lacks characteristic morphology of giant galaxies: spiral arms or cuspy cores.
The candidate exhibits expected surface brightness versus apparent magnitude ratios, as in Section 5.1.
The candidate half-light radius |$\gt \!\! \sim \!\! 6$| arcsec, or 300 pc at M104.
The candidate is visible in comparable alternative surveys, such as the Dark Energy Spectroscopic Instrument (DESI) legacy survey (Zou et al. 2017, 2018; Dey et al. 2019). This criterion helps to identify artefacts.
The candidate possesses an extended low surface brightness component indicative of dwarf galaxies.
The candidate is free from nearby foreground stars or background galaxies, which could contaminate the image, or which the candidate may belong to (other than M104).
A low-probability object generally fails at least one of these conditions. Ultimately, membership probability is a qualitative measurement that is dependent on the author’s experience, expectations, and analysis methods and thus is generally subjective. To remove some of this subjectivity, three members from our team conducted independent searches and each galaxy was carefully discussed afterwards before allocating an M104 group membership probability. In this paper, we have also adjusted our approach to categorizing candidates to be consistent with previous reported discoveries of satellites around M104, by setting our selection criteria described above to be inclusive of confirmed satellites and candidates from prior papers, particularly such as those in Carlsten et al. (2022). For the purposes of making comparisons and generating mock catalogues, one can assume that a high-probability object has a 90 per cent chance and a low-probability object a 50 per cent chance of being a true satellite galaxy of M104, based on the confirmation rates of follow-up observations from other surveys (Chiboucas et al. 2013; Danieli et al. 2017; Müller et al. 2018a, 2019, 2021).
4.2 Photometric modelling
We employed galfit 3.0.7 (Peng 2010) to compute structural and photometric parameters for all candidate satellite galaxies. We use the Sérsic profile-fitting functionality (Sérsic 1963) of galfit to model the light distribution of each object in the two-dimensional (2D) digital image. The analytical expression of the Sérsic power law is
where re is the effective radius that contains half the total flux, Σeff is the pixel surface brightness at the effective radius, n is the Sérsic index or concentration parameter, and κ is a dependent parameter coupled to n.
For each model fit, galfit will produce two images: the best-fitting model and the model-subtracted residual. If the residual contains no evidence of the imaged galaxy and resembles closely the sky background, then the model is considered a good fit. In cases where galaxy light remains in the residuals, galfit allows us to fit multiple overlapping Sérsic profiles to model the more complex morphology. For early-type dE/dSph dwarf galaxies, the best-fitting model typically consists of a single-component Sérsic profile, though an extra Sérsic model may be required to account for a central nucleus, if present. Galaxies that have significant excess of stellar light present in the resulting residuals are generally transitional or irregular dwarf galaxies dTran/dIrr, where dust, star-forming regions, or tidal perturbations lead to asymmetric structures in their light distribution that cannot be modelled by concentric Sérsic profiles. These galaxies require a combination of overlapping symmetric Sérsic models to reproduce the observed complex light distribution. For galaxy light well modelled by a single Sérsic model, the reported structural and photometric parameters in Table 2 are that of the single Sérsic fit. Even for star-forming dTran/dIrr galaxies, there generally exists an underlying extended and low surface brightness component of the galaxy that hosts the asymmetric star-forming regions. In cases with multiple Sérsic profiles, the half-light radius, Sérsic index, and axis ratio are that of the underlying extended, low surface brightness Sérsic profile.
To demonstrate this process, we plot the tri-frame image consisting of the original image, the galfit model, and the residual image for a single Sérsic fit dSph, KKSG 33, and a multi-Sérsic fit dIrr, PGC042120, in Fig. 2. KKSG 33 is readily modelled with a single Sérsic profile, while multiple overlapping Sérsic profiles are required to fit the irregular star formation regions of PGC042120 where we include an additional frame using colour to show the locations of four underlying Sérsic models that create the full model for that galaxy.
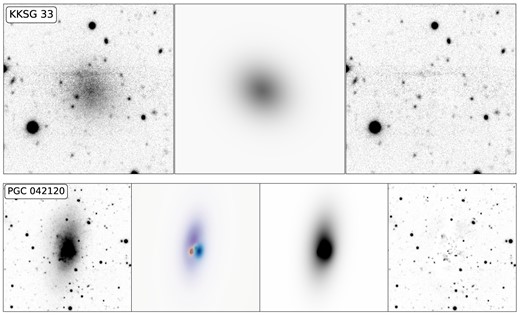
Tri-frame images of a quenched dSph KKSG 33 (top row) and a star-forming dIrr PGC042120 (bottom row). For KKSG 33, the left frame is the original HSC-g band image of the galaxy, the middle frame is the best-fitting galfit model, and the third frame is the residual after the model is subtracted from the original image. For PGC042120, we include an additional frame displaying the four individual constituent Sérsic models, which summed together create the total model shown in grey-scale.
4.3 New candidates
As a result of this process, we have found 40 new satellite galaxy candidates around M104, consisting of 23 ‘high’-probability and 17 ‘low’-probability candidates. We provide photometric and structural parameters with membership probabilities for these candidates in Table 2. We assume that each galaxy is at the distance of M104 to calculate the appropriate quantities. Follow-up observations involving velocity or distance measurements (using the Tip of the Red Giant Branch method from HST images, for example) of the candidates are necessary to further justify this assumption. We display image cut-outs for these candidates in Fig. 3.
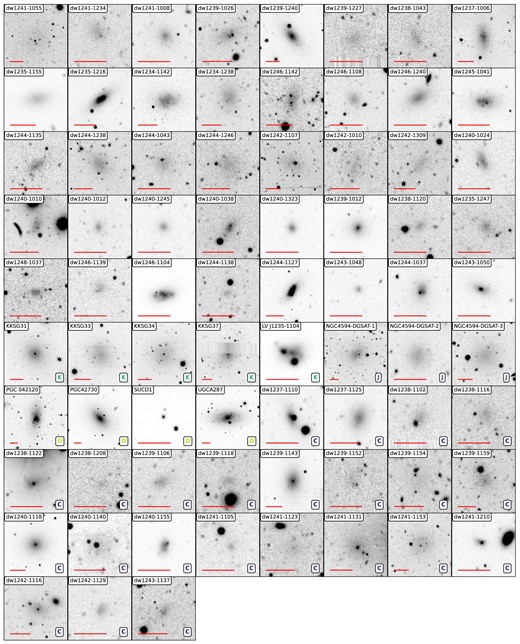
HSC-g-band images of all 75 currently known M104 satellite galaxy candidates. North is up and East is left in each image. The horizontal bar represents 1 kpc at the distance of M104. A letter in the bottom right corner indicates the initial paper in which this object was reported: (K): Karachentsev et al. (2000) and Karachentsev, Makarov & Kaisina (2013), (J): Javanmardi et al. (2016), (C): Carlsten et al. (2022), and (O): other source. Images without a letter are our candidates.
4.4 Survey completeness
The completeness limits of our survey in terms of total magnitude, surface brightness, and half-light radius are shown in Fig. 4. This plot consists of two parts: an underlying 2D histogram and an analytical function. The histogram shows the galaxy detection rate as a function of angular size and total flux resulting from 2000 randomly generated dSph galaxies, consisting of a single Sérsic profile, placed randomly throughout our HSC images of the M104 environment. A positive detection is registered if this simulated galaxy can be visually detected using the same manual process described in Section 4.1, verified by the independent analysis of two authors. This process includes reductions in detection rates due to obscuration of dim dwarf galaxies by bright background and foreground objects. These simulated galaxies consist of a single Sérsic profile, which has parameters in the range of |$100\,$| pc |$\, \le r_{\text{e}} \le 1000\,$| pc and −11.5 ≤ Mg ≤ −7.5, and are placed at the distance of M104. The axis ratio b/a and Sérsic index n were allowed to vary from 0.5 to 1.0. This histogram mirrors the surface brightness limit for our images, which is |$\sim\!\! 27.5\ \text{mag}\, \text{arcsec}^{-2}$|. Overlaid, we plot the analytical completeness relation from Ferguson & Sandage (1988):
where μlim is in |$\text{mag}\, \text{arcsec}^{-2}$| and rlim in arcsec. The values best describing our observations are found to be μlim = 27.5 mag arcsec−2 and rlim = 2 arcsec, which correspond to the surface brightness limit discovered above and the half-light radius cut-off, respectively. That is, any object smaller than this cut-off size cannot be discriminated from foreground stars or background galaxies.
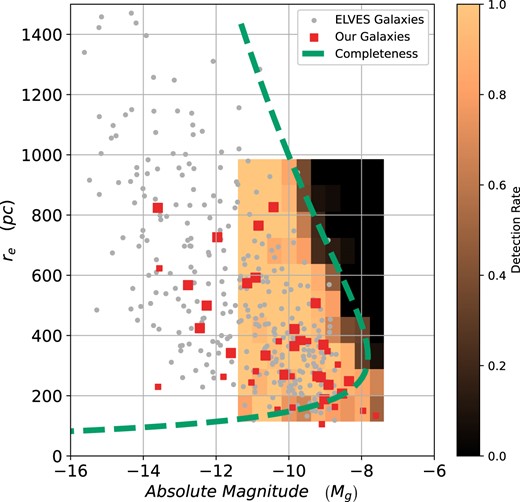
Survey completeness illustrated in the half-light radius–luminosity, re–Mg plane. For comparison, we plot galaxies from the ELVES survey (Carlsten et al. 2022) with small circles. The larger squares are satellite candidates presented in this paper. The surface brightness limit is demonstrated with the detection rate from the underlying histogram, while the full analytical completeness is shown with the dashed line.
For galaxies at the distance of M104 with half-light radii re > 300 pc, the analytical function fits the 50 per cent ridge line of the histogram well, but below this size limit it does not. This is a result of the manner in which the histogram was generated. It was based purely on whether the simulated galaxy is visible. However, it ignores additional considerations that take place to discriminate the object from background galaxies and foreground stars where at this size the candidate can be indistinguishable from those objects. Thus, we consider the analytical relation to be a full representation of the real completeness limit, given both the visibility of the candidate and its distinction from other objects.
We therefore conclude that our M104 satellite galaxy survey is complete to a mean effective surface brightness of |$\langle \mu {_\mathrm{ e},g}\rangle \approx 27.5\ \text{mag}\, \text{arcsec}^{-2}$|, which in total absolute magnitude is 100 per cent complete for objects more luminous than Mg ≈ −9, and 50 per cent complete for −9 < Mg < −8, excluding compact galaxies with half-light radii smaller than |$r_{\mathrm{ e}}=300\,$| pc, which generally remain undetected.
4.5 The M104 environment
In Section 3, we described some of the challenges associated with identifying M104 satellites in the outskirts of M104, even though they have the hallmark of a dwarf galaxy. We can, however, be confident that dwarf galaxies found within 1 virial radius of M104 are satellites of M104 given this region is absent of nearby luminous host galaxies.
Fig. 5 shows the three-dimensional (3D) scatter plot of all galaxies with known recessional velocities within our M104 survey footprint. M104 and its five satellites (purple coloured) with measured redshifts have a mean heliocentric velocity of 1056 km s−1 and a velocity dispersion of 175 km s−1. There is a significant velocity gap of over 1000 km s−1 to the next galaxy grouping at 2500 km s−1 coloured in red, which includes NGC4663 (2407 km s−1) and NGC4680 (2451 km s−1). Fig. 1 reveals that these two galaxies are at the north-eastern edge of survey footprint. Then, a more distant group or cluster is at 4500 km s−1, suggesting that each galaxy aggregate is separated by |$15\!\!-\!\!30\,$| Mpc from each other. Therefore, excluding isolated field dwarfs, any dwarfs belonging to one of these background groups should display significant differences in their angular size in comparison to the M104 satellites as they are much further away. However, we still identified a few low-probability satellite candidates of M104 whose appearances make it difficult to definitively ascribe the candidate as belonging to a background group or to M104.
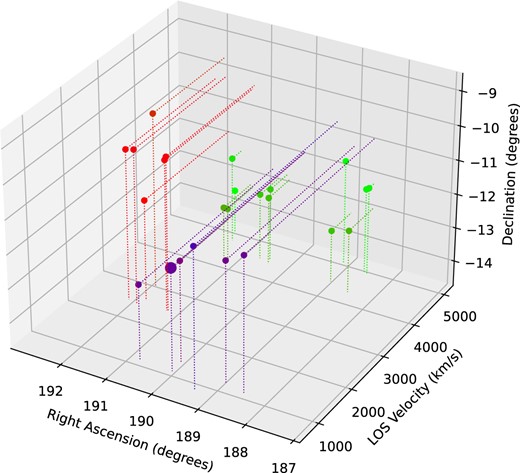
A 3D scatter plot of all galaxies with known recessional velocities within our M104 survey footprint (x– z plane). M104 and its five satellites sit in the foreground with measured redshifts have a mean heliocentric velocity of 1056 km s−1 and a velocity dispersion of 175 km s−1. The of the foreground points is M104 itself. There is a significant velocity gap of over 1000 km s−1 to the next galaxy grouping in the background, which includes NGC4663 (2407 km s−1) and NGC4680 (2451 km s−1). A more distant group sits in the background at approximately 4500 km s−1.
In Fig. 1, we show the location and the estimated virial radius of several of these background galaxies that may be the true hosts of some of the low-probability satellite candidates localized in that region of the survey area. Ultimately, however, these background galaxies are sufficiently separated from M104 that we can, for the majority of dwarf galaxies, distinguish which host galaxy they belong to, with the exception of only a few, which we include as low-probability candidates.
5 DISCUSSION
5.1 Candidate parameter spaces
We use the μe–mg and re–mg parameter spaces as tools to assess the membership of the newly found galaxies in the M104 environment. Correlations exist in these three parameters for galaxies of all morphological classifications (Kormendy 1974; Calderón et al. 2020). This correlation can be used to obtain qualitative reassurance about the candidacy of detected satellite galaxy candidates. This can help distinguish satellite candidates of M104 from galaxies far in the background (d > 50 Mpc), by highlighting unusually compact and high surface brightness galaxies, which are more likely to be background galaxies. We compare these parameters of satellite galaxies in our sample with those in the ELVES (Exploration of Local VolumE Satellites) survey (Zou et al. 2017, 2018; Dey et al. 2019; Carlsten et al. 2020, 2021, 2022) in Fig. 6, where we have assumed that each candidate is at the distance of M104 in order to calculate re. From visual inspection of these plots, we find that our satellite candidates possess similar photometric and structural properties to other Local Volume satellites, which indicates that our candidates are sound choices. There are exceptions though, those being the compact galaxies SUCD1 (v⊙ = 1293 ± 10 km s−1) and LV J1235−1104 (v⊙ = 1124 ± 45 km s−1) as annotated on Fig. 6, which are both spectroscopically confirmed satellites of M104. Such compact galaxies are, for reasons discussed in Section 4.1, hard to distinguish from background galaxies, but also rare. None the less, may be neglecting the contributions of such compact galaxies to satellite systems, as has been suggested for the similar Cen A environment (Voggel et al. 2018; Dumont et al. 2022). Such galaxies can be very difficult to identify without additional information such as spectroscopy, or HST imaging, as ground-based telescope images alone often lack the angular resolution to discriminate these galaxies from background galaxies or foreground stars.
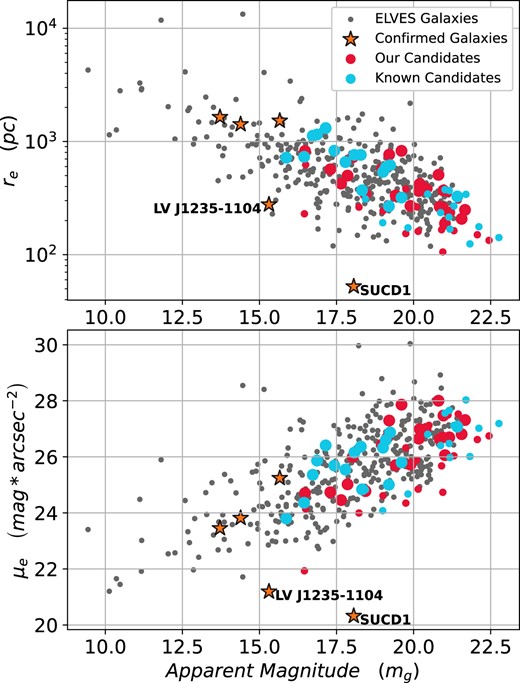
Top panel: The re–mg parameter space of galaxies in our sample and the ELVES dwarf galaxies. The half-light radius re in pc is calculated assuming that all candidates are at the distance of M104. Bottom panel: The μe–mg parameter space of galaxies in our sample and the ELVES dwarf galaxies. In both panels, the red circles represent our satellite galaxy candidates and blue circles represent candidates and confirmed satellites already known. The size of the circles is scaled with membership probability (larger shape: higher probability, smaller shape: lower probability). The stars indicate the five satellite galaxies confirmed through spectroscopy. We also label the locations of the two confirmed compact satellite galaxies of M104, LV J1235−1104 and SUCD1, which do not follow the general trends in these plots.
5.2 The distribution of satellites around M104
Satellite planes describe the observations of flattened disc-like 3D distributions of satellites about their luminous host galaxies where the majority of the satellites co-move in those structures. Such configurations are observed in the Milky Way (Pawlowski & Kroupa 2019), M31 (Ibata et al. 2013), and Cen A (Müller et al. 2016, 2018a), and indications of them exist in many other systems (Heesters et al. 2021; Martínez-Delgado et al. 2021; Paudel, Yoon & Smith 2021). Additionally, Gaia and HST proper motions of satellites in the Local Group continue to suggest that satellite planes are stable co-rotating structures (Pawlowski & Kroupa 2019; Pawlowski & Sohn 2021), which are scarcely represented in ΛCDM simulations. There still exists no broadly applicable and robust theories to explain the tension relating to all observed satellite planes.
To this end, it would contribute to the ongoing investigation into satellite planes, particularly their frequency and sensitivity to their environment, to determine the spatial structure of satellites around the most luminous galaxy in the Local Volume, M104. To characterize a satellite plane, accurate 3D positions and line-of-sight velocities are required, the desired outcome of comprehensive follow-up observations based on the targets introduced in this study. Here, we present 2D positions in the sky and begin to discuss the possible presence of a satellite plane.
To begin, we measure the ‘lopsidedness’ in the distribution of the satellites, or the phase asymmetry of the satellites about the host. We define the lopsidedness as the length of the vector that is the average of the normalized vectors for each satellite. This way, it takes values between 0 and 1, where 0 represents a perfectly symmetric distribution of satellites, and 1 indicates that the satellites all reside on a straight line originating from M104. There are numerous ways to quantify lopsidedness (Pawlowski, Ibata & Bullock 2017; Gong et al. 2019; Wang et al. 2021; Samuels & Brainerd 2023), but we choose this approach to minimize method-selection bias, where the method is altered to extract maximum statistical significance and the look-elsewhere effect. Both of these factors are persistent criticisms of the methods used to measure satellite planes (Cautun et al. 2015). These effects and biases may be present in alternative methods, like the opening angle method, where one can adjust the opening angle to whatever maximizes statistical significance. None the less, casual observations of the satellites in the satellite planes of M31 reveal what appears to be a lopsided distribution within that disc, so the presence of lopsidedness may indicate the presence of a satellite plane. Finally, as in other surveys limited to 2D sky coordinates (Crosby et al. 2023), we use a principal component analysis (PCA) to generate a best-fitting ellipse to the 2D coordinates of the satellites. The axis ratio of this ellipse is taken to be the flattening in the distribution of satellites.
The axis ratio of the PCA ellipse that includes all 75 satellite candidates of M104, independent of membership probability, is b/a = 0.97, which is nearly circular and the lopsidedness is 0.18. Restricting the analysis to the high-probability candidates only, the PCA axis ratio is b/a = 0.68 and the lopsidedness is 0.08. To determine whether these values are unusual or not, we compare the result to the Illustris TNG100-1 simulation (Pillepich et al. 2017; Nelson et al. 2018; Springel et al. 2018; Naiman et al. 2018; Marinacci et al. 2018; Nelson et al. 2019). The TNG100-1 simulation is a gravo-magnetohydrodynamical cosmological simulation with a side box length of 106.5 Mpc, baryonic mass resolution of 1.4 × 10⁶ M⊙, and dark matter mass resolution of 7.5 × 10⁶ M⊙. This roughly corresponds to an absolute magnitude limit of somewhere between Mg ∼ −8 and Mg ∼ −10, which resembles our observational limits. From this simulation, we extract galaxy environments or FOF groups that are similar to the M104 environment at z = 0 in terms of the following:
Friends of Friend (FOF) group virial mass (1–10 × 1012 M⊙).
Sub-halo brightness, only constituent sub-haloes with brightnesses comparable with our completeness limit are selected (Mg < −9 or |$L_{g}\sim 3*10^{5}\ \mathrm{ L}_\odot$|).
The number of satellites or sub-haloes within the virial radius of the FOF group (30–100 satellites).
Isolation: the distance to the nearest FOF group (>2 times the virial radius).
A total of 265 galaxy environments (FOF groups) in Illustris TNG100-1 match these conditions. We view each of these simulated environments three times along each Cartesian axis projecting the host galaxies on to a 2D plane and use the same PCA and lopsidedness analysis described above. We note that differences in the number of satellites between comparison samples can significantly bias results. Given we are uncertain of the true number of satellites around M104, we adopt to quoted range of 30–100 satellites in our sample to reflect the possible number in numbers M104 may truly possess. Future analyses must refine this range once candidates are confirmed with follow-up spectroscopy. As shown in Fig. 7, we find that while the lopsidedness of M104 is mostly consistent with simulations, the PCA axis ratio changes significantly depending on which satellites are included in the analysis. It varies from being nearly circular and a reasonable outlier from the TNG100-1 simulation, if all 75 satellite candidates (high- and low-probability members) are considered, to being consistent with both if only the high-probability satellites are considered.
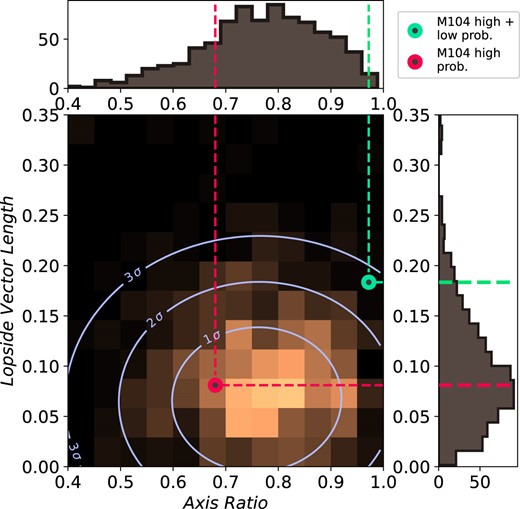
The 2D histogram formed from the PCA ellipse axis ratio and the lopside vector length, consisting of the 265 TNG100-1 simulated environments deemed similar to M104, as described in 5.2. The green point is M104 with high- and low-probability satellite candidates, and red point is M104 and high-probability candidates only.
We now investigate what might cause this extreme circularity. We compare M104 to simulated ‘isotropic’ systems of satellites. An ‘isotropic’ system of satellites consists of the same number of satellites around M104, but placed randomly in a 3D sphere and then projected to a 2D image. We perform this test 105 times, measuring the PCA axis ratio and lopsidedness in this distribution for every iteration as above. The results of this experiment are shown in Fig. 8, which result in similar conclusions as to the TNG100-1 simulation, if all satellites are included; the M104 system is an outlier but if only the high-probability satellites are included, it is consistent with simulations.
Based on these results, the interpretation is that the low-probability satellite candidates may fill a fundamentally different distribution to the high-probability satellites. The most likely explanation is that the subsample of low-probability satellites includes dwarf galaxies that are bound to host galaxies like NGC4663 and NGC4680 in the background, a possibility we already mentioned over the discussion of the membership probability in the previous section. Removing all low-probability members causes the 2D distribution of satellites around M104 to strongly resemble the distribution of similar systems in the Illustris TNG100-1 simulations. These different results emphasize the need for spectroscopy and resolved HST imaging follow-up observations of these candidates to unambiguously conclude whether they are true satellites of M104 and fully understand the structure of the distribution of M104 satellites.
While we fail to find evidence of excess flattening in the 2D distribution of the satellites of M104 in comparison to simulations therefore inferring the presence of a satellite plane, further spectroscopy could still detect evidence of a satellite plane. In the most simple scenario, direct evidence of co-rotation could be detected if a plane is viewed edge-on. However, such a satellite plane could instead be viewed face-on. This scenario comes with a testable hypothesis; the line-of-sight velocity dispersion for this satellite system should be more tightly constrained than expected for a satellite system with random motions around a host galaxy of M104’s mass, assuming that the satellites are co-orbiting in that plane. Using our sample of M104-like systems from the TNG100-1 simulation, we measure a mean velocity dispersion of |$\sigma =259\pm 55\ \mathrm{ km}\, \mathrm{ s}^{-1}$| for subhaloes within these systems. Measuring the velocity dispersion of the M104 satellite system and comparing against this predicted dispersion will be another interesting result from spectroscopic follow-up of these candidates.
5.3 Galaxy luminosity function of M104
We compare the cumulative satellite luminosity function (CSLF) of M104 to seven other nearby and well-known Local Volume galaxies for a qualitative comparison of the nature of the satellite galaxy systems and to compare the host L* galaxies. We show the CSLF in Fig. 9. For the purposes of this plot, we use data from both the ELVES catalogue (Carlsten et al. 2022) and the Catalog and Atlas of the Local Volume (LV) Galaxies (Karachentsev et al. 2013) for the satellites and their magnitudes. For the ELVES catalogue, we extract all known satellite candidates for M66 and M81. From the LV Atlas of galaxies, we extract the candidates and confirmed galaxies within |$400\,$| kpc (as projected on the sky) for M101, NGC253, M31, and NGC253. For the Milky Way (MW), we include all confirmed satellite galaxies within a |$400\,$| kpc volume. Outside of the MW and M31, most of the reported satellites from these catalogues are unconfirmed candidates. All the CSLFs shown here could be considered upper limits on the CSLF for that host galaxy. Where g-band magnitudes are unavailable, we use the Sloan Digital Sky Survey (SSDS) band conversions (Jester et al. 2005) and approximate colours to generate g-band magnitudes. If we consider just the high-probability satellite candidates of M104, we find that the CSLF is very similar to Cen A, which also bears a strong resemblance to M104 based on its morphology, both are elliptical/lenticular galaxies with a sluggishly star-forming dust disc. Additionally, the brightest satellite of both Cen A and M104 has an absolute magnitude of Mg ∼ −16 (|$L_{g}\sim 10^{8}\ \mathrm{ L}_\odot$|), where the brightest satellite appears to be in the range of |$-20\, \lt \, M_{g}\, \lt \, -17$| (|$8.7 \lt $| log(Lg,⊙) < 10) for the other, star-forming spiral host galaxies.
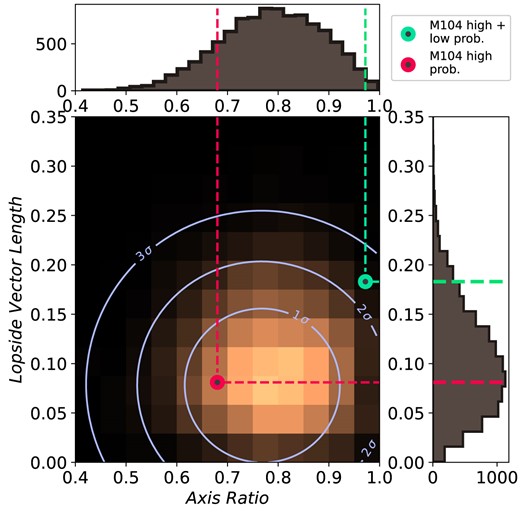
The 2D histogram formed from the PCA ellipse axis ratio and the lopside vector length, consisting of 105 randomly generated isotropic systems similar to M104. The green point is M104 itself with all candidates, and red is M104 high-probability candidates only.
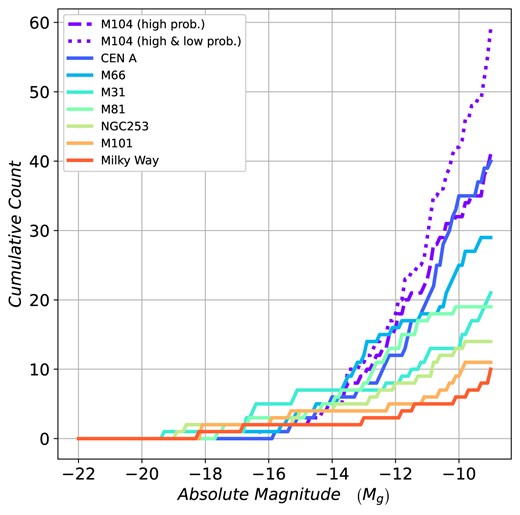
The CSLF of M104. The dotted line contains all candidates and the dashed line only high-probability candidates. This is compared against seven Local Volume host galaxies as annotated in the figure.
We repeat this comparison with sample of 265 M104-analogue galaxy environments we described in Section 5.2. In Fig. 10, we plot the M104 CSLF, and compare it against the CSLFs of the simulated M104 analogues. In the CSLF, M104 has a deficiency of satellites in the high-luminosity end with magnitudes Mg < −14 (|$L_{g}\sim 10^{7}\ \mathrm{ L}_\odot$|), though an expected amount of satellites with magnitudes Mg > −14 compared to the reference environments, even if only high-probability candidates are included, indicating that the result is robust even if all low-probability candidates are discounted as M104 satellites. In this way, ignoring the small numbers of potentially missed candidates falling in CCD gaps or becoming obscured by bright objects, the high- and low-probability curve is an upper limit of the CSLF of M104 (for satellites within 1 virial radius). 98.7 per cent of the comparison environments possess a satellite galaxy within the virial radius brighter than Mg = −16.4 (|$\sim \!\! 3*10^{8}\ \mathrm{ L}_\odot$|), which is the magnitude of M104’s brightest satellite, therefore M104 is a 2.3|$\, \sigma$| outlier in this regard. Note that this result may reflect the radial distribution of these high-luminosity satellites, since we are observing satellites within the virial radii of M104 and simulations. In Crosby et al. (2023), we reported an analogous anomaly, a significant magnitude gap of 6.1 mag between the host galaxy NGC2683 and the brightest satellite KK69, in the NGC2683 system. We find a similarly large magnitude gap of 5.1 mag in the luminosity function of M104, despite the significantly more populated system of satellites, which should increase the probability of finding high-luminosity satellites.
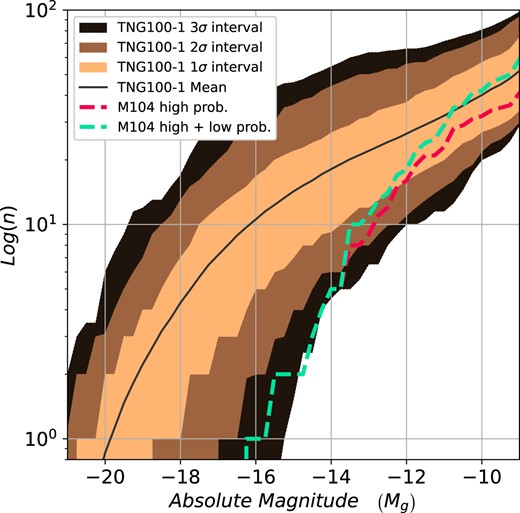
The CSLF of the high-probability satellites of M104 (dashed red line) and all satellite candidates of M104 (green dashed line) compared against the mean CSLF for similar TNG100-1 simulated environments (solid black line) and the 1σ, 2σ, and 3σ confidence intervals.
5.4 Radial satellite distribution of M104
Recent research has indicated that the radial distribution of satellites about their host is not correctly reproduced in large-scale cosmological simulations, particularly for satellites that pass by close to their host in an orbit, otherwise described as a small pericentre (Guo & White 2013; van den Bosch & Ogiya 2018; Webb & Bovy 2020). In these simulations, the choice of fundamental parameters including the simulation resolution, the dark matter particle mass, and the softening length leads to artificially elevated subhalo destruction, accretion, and disruption. This manifests as a reduced density of subhaloes at small pericentres compared to observations.
In Fig. 11, we show the projected 2D distance of the ith nearest satellite of M104, compared against the distribution of the same simulated environments identified in Section 5.2. Overall, the radial distribution of satellites around M104 is reproduced well by our selected sample of TNG100-1 simulated systems. We fail to find any signal, which suggests a reduced density of subhaloes at small pericentres. This is expected, the anomaly as discussed lies in satellites’ radial distance from their hosts, which requires 3D positions of the satellites to be properly measured. Here, we are forced to consider the 2D projected radii of the satellites instead, therefore any differences in density at small radii between observations and simulations could not be measured reliably. If numerical issues in the simulations are biasing these comparisons, we are unable to quantify this bias with 2D projected sky coordinates alone.
![The projected radii [$\Delta _{\mathrm{ gal}}\,$ (kpc)] of the ith closest satellites in the comparison of TNG100-1 environments identified in Section 5.2 as shown by the shaded areas and for M104 itself with the red dashed line (high-probability satellites only) and the green dashed line (all satellite candidates).](https://oup.silverchair-cdn.com/oup/backfile/Content_public/Journal/mnras/527/3/10.1093_mnras_stad3741/1/m_stad3741fig11.jpeg?Expires=1750291295&Signature=Y2wh1SvvxeYqC7y7JM0tZ4BwzuI69ZxAGdr3BhwyvRbCXbHMI7Znp4y8H9y8qaTKFO2RpHWZOpZUqT01JinY~3eHb6pk2SUod1NcHtTLZ~NbAYlbi7-A2T88k1ZuFyVyh6QIcTL7PgJ6B1TNZvcpWJkqYM5TiTnsEDGtt7j8ARwErqWpB0D29E8FuxpLeovYS4DQ0AmqnFN3Ho4-OYu8OqSduhqa-7KsKzgRMItK6S-l7AjymEkxXXlFmQNLiWr5VtXTikd2g~RKwNwTaxFBSk85o5C91mJdh26xLQpqa4N42TjbZchIuFiApI7kzWGPWEXyoONT-nZclfqq-3A5jA__&Key-Pair-Id=APKAIE5G5CRDK6RD3PGA)
The projected radii [|$\Delta _{\mathrm{ gal}}\,$| (kpc)] of the ith closest satellites in the comparison of TNG100-1 environments identified in Section 5.2 as shown by the shaded areas and for M104 itself with the red dashed line (high-probability satellites only) and the green dashed line (all satellite candidates).
6 SUMMARY AND CONCLUSION
We present 40 new satellite galaxy candidates in addition to 35 already known satellite galaxy candidates for the host galaxy M104, where 22 of these new candidates have a high probability of being real satellite galaxies of M104. These candidates are found within our HSC-g band images, which extend to approximately the virial radius of M104, |$420\,$| kpc. Detections are complete to a surface brightness limit of |$\langle \mu {_\mathrm{ e},g}\rangle \approx 27.5\ \text{mag}\, \text{arcsec}^{-2}$| or 100 per cent complete for objects Mg < −9, and 50 per cent complete for −9 < Mg < −8, excluding compact objects of |$r_{\text{e}}\lt 300\,$| pc.
The new satellite candidates are comparable to other Local Volume satellites from the ELVES survey (Carlsten et al. 2022), in terms of structural parameters and photometry. M104, however, does possess two unusually compact galaxies, SUCD1 and LV J1235−1104, which we would not have ordinarily recognized as a satellite candidate, due to the difficulty in discriminating them from background galaxies. Therefore, our reported sample would miss similar compact galaxies, if they exist. This is not a challenge unique to this survey, any dwarf galaxy survey using ground-based optical telescopes will have difficulty differentiating compact dwarf galaxies from background galaxies or foreground stars.
We use a simplified PCA approach to measure the 2D flattening of the ellipse best fit to the distribution of the satellites in the sky. We find that with all the satellite candidates of M104, this ellipse is nearly circular, with b/a = 0.97. This is more circular than all M104 equivalent environments from the Illustris TNG100-1 simulation and even more circular than a purely isotropic distribution of satellites. This could hint at a satellite plane viewed face-on. However, if we remove the low-probability candidates, this axis ratio drops to b/a = 0.68, which is then consistent with both the TNG100-1 simulation and an isotropic distribution. This indicates that the low-probability candidates may not fill the same distribution of satellites as the high-probability candidates, and that they are not bound to M104. The observed circularity of the distribution of all satellites is likely a result of background contamination. Fig. 1 appears to confirm this, where a number of our newly reported low-probability candidates are clustered around a few background galaxies that are all located on one side of the field around M104. We also measured the lopsidedness in the distribution of these satellites using the length of the average lopside vector and found that similarly to the axis ratio, when all satellites are included M104 is lopsided with a 2σ outlier from TNG100-1 and isotropic simulations, but that when only the high-probability candidates are included it is consistent with both the TNG100-1 and isotropic simulations. The difference in conclusions based on the inclusion or exclusion of low-probability satellite candidates highlights the need for further spectroscopic follow-up, to confirm these candidates and to begin to explore the 3D distribution of these satellites.
Finally, we compared the CSLF for M104 satellites within the virial radius to other Local Volume galaxies and found it to closely match the profile of Cen A, where both galaxies have no satellites brighter than Mg < −16.4 (|$L_{g}\sim 3*10^{8}\ \mathrm{ L}_\odot$|). Other Local Volume hosts often possess satellites as brighter as this, and sometimes as bright as Mg = −20. We performed a comparison of M104 to similar galaxy environments within the TNG100-1 simulation and found that M104 is a |$2.3\, \sigma$| outlier with the absence of luminous satellites with Mg < −14, but the CSLF rises quickly to within expectations at Mg > −14. This could be related to the TBTF problem, which describes the absence of high-mass satellites when comparing observations to ΛCDM simulations.
ACKNOWLEDGEMENTS
EC and HJ acknowledge financial support from the Australian Research Council through the Discovery Project DP150100862.
OM is grateful to the Swiss National Science Foundation for financial support under the grant number PZ00P2_202104.
MSP acknowledges funding via a Leibniz-Junior Research Group (project number J94/2020).
This research has made use of the NASA/IPAC Extragalactic Database, which is funded by the National Aeronautics and Space Administration and operated by the California Institute of Technology.
This research has made use of the simbad database, operated at CDS, Strasbourg, France.
We acknowledge the work of Markus Dirnberger to process the optical telescope images used in this paper.
DATA AVAILABILITY
The data underlying this article will be shared on reasonable request to the corresponding author.
Additional data underlying this article were derived from sources in the public domain and are available at https://ned.ipac.caltech.edu/ and https://simbad.u-strasbg.fr/simbad/.
