


ABSTRACT
We report spectroscopic identification of the host galaxies of 18 ultra-strong Mg ii systems (USMg ii) at 0.6 ≤ z ≤ 0.8. We created the largest sample by merging these with 20 host galaxies from our previous survey within 0.4 ≤ z ≤ 0.6. Using this sample, we confirm that the measured impact parameters (|$\rm 6.3\leqslant D[kpc] \leqslant 120$| with a median of 19 kpc) are much larger than expected, and the USMg ii host galaxies do not follow the canonical |$\rm {\it W}_{2796}-{\it D}$| anticorrelation. We show that the presence and significance of this anticorrelation may depend on the sample selection. The |$\rm {\it W}_{2796}-{\it D}$| anticorrelation seen for the general Mg ii absorbers show a mild evolution at low |$\rm W_{2796}$| end over the redshift range 0.4 ≤ z ≤ 1.5 with an increase of the impact parameters. Compared to the host galaxies of normal Mg ii absorbers, USMg ii host galaxies are brighter and more massive for a given impact parameter. While the USMg ii systems preferentially pick star-forming galaxies, they exhibit slightly lower ongoing star-forming rates compared to main sequence galaxies with the same stellar mass, suggesting a transition from star-forming to quiescent states. For a limiting magnitude of mr < 23.6, at least 29 per cent of the USMg ii host galaxies are isolated, and the width of the Mg ii absorption in these cases may originate from gas flows (infall/outflow) in isolated haloes of massive star forming but not starbursting galaxies. We associate more than one galaxy with the absorber in |$\ge 21~{{\ \rm per\ cent}}$| cases, where interactions may cause wide velocity spread.
1 INTRODUCTION
The formation and evolution of galaxies is one of the most fundamental problems in extragalactic astronomy. Galaxies evolution is thought to be governed by the joint action of accretion of pristine metal-poor gas from the intergalactic medium (IGM), in situ star formation in the galactic disc, and feedback from star-formation-driven metal-rich galactic winds – a complex process known as the ‘cosmic baryon cycle’ (Anglés-Alcázar et al. 2017; Péroux & Howk 2020). The interplay between galactic winds and gas accretion from the IGM creates a metal-enriched gaseous halo surrounding galaxies out to a few virial radii known as the circumgalactic medium (CGM). The kinematically complex, multiphase CGM, which serves as an interface between the galactic disc (interstellar medium, ISM) and the IGM, controls the competition between IGM inflow and galactic feedback processes, which in turn controls how the galaxy evolves (Tumlinson, Peeples & Werk 2017; Faucher-Giguere & Oh 2023).
Due to the low density of most of the gas in the CGM (see e.g. Zahedy et al. 2019), it is difficult to capture the physical processes taking place in the CGM using the emission from this gas. Diffuse Ly α emission is frequently detected from high-z (i.e. z ≥ 2) galaxies which provide important information on the gas density and velocity field around galaxies (Wisotzki et al. 2018). However, such studies are rare for low-z, although there has been a steady attempt to map the CGM in Mg ii emission either directly (Chisholm et al. 2020; Burchett et al. 2021) or in the stacked images (see e.g. Dutta et al. 2023). As a result, absorption line spectroscopy remains the best means to understand the gas kinematics and physical processes that take place in the CGM. While the existence of large-scale gas flows (inflows/outflows) in the starforming galaxies is well established by the ‘down-the-barrel’ studies (Tremonti, Moustakas & Diamond-Stanic 2007; Rubin et al. 2010, 2014), the distance of the flowing gas from the galaxy (which is crucial for deriving wind parameters such as mass outflow rate) cannot be precisely determined with respect to the stellar discs. In contrast, the projected distance of the absorbing gas from the host galaxy is well measured in CGM studies using bright background sources like galaxies and quasars. However, drawing a clear connection between star formation and gas absorption is challenging, particularly at large impact parameters.
Historically, Mg ii doublet absorption seen in the spectra of quasars is used to trace the metal-enriched CGM around low-z galaxies (Bergeron & Boissé 1991). Probing the physical condition of the gas around galaxies using background quasar sight lines at very low impact parameters (e.g. within the regions influenced by winds over a characteristic time-scale of star formation) can provide vital clues on the role played by large-scale winds in shaping the physical conditions of the CGM and how it regulates galaxy evolution. For the past couple of years, we have been carrying out a systematic study of the CGM of z ∼ 0.7 galaxies at low impact parameters by (i) searching for the host galaxies of Ultra-Strong Mg ii absorbers (USMg ii) and (ii) studying the nature of Mg ii galaxies that happen to lie within very small impact parameters (i.e. Galaxies On Top of Quasars; GOTOQs) to background quasars (see Guha et al. 2022; Guha & Srianand 2023).
Here, we concentrate on USMg ii systems again. Following Nestor et al. (2007), we define the USMg ii systems as the ones having the rest equivalent width of the Mg ii|$\lambda \, 2796$| line (W2796) more than or equal to 3 Å. Given the canonical anticorrelation between |$\rm W_{2796}$| and the impact parameter (D) for the general population of Mg ii absorbers (Chen et al. 2010; Nielsen, Churchill & Kacprzak 2013), the impact parameters for the USMgii host galaxies are expected to be extremely low (≲10 kpc). The measured W2796 using low-dispersion spectra is well known to be linked to the number of absorbing clouds and the velocity dispersion between them, rather than the column density (Petitjean & Bergeron 1990). For a fully saturated Mg ii line a 3 Å limit on W2796 corresponds to a minimum velocity width of 320 km s−1. Such large velocity spreads could be caused by (i) galactic-scale outflows (Nestor et al. 2011a), (ii) filamentary accretion on to galaxies (Rubin et al. 2012), and (iii) galaxy mergers (Rubin et al. 2010) and intra-group gas (Gauthier 2013; Zou et al. 2018; Nielsen et al. 2022). In such instances, one could use the measured metallicities (Lehner et al. 2013) and galaxy orientations relative to quasar sightlines to differentiate between the various possibilities (Kacprzak, Churchill & Nielsen 2012). To measure metallicity, one requires high-resolution spectra covering H i and metal absorption lines. For accurately measuring the orientation of host galaxies, one needs high spatial-resolution images.
In a previous paper (Guha et al. 2022), we studied the nature and environment of a well-defined sample of USMgii host galaxies at z ∼ 0.5. We find that the impact parameters are larger than that predicted by the |$\rm {W_{2796}}$| versus the D relationship of the general population of Mg ii absorbers. The USMg ii host galaxies seem to form a distinct population in the |$\rm W_{2796}-D$| plane. USMg ii host galaxies are found to be massive and bright compared to those of the relatively weak Mg ii absorption systems for the same impact parameters. At least 33 per cent of the USMg ii host galaxies (with a limiting magnitude of mr < 23.6) are isolated, and the large |$\rm W_{2796}$| in these cases may originate from gas flows (infall/outflow) in a single halo of a massive but not a starbursting galaxy. We also find galaxy interactions could be responsible for large velocity widths in at least 17 per cent of the cases.
In the present study, we proceed further with a slightly higher redshift (z ∼ 0.7) sample to identify any redshift evolution associated with these systems. This paper is organized as follows. In Section 2, we discuss our USMg ii sample at z ∼ 0.7. Section 3 discusses the observations and data reduction procedures. In Section 4, we describe the data analysis and the results from this survey. The discussions and summary & conclusions are provided in Sections 5 and 6, respectively. Throughout this paper, we assume a flat Lambda cold dark matter cosmology with |$H_0 = 70\,{\rm km\, s^{-1}\, Mpc^{-1}}$| and Ωm,0 = 0.3.
2 THE USMG ii SAMPLE AT |$z\, \sim \, 0.7$|
In this work, we extend our study of USMg ii absorbers (Guha et al. 2022, which focused on USMg ii absorbers at 0.4 ≤ z ≤ 0.6) to slightly higher redshifts. For this, we compiled a sample of USMgii absorption system candidates from the twelfth data release (DR12) of the Sloan Digital Sky Survey (SDSS; York et al. 2000; Alam et al. 2015) Fe ii/Mg ii absorbers catalogue (Zhu & Ménard 2013) that are accessible to the South African Large Telescope (SALT; Buckley et al. 2005) (i.e. with declination, δ ≤ 10°) in the redshift range 0.6 ≤ zabs ≤ 0.8. Our preliminary search resulted in a total of 151 USMg ii absorption system candidates along the line of sight towards 148 different background quasars. However, a careful visual inspection of the SDSS spectrum of each of these 151 USMg ii absorption systems revealed that a total of 88 are basically C iv/Si iv broad absorption lines (BAL) misidentified as USMg ii systems. Additional 36 systems are wrongly identified as USMg ii because of line blendings, poor SNR, or false identification of Mg ii absorption doublets, leaving behind only 27 secure USMg ii systems in the redshift range 0.6 ≤ z!abs < 0.8 with δ ≤ 10°. Details of all these 151 absorption systems are provided in the Appendix (Table A1 of Appendix A), where we explicitly mention whether the absorption system is a secure USMg ii absorption system or falsely identified as a USMg ii absorption system.
To confirm that the selected 27 USMg ii systems are indeed bona fide USMg ii absorption systems, we measure the rest equivalent widths of the Mg ii|$\lambda \lambda \, 2796,\, 2803$| absorption lines. For W2796, we first approximate the continuum around the Mg ii absorption lines with a smooth polynomial and then fit the absorption doublet using a pair of Gaussian profiles on top of this smooth polynomial. While fitting, we impose the redshift and velocity width of both the Gaussian profiles to be the same. This exercise confirms that within 1σ uncertainty all the selected 27 systems are indeed USMg ii absorption systems. Similarly, we fit the associated Fe ii λ 2600 and Mg i λ 2853 absorption lines each with a single Gaussian profile in addition to a smooth polynomial continuum, and compute their rest equivalent widths. Upon visual inspection of the fitted profiles for five of the USMg ii systems (J0127 − 0550, J0150 + 0604, J0256 + 0110, J0908 + 0727, J0956 + 0018), even in the low-resolution SDSS spectra, we identify sub-structures in the absorption profiles of Mg ii and Fe ii. Subsequently, these absorption profiles are not very well characterized by a single Gaussian profile with velocity offsets between absorption components ranging from 100 to 300 km s−1. The details of these 27 USMg ii systems along the emission redshifts, absorption redshifts, and the obtained rest equivalent widths are given in Table 1. In the case of non-detections, we provide the 3σ upper limit on the REW.
Details of our USMg ii sample. Columns (2), (3), and (4), respectively, provide the quasar name, emission redshift (zqso), and the absorption redshift (zabs). Columns (5)–(8) provide the REW of Mg ii λ 2796, Mg ii λ 2803, Fe ii λ 2600, Mg i λ 2803 lines, respectively.
| No. | Quasar | zqso | zabs | |$W_{2796}\, ({\mathring{\rm A}})$| | |$W_{2803}\, ({\mathring{\rm A}})$| | |$W_{2600}\, ({\mathring{\rm A}})$| | |$W_{2853}\, ({\mathring{\rm A}})$| |
|---|---|---|---|---|---|---|---|
| (1) | (2) | (3) | (4) | (5) | (6) | (7) | (8) |
| 1 | J001030.81 + 012203.43 | 2.197 | 0.6433 | 3.19 ± 0.45 | 3.22 ± 0.46 | 2.01 ± 0.56 | <0.60 |
| 2 | J002022.66 + 000231.98 | 2.749 | 0.7700 | 3.18 ± 0.28 | 3.03 ± 0.27 | 2.11 ± 0.37 | 0.87 ± 0.21 |
| 3 | J002839.24 + 004103.05 | 2.493 | 0.6565 | 3.33 ± 0.19 | 3.29 ± 0.19 | 2.93 ± 0.19 | 1.21 ± 0.37 |
| 4 | J003336.04 + 013851.06 | 2.658 | 0.7188 | 3.80 ± 0.30 | 3.11 ± 0.24 | 1.35 ± 0.10 | 0.42 ± 0.13 |
| 5 | J005554.25 − 010058.62 | 2.363 | 0.7150 | 4.02 ± 0.67 | 3.80 ± 0.63 | 2.90 ± 0.89 | 1.74 ± 0.59 |
| 6 | J010543.52 + 004003.86 | 1.078 | 0.6489 | 3.41 ± 0.21 | 2.87 ± 0.18 | 1.69 ± 0.17 | <0.48 |
| 7 | J012711.11 − 055020.95 | 2.137 | 0.6838 | 3.19 ± 0.51 | 2.54 ± 0.40 | 3.52 ± 0.75 | <0.54 |
| 8 | J014115.32 − 000500.98 | 2.130 | 0.6106 | 2.77 ± 0.38 | 2.02 ± 0.27 | 1.05 ± 0.28 | <0.42 |
| 9 | J014258.83 + 094942.43 | 0.981 | 0.7858 | 3.90 ± 0.26 | 3.27 ± 0.22 | 2.43 ± 0.15 | 0.82 ± 0.17 |
| 10 | J015007.91 − 003937.09 | 2.730 | 0.7749 | 4.34 ± 0.53 | 4.08 ± 0.50 | 3.04 ± 0.26 | <0.57 |
| 11 | J015049.39 + 060432.42 | 2.676 | 0.6707 | 3.34 ± 0.22 | 2.69 ± 0.18 | 2.38 ± 0.28 | 0.77 ± 0.12 |
| 12 | J025607.25 + 011038.56 | 1.3490 | 0.7255 | 3.29 ± 0.20 | 2.91 ± 0.18 | 2.29 ± 0.33 | 0.82 ± 0.12 |
| 13 | J090805.76 + 072739.90 | 2.414 | 0.6123 | 5.30 ± 0.58 | 4.38 ± 0.48 | 4.24 ± 0.94 | 1.45 ± 0.30 |
| 14 | J095619.49 + 001800.34 | 2.172 | 0.7820 | 6.34 ± 0.46 | 6.35 ± 0.46 | 5.43 ± 0.55 | 2.23 ± 0.51 |
| 15 | J103325.92 + 012836.35 | 2.180 | 0.6709 | 3.11 ± 0.17 | 2.82 ± 0.15 | 1.53 ± 0.15 | 0.44 ± 0.08 |
| 16 | J104642.70 + 045731.96 | 2.542 | 0.7849 | 4.47 ± 0.66 | 4.40 ± 0.65 | 2.19 ± 0.22 | <0.42 |
| 17 | J111627.65 + 050049.96 | 2.571 | 0.7208 | 3.78 ± 0.48 | 3.47 ± 0.44 | 1.93 ± 0.27 | <0.41 |
| 18 | J115026.11 + 090048.40 | 2.492 | 0.7568 | 3.39 ± 0.24 | 2.76 ± 0.19 | 1.66 ± 0.34 | 1.13 ± 0.11 |
| 19 | J120139.57 + 071338.24 | 1.205 | 0.6842 | 4.55 ± 0.18 | 4.08 ± 0.16 | 2.30 ± 0.24 | 0.83 ± 0.11 |
| 20 | J121727.80 − 011548.57 | 2.624 | 0.6642 | 4.02 ± 0.45 | 3.64 ± 0.41 | 2.88 ± 0.28 | 1.57 ± 0.44 |
| 21 | J132200.79 − 010755.70 | 2.160 | 0.7226 | 3.24 ± 0.24 | 3.20 ± 0.24 | 3.05 ± 0.30 | 1.09 ± 0.14 |
| 22 | J133653.73 + 092221.23 | 2.531 | 0.7059 | 3.06 ± 0.09 | 2.86 ± 0.08 | 2.03 ± 0.10 | 0.69 ± 0.08 |
| 23 | J140017.69 − 014902.40 | 2.555 | 0.7928 | 4.23 ± 0.25 | 4.02 ± 0.24 | 3.45 ± 0.25 | 1.04 ± 0.34 |
| 24 | J141930.09 + 034643.73 | 2.316 | 0.7250 | 3.30 ± 0.40 | 2.80 ± 0.34 | 1.52 ± 0.22 | 1.50 ± 0.40 |
| 25 | J144936.18 − 011650.46 | 0.772 | 0.6620 | 3.66 ± 0.26 | 2.99 ± 0.21 | 1.37 ± 0.13 | <0.54 |
| 26 | J145108.53 − 013833.06 | 2.390 | 0.7407 | 3.29 ± 0.25 | 2.96 ± 0.23 | 1.94 ± 0.31 | <0.62 |
| 27 | J235639.31 − 040614.47 | 2.880 | 0.7707 | 3.77 ± 0.48 | 3.68 ± 0.47 | 1.81 ± 0.21 | <0.68 |
Combining these findings for USMg ii systems at z = 0.6−0.8 with that of Guha et al. (2022) for USMg ii systems at z = 0.4−0.6, we can summarize that there are 260 USMg ii candidates at δ < 10 deg in the catalogue of Zhu & Ménard (2013) with 0.4 ≤ z ≤ 0.8 and out of which we confirm only 54 of them to be secured USMg ii absorbers.
3 SALT OBSERVATIONS AND DATA REDUCTION
To identify the galaxy or the galaxy group giving rise to the USMg ii absorption along the quasar line of sights, we first identify all the galaxies from the Dark Energy Spectroscopic Instrument Legacy Imaging Survey (DESI-LIS; Dey et al. 2019, typically complete upto mr ≤ 23.6) within a projected distance of 100 kpc (at the photometric redshifts). Details of these galaxies are given in Table A2 of Appendix B. To optimize our spectroscopic identification process using long-slit spectroscopy, we mainly focus on the galaxies with photometric redshifts consistent within 1σ uncertainty with that of the USMg ii systems and lying within 50 kpc from the quasar line-of-sight at the absorption redshift (as indicated by the dotted circles in Fig. 1). Next, we get the spectra of these candidate galaxies using the Southern African Large Telescope (SALT). In addition, whenever possible, we also observed potential galaxy candidates with impact parameters in the range 50−100 kpc.

The DECaLS r-band images of the quasar fields with the quasar placed at the centre and marked with a red ‘⋆’. The slit configuration used is indicated with a pair of red dashed lines. The spectroscopically identified USMg ii host galaxies are marked with a red ‘+’. The blue dashed circle in each panel corresponds to the circle of projected radius of 50 kpc at the absorption redshift.
The SALT spectroscopic observations were performed using the Robert Stobie Spectrograph (RSS; Burgh et al. 2003; Kobulnicky et al. 2003) in long-slit mode from June 2020 to February 2023 (Program IDs: 2020-1-SCI-010, 2020-2-SCI-019, 2021-1-SCI-006, 2021-2-SCI-012, 2022-1-SCI-016, 2022-2-SCI-015). The slit orientation [quantified through the position angle (PA) used] for each USMg ii system is suitably chosen such that all the candidate galaxies and quasars are observed simultaneously. For all our observations, we use the PG0900 grating along with a long slit-width of width 1.5 arcsec and the grating angles are so chosen that the expected nebular lines ([O ii], [O iii], and H β) from the USMg ii host galaxies fall within the wavelength coverage of the spectrograph avoiding the CCD gaps. The details of the observations are provided in Table 2. Column 2 provides the names of the quasars observed. The date of observations, total exposure time, the position angle (PA) from the north, the grating angle, and the wavelength range covered are provided in the next five subsequent columns in that order.
The observational log. Column 2 corresponds to the USMg ii systems observed. The observations date, total exposure, the slit position angle from the north, the grating angle, and the wavelength range are provided in columns 3–7, respectively.
| No. | Quasar | Date | Exposure (s) | PA (deg.) | Grating | Wavelength |
|---|---|---|---|---|---|---|
| Angle (deg) | Range (Å) | |||||
| (1) | (2) | (3) | (4) | (5) | (6) | (7) |
| 1 | J002022.66 + 000231.98 | 2021-07-11 | 2400 | 17 | 20 | 6000–8985 |
| 2021-08-03 | 2400 | 17 | 20 | 6000–8985 | ||
| 2 | J002839.24 + 004103.05 | 2020-07-29 | 2560 | 124 | 18.125 | 5310–8320 |
| 2020-09-15 | 2560 | 124 | 18.5 | 5450–8450 | ||
| 2022-08-04 | 2560 | 67 | 18.125 | 5310–8320 | ||
| 3 | J003336.04 + 013851.06 | 2020-06-24 | 2560 | 29 | 19.625 | 5870–8850 |
| 2020-07-24 | 2560 | 29 | 19.25 | 5865–8865 | ||
| 2021-07-16 | 2560 | 155 | 20 | 6000–8985 | ||
| 2021-08-06 | 2280 | 155 | 20 | 6000–8985 | ||
| 4 | J005554.25 − 010058.62 | 2021-08-10 | 2400 | 171 | 19.625 | 5870–8850 |
| 5 | J010543.52 + 004003.86 | 2020-07-29 | 2560 | 141 | 18.5 | 5450–8450 |
| 2020-10-13 | 2560 | 141 | 18.125 | 5310–8320 | ||
| 2022-08-27 | 2560 | 106 | 18.5 | 5450–8450 | ||
| 6 | J012711.11 − 055020.95 | 2020-07-01 | 2560 | 41 | 19.25 | 5865–8865 |
| 2020-10-14 | 2560 | 41 | 18.875 | 5585–8585 | ||
| 2022-08-20 | 2560 | 68 | 18.875 | 5585–8585 | ||
| 7 | J014258.83 + 094942.43 | 2021-09-12 | 2200 | 86 | 20.375 | 6140–9120 |
| 2021-08-04 | 2000 | 86 | 20 | 6000–8985 | ||
| 8 | J015007.91 − 003937.09 | 2022-09-21 | 2560 | 0 | 20 | 6000–8985 |
| 9 | J015049.39 + 060432.42 | 2020-10-16 | 2360 | 90 | 18.875 | 5585–8585 |
| 2022-07-17 | 2360 | 90 | 18.5 | 5450–8450 | ||
| 2022-09-23 | 2360 | 146 | 18.5 | 5450–8450 | ||
| 10 | J025607.25 + 011038.56 | 2020-11-12 | 2580 | 133 | 20 | 6000–8985 |
| 2021-08-09 | 2560 | 133 | 19.25 | 5865–8865 | ||
| 2022-09-03 | 2560 | 95 | 19.25 | 5865–8865 | ||
| 2021-08-10 | 2560 | 133 | 19.625 | 5870–8850 | ||
| 11 | J090805.76 + 072739.90 | 2021-02-05 | 2300 | 73 | 18.875 | 5585–8585 |
| 2021-02-06 | 2300 | 73 | 18.5 | 5450–8450 | ||
| 12 | J095619.49 + 001800.34 | 2021-02-08 | 2580 | 135 | 20 | 6000–8985 |
| 2021-04-07 | 2580 | 135 | 20.375 | 6410–9120 | ||
| 13 | J103325.92 + 012836.35 | 2022-02-07 | 2440 | 21 | 18.875 | 5585–8585 |
| 14 | J104642.70 + 045731.96 | 2021-04-14 | 2200 | 161 | 20.375 | 6140–9120 |
| 15 | J111627.65 + 050049.96 | 2022-02-07 | 2300 | 87 | 19.625 | 5870–8850 |
| 16 | J115026.11 + 090048.40 | 2022-02-06 | 2200 | 41 | 20 | 6000–8985 |
| 17 | J120139.57 + 071338.24 | 2021-01-21 | 2300 | 149 | 19.25 | 5865–8865 |
| 2021-04-12 | 2300 | 149 | 19.25 | 5865–8865 | ||
| 18 | J121727.80 − 011548.57 | 2021-03-12 | 2580 | 139.25 | 19.25 | 5865–8865 |
| 2023-01-23 | 2560 | 139 | 19.25 | 5865–8865 | ||
| 19 | J132200.79 − 010755.70 | 2023-02-23 | 2560 | 132 | 19.625 | 5870–8850 |
| 2023-02-24 | 2560 | 132 | 19.625 | 5870–8850 | ||
| 20 | J133653.73 + 092221.23 | 2022-04-30 | 2200 | 162 | 19.625 | 5870–8850 |
| 2023-02-22 | 2560 | 163 | 19.625 | 5870–8850 | ||
| 21 | J140017.69 − 014902.40 | 2021-05-13 | 2560 | 0 | 20.375 | 6140–9120 |
| 2021-06-13 | 2560 | 90 | 20.375 | 6140–9120 | ||
| 22 | J141930.09 + 034643.73 | 2021-04-18 | 2300 | 142 | 20 | 6000–8985 |
| 2021-05-17 | 2400 | 132 | 20 | 6000–8985 | ||
| 2021-06-13 | 2400 | 67 | 20 | 6000–8985 | ||
| 23 | J144936.18 − 011650.46 | 2020-06-16 | 2560 | 180 | 18.5 | 5450–8450 |
| 2020-06-24 | 2560 | 180 | 18.875 | 5585–8585 | ||
| 24 | J145108.53 − 013833.06 | 2020-07-22 | 2560 | 31 | 20 | 6000–8985 |
| 2021-05-11 | 2560 | 61 | 19.625 | 5870–8850 | ||
| 25 | J235639.31 − 040614.47 | 2017-06-05 | 2500 | 45 | 20.375 | 6140–9120 |
| 2017-08-19 | 2350 | 315 | 20.375 | 6140–9120 | ||
| 2020-09-08 | 2560 | 90 | 20 | 6000–8985 |
The raw CCD frames obtained from the observations are first processed with the SALT data reduction pipelines (Crawford et al. 2010). Next, we use standard pyraf (Science Software Branch at STScI 2012) routines to obtain the wavelength and flux-calibrated spectra of the quasars as well as the candidate galaxies. In summary, the science frames were first flat-field corrected, cosmic ray zapped, and then wavelength calibrated against a standard lamp spectrum. Next, we corrected the extinction due to the Earth’s atmosphere, and then the 1D spectra of the quasar and the galaxy were extracted. These 1D spectra were then flux-calibrated against standard stars observed with the same settings as the quasar. Finally, we apply the air to vacuum wavelength transformation and correct for the heliocentric velocity.
4 ANALYSIS AND RESULTS
4.1 Identification of the USMg ii host galaxies
Spectroscopic observations of host-galaxy candidates were completed using SALT for 25 of the 27 USMg ii systems (i.e. excluding the USMg ii absorbers along J0010+0122 and J0141−0005) in our sample. The r-band images of the fields together with the slit orientations (parallel dashed lines in red) used, and the 50 kpc impact parameter at the redshift of the absorber (indicated by the dashed circle) are shown in Fig. 1. The spectroscopically confirmed USMg ii host galaxies are marked with a red ‘+’, and the quasar locations are marked with a red ‘⋆’. As can be seen from this figure and Table A2 of the Appendix (in the online material), there are ten cases where we do not find any galaxy with r < 23.6 mag within an impact parameter of 50 kpc to the quasar sightline at the redshift of the USMg ii system. These are, J0142+0949, J0150−0039, J0150+0604, J1046+0457, J1116+0500, J1217−0115, J1322−0107, J1400−0149, J1451−0138, and J2356−0406. The USMgii absorber towards J2356−0406 is a known GOTOQ (Joshi et al. 2017), and we obtained RSS spectra along three position angles to find the location of the host galaxy using triangulation (see Fig. C1 of Appendix C). In the case of J1046+0457 and J1400−0149, we detect [O ii] emission at the correct redshift in the spectrum of the quasar. We thus confirm the USMg ii host galaxies to be GOTOQs at low impact parameters (i.e. D < 10 kpc). In the case of J1046+0457, we identify the location of the galaxy from the extension seen in the DECaLS images (as discussed in Guha & Srianand 2023) and in the case of J1400−0149, we used the spectra obtained along two PAs.
In five cases (J0142+0949, J0150−0039, J1116+0500, J1217−0115, and J1322−0107), however, we do have a candidate galaxy within 50 kpc if we slightly relax our candidate galaxy selection criteria. Here, we consider the galaxies having photo-z consistent within ∼2σ uncertainty and allow them to be fainter than the limiting magnitude of mr = 23.6. The impact parameter of the candidate galaxies ranges from D ∼ 10 to 50 kpc. In these cases, slit PA is chosen to simultaneously observe the quasar and the galaxy candidate. In the case of J0142+0949, the targeted galaxy at D ∼ 30 kpc (zph ∼ 0.9) does not show any detectable nebular emission line in its spectrum. Still, we find a pair of absorption features consistent with the Ca ii|$\lambda \lambda \, 3935, 3970$| doublet at zgal = 0.786 (see Fig. B1 of Appendix B) and thus consistent with the redshift zabs = 0.7858 of the USMg ii system. Therefore, we consider this galaxy as the host galaxy of the USMg ii absorber.
In the case of J1451−0138, we find a few galaxies with a projected distance of less than 50 kpc from the quasar. However, none has a photometric redshift consistent with the USMgii absorption redshift. We covered three galaxies in our observations (using two slit orientations) plus other galaxies outside the 50 kpc distance. We confirm only one galaxy with correct spectroscopic redshift but at an impact parameter of 64.1 kpc (|$\rm m_r = 21.59$|). In the remaining three cases we do not detect [O ii] emission from the galaxy candidates (typical 3σ limiting [O ii] line flux of |$7\times 10^{-18}\, \rm {ergs\, cm^{-2}\, s^{-1}}$|). In the case of J0150+0604, no faint candidate galaxies are found within 50 kpc. We do not have any indication of a faint galaxy coinciding with the quasar image (i.e. GOTOQs) either in the available photometry or in our spectroscopic data.
In summary, out of the ten USMg ii systems discussed above, we confirm three (J1046+0457, J1400−0149, and J2356−0406) of them to be GOTOQs. For J0142+0949 (even though the identified host galaxy has photo-z inconsistent within 1σ uncertainty) and J1451−0138 (impact parameter is larger than 50 kpc), we spectroscopically confirm the USMgii host galaxies. In four (J0150−0039, J1116+0500, and J1217−0115, and J1322−0107) cases, we have candidate galaxies (either faint or consistent photo-z within 2σ uncertainty) without spectroscopic confirmation. For J0150+0604, we do not have any candidate galaxy present within 50 kpc.
In nine cases (J0028+0041, J0033+0138, J0055−0100, J0127−0550, J0908+0727, J1150+0900, J1336+0922, J1419+0346, and J1449−0116), we have only one galaxy with r < 23.6 mag with a consistent photometric redshift within 50 kpc. We could get spectra of 8 candidate galaxies (apart from the case of J1150+0900 where our SALT observation was not scheduled) and confirm their redshifts using nebular emission lines to be consistent with the corresponding USMg ii system. Therefore, our target completeness is 89 per cent for observations, and spectroscopic completeness is 100 per cent for cases with only one candidate galaxy within 50 kpc of the USMgii absorbers.
In the remaining six cases, there are two galaxies within 50 kpc with consistent photometric redshifts. In three cases (J0105+0040, J0256+0110, and J1201+0713), we could get spectra of both galaxies. We confirm both (one of) the candidate galaxies to have consistent spectroscopic redshifts in the case of J1201+0713 (J0105+0040 and J0256+0110). In the case of J1033+0128, while we got the spectra of one of the candidates, we were unable to confirm the redshift using nebular emission lines. In the last two cases (J0020+0002 and J0956+0018), we could observe only one of the candidate galaxies (with the closest impact parameter) each and confirm them to have consistent spectroscopic redshifts. Therefore, the overall target completeness is 75 per cent for observations, and spectroscopic completeness is 67 per cent for cases with one candidate galaxy (brighter than 23.6 mag) within 50 kpc to the USMg ii absorbers.
Among the 25 observed USMg ii systems, we have successfully identified the USMg ii host galaxies for 18 cases (16 based on [O ii] emission and two based on Ca ii absorption). The quasars (that show USMg ii absorption systems) and the associated USMg ii host galaxies are indicated in columns 2 and 3 of Table 3, respectively. Columns 4 and 5, respectively, provide the spectroscopic redshifts (zgal) and the impact parameters (D). For four systems (J0020+0002, J0105+0040, J0127−0550, and J1201+0713), we could identify another galaxy within 100 kpc having spectroscopic redshift consistent with zabs of the USMg ii system. For the case of J0055−0100, we find an additional galaxy having consistent spectroscopic redshift with the USMg ii absorption at an impact parameter of 120 kpc. Details of these additional galaxies are also provided in Table 3. Therefore, we confirm that at least in 5 out of 18 cases, the USMg ii absorber could be associated with more than one galaxy having correct spectroscopic redshifts and impact parameters less than 125 kpc.
Properties of the USMg ii host galaxies. Columns 2 and 3, respectively, indicate the quasars and corresponding USMg ii host galaxies. Quasars marked with ‘⋆’ belong to the GOTOQs. Columns 4 and 5 provide the [O ii] emission redshifts and the impact parameters of the host galaxies. Columns 6 and 7 provide the stellar masses and the rest frame absolute B band magnitude of the USMg ii host galaxies, respectively. The [O ii] fluxes are measured in the units of 10−17 erg cm−2 s−1 and are provided in Column 8. Column 9 corresponds to the star formation rates based on SED fitting analysis. The values in the parenthesis correspond to the star formation rates based on the [O ii] emission line luminosity. The typical errors associated are about one-third of the value.
| No. | Quasar | Galaxy | zgal | D | log (M⋆/M⊙) | M!B | [O ii] Flux | SFR |
|---|---|---|---|---|---|---|---|---|
| (kpc) | (|$M_\odot \, yr^{-1}$|) | |||||||
| (1) | (2) | (3) | (4) | (5) | (6) | (7) | (8) | (9) |
| 1 | J002022.66 + 000231.98 | J002022.65 + 000230.68 | 0.7684 | 9.7 | – | – | 0.92 ± 0.18 | – (1.2) |
| J002022.58 + 000227.38 | 0.7700 | 35.2 | |$9.33^{+0.31}_{-0.24}$| | −19.08 ± 0.11 | 0.71 ± 0.23 | |$1.04^{+0.88}_{-0.31}$| (1.0) | ||
| 2 | J002839.24 + 004103.05 | J002839.05 + 004104.58 | 0.6565 | 22.2 | |$10.70^{+0.12}_{-0.13}$| | −20.27 ± 0.09 | 0.94 ± 0.27 | |$11.56^{+10.80}_{-4.78}$| (0.3) |
| 3 | J003336.04 + 013851.06 | J003336.24 + 013844.75 | 0.7178 | 50.3 | |$11.76^{+0.04}_{-0.06}$| | −22.46 ± 0.07 | 1.88 ± 0.42 | |$56.90^{+11.65}_{-16.15}$| (2.0) |
| 4 | J005554.25 − 010058.62 | J005554.28 − 010102.72 | 0.7150 | 29.8 | |$11.49^{+0.04}_{-0.05}$| | −21.19 ± 0.07 | <1.06 | |$4.72^{+5.31}_{-2.65}$| (<0.4) |
| J005554.42 − 010115.20 | 0.7161 | 120.7 | |$10.03^{+0.18}_{-0.17}$| | −20.01 ± 0.10 | 0.80 ± 0.19 | |$3.47^{+3.66}_{-2.00}$| (0.5) | ||
| 5 | J010543.52 + 004003.86 | J010543.67 + 004001.10 | 0.6490 | 24.6 | |$10.35^{+0.11}_{-0.12}$| | −20.90 ± 0.09 | 11.2 ± 1.0 | |$5.57^{+2.93}_{-2.04}$| (3.2) |
| J010543.97 + 003957.28 | 0.6489 | 65.7 | |$9.54^{+0.14}_{-0.13}$| | −20.14 ± 0.12 | 0.81 ± 0.21 | |$3.04^{+2.19}_{-0.99}$| (0.5) | ||
| 6 | J012711.11 − 055020.95 | J012711.20 − 055019.01 | 0.6829 | 16.8 | |$10.48^{+0.16}_{-0.17}$| | −21.35 ± 0.12 | 3.82 ± 0.87 | |$7.93^{+5.71}_{-2.96}$| (2.6) |
| J012711.91 − 055016.45 | 0.6839 | 90.1 | |$10.77^{+0.11}_{-0.18}$| | −20.90 ± 0.10 | 1.73 ± 0.23 | |$9.91_{-2.94}^{+4.44}$| (1.1) | ||
| 7 | J014258.83 + 094942.43 | J014258.56 + 094942.20 | 0.7860 | 30.0 | |$12.01^{+0.12}_{-0.14}$| | −21.68 ± 0.09 | <1.10 | – (<0.4) |
| 8 | J025607.25 + 011038.56 | J025607.10 + 011039.80 | 0.7244 | 18.4 | |$11.04^{+0.14}_{-0.12}$| | −21.26 ± 0.10 | 1.46 ± 0.28 | |$36.18^{+44.52}_{-16.68}$| (1.5) |
| 9 | J090805.76 + 072739.90 | J090805.91 + 072740.58 | 0.6127 | 16.5 | |$10.73^{+0.13}_{-0.14}$| | −20.57 ± 0.10 | 2.53 ± 0.33 | |$15.61^{+12.78}_{-7.19}$| (1.3) |
| 10 | J095619.49 + 001800.34 | J095619.41 + 001802.00 | 0.7829 | 15.6 | |$10.72^{+0.14}_{-0.16}$| | −21.06 ± 0.13 | 6.89 ± 0.52 | |$14.42^{+20.12}_{-7.00}$| (16) |
| 11 | J104642.70 + 045731.96⋆ | J104642.62 + 045731.84 | 0.7848 | 8.9 | – | – | 0.88 ± 0.27 | – (1.6) |
| 12 | J120139.57 + 071338.24 | J120139.41 + 071342.84 | 0.6854 | 36.3 | |$10.98^{+0.14}_{-0.11}$| | −21.43 ± 0.10 | 1.80 ± 0.37 | |$42.97^{+45.06}_{-24.86}$| (1.2) |
| J120139.77 + 071333.28 | 0.6842 | 41.3 | |$11.42^{+0.13}_{-0.11}$| | −21.50 ± 0.09 | 2.91 ± 0.50 | |$82.69_{-24.86}^{+85.06}$| (1.7) | ||
| 13 | J133653.73 + 092221.23 | J133653.80 + 092217.96 | 0.7059 | 24.6 | |$10.47^{+0.16}_{-0.20}$| | −20.47 ± 0.14 | 3.05 ± 0.30 | |$6.07^{+4.73}_{-2.10}$| (2.1) |
| 14 | J140017.69 − 014902.40⋆ | – | 0.7933 | ≤8 | – | – | – | – |
| 15 | J141930.09 + 034643.73 | J141930.39 + 034639.86 | 0.7252 | 42.8 | |$10.97^{+0.16}_{-0.17}$| | −21.51 ± 0.12 | 8.0 ± 1.0 | |$23.29^{+17.46}_{-9.22}$| (2.7) |
| 16 | J144936.18 − 011650.46 | J144936.20 − 011643.58 | 0.6618 | 48.1 | |$10.74^{+.13}_{-0.08}$| | −21.05 ± 0.10 | 4.73 ± 0.43 | |$21.06^{+56.17}_{-10.87}$| (3.0) |
| 17 | J145108.53 − 013833.06 | J145108.24 − 013840.64 | 0.7414 | 64.1 | |$11.44^{+0.07}_{-0.10}$| | −21.94 ± 0.08 | 1.00 ± 0.24 | |$34.44^{+9.42}_{-9.25}$| (3.5) |
| 18 | J235639.31 − 040614.47⋆ | J235639.27 − 040413.80 | 0.7699 | 6.24 | – | – | 5.49 ± 0.43 | – (3.9) |
Finally, for all the spectroscopically confirmed redshifts, we compare the photometric redshift and spectroscopic redshift (see Fig. C2 of Appendix C). We find that the two match well within 2σ uncertainty.
4.2 Properties of USMg ii host galaxies
Having identified the host galaxies of USMg ii absorbers, we estimate their properties, such as the stellar mass (M*), rest-frame absolute B-band magnitude (MB), and the ongoing star formation rate (SFR) using the available photometric and spectroscopic data and the spectral energy distribution (SED) modelling. As in Guha et al. (2022), we use the freely accessible python tool Bayesian Analysis of Galaxies for Physical Inference and Parameter EStimation (BAGPIPES; Carnall et al. 2018). BAGPIPES takes into account Bruzual & Charlot (2003) stellar population models, which were built assuming the Kroupa & Boily (2002) initial mass function (IMF) and most recently revised by Chevallard & Charlot (2016) to incorporate the MILES stellar spectrum library and an updated stellar evolutionary track (Marigo et al. 2013). The interstellar dust is assumed to follow Calzetti (1997) dust model.
During the fit, we keep the redshifts of the USMg ii host galaxies fixed to their spectroscopic redshifts. Although BAGPIPES can simultaneously fit photometric and spectroscopic data, we only use the DESI-LIS three broad-band photometric measurements to fit the SED as the SNR of individual pixels for the continuum regions in the spectra of most of the USMg ii host galaxies is quite poor (SNR < 3). We also assume that all the stars in the galaxy have the same metallicity and use a flat prior in the range 0.01Z⊙−2.5Z⊙. We parametrize the star formation histories with an exponential model (Carnall et al. 2019). We choose a uniform prior to the logarithm of the stellar mass in the range 0 ≤ log (M⋆/M⊙) ≤ 13. However, note that the parametric models impose strong priors on physical parameters and may bias the inferred galaxy properties. Although the stellar mass is less sensitive to such effects (typical offset of 0.1 dex from the true value), the offset for SFR can be as large as 0.3 dex (Carnall et al. 2019). The derived parameters for each galaxy are listed in Table 3.
Note galaxy properties could not be measured for four USMg ii systems as their host galaxy image is blended with the quasar image. For the same reason, we could measure the galaxy parameters only for 26 out of the 36 nearest host galaxies in our combined USMg ii sample. To enable easy comparison, we have also measured all these parameters for host galaxies in the MAGIICAT sample using the same technique (see Guha et al. 2022 for details).
4.2.1 [O ii] luminosity
As mentioned earlier, except for two cases, we detected [O ii] nebular emission from USMg ii host galaxies in our present sample. To obtain the spectroscopic redshifts, we fit the [O ii] emission line using a pair of Gaussian functions having the same redshifts and velocity widths with the centroids of the two Gaussian functions separated by the ratio of the rest wavelengths of the [O ii] |$\lambda \lambda \, 3729,\, 3727$| lines. While fitting, the amplitude ratio of these two Gaussian functions is allowed to vary between 0.3 and 1.5 (Osterbrock & Ferland 2006). In principle, this flux ratio can be used to constrain the electron density. However, due to the poor velocity resolution of the SALT spectra, the uncertainty in this ratio is large, which prevents us from constraining the electron density accurately.
The [O ii] line fluxes (combined flux of the doublet) obtained from simple integration over the line profile are given in column 8 of Table 3. The [O ii] nebular line fluxes are then converted to the [O ii] line luminosities (|$L_{[O\, {\small II}]}$|) based on their redshifts and the assumed background cosmology. Note that the measurements of [O ii] luminosity are affected by two factors – the slit-loss and the dust attenuation. To correct for the slit-loss, we assume that the slit-loss is independent of the observed wavelength. Thus, we scale the observed spectra to match the synthetic spectra obtained from the SED fitting of available photometric points using the least square minimization method. We then multiply this scale factor with |$L_{[{\rm O}\, {\small II}]}$| to correct for the slit-loss. However, to estimate the dust content in these galaxies, we would need either at least two H i Balmer lines in emission or good-quality continuum spectra of these galaxies with sufficient SNR. As for all the cases, we have neither, so we do not correct for dust attenuation.
In Fig. 2, we show the scatter plot of W2796 versus the |$L_{[{\rm O}\, {\small II}]}$| of the associated Mg ii host galaxies. To account for the redshift evolution, we have scaled the |$L_{[{\rm O}\, {\small II}]}$| with respect to the characteristics [O ii] line luminosities (|$L_{[{\rm O}\, {\small II}]}^\star$|, Comparat et al. 2016) at the host galaxy redshifts. The orange, green, purple, and blue points correspond to the Mg ii host galaxies from the GOTOQs (Joshi et al. 2017), MAGG survey (Dutta et al. 2020), MEGAFLOW survey (Schroetter et al. 2019), and the USMg ii host galaxies, respectively. The |$L_{[{\text O}\, {\small II}]}$| for the USMg ii host galaxies varies from |$0.05L_{[{\text O}\, {\small II}]}^\star$| to |$2.37L_{[{\rm O}\, {\small II}]}^\star$| with a median value of |$0.37L_{[{\rm O}\, {\small II}]}^\star$|. Using the lowest [O ii] line luminosity as the detection threshold (i.e. |$L_{\rm min} = 0.05L^\star _{[{\rm O}\, {\small II}]}$|) and the [O ii] line luminosity function (Comparat et al. 2016) at z ∼ 0.6, we find that the total number of expected super-|$L^{\star }_{[{\rm O}\, {\small II}]}$| galaxies for a random population of galaxies are only about 3 per cent implying only one super-|$L^\star _{[{\rm O}\, {\small II}]}$| galaxies among the detected USMg ii host galaxies. The expected median line luminosity for the random population of galaxies (at z ∼ 0.6) is |$\sim 0.1L^\star _{[{\rm O}\, {\small II}]}$|. For our USMg ii sample, however, we have three super-|$L^{\star }_{[{\rm O}\, {\small II}]}$| galaxies and the median line luminosity (|$0.37L_{[{\rm O}\, {\small II}]}^\star$|) is also significantly high, even without correcting for dust extinction.
![Scatter plot of W2796 against the [O ii] line luminosity ($L_{[{\rm O}{\small II}]}$) of the associated Mg ii host galaxies. To correct for redshift evolution, we have scaled the $L_{[{\rm O}{\small II}]}$ according to the characteristic [O ii] line luminosity ($L_{[{\rm O}{\small II}]}^\star$) at that redshift. The orange, green, purple, and blue points (diamond/circle) correspond to the Mg ii host galaxies from the GOTOQs (Joshi et al. 2017), MAGG survey (Dutta et al. 2020), MEGAFLOW survey (Schroetter et al. 2019), and the USMg ii host galaxies (high redshift/low redshift), respectively. The horizontal and vertical black dashed lines correspond to the $W_{2796}^{cut}$ of USMg ii host galaxies and $L_{[{\rm O}{\small II}]}^\star$ galaxies, respectively.](https://oup.silverchair-cdn.com/oup/backfile/Content_public/Journal/mnras/527/3/10.1093_mnras_stad3489/1/m_stad3489fig2.jpeg?Expires=1750457194&Signature=HNMXJrii6r8XR20rWm0pKhEBDmk7eEkHlysRl7bnbSCe4IHWxgcYXGZ0tUOjYaSjyUyQtjd-0ZQexfLLZoM24WBfugu2-lWW6ExQP5VwEeRTQEfaRayEq0pWhuoJiZmkzYYR1dCflDF0NIj612ksagQLyJ4wuHXUdkNnyj4Si4zzvJYEjsKx-NyE209dpG-5B8riPU-8a3oTQdAj1T7VrOPXwqVHJp~oP5h8fobY2KGOrrOMXJeUrnm-Oqa9imUTLZ7D2J13GSIomz6V0-qMUTb1Lg3LhKR3T6WWZsHM-yvqLjUBkFfftWtqfV-8662V2Blsk9jL9-~d7Um2BFpIdg__&Key-Pair-Id=APKAIE5G5CRDK6RD3PGA)
Scatter plot of W2796 against the [O ii] line luminosity (|$L_{[{\rm O}{\small II}]}$|) of the associated Mg ii host galaxies. To correct for redshift evolution, we have scaled the |$L_{[{\rm O}{\small II}]}$| according to the characteristic [O ii] line luminosity (|$L_{[{\rm O}{\small II}]}^\star$|) at that redshift. The orange, green, purple, and blue points (diamond/circle) correspond to the Mg ii host galaxies from the GOTOQs (Joshi et al. 2017), MAGG survey (Dutta et al. 2020), MEGAFLOW survey (Schroetter et al. 2019), and the USMg ii host galaxies (high redshift/low redshift), respectively. The horizontal and vertical black dashed lines correspond to the |$W_{2796}^{cut}$| of USMg ii host galaxies and |$L_{[{\rm O}{\small II}]}^\star$| galaxies, respectively.
Out of all the GOTOQs, only |$\sim 5~{{\ \rm per\ cent}}$| are super-|$L^\star _{[{\rm O}\, {\small II}]}$| galaxies. If we restrict ourselves to GOTOQs that produce USMg ii absorption, we find |$\sim 15~{{\ \rm per\ cent}}$| of them are super-|$L^\star _{[{\rm O}\, {\small II}]}$|. Like the USMg ii galaxies, the [O ii] luminosities of GOTOQs should be taken as lower limits as they are not corrected for fiber loss and dust extinction. For the MEGAFLOW sample, out of 26 Mg ii host galaxies, only two (|$\sim 8~{{\ \rm per\ cent}}$|) are super-|$L_{[{\rm O}\, {\small II}]}^\star$| galaxies. Among the 53 galaxies associated with Mg ii absorption in the MAGG sample, only two (|$\sim 4~{{\ \rm per\ cent}}$|) are super-|$L_{[{\rm O}\, {\small II}]}^\star$| galaxies. In the above two samples, there are only three USMg ii systems, and none of them are found to be a super-|$L_{[{\rm O}\, {\small II}]}^\star$| galaxy. Therefore, when we combine all the USMg ii absorbers in different samples, we find ∼12 ± 4 per cent of the host galaxies have super-|$L_{[{\rm O}\, {\small II}]}^\star$|. This, together with the high mean luminosity found above, confirms the early finding of Guha et al. (2022) that USMg ii absorbers are preferentially hosted by galaxies having higher-|$L_{[O\, {\small II}]}$| compared to field galaxies.
A Spearman rank correlation analysis between W2796 and |$L_{[{\rm O}\, {\small II}]}/L_{[{\rm O}{\small II}]}^\star$| yields a significant correlation between these two quantities (rS = 0.28 and p-value ∼10−7), which is also reported in literature (Ménard et al. 2011; Joshi et al. 2018). However, this correlation is driven by weak Mg ii absorbers. The correlation gets weaker as we restrict ourselves to the stronger Mg ii absorbers (see Guha et al. 2022 for details). For example, for W2796 > 1 Å, Spearman rank correlation analysis gives rS = 0.16 and p-value = 0.008, while for W2796 > 2 Å, we get rS = 0.05 and p-value = 0.52. It is also clear from Fig. 2 that there is no clear trend among the USMg ii absorbers between W2796 and |$L_{[{\rm O}\, {\small II}]}$|.
Next, we look for any redshift evolution in the [O ii] luminosity of USMg ii host galaxies over the redshift range 0.4 ≤ z ≤ 0.8. We do not find any redshift evolution in the [O ii] luminosities of the USMg ii host galaxies with a Spearman correlation coefficient rs = 0.07 with p-value of 0.68. This is contrary to the mild evolution shown by |$L_{[{\rm O}\, {\small II}]}^\star$| over the same redshift range (Comparat et al. 2016). It will be useful to confirm this with better quality spectra after applying appropriate dust corrections.
4.2.2 Star formation rates
Next, we consider the current SFRs of the USMg ii host galaxies. We measure the SFRs using two different methods. The first method is based on the [O ii] nebular line luminosity (Kennicutt 1998, given inside the brackets in the last column of Table 3), and the second method is based on the SED fitting (the last column of Table 3). The SFR obtained using the [O ii] emission line has systematic uncertainties that depend on variation in reddening, chemical abundance (stellar mass through the mass metallicity relations), and ionization (Moustakas, Kennicutt & Tremonti 2006; Gilbank et al. 2010). The inferred SFR using [O ii] nebular emission is less than measured using SED fitting and as in Guha et al. (2022), for the reasons mentioned above, we use the SFR measurements based on SED fitting in our analysis.
We find a mild redshift evolution of the SFR of the USMg ii host galaxies, obtained using SED fitting, over the redshift range 0.4 ≤ z ≤ 0.8. The Spearman correlation coefficient between the SFR and z, rs = 0.61, with p-value being ∼0.001. Since our host galaxy sample is magnitude limited some of the redshift evolution may be biased by this. In Fig. 3, we show the scatter plot between the ongoing SFRs obtained from the SED fitting scaled by the SFR of a main-sequence galaxy (SFRMS) of the same mass at the same redshift (Speagle et al. 2014), against their stellar masses. We scale the SFR with the main-sequence SFR to account for redshift evolution. The points are colour-coded by W2796. The solid black line corresponds to the main-sequence SFR. The dotted and the dash–dotted line corresponds to the median SFR of magiicat and USMg ii host galaxies, respectively. The new data added from this work confirms that the USMg ii host galaxies are not starburst galaxies and have SFRs slightly lower than that expected for the main-sequence galaxies (Guha et al. 2022). However, note that the SFRs are obtained from SED fittings based on the multiband galaxy photometries without the galaxy spectra can have large offsets (up to a factor of 2) and can at best be main-sequence galaxies.
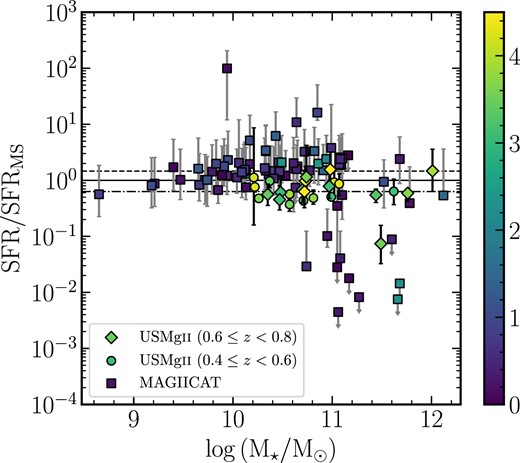
Scatter plot of the ongoing SFRs (SFR) scaled by the SFR of a main-sequence galaxy (SFRMS) of the same mass at the same redshift, colour-coded as W2796 against the stellar masses of the Mg ii absorbers. The diamond, circle, and square markers correspond to the high redshift USMgii host galaxies, low redshift USMgii host galaxies, and the magiicat host galaxies, respectively. The solid black line corresponds to the main sequence SFR. The dotted and the dash-dotted line correspond to the median SFR of magiicat and USMgii host galaxies, respectively.
4.3 |$\rm {\it W}_{2796}$| versus impact parameter
In this section, we revisit the well-known anti-correlation between W2796 and impact parameter (Bergeron & Boissé 1991; Steidel 1995; Chen et al. 2010; Nielsen et al. 2013) for the Mg ii absorbers. In particular, we are interested in (i) understanding this relation for USMgii absorbers by combining the present data with those from Guha et al. (2022) and (ii) how the global fit for the Mg ii systems gets modified by the inclusion of USMgii absorbers that mostly populate the low D – high W2796 region of the |$\rm {\it W}_{2796}-{\it D}$| plane. For consistency and simplicity, we consider the host galaxy as the one with the smallest impact parameter in any of the samples used here when there is more than one galaxy identified at the correct redshift.
In the left panel of Fig. 4, we show the points from our USMgii sample, GOTOQs from Guha & Srianand (2023), and additional measurements from different samples from the literature. The red points (circles for galaxies from Guha et al. (2022) and squares for galaxies from this work) correspond to the USMg ii host galaxies from our observations. The orange, blue, violet, grey, brown, green, and pink circular points correspond to the isolated galaxies in Guha & Srianand (2023), MAGIICAT survey (Nielsen et al. 2013), Huang et al. (2021), MAGG survey (Dutta et al. 2020), Kacprzak et al. (2013), DLAs and sub-DLAs (Rahmani et al. 2016), and Rubin et al. (2018) respectively. For DLAs and sub-DLAs, we obtained the W2796 from measurements available in the literature and used the impact parameters quoted in Rahmani et al. (2016). It is good to recollect that the W2796 measurements reported in Rubin et al. (2018) are towards background galaxies, unlike all other measurements towards quasars. We found some of the Mg ii systems in the literature sample are observed in two different surveys, and we made sure that the individual points plotted in Fig. 4 and used for our statistical analysis correspond to a unique Mg ii system by removing the duplicates.

The left panel shows the impact parameter (D) versus the |$\rm {{\it W}_{2796}}$| anticorrelation over the full redshift range for the isolated galaxies. The red squares correspond to the high-redshift USMgii absorption systems. The red (circle), orange, blue, violet, grey, brown, green, and pink points are taken from the low redshift USMgii survey (Guha et al. 2022), GOTOQs (Guha & Srianand 2023), MAGIICAT survey (Nielsen et al. 2013), Huang et al. (2021), MAGG survey (Dutta et al. 2020), Kacprzak et al. (2013), DLAs and sub-DLAs, and Rubin et al. (2018), respectively. The solid black line corresponds to the best-fitting log-linear model, and the shaded region corresponds to the 1σ errors associated with it. The middle and right panels show the same, but only for the redshift ranges, 0.4 ≤ zabs < 0.6, and 0.6 ≤ zabs ≤ 0.9, respectively.
4.3.1 Relationship for the USMg ii systems
First, we study the W2796−D distribution of USMgii systems (see Fig. 5). The top part of Fig. 5 shows the distribution of impact parameters for USMg ii systems. The impact parameter of the USMg ii host galaxies in the present sample varies from 6.24 to 64.1 kpc with a median of 23 kpc. Points in this plot are colour-coded by their absorption redshifts. The red squares (circles) correspond to our measurements for high-z (low-z) USMg ii systems, whereas those from the literature (from Bouché et al. 2007; Nestor et al. 2011b; Schroetter et al. 2015; Dutta et al. 2020) are shown with circles of different colours. For the combined USMg ii sample, the impact parameter ranges from 6.24 to 79 kpc with a median of 19 kpc. As noted by Guha et al. (2022), the USMgii systems do not follow the W2796–D anticorrelation. The Spearman correlation test yields no significant correlation (rS = 0.12, p = 0.40) between these two quantities.

W2796 versus the impact parameters (D) for the USMg ii host galaxies colour coded by their absorption redshifts. The diamonds (circles) indicate our measurements for 0.4 |$\leq$|z|$\leq$| 0.6 (0.6 |$\leq$|z|$\leq$| 0.9) USMg ii sample. Squares show the data from the existing literature. The open stars are for the DLAs and sub-DLAs in the redshift range 0.4 ≲ z ≲ 1.0 (Rahmani et al. 2016). The top panels show the distribution of impact parameters for the USMg ii absorbers.
It is well known that the W2796−D relationship has a large scatter, and absorbers of a given rest equivalent width can originate from a wide range of impact parameters. Since our sample is based on large W2796 cut-off (i.e. |$\mathrm{W_{2796}^{cut}} = 3$| Å), it is important to check how the imposed |$\mathrm{W_{2796}^{cut}}$| influences the measured correlation. To explore this, we measure the Spearman rank correlation coefficient rs between W2796 and D for different values of |$W_{2796}^{\rm {cut}}$| for the full sample. We notice that the strength of the anticorrelation between the W2796 and D becomes statistically insignificant if we confine ourselves to the stronger W2796, i.e. |$W_{2796}^{\rm {cut}}\ge 1.5$| Å (see Fig. 6). For higher values of |$W_{2796}^{\rm {cut}}$|, the data suggest a positive correlation coefficient but with less statistical significance. This demonstrates that when host galaxies are studied for an absorber-centric sample, the derived relationship between W2796 and D will be very sensitive to the W2796 cut-off used. Recently, DeFelippis et al. (2021) discussed the W2796 versus D relationship in their cosmological hydrodynamical simulations (see their fig. 4). While high W2796 absorption are not well represented in their simulations, there is also a lack of correlation between W2796 and D for strong Mg ii absorber (defined as W2796 > 0.5 Å) along selected sightlines. On the other hand, for sightlines generated around halos, the anticorrelation is seen with a large scatter. Our findings align with these results even though the simulated W2796 are much weaker than that of USMg ii systems.
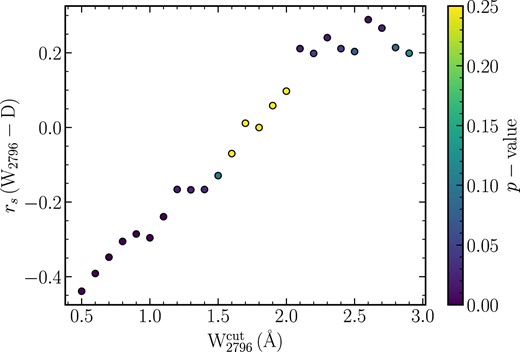
The Sprearmann rank correlation coefficient between the W2796 and D for a given |$W_{2796}^{cut}$| colour-coded according to the p values with the null hypothesis that these two data sets are uncorrelated. For a small |$W_{2796}^{cut}$|, there is a significant anticorrelation between W2796 and D. However, as |$W_{2796}^{cut}$| increases, the significance of the anticorrelation keeps on decreasing and completely vanishes for |$W_{2796}^{cut}$| of 1.5 Å.
It is known that galaxy properties like M*, MB, and the SFR may introduce scatter in the W2796 versus D relationship. In the following sections, we will explore whether the large scatter in D is related to the scatter in the galaxy properties. Alternatively, the lack of correlation between W2796 and D could be related to a good fraction of USMg ii absorbers not originating from the CGM around a single galaxy but contributed by several galaxies. Below we will discuss this possibility as well.
4.3.2 Redshift evolution
Here, we study the possible redshift evolution of the W2796−D relationship for the full Mg ii absorber population. The solid black line in Fig. 4 corresponds to the best-fitting log-linear model, and the shaded region corresponds to the 1σ error associated with it. The maximum likelihood fitting prescription we use, including the upper limits, is provided in Guha et al. (2022). The middle and right panels show the same, but for the redshift ranges, 0.4 ≤ zabs < 0.6, and 0.6 ≤ zabs ≤ 0.9, respectively. The best-fitted parameters for the full sample and systems in two redshift ranges are given in Table 4. The quoted values of σ in Table 4 are larger than most of the literature values. In the bottom panel of Fig. 7, we show the residual of log of equivalent width (i.e. observed log W2796 minus the predicted value from our best fit) as a function of impact parameter. It is evident that USMg ii points form the upper envelope of the scatter, and the scatter increases as we go towards higher D.
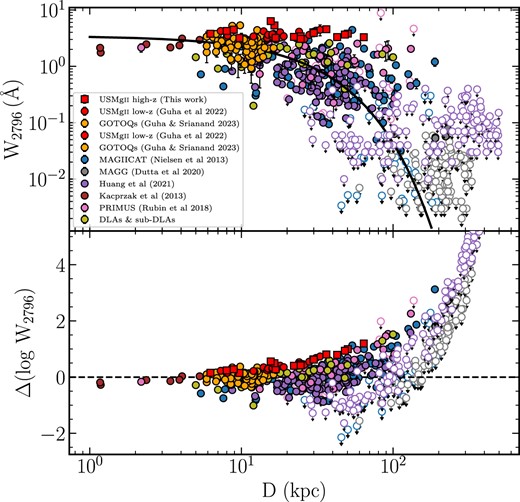
The scatter in the |$\rm {\it W}_{2796}{\!-\!}{\it D}$| anticorrelations. The top panel shows various Mg ii absorption systems in the |$\rm {\it W}_{2796}{\!-\!}{\it D}$| space from this work and the literature. The solid black line represents the best-fitting log-linear curve. This plot is the same as the left panel of Fig. 4. The bottom panel shows the difference between the observed |$\rm \log \, (W_{2796})$| and the best-fitting model for that impact parameter.
Best-fitting parameters for the log-linear characterization of the W2796 versus D anticorrelations for different redshift ranges.
| Redshift | α | β | σ |
|---|---|---|---|
| 0 < z < 1.5 | −0.019 ± 0.002 | 0.540 ± 0.028 | 1.09 ± 0.05 |
| 0.4 ≤ z < 0.6 | −0.015 ± 0.003 | 0.538 ± 0.045 | 1.13 ± 0.10 |
| 0.6 ≤ z ≤ 0.9 | −0.010 ± 0.002 | 0.514 ± 0.044 | 1.29 ± 0.10 |
| Redshift | α | β | σ |
|---|---|---|---|
| 0 < z < 1.5 | −0.019 ± 0.002 | 0.540 ± 0.028 | 1.09 ± 0.05 |
| 0.4 ≤ z < 0.6 | −0.015 ± 0.003 | 0.538 ± 0.045 | 1.13 ± 0.10 |
| 0.6 ≤ z ≤ 0.9 | −0.010 ± 0.002 | 0.514 ± 0.044 | 1.29 ± 0.10 |
We attribute the large scatter around the best-fitting relation to the lack of correlation between W2796 and D found for the USMg ii systems and the large scatter in W2796 at the low-D found for GOTOQs. As described in Guha & Srianand (2023), the inclusion of data at low impact parameters has increased the value of β compared to what has been reported in the literature. For the combined sample, our best-fitting parameters suggest W2796 (D = 0) ∼ 3.5 Å and characteristic impact parameter scale (i.e. −1/(2.303 × α)) is ∼ 23 kpc.
Neither α nor β shows any significant change between the two distinct redshift ranges considered here. In addition, the KS-test confirms the W2796 distribution in these two redshift bins is not significantly different (p-value of 0.06). To avoid any bias introduced by differences in the W2796 distribution, we considered several sub-sample by matching the distribution of W2796 and confirming the lack of any significant redshift evolution in both α and β. For ease of viewing, in Fig. 8, we plot the best-fitting relations and associated errors for the two redshift ranges. As mentioned, W2796 (D = 0) does not evolve with redshift. Even though there is no significant difference between the best-fitted values of α, the plot suggests a slight excess in W2796 at large D for the high-z sub-sample.
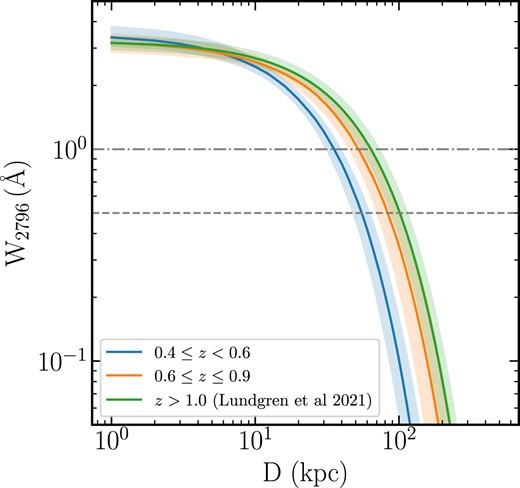
Redshift evolution of the |$\rm {\it W}_{2796}{\!-\!}{\it D}$| anticorrelation. The blue and orange lines correspond to the best-fitting |$\rm {\it W}_{2796}{\!-\!}{\it D}$| curve for the redshift range 0.4 ≤ z < 0.6 and 0.6 ≤ z ≤ 0.9, respectively. The green curve is taken from Lundgren et al. (2021) and corresponds to the best-fitting |$\rm {\it W}_{2796}{\!-\!}{\it D}$| anticorrelation for the redshift range z ≥ 1. The grey dot–dashed and dashed horizontal lines correspond to |$\rm W_{2796} = 1$|Å and |$\rm W_{2796} = 0.5$|Å respectively.
Lundgren et al. (2021) have reported α = −0.008 ± 0.001 and β = 0.51 ± 0.03 for z > 1 using their data combined with the available data from the literature (from Bouché et al. 2012; Lundgren et al. 2012; Schroetter et al. 2019; Lundgren et al. 2021). The β value they obtained is consistent with what we report in Table 4. The α value quoted by Lundgren et al. (2021) is slightly low but consistent within 2.3σ with our measurements in two low-z bins. By comparing their values of α and β with those of Nielsen et al. (2013) (i.e. α = −0.015 ± 0.002 and β = 0.27 ± 0.11) Lundgren et al. (2021) suggested a possible evolution in the gas distribution around galaxies at z ∼ 0.4 and z ∼ 1.5. To ensure that our result is not dominated by any bias arising from differences in the W2796 distribution, we have measured α and β of 500 random sub-samples from our sample that have the same number of absorbers having the distribution of W2796 similar to that of the sample of Lundgren et al. (2021). Using the log-linear fits of these realizations, we obtain α = −0.011 ± 0.001 and |$\beta =0.48^{+0.02}_{-0.01}$|. This again confirms the lack of strong redshift evolution in α and β. In Fig. 8, we also show the best-fit relationship for the high-z sample of Lundgren et al. (2021). As before, we notice that at large impact parameters, the best fits suggest higher W2796 at high-z. This figure also suggests no significant redshift evolution in the |$\rm W_{2796}$| versus D relationship at D < 20 kpc.
Dutta et al. (2020) have obtained β = |$-0.05^{+0.42}_{-0.38}$| and α = −0.010 ± 0.003 for closest galaxies at z ∼ 0.8−1.5 to the line of sight to 28 background quasars. Their α values are consistent with our values. However, the inferred W2796(D = 0) value is lower than ours, albeit with large errors. This is related to the poor representation of galaxies with low impact parameters (i.e. D < 20 kpc) in their sample.
How the W2796−D relationship evolves with z has an important consequence on the redshift evolution of the number of Mg ii absorbers per unit redshift path length (i.e. dN/dz). For absorbers with W2796 > 1 Å, dN/dz = 0.16, 0.20, and 0.31 for z = 0.5, 0.7, and 1.3, respectively (Zhu & Ménard 2013). When we consider W2796 > 0.5 Å, the corresponding values are 0.41, 0.47, and 0.62. Thus systems with the largest equivalent width tend to show a slightly more rapid increase with redshift compared to those with the lowest equivalent width. In a simple model where all-known galaxies have a spherical gaseous halo of the same radius and gas covering factor fc, the average number of Mg ii absorbers per unit redshift interval is given by |$\langle {\rm d}N/{\rm d}z \rangle = f_c \pi D_{\rm max}^2\int _{L_{\rm min}}^\infty \phi (L, z) {\rm d}L \times {\rm d}l/{\rm d}z$|. Here, Dmax is the maximum impact parameter for a given value of |$W_{2796}^{cut}$| for which dN/dz is computed. ϕ(L, z) is the galaxy luminosity function at redshift z, and dl/dz is the differential comoving path length per unit redshift interval.
From Faber et al. (2007) we find the average number density of galaxies (with −30 ≤ MB ≤ −10 and |$M^{*}_B \sim -21.3$|) per unit physical volume is ∼0.90 and ∼1.74 Mpc−3 at z = 0.5 and 1.1, respectively. Thus a factor of 2 change in dN/dz over the redshift range 0.5 ≤ z ≤ 1.1 can purely originate from the redshift evolution of the galaxy luminosity function. From Fig. 8, if the covering fraction is independent of D, then the number density of low W2796 is expected to show stronger redshift evolution. This is contrary to the observed results quoted above. Thus, one requires the covering fraction to change with D. This expectation is consistent with the finding of Lan (2020). Their results suggest that over the redshift range 0.5 ≤ z ≤ 1.1, the covering fraction of star-forming galaxies (|$M_\star \sim 10^{10}\, M_\odot$|) associated with strong Mg ii absorption (W2796 ≥ 1Å) increases from 0.19 to 0.41, implying an increase of the covering fraction by a factor of ∼2. The same for weak absorbers (W2796 < 1Å) changes from 0.15 to 0.24, implying an increase by a factor of ∼1.5.
4.3.3 Dependence on stellar mass
Churchill et al. (2013a) have noted that for a given W2796, the host galaxies at high impact parameters tend to have larger halo masses. This section investigates the presence of such a trend in our USMg ii sample. In column 6 of Table 3, we provide the present sample’s stellar masses of the USMgii host galaxies. The stellar mass of the USMgii host galaxies at z ∼ 0.7 ranges from 10.35 ≤ log (M⋆/M⊙) ≤ 12.01 with a median value of 10.86. In the combined sample of USMg ii host galaxies, the stellar mass ranges from 10.21 ≤ log (M⋆/M⊙) ≤ 12.01 with the median of log (M⋆/M⊙) = 10.73. We find a mild evolution in the stellar masses of the USMg ii host galaxies over the redshift range 0.4 ≤ z ≤ 0.8 (Spearman correlation coefficient, rs = 0.48 with p-value 0.01). As mentioned before, some redshift evolution may be influenced by the fact that we are using a magnitude-limited sample. For the MAGIICAT host galaxies, the stellar masses are found to be in the range 8.65 ≤ log (M⋆/M⊙) ≤ 12.12 with a median value of 10.51. Even though the two samples overlap in M* ranges, the USMg ii host galaxies tend to have higher M* values as suggested by the median values.
In the left panel of Fig. 9, we show the scatter plot of M⋆ versus D for host galaxies of the general Mg ii system population from the MAGIICAT sample and USMg ii systems in our sample colour-coded according to the W2796. For the MAGIICAT host galaxies, we also find a correlation between M⋆ and D, which can be characterized by a linear fit of the form |$\log (M_\star /{\rm M}_\odot) = (0.036\pm 0.006)D\, (\text{kpc}) + (9.301 \pm 0.225)$| (see Guha et al. 2022). The solid black straight line corresponds to this fit, and the grey region to the 1σ uncertainty to the fit. This aligns with the findings of Churchill et al. (2013b); Rubin et al. (2018); Huang et al. (2021), who reported that massive galaxies produce stronger absorption for a similar impact parameter. Considering the USMgii host galaxies alone, we find a possible mild correlation between M⋆ and D. A Spearman rank correlation analysis returns a correlation coefficient of rS = 0.5 and a p-value of 0.009. A linear fit to the data for the USMg ii galaxies gives |$\log (M_\star /{\rm M}_\odot) = (0.019\pm 0.007)D\, (\text{kpc}) + (10.341 \pm 0.203)$|. The solid blue line in the left-hand panel of Fig. 9 corresponds to this fit. For a given impact parameter, the stellar mass of host galaxies of USMg ii absorbers is systematically higher than the low equivalent width systems. For example, at median D ∼ 23 kpc (or D ∼ 0 kpc) of the USMg ii sample, the host galaxies of USMg ii systems are a factor 4 (or∼ 10) times higher than absorbers seen in the MAGIICAT sample.
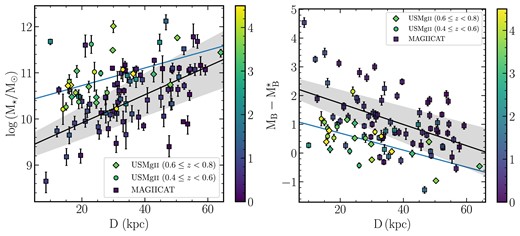
Left panel: Stellar masses of the Mg ii host galaxies against their impact parameters, colour-coded as W2796. Right panel: Rest-frame absolute B-band magnitudes of the Mg ii host galaxies relative to the characteristic B-band magnitude at the same redshift against their impact parameters. For both panels, the diamond, circle, and square markers correspond to the high redshift USMg ii host galaxies, low redshift USMg ii host galaxies, and the magiicat host galaxies. The solid black lines correspond to the linear regression fit to the magiicat host galaxies, and the grey regions correspond to the 1σ uncertainty to the fit. The solid blue line corresponds to the linear fit, but only for the USMg ii host galaxies from our survey.
In the MAGIICAT sample, when we consider all cases with W2796 measurements and not upper limits, we find that the correlation is stronger between W2796 and |$\rm D +0.16 (\log (M_\star /M_\odot)- 10.51)$| (i.e. rs = −0.47 with a p-value of ∼10−4) compared to the correlation between |$\rm W_{2796}$| and D (i.e. rs = −0.37 with a p-value of ∼10−3). We repeated the same exercise for USMgii absorbers alone. We find for W2796−D relation the correlation coefficient is rs = −0.113 with p-value = 0.59. After minimizing the mass-dependent scatter (i.e |$\rm W_{2796}$| versus |$\rm {\it D} + 0.017(log ({\it M}_*/M_\odot)-10.73)$|) correlation coefficient is rs = −0.112 with p-value = 0.590.
We quantify this further using the relationship between W2796, D, and M* found by Huang et al. (2021). For the median stellar mass (i.e. log (M*/M⊙) = 10.73) and impact parameter (D ∼ 24 kpc), their best-fitted relationship predicts W2796 ∼ 1.15 Å. On the contrary, to have W2796 > 3 Å, D should be less than 9.5 kpc for the host galaxy with M* close to the median value of the USMg ii host galaxies. While USMg ii absorbers are massive for a given impact parameter (as found for the general population of Mg ii absorbers), they do not follow the best-fitting relationship between W2796, D, and M⋆ obtained for the general Mg ii population. This could be related to any prevailing physical conditions specific to USMg ii absorbers or some of the high impact parameter USMg ii absorbers originating from more than one galaxy.
4.3.4 Dependence on rest frame B-band absolute magnitude
Next, we consider the rest-frame absolute B-band magnitudes of the USMg ii and the host galaxies in the MAGIICAT sample. The rest-frame absolute B-band magnitudes (MB) are obtained from the synthetic SED fitted spectra of the galaxies using the method described in Guha et al. (2022). The rest-frame B-band magnitude for the USMg ii host galaxies at z ∼ 0.7 ranges from −22.46 ≤ MB ≤ −20.27 with a median value of −21.23. Upon combining with our z ∼ 0.5 USMg ii host galaxies (Guha et al. 2022), the rest frame B-band magnitude ranges from −22.46 ≤ MB ≤ −19.05 with a median value of −20.85. For the MAGIICAT galaxies, MB ranges −22.56 ≤ MB ≤ −16.53 with a median value of −20.08. Column 7 of Table 3 provides the MB of the USMg ii host galaxies identified in this work. Note, as in the case of M⋆, MB measurements are possible only for 26 out of 36 host galaxies as there is the contamination of quasar light in the remaining cases.
In the right panel of Fig. 9, we show the scatter plot of MB relative to the B-band characteristic magnitude (|$M_B^\star$|, Faber et al. 2007) at the galaxy redshift versus D colour-coded according to the W2796. For the MAGIICAT host galaxies, just like for the stellar mass, we also find a correlation between host galaxy B-band absolute magnitude and D, which can be characterized by a linear fit of the form |$M_B-M_B^\star = (-0.037\pm 0.008)D\, (\text{kpc}) + (2.445\pm 0.302)$|. The solid black straight line corresponds to this fit, and the grey region associated 1σ uncertainty to the fit. It is evident from the figure that compared to the MAGIICAT host galaxies, for a given D, the USMg ii host galaxies tend to be brighter. This aligns with the findings of Chen et al. (2010); Huang et al. (2021), who reported that brighter galaxies produce stronger absorption for a given impact parameter. Like the MAGIICAT host galaxies, we find that |$M_B-M_B^\star$| of USMg ii host galaxies are also anticorrelated with D. A Spearman rank correlation analysis provides rS = −0.58 with p-value 0.002. A linear fit to the data for the USMg ii galaxies alone gives |$M_B-M_B^\star = (-0.028\pm 0.009)D \, (\text{kpc}) + (1.234 \pm 0.252)$|. The solid blue line in the left panel of Fig. 9 corresponds to this fit. At the median impact parameter for the USMgii host galaxies (i.e. D = 23 kpc), the host galaxies of the USMgii absorbers are ∼1 mag brighter than that of the host galaxies in the MAGIICAT sample.
Just like the stellar mass, for the MAGIICAT sample, we find that the anti-correlation is stronger for the quantity |$\rm D\, (kpc) -0.153(M_B + 20.08)$| and |$\rm W_{2796}$| compared to simple |$\rm W_{2796}-D$| anti-correlation. The correlation coefficient increases from rs = −0.37 (p-value ∼10−3) to rs = −0.49 (p-value ∼10−5). However, such a linear combination does not significantly alter the correlation coefficients for the USMgii host galaxies. If we use the relationship between W2796, D, and MB found by Huang et al. (2021) the expected W2796 is 1.17 Å when we use the median D and MB. Thus, even though the host galaxies of USMgii are bright at a given D compare to the host galaxies of normal Mg ii absorbers they do not follow the relationship between W2796, D, and MB obtained for the general Mg ii host galaxies.
4.3.5 W2796 versus normalized impact parameter
Churchill et al. (2013b) have suggested the scatter in the |$\rm {\it W}_{2796}-{\it D}$| plane is substantially reduced if one uses the normalized impact parameter (i.e. D scaled by the virial radius, Rvir) instead of D. In Fig. 10, we plot the W2796 versus the normalized impact parameter for both the MAGIICAT host galaxies (squares) and the USMg ii host galaxies (circle) from our sample. The halo masses for the MAGIICAT host galaxies are obtained from abundance matching techniques (Nielsen et al. 2013). In contrast, the halo masses for the USMgii galaxies are measured using the stellar mass to halo relations (see Sections 4.3.3 and 5.2 for details). Churchill et al. (2013b) found a strong anticorrelation between two quantities best characterized by a power law with a power-law index of ∼−2 (shown in the figure with an orange dashed line), albeit a large scatter. When we considered only the USMgii host galaxies, we found no significant anti-correlation (i.e. rs = −0.17 and p-value = 0.59). As the W2796 range probed by the USMg ii sample is narrow, we expect the scatter in the normalized impact parameter to be lower than that of D if the scaling works as in the case of MAGIICAT host galaxies. In the bottom panel of Fig. 10, we show the residual of log W2796 as a function of the normalized impact parameter. The deviation of USMg ii point from the best fit is consistent with the scatter seen for the general population of Mg ii absorbers.

Top panel: Scatter plot of |$\rm {\it W}_{2796}$| against the normalized impact parameter. Blue points correspond to the USMg ii absorbers from our survey and the red points correspond to the magiicat survey. The black dashed line shows the power law fit from Churchill et al. (2013b) with the shaded region corresponding to the 1σ uncertainty. Bottom panel: The difference between the observed |$\rm \log \, ({\it W}_{2796})$| and the best-fitting model for that normalized impact parameter.
4.3.6 Comparison of USMgii and DLAs
A large fraction of these USMg ii absorbers is expected to be DLAs and sub-DLAs (Rao, Turnshek & Nestor 2006; Nestor et al. 2007). It is also well known that for a given z, a strong correlation exists between N(H i) and W2796. Using the latest relationship between the two quantities found by Lan & Fukugita (2017) for the USMg ii systems, we find log N(H i) ≥ 20.20 at z ∼ 0.7. Therefore, it is most likely that the USMgii absorbers in our sample are either sub-DLAs or DLAs. It is also well known that DLAs and sub-DLAs show a significant anti-correlation between N(H i) and D (see e.g. Rao et al. 2011; Rahmani et al. 2016; Kulkarni et al. 2022).
Information on the impact parameter for these low-z DLA and the sub-DLA host galaxies are obtained from Rahmani et al. (2016), who compiled all the available DLAs and sub-DLAs at low-z from the literature. We obtained W2796 for each DLA and sub-DLA from the original references. The W2796 associated with the DLAs and the sub-DLAs varies from 0.2 Å to 3.11 Å with a median value of 1.67 Å. In the bottom panel of Fig. 5, we plot the W2796−D relationship for DLAs and sub-DLAs at 0.4 ≲ z ≲ 1.0. It is evident from Fig. 5 that DLAs and USMgii systems probe similar impact parameter ranges. The KS-test suggests no statistically significant difference between the two impact parameter distributions with a p-value of 0.32. It is clear from Fig. 5 that there is no correlation between W2796 and D even in the case of low-z DLAs and sub-DLAs. The rank correlation test provides the correlation coefficient of rs = −0.17 and p-value = 0.38. This is consistent with our finding that the anticorrelation weakens when we consider strong Mg ii absorbers. Interestingly, for the same DLA sample, the anticorrelation between N(H i) and D is also not statistically significant (with rs = −0.31 and p-value of 0.11 for the Spearman rank correlation test).
At high-z, some of the DLAs selected based on C i absorption and extremely strong DLAs tend to have W2796 > 3Å (see fig. 3 of Zou et al. 2018; Ranjan et al. 2022). Thus lack of USMgii systems among the low-z DLAs mainly identified through Mg ii based selection (where USMgii systems are a very rare population) is not very surprising. However, the lack of correlation between W2796 and D is consistent with our finding in Fig. 6. Discussions presented here clearly demonstrate how system selection influences the derived W2796 −D relationship.
5 DISCUSSION
5.1 Isolated galaxy versus a group of galaxies
There are indications that some of the strong Mg ii absorption systems are associated with multiple host galaxies in literature (e.g. Whiting, Webster & Francis 2006; Gauthier 2013). Gauthier (2013) have identified a z ∼ 0.5 galaxy group dominated by passive galaxies associated with a USMg ii absorption system and argued that such strong absorption are driven by cool intragroup gas rather than star-formation-driven outflows. Nielsen et al. (2022) have identified a compact galaxy group associated with a DLA, which is also a USMg ii system at z ∼ 2.4, using KCWI and argued the gas in absorption is related to star-formation driven outflows, accretion from the IGM, and the tidal streams due to the galaxy–galaxy interactions. Some of the deviations shown by USMg ii absorbers with respect to the relationships found for the general population of Mg ii absorbers could be explained if a good fraction of USMg ii absorbers is not originating from the CGM of individual galaxies.
Ideally, one requires IFU spectroscopic observations to identify the galaxies contributing to the USMg ii absorbers. In recent IFU studies, the only USMg ii system present in the MAGG survey (Dutta et al. 2020) and 3 in the sample of Schroetter et al. (2019) are found to be associated with isolated galaxies (no other host galaxy found within 100 kpc and velocity separations within 500 kms−1). In Guha et al. (2022), 33 per cent of USMg ii absorbers (i.e. 7 out of 21) have only one host galaxy (with mr < 23.6 mag) within an impact parameter of 100 kpc. In Table A2 of the Appendix, we list all the galaxies within a projected distance of 100 kpc at the redshift of the USMg ii absorption with mr < 23.6 (typical completeness of the DESI-LIS r-band images) studied in this work. As mentioned before, this sets the completeness of our survey up to ∼0.3L⋆ galaxies. Using photometric redshifts, we have found that up to a maximum impact parameter of 100 kpc, for four systems (i.e. along the line of sight to J0055−0100, J1336+0922, J1419+0346, and J2356−0406), there are no galaxies other than the confirmed USMg ii host seen in the DESI-LIS images. This gives about |$22^{+23}_{-13}$| per cent (95 per cent confidence Wilson score) of the USMg ii absorption systems originating from isolated galaxies. Therefore, in the combined sample, we have at least 29 per cent of the USMg ii systems associated with isolated host galaxies.
On the other hand, in the present sample, 5 out of 18 (|$28^{+23}_{-16}$| per cent) of the USMg ii absorbers are confirmed to be associated with multiple galaxies. In the combined sample, this fraction of USMg ii absorbers confirmed to be associated with more than one host galaxy is ≥21 per cent. Among the rest of the six USMg ii systems in the present sample, other than the confirmed USMg ii host galaxies, there is at least one galaxy with consistent photo-z within 100 kpc with mr < 24. However, we do not have the spectroscopic redshift of these galaxies, so they may or may not be related to the USMg ii absorption.
Next, we ask whether there is any difference between the Mg ii absorbers properties identified with a single galaxy or multiple galaxies in our sample. Table 5 gives the median values of different measured quantities of the two sub-samples and KS-statistics results (D and p-value). Median values of observed equivalent widths and equivalent width ratios are consistent within 20 per cent uncertainty. This is also reflected by the large p-values found for the KS test. We also find the median value of the inferred stellar mass (M⋆) of the two samples are almost same. The most significant difference we notice (i.e. by 80 per cent) is for the median value of the impact parameter. The median impact parameter is higher for the nearest galaxy of the USMg ii absorber for which more than one host galaxy is identified. Interestingly the difference is not statistically significant due to the small number of systems involved.
Comparison of properties of USMg ii absorbers associated with single and multiple host galaxies.
| Properties | D-value | p-value | Median | Median |
|---|---|---|---|---|
| (Isolated) | (Group) | |||
| W2796 | 0.31 | 0.62 | 3.44 | 3.71 |
| W2600 | 0.30 | 0.72 | 2.22 | 2.60 |
| W2796/W2803 | 0.47 | 0.17 | 1.07 | 1.11 |
| W2852/W2796 | 0.41 | 0.33 | 0.30 | 0.23 |
| D | 0.38 | 0.38 | 15 | 27.2 |
| |$\rm {\log \, (M_\star /M_\odot)}$| | 0.20 | 1.0 | 10.47 | 10.48 |
5.2 Line-of-sight velocity of the absorbing gas
Next, we discuss the rest-frame line of sight velocity offset of the absorbing gas with respect to the host galaxies and the fate of the absorbing gas: whether it can escape the host galaxy or is bound to it. In Fig. 11, we show the rest-frame line of sight velocity offset of the Mg ii absorbing gas with respect to the Mg ii host galaxies. The rest-frame velocity offsets are calculated using ΔVlos = c(zabs − zem)/(1 + zem), where zabs and zem are absorption and emission redshifts obtained from the Mg ii absorption towards the quasar line of sights and [O ii] nebular emissions of the Mg ii host galaxies respectively. c denotes the speed of light. The typical error in this offset measurement is 100 km s−1. The blue histogram corresponds to the USMg ii host galaxies, whereas the orange histogram corresponds to the GOTOQs. The blue and orange dashed lines correspond to the Gaussian fit of the blue and orange histograms. The line-of-sight velocity offset for the USMg ii absorbers is centred around |$\mu \sim 14\, {\rm km\,s}^{-1}$| with a standard deviations of about |$\sigma \sim 87\, {\rm km\,s}^{-1}$|, whereas for the GOTOQs the centre is at |$\mu \sim -40\, kms^{-1}$| with a standard deviation of |$\sigma \sim 88\,\rm km\,s^{-1}$|. The most important thing to notice is that the width of the ΔVlos distribution is very similar for the USMgii host galaxies and the GOTOQs. Considering the isolated host galaxies in our sample (discussed above), we find μ = 48 km s−1 and σ = 78 km s−1. The same is for the nearest galaxy where the absorber can be associated with more than one galaxy, and we find μ = 17 km s−1and σ = 147 km s−1. The σ being large in the case of absorbers associated with multiple galaxies found here is consistent with the results of (Huang et al. 2021).

Distribution of the rest frame line-of-sight velocity offset of the Mg ii absorbing gas with respect to the Mg ii host galaxies. The blue histogram corresponds to the USMg ii host galaxies, whereas the orange histogram corresponds to the GOTOQs. The blue and orange dashed lines correspond to the Gaussian fits to the blue and orange histograms, respectively.
Next, we investigate whether or not the absorbing gas is gravitationally bound to the USMg ii host galaxies. In Fig. 12, we plot the line of sight velocity offset of the USMg ii absorbing gas with respect to the USMg ii host galaxies against the halo masses of the USMg ii host galaxies colour-coded according to the W2796. The dashed and the dot-dashed lines show the escape velocity for a given halo mass at the impact parameters of 20 and 40 kpc calculated using an NFW profile (Navarro, Frenk & White 1997), respectively. The halo masses are obtained from the stellar mass to halo mass relations at the host galaxy redshifts (Girelli et al. 2020). Note that this relation has a typical uncertainty of 0.2 dex. As seen from Fig. 12, the line-of-sight velocity offset of absorbing gas is insufficient to escape the halo’s gravitational potential. Even if we correct for the three-dimensional velocity components by multiplying ΔVlos with a factor of |$\sqrt{3}$|, all the points are still consistent within 1σ with the absorbing gas to be bound to the host galaxies.

Line of sight velocity offset of the USMg ii absorbing gas with respect to the USMg ii host galaxies is plotted against the halo masses of the USMg ii host galaxies and colour-coded according to the W2796, respectively, correspond to the low- and high-redshift USMg ii absorbers from our sample. Circular and diamond points The dashed and dot–dashed lines show the escape velocity for a given halo mass at the impact parameters of 20 and 40 kpc, respectively.
Given the large velocity spread in absorption, it is difficult to imagine that all the gas responsible for the USMgii absorption will be confined to the host galaxy. For a simple saturated absorption, we expect the USMg ii absorption to spread over more than 300 km s−1. However, from fig. 10 of Ranjan et al. (2022), we can see that the velocity spread can be anywhere between 300 to 700 km s−1 when W2796 > 3Å. Therefore, high-resolution spectroscopic data are required to directly quantify the fraction of absorbing gas that can be bound to the host galaxy.
5.3 The nature of USMg ii host galaxies
Our results indicate that for a given impact parameter USMg ii galaxies tend to be more massive and brighter in the B-band compared to the host galaxies of absorbers with low W2796. It is also known that W2796 is primarily driven by the total number of such clumps along the line of sight (Petitjean & Bergeron 1990; Churchill et al. 2020) and velocity dispersion between them rather than the Mg ii column density. The requirement of large velocity widths for the USMg ii can come from (i) large-scale bi-conical outflow; (ii) gaseous in the CGM under the influence of the large gravitational potential of a massive galaxy; or (iii) as discussed above, large velocity widths can originate from gas in the interacting system of galaxies.
Recent high-resolution TNG50 cosmological simulations by DeFelippis et al. (2021) also found that more massive halos produce stronger and broader Mg ii absorption. However, the USMgii absorbers are extremely rare in these simulations. High mass halos producing stronger Mg ii absorption is also suggested by various authors in the literature (e.g. Lan, Ménard & Zhu 2014; Dutta et al. 2020; Anand, Nelson & Kauffmann 2021) while studying relatively low W2796 systems compared to USMgii systems. However, we find that the USMg ii systems do not follow the best fit relationship between W2796, D and M⋆, and/or MB (see e.g. Huang et al. 2021) followed by low W2796 absorbers. We require high spectral resolution data to address the origin of this difference. Also, knowing what fraction of the USMg ii absorbers originate from more than one host galaxy (using IFU spectroscopy) will help understand this issue.
Our results also indicate that the SFR in the USMg ii host galaxies is slightly lower than that of the main sequence galaxies at the same redshift having the same stellar mass. Even when one accounts for the possible bias in the SFR estimations it is clear that USMg ii host galaxies will, at best, follow the main sequence. Similar trend is found for the massive Mg ii host galaxies (|$\rm M_\star \geqslant 10^{10} \, M_\odot$|) in the MEGAFLOW survey (Schroetter et al. 2019). Rhodin et al. (2018) also found that the massive galaxies producing DLAs and sub-DLAs at z ∼ 0.7 also have significantly smaller ongoing SFRs compared to main-sequence galaxies of the same mass. Anand, Nelson & Kauffmann (2021) found that the covering fractions for strong Mg ii absorption (|$\rm W_{2796} \geqslant 2$| Å) within D ∼ 30 kpc is similar for both the star-forming and the passive galaxies. This could be related to the fact that these galaxies have been through a phase of rapid star formation and consequently became massive. The star-formation-driven outflows enrich the CGM while the star-formation-driven feedback starts quenching the galaxies, and hence the ongoing SFR drops below the main sequence. Another contributing factor to the suppression of the SFRs could be galaxy-galaxy interactions. If a significant fraction of the USMg ii host galaxies live in a group environment, the motion of these galaxies through the intra-group medium may cause the gas in the galactic discs to be stripped away, shock heated, and turbulent which henceforth further reduced star formation activity.
6 SUMMARY and CONCLUSIONS
In this work, we extend our previous study (Guha et al. 2022) of USMg ii absorbers to a slightly higher redshift range (i.e. 0.6 ≤ z ≤ 0.8). From an input sample of 151 USMg ii systems observed in the SDSS-DR12 (Zhu & Ménard 2013) in the above-mentioned redshift range, we identified 27 secured USMg ii systems. We carried out long-slit observations with SALT to identify the host galaxies. This, combined with the sample presented in Guha et al. (2022), constitutes the most extensive sample of USMg ii systems studied to date. Our main findings are summarized below:
Among the 27 USMg ii systems in the present sample, SALT observations could be completed for 25 systems. Based on the [O ii] emission or the Ca ii absorption present in the spectra, we have successfully identified the host galaxies for the 18 USMg ii systems. For five of the USMg ii systems, we have identified more than one host galaxy associated with the USMg ii absorption. The impact parameters of the spectroscopically confirmed USMg ii host galaxies range from 6.24 to 120.7 kpc (see Table 3).
Inclusion of USMg ii data points to the measurements available in the literature increases the scatter in the well-known anticorrelation between W2796 and D (see Fig. 4). When we consider only the USMg ii data points, we do not find any significant correlation between W2796 and D (see Fig. 5). We find that the best-fit value of W2796(D = 0) is higher than the measurement previously quoted in the literature. We also find that the significance of anticorrelation between W2796 and D depends on how the sample is defined. If one defines a sample with a higher W2796 threshold there is no trend evident between W2796 and D (see Fig. 6). Similarly we notice that low-z DLAs do not show any anticorrelation between W2796 and D.
We find for a given impact parameter, the USMg ii host galaxies are brighter and more massive compared to the low equivalent width Mg ii absorbers. Such a mass dependence is also seen among the non-USMg ii absorbers. However, we find the USMg ii absorbers not to follow the relationship between W2796, D, and M⋆ (or MB) found for the general population of Mg ii absorbers (see Fig. 9).
Although USMg ii absorbers do not follow the canonical W2796−D anticorrelations, they seem to follow the W2796−D/Rvir anticorrelation. The scatter seen for the USMg ii around the global best-fit solution is similar to the scatter seen for the low equivalent width Mg ii absorbers. This once again indicates more gaseous content in massive galaxies (see Fig. 10).
We find that parameters α and β that fit the W2796−D anticorrelation does not evolve significantly with redshift over the redshift range 0 < z ≲ 1.5 (see Fig. 4). However, even small differences in α can lead to large differences in W2796 at high D. For D > 20 kpc, the fits are consistent with the W2796 at higher redshift being higher for a given impact parameter. Using a simple model, we argue that major evolution in dn/dz of the Mg ii absorbers can come from the evolution of the galaxy luminosity function. The differential evolution seen between high and low equivalent width systems will require a covering factor as a function of D to evolve with time, as found by Lan, Ménard & Zhu (2014).
Majority of the USMg ii host galaxies are detected based on their [O ii] emissions, which indicates that they are all star-forming galaxies. However, in the SFR–M⋆ plane, USMg ii host galaxies fall slightly below the main sequence galaxies. We, therefore, infer that the USMg ii host galaxies are likely to be post-starburst galaxies transitioning slowly from the main sequence to the quenched galaxies (see Fig. 3).
Based on the line of sight velocity differences between the absorbing gas and the host galaxies, we find that the overall USMg ii absorbing gas is bound to the host galaxies. However, we expect the velocity width of the Mg ii absorption to be very large. Most likely, some of the absorbing gas components may have excess velocities outside the escape velocity predicted based on the M⋆–Mh relationship. The spectral resolution of our spectra does not allow us to quantify the fraction of gas in each USMg ii absorber that is bound to the galaxy. For this, we need higher-resolution spectra (see Fig. 12).
In our combined USMgii sample, at least 28 per cent of the absorbers are associated with a single isolated galaxy. No other galaxy with correct spectroscopic or photometric redshift having mr < 23.6 is found. Similarly, in the ∼21 per cent case, we have identified more than two host galaxies within an impact parameter of 100 kpc. In the remaining 50 per cent cases, our spectroscopic observations are not available for potential candidate host galaxies at 50 ≤ D (kpc) ≤ 100. Completing spectroscopic observations of some of these galaxies will be important to quantify the origin of large velocity fields in USMg ii absorbers.
ACKNOWLEDGEMENTS
This project makes use of the following softwares: numpy (Harris et al. 2020), scipy (Virtanen et al. 2020), matplotlib (Hunter 2007), astropy (Astropy Collaboration 2013, 2018), and ultranest (Buchner 2021).
All the new observations reported in this paper were obtained with the Southern African Large Telescope (SALT).
PPJ thanks Camille Noûs (Laboratoire Cogitamus) for inappreciable and often unnoticed discussions, advice, and support. PPJ is partly supported by the Agence Nationale de la Recherche under contract HZ-3D-MAP, ANR-22-CE31-0009.
This paper makes use of SDSS observational data. Funding for the SDSS-IV has been provided by the Alfred P. Sloan Foundation, the U.S. Department of Energy Office of Science, and the Participating Institutions. SDSS-IV acknowledges support and resources from the Center for High-Performance Computing at the University of Utah. The SDSS website is www.sdss.org. SDSS-IV is managed by the Astrophysical Research Consortium for the Participating Institutions of the SDSS Collaboration, including the Brazilian Participation Group, the Carnegie Institution for Science, Carnegie Mellon University, Center for Astrophysics| Harvard & Smithsonian, the Chilean Participation Group, the French Participation Group, Instituto de Astrofísica de Canarias, The Johns Hopkins University, Kavli Institute for the Physics and Mathematics of the Universe (IPMU)/University of Tokyo, the Korean Participation Group, Lawrence Berkeley National Laboratory, Leibniz Institut für Astrophysik Potsdam (AIP), Max-Planck-Institut für Astronomie (MPIA Heidelberg), Max-Planck-Institut für Astrophysik (MPA Garching), Max-Planck-Institut für Extraterrestrische Physik (MPE), National Astronomical Observatories of China, New Mexico State University, New York University, University of Notre Dame, Observatário Nacional/MCTI, The Ohio State University, Pennsylvania State University, Shanghai Astronomical Observatory, United Kingdom Participation Group, niversidad Nacional Autónoma de México, University of Arizona, University of Colorado Boulder, University of Oxford, University of Portsmouth, University of Utah, University of Virginia, University of Washington, University of Wisconsin, Vanderbilt University, and Yale University.
The DESI Legacy Imaging Surveys consist of three individual and complementary projects: the Dark Energy Camera Legacy Survey (DECaLS), the Beijing-Arizona Sky Survey (BASS), and the Mayall z-band Legacy Survey (MzLS). DECaLS, BASS, and MzLS together include data obtained, respectively, at the Blanco telescope, Cerro Tololo Inter-American Observatory, NSF’s NOIRLab; the Bok telescope, Steward Observatory, University of Arizona; and the Mayall telescope, Kitt Peak National Observatory, NOIRLab. NOIRLab is operated by the Association of Universities for Research in Astronomy (AURA) under a cooperative agreement with the National Science Foundation. Pipeline processing and analyses of the data were supported by NOIRLab and the Lawrence Berkeley National Laboratory (LBNL). Legacy Surveys also uses data products from the Near-Earth Object Wide-field Infrared Survey Explorer (NEOWISE), a project of the Jet Propulsion Laboratory/California Institute of Technology, funded by the National Aeronautics and Space Administration. Legacy Surveys was supported by: the Director, Office of Science, Office of High Energy Physics of the U.S. Department of Energy; the National Energy Research Scientific Computing Center, a DOE Office of Science User Facility; the U.S. National Science Foundation, Division of Astronomical Sciences; the National Astronomical Observatories of China, the Chinese Academy of Sciences and the Chinese National Natural Science Foundation. LBNL is managed by the Regents of the University of California under contract to the U.S. Department of Energy. The complete acknowledgments can be found at https://www.legacysurvey.org/acknowledgment/. The Photometric Redshifts for the Legacy Surveys (PRLS) catalogue used in this paper was produced thanks to funding from the U.S. Department of Energy Office of Science, Office of High Energy Physics via grant DE-SC0007914.
DATA AVAILABILITY
Data used in this work are obtained using SALT. Raw data will become available for public use 1.5 yr after the observing date at https://ssda.saao.ac.za/.
