


ABSTRACT
We present six epochs of optical spectropolarimetry of the Type IIP supernova (SN) 2021yja ranging from ∼25 to 95 d after the explosion. An unusually high continuum linear polarization of |$p \approx 0.9~{{\ \rm per\ cent}}$| is measured during the early photospheric phase, followed by a steady decrease well before the onset of the nebular phase. This behaviour has not been observed before in Type IIP supernovae (SNe IIP). The observed continuum polarization angle does not change significantly during the photospheric phase. We find a pronounced axis of symmetry in the global ejecta that is shared in common with the Hα and Ca ii near-infrared triplet lines. These observations are consistent with an ellipsoidal geometry. The temporal evolution of the continuum polarization is also compatible with the SN ejecta interacting with aspherical circumstellar matter (CSM), although no spectroscopic features that may be associated with strong interaction can be identified. Alternatively, we consider the source of the high polarization to be an extended hydrogen envelope that is indistinguishable from low-density CSM.
1 INTRODUCTION
It is widely accepted that the core collapse of a star with zero-age main-sequence (ZAMS) mass |$\gtrsim 8\, {\rm M}_{\odot }$| produces hydrogen-rich Type II and a subset of hydrogen-poor Type I (Ib/Ic; stripped-envelope) supernovae (SNe). Although most of these stars explode as SNe, some models predict direct collapse to a black hole in certain progenitor mass ranges (Sukhbold et al. 2016; Byrne & Fraser 2022). SNe II are also distinguished by their light-curve shape; an SN II with a linearly (in magnitudes) declining light curve is designated as IIL, whereas an SN II with an extended plateau lasting ∼90 d after explosion is classified as IIP; see Filippenko (1997) and Gal-Yam (2017) for reviews of SN classification. However, the distinction between SNe IIP and IIL is not clear, with some works suggesting that these subtypes instead constitute a continuum (Anderson et al. 2014; Valenti et al. 2016).
The process that drives the explosions of core-collapse supernovae (CCSNe) also remains unclear. One of the most promising models is a neutrino-driven mechanism (Bethe & Wilson 1985; Janka 2012). However, numerical simulations based on this mechanism fail to reproduce the energies observed in CCSNe (Melson et al. 2015). The discrepancy between the simulated and the observed energies in CCSNe could be reconciled by an enhancement of the neutrino heating efficiency caused by multidimensional hydrodynamic instabilities. Possible sources include convective motion, standing-accretion-shock instability (SASI, Blondin, Mezzacappa & DeMarino 2003; Marek & Janka 2009), and Rayleigh–Taylor instability (Kifonidis et al. 2003). In the case of SNe II, such instabilities may introduce inhomogeneities in the core-collapse process and at the interface between the inner ejecta and the hydrogen envelope. Additional instabilities may be induced by effects of general relativity, rotation, and magnetohydrodynamics near and around the core (LeBlanc & Wilson 1970). On the other hand, a jet-driven bipolar explosion model has also been invoked to explain the observed energies and asphericities in SNe II (Khokhlov et al. 1999; Wang et al. 2002; Chugai 2006; Maund et al. 2007; Couch, Wheeler & Milosavljević 2009; Papish, Nordhaus & Soker 2015; Mauerhan et al. 2017). It is conceivable that the explosion process may involve a combination of these two models. In order to test these hypotheses, methods have been developed to study the internal structure of SNe and characterise the inhomogeneities of their ejecta.
Spectropolarimetry, which involves counting polarized photons at different wavelengths, is an extremely useful probe of the geometric properties of SN ejecta and the degree of chemical asphericity without spatially resolving the source. Furthermore, polarization measured across prominent spectral lines can characterize the distribution of individual elements within the ejecta (see Section 3.4 for discussion). Reviews of polarimetric studies of SNe include Wang & Wheeler (2008), Branch & Wheeler (2017), and Patat (2017). The general principle behind this method is as follows. Polarized photons are produced via Thomson scattering in SN atmospheres. The electric field of the scattered photon is perpendicular to the plane of scattering. Any deviation from spherical symmetry would result in an incomplete cancellation of the electric-field vectors (‘E-vectors’). Since the SN is observed as a point source and the light hitting a detector is an integration of all the E-vectors, this asphericity would result in a net polarization that is always greater than zero.
Early studies of SNe IIP showed characteristically low polarization during the photospheric phase (Leonard et al. 2001, 2006; Chornock et al. 2010). During the photospheric (or the light-curve plateau) phase, the outer H-rich envelope, which exhibits a high electron-scattering opacity, re-emits the thermal energy deposited by the SN shock through a recombination process. Therefore, polarimetry of SNe IIP during the plateau phase measures the geometry of the electron-scattering atmosphere as it recedes inward through the H-rich envelope. Asymmetries in the inner core are not visible at this phase owing to the high electron-scattering opacity in the envelope.
As the SN expands and cools adiabatically, the photosphere recedes deeper into the stratified ejecta. This allows one to peer into the different layers of the explosion as time progresses. The observed level of polarization as a function of wavelength can be used to infer the degree of inhomogeneities and/or asymmetries in the ejecta (see e.g. Tanaka et al. 2012, 2017). In particular, a wavelength-independent continuum polarization is most likely to be produced by Thomson scattering of free electrons that deviate from a spherically symmetric distribution. It may also be caused by the presence of energy sources that are offset from the kinematic centre of the explosion (Chugai 1992; Hoeflich, Khokhlov & Wheeler 1995; Kasen et al. 2003; Höflich et al. 2006). Polarization signals across spectral lines can be understood by uneven blocking of the photosphere by the associated line opacity, and by its frequency variations in the thermalization depth (Höflich et al. 2023), tracing the distribution of elements in the SN ejecta. Therefore, time-series spectropolarimetry can tomographically measure the degree of asphericity from the outer to inner layers of the SN ejecta. The geometry of the inner core is dependent on the degree of instabilities in the SN explosion, further placing constraints on the explosion mechanisms discussed above.
Previous spectropolarimetric studies of SNe IIP such as SNe 2004dj, 2006my, 2006ov, and 2007aa show evidence for the emergence of an aspherical core following the photospheric phase (Leonard et al. 2006; Chornock et al. 2010). In contrast to the generally seen low continuum polarization intrinsic to SNe IIP, a few notable exceptions include the Type IIP/L SN 2013ej (Mauerhan et al. 2017; Nagao et al. 2021), which displayed a significant continuum polarization at the earliest epochs, and SN 2017gmr (Nagao et al. 2019), which exhibited a steep rise in polarization as early as 30 d before the plateau drop-off. Another peculiar case was observed for SN 2017ahn (Nagao et al. 2021), where the low continuum polarization during the photospheric phase persisted well into the nebular phase. The sample of SNe IIP for which there have been spectropolarimetric measurements remains small, despite being the most commonly observed type of SNe. This work is part of an effort to obtain high-quality data for nearby CCSNe with low interstellar polarization (ISP) contamination.
SN 2021yja was discovered on 2021 September 8 at 13:12:00 (UTC dates are used throughout this paper) in the spiral galaxy NGC 1325 (Smith et al. 2021) by the Asteroid Terrestrial-impact Last Alert System (Tonry et al. 2018). A redshift of z = 0.005307 reported by Springob et al. (2005) was used to correct for the redshift of the host galaxy. We adopt the time of explosion (texp) to be 2021 September 7.5, as estimated by Vasylyev et al. (2022), which is roughly the mid-point between the last non-detection on 2021 September 6.48 and the first detection on 2021 September 8.55. All phases will be given in days relative to this date throughout the paper. Previous photometric and spectroscopic studies of SN 2021yja have found weak mass loss from the progenitor star and little evidence of the presence of dense circumstellar matter (CSM; Hosseinzadeh et al. 2022; Vasylyev et al. 2022).
SN 2021yja was observed to have a relatively long plateau phase (∼140 d), which can be explained by a hydrogen-envelope mass of |$\ge 5\, {\rm M}_{\odot }$| (Hosseinzadeh et al. 2022). There are some signatures of CSM interaction, including X-ray and radio emission (Alsaberi et al. 2021; Ryder et al. 2021), an early-time optical flux excess, and a short rise time (see Kozyreva et al. 2022), but we do not expect a significant contribution to the polarization signal through free electron scattering in the low-density CSM. We note that Kozyreva et al. (2022) suggest that the progenitor of SN 2021yja likely possessed a convective envelope. Following a radiative-transfer hydrodynamical modelling procedure as discussed by Kozyreva, Nakar & Waldman (2019), this convective red supergiant envelope may build up a pre-existing CSM of 0.55 M⊙ at a radius r ≈ 2 × 1014 cm (or |$\sim 2700\, \mathrm{ R}_{\odot }$|). The progenitor star’s initial mass was constrained to be |$\sim 15\, {\rm M}_{\odot }$| and have a pre-explosion radius of |$\sim 630\, \mathrm{ R}_{\odot }$| (Kozyreva et al. 2022). The 56Ni mass produced in the explosion was estimated to be |$\sim 0.12\, {\rm M}_{\odot }$| by Hosseinzadeh et al. (2022) and Vasylyev et al. (2022), which is more than 1σ above the typical value |$\sim 0.044\, {\rm M}_{\odot }$| for SNe II (Anderson 2019). The explosion energy was determined to be (1–3) × 1051 erg using photospheric-velocity values from radiative-transfer modelling (Vasylyev et al. 2022). We note a discrepancy between the velocity measurements in the aforementioned work and that of Hosseinzadeh et al. (2022), who determine a lower value using the blueshift of the Fe ii absorption minimum.
This paper is organized as follows. In Section 2, we present the summary of our spectropolarimetric observations and discuss systematic errors associated with instrumentation and contamination from ISP. We calculate the continuum linear polarization and polarization angle (PA) in Section 3, discuss the uniqueness of SN 2021yja among the population of SNe II with spectropolarimetric observations, and interpret the geometry of the SN ejecta. A brief summary of the study is given in Section 4. With this work, we aim to signal a paradigm shift from considering SNe II as a homogeneous population to instead recognizing the wide range of possible geometries needed to explain the emerging diversity in spectropolarimetric observations.
2 SUMMARY OF OBSERVATIONS AND DATA ANALYSIS
2.1 VLT spectropolarimetry
We obtained one epoch of spectropolarimetry of SN 2021yja using the FOcal Reducer and low-dispersion Spectrograph 2 (FORS2; Appenzeller et al. 1998) on the Unit Telescope 1 (Antu) of the ESO Very Large Telescope (VLT). Observations were made in the Polarimetric Multi-Object Spectroscopy (PMOS) mode on 2021 October 02, corresponding to ∼25 d after the estimated time of the explosion. Grism 300V and a 1-arcsec-wide slit were adopted, resulting in a spectral resolving power of R ≈ 440, corresponding to the size of a resolution element of 13 Å at a central wavelength of 5849 Å (see e.g. Anderson 2018). The slit was aligned with the north celestial meridian considering all observations were carried out at small airmass (≲ 1.2, see Table 1). Given the presence of a linear atmospheric dispersion compensator (Avila, Rupprecht & Beckers 1997), we consider the small misalignment between the slit and the parallactic angle (Filippenko 1982) to have a negligible effect on the observed spectral energy distribution.
Journal of spectropolarimetric observations of SN 2021yja.
| UT date | MJDb | Phasea | Instrument | Airmass range | Avg. seeing | Exposure timec |
|---|---|---|---|---|---|---|
| (MM-DD-YYYY) | (d) | (arcsec) | (s) | |||
| 10-02-2021 | 59489.20 | 25 | VLT/FORS2 | 1.24–1.05 | 1.06–0.74 | 300 × 4 × 3 |
| 10-07-2021 | 59494.46 | 30 | Kast | 2.0–2.2 | 2 | 600 × 4 × 1 |
| 10-15-2021 | 59502.48 | 38 | Kast | 2.0–2.1 | 2 | 600 × 4 × 3 |
| 11-03-2021 | 59521.45 | 57 | Kast | 1.98–2.07 | 1.2 | 600 × 4 × 3 |
| 11-12-2021 | 59530.28 | 66 | Kast | 1.98–2.07 | 1.2 | 600 × 4 × 3 |
| 12-11-2021 | 59559.24 | 95 | Kast | 1.9–2.2 | 1.3 | 600 × 4 × 3 |
Notes.aDays after the estimated time of explosion on MJD 59 464 (2021 September 7).
bMJD is given as the start time of the CCD exposure.
cExposure time of a single exposure × 4 retarder-plate angles × number of loops. Wavelength ranges for Kast and VLT/FORS2 are 4570–9800 and 3500–9100 Å, respectively.
The VLT spectropolarimetric observation consisted of four exposures each with the half-wave retarder plate positioned at angles of 0°, 45°, 22.5°, and 67.5°. The total 900 s × 4 retarder-plate angles integration was split into three sets of 300 s exposures to reduce the impact of cosmic rays. After bias subtraction and flat-field corrections, the ordinary (o) and extraordinary (e) beams were extracted following standard routines within iraf.1 Wavelength calibration was done separately for the o-ray and e-ray in each individual frame with root-mean-square (RMS) accuracy better than ∼0.2 Å. Each beam has been flux-calibrated using the flux standard star EGGR 141 observed at an airmass of 1.0 the following night, with the identical polarimetry optics used to observe SN 2021yja in place and at the half-wave plate angle 0°.
Stokes parameters, bias-corrected polarization degrees, and associated uncertainties were computed with our own routines following the procedures of Patat & Romaniello (2006) and Maund et al. (2007). The instrumental polarization of FORS2/PMOS (≲ 0.1 per cent) was further corrected following Cikota et al. (2017). Details of the reduction of FORS spectropolarimetry can be found in the FORS2 Spectropolarimetry Cookbook and Reflex Tutorial.2, Cikota et al. (2017), and in appendix A of Yang et al. (2020). A test of the precision and stability of the FORS2 instrument for spectropolarimetry is conducted in Appendix A of this paper.
2.2 Kast spectropolarimetry and Lick photometry
Spectropolarimetry of SN 2021yja was obtained using the polarimetry mode of the Kast Double Spectrograph on the Shane 3 m telescope at Lick Observatory (Miller, Robinson & Goodrich 1988; Miller & Stone 1994). The Kast spectropolarimetry sequence of SN 2021yja contains five epochs of observations that span days 30–95 after the explosion. Observations and data reduction were carried out following the description provided by Patra et al. (2021). Telluric lines were removed through comparison with the flux spectrum of a standard star. The 300 lines mm−1 grating and the 3-arcsec-wide slit were adopted, resulting in a spectral resolving power of R ≈ 380, corresponding to the size of a resolution element of 18 Å at a central wavelength of 6800 Å. A log of the VLT and Kast spectropolarimetry of SN 2021yja is presented in Table 1.
In order to characterize the instrumental polarization, nightly observations of the low-polarization standard star HD 212311 were carried out with the same polarimetry optics used to observe SN 2021yja. The average normalized Stokes q and u values3 over all epochs were measured to be |$\lt 0.05~{{\ \rm per\ cent}}$|, thus confirming negligible instrumental polarization and long-term stability of the Kast spectropolarimeter.
Follow-up photometry of SN 2021yja was performed by the 0.76 m Katzman Automatic Imaging Telescope (KAIT) as part of the Lick Observatory Supernova Search (LOSS, Filippenko et al. 2001), as well as the 1 m Nickel telescope at Lick Observatory (Mauerhan et al. 2017). BVRI-band light curves from these observations are presented by Vasylyev et al. (2022).
2.3 Interstellar polarization
The polarization that is intrinsic to the explosion of SN 2021yja could be contaminated by the polarization caused by interstellar aspherical dust grains along the SN-Earth line of sight. In particular, such an ISP can be induced by the dichroic extinction owing to non-spherical paramagnetic dust grains which are partially aligned by a large-scale magnetic field. Therefore, the level of such ISP needs to be estimated in order to isolate the intrinsic polarization of SN 2021yja. In the case of this study, several observational properties suggest a low level of ISP toward SN 2021yja.
First, the reddening caused by Galactic dust toward the SN 2021yja line of sight can be estimated as E(B − V) = 0.02 mag using the NASA/IPAC NED Galactic Extinction Calculator based on the RV = 3.1 reddening law and the extinction map from Schlafly & Finkbeiner (2011). According to the empirical upper limit of polarization induced by the dichroic extinction of interstellar dust grains, pISP < 9 × E(B − V) per cent, we estimate the ISP contributed by the Galactic dust to be |$p_{\rm MW}^{\rm ISP}\lesssim 0.18\,\mathrm{ per\,cent}$| (Serkowski, Mathewson & Ford 1975). Although the ISP within the host galaxy of SN 2021yja remains unclear, we can still estimate the total line-of-sight ISP from the emission component of the strong P Cygni profile of the Balmer lines. We follow a common assumption made in spectroplarimetric studies where the central region of the Hα emission is taken to be intrinsically unpolarized in the absence of a strong magnetic field (Howell et al. 2001; Wang et al. 2004; Chornock et al. 2006; Reilly et al. 2017; Nagao et al. 2019). In reality, the emitted photons are dominated by resonant line scattering which is not a completely depolarizing process (McCall 1984; Jeffery 1989). However, collisions between atoms in the ejecta lead to a loss of geometric information from the incoming photons (Jeffery 1991). Although Hα is not considered a resonance line as it does not arise from ground state, similar depolarizing effects should occur in this transition. The minimum level of polarization across the Hα emission reaches 0.046 per cent ± 0.042 per cent and 0.047 per cent ± 0.039 per cent as measured from 25 and 30 Å binned VLT spectra at day 25, respectively, which are all roughly consistent with zero within their 1σ uncertainties. This measurement is repeated for all other epochs, verifying that the minimum polarization is consistent with zero over a broad time-scale. Therefore, we assume that the ISP toward SN 2021yja is negligible.
3 SPECTROPOLARIMETRY
In the following subsections, we present the VLT and Kast spectropolarimetry of SN 2021yja obtained during six epochs that span days +25 to +95. First, we focus on the peculiar, high level of continuum polarization at early photospheric phases. Second, we compare the intrinsic polarization properties of SN 2021yja with a sample of Type IIP SNe that have multi-epoch polarimetry measurements. Next, we discuss the effects on the observed polarization by an additional heating source. Finally, we conduct a detailed investigation of the polarization profile across the Hα line and a possible late-time rise of the polarization of the Ca ii near-infrared (NIR) triplet (air wavelengths 8498.02, 8542.09, and 8662.14 Å, with ∼8570 Å chosen as the central wavelength, hereafter denoted as Ca ii NIR3) polarization.
3.1 High continuum polarization
The continuum polarization during the recombination phase of SNe IIP has been shown to be relatively low, up to only a few tenths of a per cent in the first 3 months after explosion (Leonard et al. 2001, 2006; Chornock et al. 2010). However, there has been increasing evidence for diversity in photospheric-phase polarimetry of SNe IIP (e.g. SNe 2012aw, 2017ahn, and 2017gmr, Nagao et al. 2019, 2021; Dessart, Hillier & Leonard 2021a.) In general, the low continuum polarization can be explained by a large opaque, nearly spherical hydrogen envelope that absorbs and reprocesses any light emanating from an aspherical core. Following the photospheric phase, when their optical brightness falls off from the plateau (Eastman et al. 1994), SNe IIP have shown significant continuum polarization. Leonard et al. (2006) suggest that this is the result of the recombination front receding into the deeper He-rich layers of the ejecta revealing an aspherical core.
Chugai (2006) proposes that the rapid rise in polarization at the beginning of the nebular phase originates from uneven ionization by 56Ni plumes in the core. Dessart & Hillier (2011) argue that this rise is linked to the ejecta becoming optically thin. This behaviour was explained in great detail for Type IIP SN 2004dj, which showed negligible continuum polarization (p ≤ 0.1 per cent) until a sudden rise to ∼0.6 per cent at ∼91 d after the explosion (Leonard et al. 2006).
The rapid rise in polarization was coincident with the steepest decline of the V-band magnitude and has been suggested to be the result of an emerging aspherical core. Thereafter, the continuum polarization of SN 2004dj declined following a t−2 law owing to the expansion of the ejecta and hence a decreasing optical depth.
In this section, we discuss the temporal evolution of the continuum polarization measured during the photospheric phase of SN 2021yja. We calculate the degree of linear polarization (p) and PA as a function of wavelength for the first epoch of VLT FORS2 and five subsequent epochs of Lick/Kast spectropolarimetry for SN 2021yja. We also estimate the continuum polarization for the first three months after the SN explosion. In this work, we compute the continuum polarization based on the 1σ-error-weighted mean Stokes parameters over the spectral regions 6800–7200 and 7820–8140 Å. These wavelength ranges are selected based on the rationale presented by Chornock et al. (2010). Both ranges are free of prominent and strongly polarized spectral features such as Hα, O i λ7774, and Ca ii NIR3. The choice also allows a direct comparison between SN 2021yja and previous works (Chornock et al. 2010; Mauerhan et al. 2017; Nagao et al. 2021). The uncertainty of the ISP was not included, considering its negligible contribution to the overall polarization (see Section 2.3). The estimated levels of continuum polarization have also been corrected for bias arising from p being a positive-definite quantity following Patat & Romaniello (2006) and Maund et al. (2007).
The continuum polarization and associated PA measured from the VLT epoch-1 observation on day 25 (Figs 1 and 2) are consistent with that of the Kast epoch-2 spectropolarimetry on day 30 (Fig. 3). (Fig. 2 contains the same data as Fig. 1, but is shown in a the same way as Figs 4–7 in order to facilitate comparison of results from the different epochs.) Such agreement is expected for a relatively short separation in time, and the measured continuum polarization is only mildly sensitive to spectral resolution. The two sets of observations were carried out independently with a separation of five days with different instruments and under distinct observing conditions (e.g. airmass and seeing conditions, Table 1). Both epochs exhibit a high level of polarization (≳ 0.8 per cent) across the optical wavelength range and a strong depolarization near the emission centre of the Hα profile. Similar features can also be identified in the Kast epoch-3 data at day 38 (Fig. 4), which has a higher signal-to-noise ratio (S/N) compared to epoch 2. We present the spectropolarimetry of SN 2021yja measured at days 57, 66, and 95 in Figs 5, 6, and 7, respectively. The polarization spectra measured for all six epochs are also compared in Fig. 8. The temporal evolution of the continuum polarization between days +25 and +95 is shown in Fig. 9.
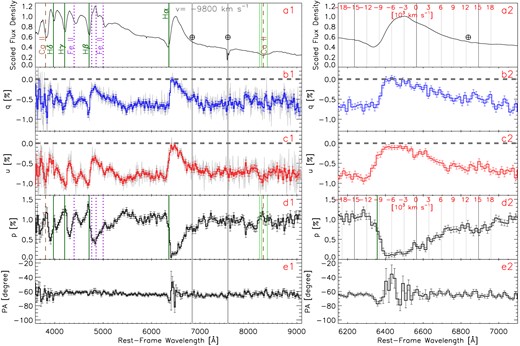
Left column: spectropolarimetry of SN 2021yja obtained on day + 25 (epoch 1) using VLT FORS2. (These data are also shown in Fig. 2, for ease of comparison with Figs 3–5.) The five subpanels (from top to bottom) show (a1) an arbitrarily scaled total-flux spectrum with major spectral lines identified; (b1) and (c1) the normalized Stokes q and u, respectively; (d1) the polarization spectrum (p); and (e1) the polarization position angle (PA). The data in the left panel have been rebinned to 25 Å for better illustration. Some major telluric lines are labelled by ⊕ and vertical grey-shaded bands. All vertical lines label the velocity estimated from the minimum of the absorption component of the Hα profile (9800 km s−1) except for the Ca ii NIR triplet. The three vertical green lines mark the velocity of each Ca ii NIR triplet component; the velocity of a central wavelength at 8570 Å is labelled by the vertical dashed-brown line at a blueshift of 8800 km s−1. The grey lines in panels (b1) and (c1) show the data with their original sampling on the pixels of the VLT/FORS2 detector. Horizontal grey-dashed lines in panels (b) and (c) denote the zero-points of q and u, respectively. Right column: similar to the left column, but zoomed-in on the Hα profile. The polarization data have been rebinned to 15 Å for the purpose of presentation. Vertical grey lines together with the red tick marks indicate velocities relative to Hα in the rest frame.
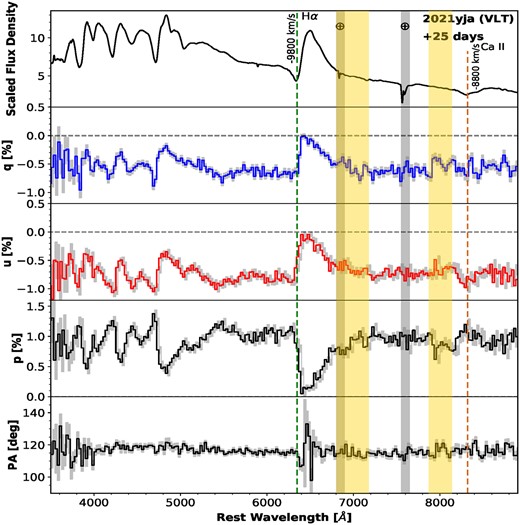
VLT spectropolarimetry of SN 2021yja on 2021 October 02 (day +25). The four panels (from top to bottom) present the scaled flux-density spectrum; the normalized Stokes parameters q and u, and the polarization spectrum p, respectively. The polarization data have been rebinned to 25 Å for clarity. The vertical size of each bin of the grey-shaded histograms indicates the 1σ uncertainty. The vertical green (brown)-dashed lines mark the blueshifted absorption minimum of the P Cygni profile of Hα (Ca ii NIR3) at an expansion velocity of 9800 (8800) km s−1. Some major telluric lines are labelled by red-shaded lines marked with ⊕. Continuum polarization calculated along 6800–7200 and 7820–8140 Å is highlighted by yellow columns.

Kast spectropolarimetry of SN 2021yja on 2021 October 07 (+ 30 d). The locations of major telluric lines are marked by vertical grey columns, but these features were largely removed during the Lick/Kast reduction procedure. Polarization data have been binned to 50 Å.
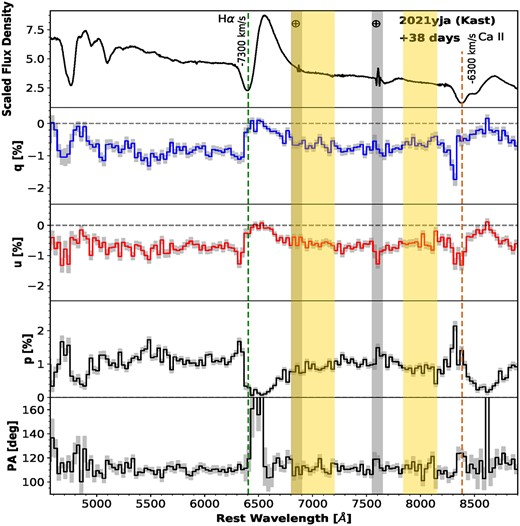
Same as Fig. 3, but for 2021 October 15 (+ 38 d) and a bin size of 30 Å.
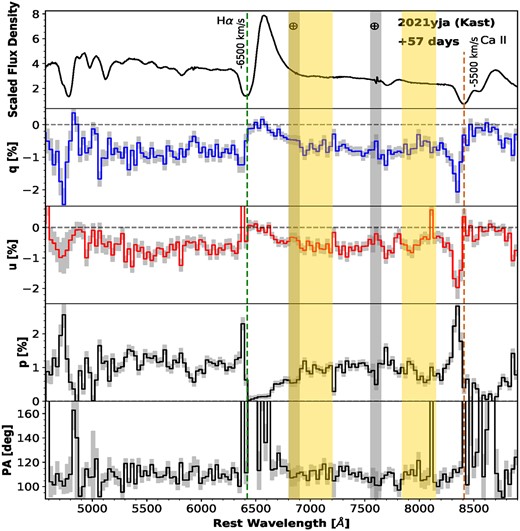
Same as Fig. 4, but for 2021 November 03 (+ 57 d) and a bin size of 30 Å.
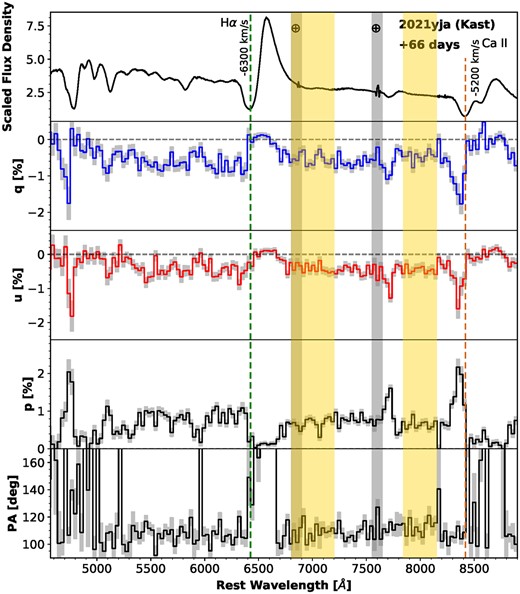
Same as Fig. 3, but for 2021 November 12 (+ 66 d) and a bin size of 30 Å.
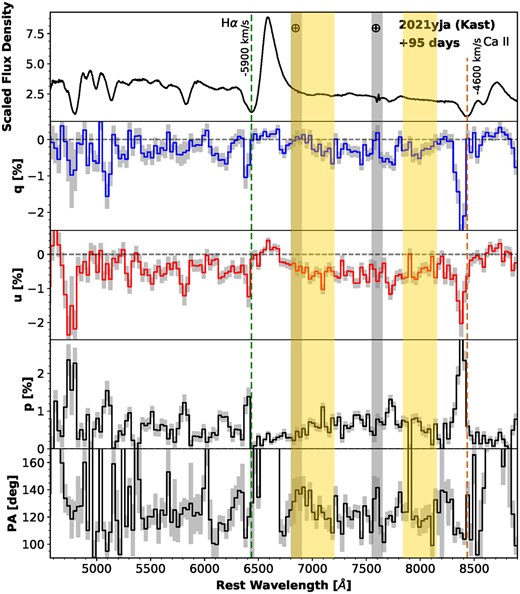
Same as Fig. 3, but for 2021 December 11 (+ 95 d) and a bin size of 30 Å.
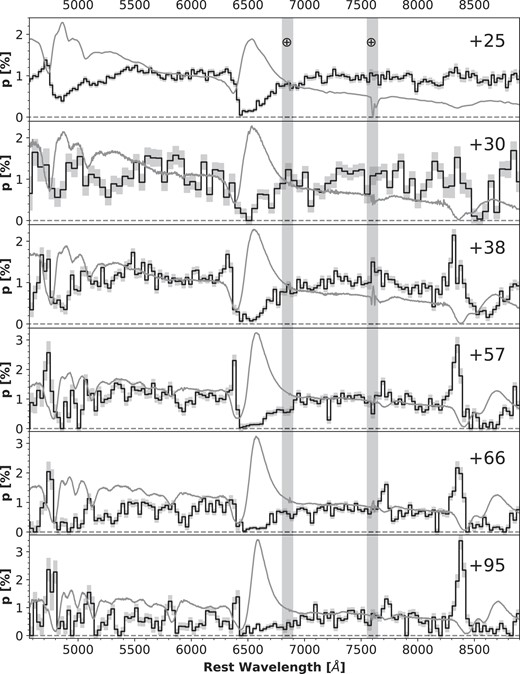
Summary of VLT (rebinned to 25 Å) and Kast spectropolarimetry (rebinned to 50 Å for day +30 and 30 Å for days +38 to + 95) of SN 2021yja. The arbitrarily scaled total-flux spectrum is plotted in grey for each of the observations. The positions of major telluric lines are indicated by ⊕, although they were mostly removed in the Kast spectra.
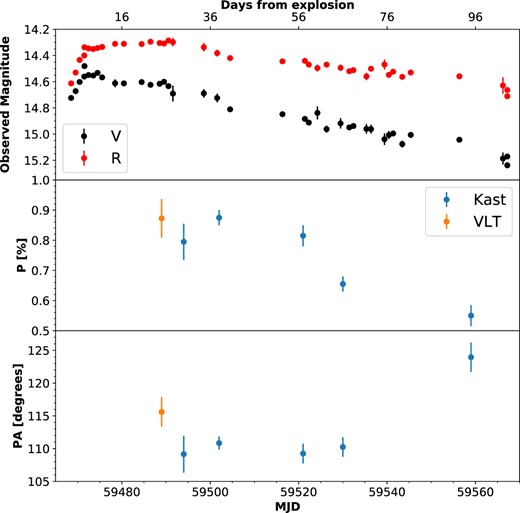
VLT/Kast polarimetry and KAIT VR-band photometry. The continuum polarization is calculated across 6800–7200 and 7820–8140 Å in order to exclude prominent telluric features. Error bars represent 1σ uncertainties.
The linear polarization originating from an ellipsoidal density profile in the ejecta follows the relation p ∝ sin2θ, where θ is the viewing angle that measures the angular separation between the major axis of the ellipsoidal density profile and the line of sight (Brown & McLean 1977). Continuum polarization observed during the photospheric phase of SNe II may arise from electron scattering in an aspherical photosphere or photons scattered by aspherically distributed dust in the CSM (Nagao et al. 2019). The latter is expected to display a strong wavelength-dependent level of polarization – in particular, enhanced polarization toward shorter wavelengths owing to a higher fraction of dust grains at relatively small sizes (Nagao, Maeda & Tanaka 2018). Nagao et al. (2018) assumed that the size distribution of dust grains is a power law with an index of -3.5, and that the maximum and minimum grain radii are 0.25 and 0.005 μm, respectively. They consider C (100 per cent carbon), Milky Way (MW), Large and Small Magellanic Cloud dust models, finding a stronger wavelength dependence in that order (of increasing silicate to graphite ratio) for a fixed optical depth, distance, and viewing direction to a dust blob located close to the SN. Observations and modelling of dust formation support the presence of a combination of silicate and C-rich dust species in SNe (Sarangi & Cherchneff 2013; Wesson & Bevan 2021).
We fit a Serkowski-law profile (Serkowski et al.1975) to the polarization spectrum of SN 2021yja at day +25, excluding spectral regions blueward of 5400 Å (which exhibit multiple polarized features) and Hα. Nagao et al. (2018) used a similar function in modelling CSM dust around SNe. It should be noted that the SN polarization spectrum is not generally expected to be fit by a Serkowski profile using MW parameters, as there has been increasing evidence for the existence of non-MW-like dust in external galaxies; see Nagao et al. (2022) for examples. The fittings failed to converge to a peak wavelength and did not give a better result compared to a horizontal line. Therefore, we claim that no such polarization wavelength dependency can be identified in SN 2021yja. Similarly, Nagao et al. (2019) argued that the polarization spectrum of Type IIP SN 2017gmr was not dominated by dust scattering due to the lack of a polarization wavelength dependency. We conclude that the continuum polarization of SN 2021yja before the tail phase can be mostly attributed to the presence of an aspherical photosphere.
In our first epoch of VLT spectropolarimetry of SN 2021yja at 25 d after the explosion, we measure a continuum polarization pcont = 0.87 per cent ± 0.06 per cent. For Kast observations on days +30, +38, +57, +66, and + 95, we measure pcont = 0.80 per cent ± 0.06 per cent, 0.88 per cent ± 0.03 per cent, 0.82 per cent ± 0.04 per cent, 0.66 per cent ± 0.03 per cent, and 0.55 per cent ± 0.06 per cent, respectively. These results, along with the continuum PA, are presented in Table 2. By approximating the density structure (ρ) of the SN 2021yja ejecta with an oblate ellipsoidal electron-scattering-dominated atmosphere (e.g. ρ ∝ r−n, where r is the distance from a given point to the mass centre), one could estimate its axis ratio for different density slopes n. The higher the value of n for a given Thomson scattering depth τ, the larger the asphericity required to achieve a certain level of polarization (Höflich 1991), since multiple scattering may become dominant under the condition of a steep density gradient, which dilutes the geometric signature possessed by the photosphere.
Continuum polarization and the associated polarization position angle estimated for SN 2021yja.
| Phasea | Telescope/ | Polb | Pol. error | PA | PA err |
|---|---|---|---|---|---|
| (d) | Instrument | (per cent) | (σ per cent) | (deg) | (σ deg) |
| 25 | VLT/FORS2 | 0.87 | 0.06 | 115.3 | 2.1 |
| 30 | Shane/Kast | 0.80 | 0.06 | 109.2 | 2.8 |
| 38 | Shane/Kast | 0.88 | 0.03 | 110.9 | 1.0 |
| 57 | Shane/Kast | 0.82 | 0.04 | 109.3 | 1.5 |
| 66 | Shane/Kast | 0.66 | 0.03 | 110.3 | 1.5 |
| 95 | Shane/Kast | 0.55 | 0.04 | 124.0 | 2.3 |
Notes.aPhases are given in days after the explosion.
bContinuum polarization and PA were computed based on the 1σ-error-weighted Stokes parameters with wavelength ranges 6800–7200 and 7820–8140 Å.
Assuming pcont ≈ 0.9 per cent, n = 2, and an optical depth τ = 1 to represent the photosphere of SN 2021yja a few weeks after the explosion, we estimate an asphericity of ∼15 per cent or an axis ratio of 1.15:1 when viewed equator-on (see fig. 4 of Höflich 1991). The measured continuum polarization level estimates the lower limit of the degree of asphericity of the electron-scattering atmosphere. A higher degree of asphericity of ∼35 per cent or an axis ratio of 1.35:1 can be estimated for n = 3 and τ = 5 that represent a steeper density profile (see fig. 4 of Yang et al. 2020).
The continuum polarization is roughly constant at the 2σ level until day 57 (see Fig. 9). In the following epochs, we identify a decrease in the continuum polarization over time. Such a decreasing polarization level across the continuum during the plateau phase of a Type IIP SN is not only unprecedented (see Introduction), but also contradictory to the consistently low continuum polarization before a rapid rise at the time of transition to the nebular phase. We suggest that the decrease in continuum polarization of SN 2021yja during the photospheric phase can be a result of the photosphere receding into inner, more spherical layers, the optical thinning of the ejecta, or a more pole-on alignment of the inner ellipsoid. Alternatively, the scenario that may explain this temporal evolution can be simplified as a two-component model. The presence of the secondary component is hinted by the rotation of the polarization PA during the steadily decreasing phase of p (see Section 3.3).
As presented in Table 2 and Fig. 9, during the early plateau phase between days +25 and + 66, we measure a time-invariant PA across the wavelengths that define the continuum. However, the continuum PA rotated to 124.0° ± 2.3° on day 95, corresponding to ∼45 d before the plateau drop-off. The interior layers of SN 2021yja have an axis of symmetry that appears slightly rotated with respect to the outer H-rich layer. The high polarization measured over the optical wavelength range suggests a persisting aspherical electron-scattering envelope. This object adds to an emerging heterogeneous sample of Type IIP polarimetry within the last decade, signaling a paradigm shift.
3.2 Comparison with other SNe
We compare the unusually high early-time continuum polarization of SN 2021yja with the well-studied Type IIP SNe 1999em (5050–5950 Å, Leonard et al. 2001), 2004dj (6800–8200 Å, Leonard et al. 2006), 2007aa (6800–7200 Å and 7820–8140 Å, Chornock et al. 2010), 2012aw (6900–7200 Å, Dessart et al. 2021b, R-band Cousins filter [|$\lambda _{R_{\text{eff}}}= 0.67\, \mu$|m], Kumar et al. 2014), 2013ej (7800–8150 Å, Mauerhan et al. 2017; 6800–7200 and 7820–8140 Å, Nagao et al. 2021), and 2017gmr (PMOS FILT_815_13 filter [λ0 = 8150 Å, FWHM = 130 Å], Nagao et al. 2019) in Fig. 10. Note that the different choices of wavelength ranges and filters used to determine the continuum polarization may introduce systematic uncertainties that are difficult to characterize. We also remark that the light curve of SN 2013ej exhibits a faster decline compared with typical SNe IIP, and its spectroscopic evolution more resembles the average behaviour of SNe IIL (Valenti et al. 2016). For this reason, we consider SN 2013ej a transitional Type IIP/L SN throughout this paper.
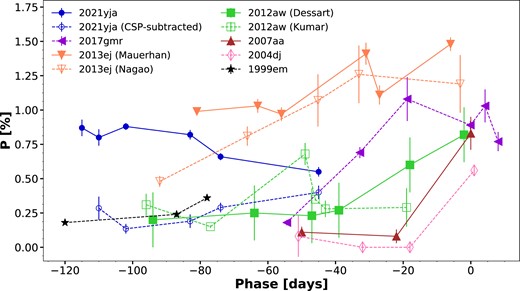
Continuum polarization of SN 2021yja compared with that of Type II SNe 1999em (Leonard et al. 2001; black star), 2004dj (Leonard et al. 2006; pink diamond), 2007aa (Chornock et al. 2010; brown triangle), 2012aw (Kumar et al. 2014; Dessart et al. 2021b; green square), 2013ej (Mauerhan et al. 2017; Nagao et al. 2021; orange triangle), and 2017gmr (Nagao et al. 2019; purple triangle). For each SN, the phase is relative to the end of its plateau, which is defined as the midpoint of the rapidly declining light-curve drop-off. Error bars represent 1σ uncertainties.
As presented in Fig. 10, except for SNe 2013ej and 2021yja, the continuum polarization measured for other SNe IIP is generally low during the period t ≈ 120–40 d before the SN brightness falls from the plateau. During this phase, most SNe IIP show an increase in the continuum polarization over time. However, both SNe 2013ej and 2021yja displayed a significant level of continuum polarization, pcont ≈ 1 per cent during the first few weeks after the explosion. We represent the phase in terms of days relative to the mid-point of the plateau fall-off, as opposed to days from the explosion, to more effectively illustrate the progression of the photosphere into the ejecta.
In order to explain the high polarization observed for SN 2013ej, Mauerhan et al. (2017) suggest that there is interaction between the SN ejecta and an aspherical CSM as well as dust scattering, whereas Nagao et al. (2021) propose a combination of an aspherical explosion and a CSM-interaction component. We caution applying these interpretations to explain the similarly high polarization observed for SN 2021yja given the lack of evidence for dense CSM from ultraviolet and optical spectroscopy (Hosseinzadeh et al. 2022; Vasylyev et al. 2022). However, we do not rule out the existence of low-density CSM adjacent to the hydrogen envelope in SN 2021yja given the interpretations made by Hosseinzadeh et al. (2022) and Kozyreva et al. (2022); see Section 3.3 for further discussion.
CCSNe have been associated with the production of relativistic jets that either puncture the outer layers or are choked by a dense hydrogen envelope (Khokhlov et al. 1999; Couch et al. 2009; Papish et al. 2015; Piran et al. 2019). Modelling of these jets has shown that they can induce a global asphericity in both the hydrogen envelope and the SN core (Höflich, Khokhlov & Wang 2001; Wang et al. 2002; Maund et al. 2007). For SNe IIP, the bipolar jet model predicts the radioactive 56Ni to be confined to the inner regions, where it would ionize the surrounding material, producing an aspherical photosphere (Höflich et al. 2003; Leonard et al. 2006). This, however, begs for an explanation of why many SNe IIP and other non-interacting or weakly interacting SNe (e.g. SN 2004dj) display extremely low continuum polarization during their photospheric phases, unlike SN 2021yja and SN 2013ej.
SN 2017ahn gives another case that shows a rather unique temporal evolution of the continuum polarization when compared with SN 2021yja and other SNe IIP (see fig. 1 of Nagao et al. 2019). Nagao et al. (2019) observe a low continuum polarization during both the photospheric and early nebular phases, suggesting that the line of sight is close to the polar axis of the SN. However, we do not expect viewing-angle effects to be solely responsible for the observed diversity in the temporal evolution of the continuum polarization in SNe IIP. For example, the polarization observed in SNe 2012aw, 2013ej, and 2017gmr all display a continuous, monotonic rise before their optical light curves fall-off the optical plateau, while SN 2004dj maintains a continuum polarization of zero until the sudden rise at the end of the plateau.
One interpretation of the rising continuum polarization is that the ballistic jet is able to break far enough into the hydrogen envelope to produce an early rise in polarization during the photospheric phase (Mauerhan et al. 2017; Nagao et al. 2019, 2021). This scenario presents a counterexample to SN 2004dj, where the ballistic jet would not punch far into the hydrogen envelope and fail to produce a steady rise in polarization before the onset of the nebular phase. We emphasize that the continuum polarization observed for SN 2012aw and SN 2017gmr rose to |$\gt 0.5~{{\ \rm per\ cent}}$| much later in the photospheric phase than for SN 2021yja, which already had a polarization of |$\sim 0.8~{{\ \rm per\ cent}}$| by day + 30, similar to SN 2013ej. Spectroscopic and polarimetric follow-up observations of SN 2021yja during the nebular phase will be important for determining the origin of the global asphericity, while peering into deeper layers of the core.
To summarize, SN 2021yja is spectroscopically similar to other SNe IIP that lack evidence of strong ejecta-CSM interaction, but are expected to have at least some pre-existing CSM produced by the RSG progenitor (see Morozova, Piro & Valenti 2018; Hillier & Dessart 2019). However, the observed high continuum polarization suggests the presence of an aspherical, extended hydrogen envelope with possible contributions from an additional heating source, such as interaction with a low-density CSM. An aspherical geometry of the hydrogen envelope is compatible with the presence of bipolar relativistic jets.
3.3 Additional heating source
Following an approach similar to that of Nagao et al. (2021), we discuss the possibility of an additional heating source (along with radioactive decay), namely CSM interaction, which can explain the high early-time continuum polarization and its steady decline over the photospheric phase.
The main assumption is that the observed continuum polarization consists of two components: an aspherical explosion intrinsic to the SN and Thomson scattering in the aspherical CSM. The latter is assumed to be constant over time – the Stokes parameters that describe the CSM, qCSM, and uCSM, do not change appreciably. The first epoch, which shows the highest continuum polarization, is considered as being completely caused by electron scattering in the CSM component. Choosing a constant CSM component may introduce a systematic error, especially for the later epochs. Therefore, we take caution in the interpretation of the results following such a procedure that separates the contribution from CSM scattering and an aspherical central energy source. These assumptions are motivated by the observed pattern of weakly interacting SNe showing low intrinsic polarization at early times (see Section 3.3). Furthermore, Nagao et al. (2021) argue for the presence of an aspherical CSM in order to explain the high early-time continuum polarization of SN 2013ej. The procedure is carried out by subtracting the assumed CSM Stokes parameters from the observed Stokes parameters that were used to calculate the continuum polarization in Section 3.1. We estimate the uncertainty of the intrinsic polarization following the approximation |$\sigma _{\text{CSM}} \approx 1.4 \, \sigma _{\text{obs}}$|, where σobs is the observed continuum polarization uncertainty.
We present the temporal evolution of the continuum polarization of SN 2021yja after subtracting the circumstellar polarization (CSP) component in Fig. 11. The thereby implied intrinsic polarization of the SN shows a generally increasing trend from the assumed level of |$p_{\text{cont}}=0~{{\ \rm per\ cent}}$| at day 25 to |$p_{\text{cont}} \sim 0.4~{{\ \rm per\ cent}}$| at day 95. This temporal evolution is similar to that of SN 2017gmr (see Fig. 10). In fact, at similar phases the CSP-corrected SN 2021yja and observed SN 2017gmr polarization were roughly the same (Nagao et al. 2019). For example, at 45 d before the end of the plateau, both SNe have a continuum polarization value of |$p_{\text{cont}} \approx 0.4~{{\ \rm per\ cent}}$|. Nagao et al. (2019) suggest that this early rise in continuum polarization (before the onset of the nebular phase) can be explained by asymmetries not only in the helium core, but also in the hydrogen envelope.
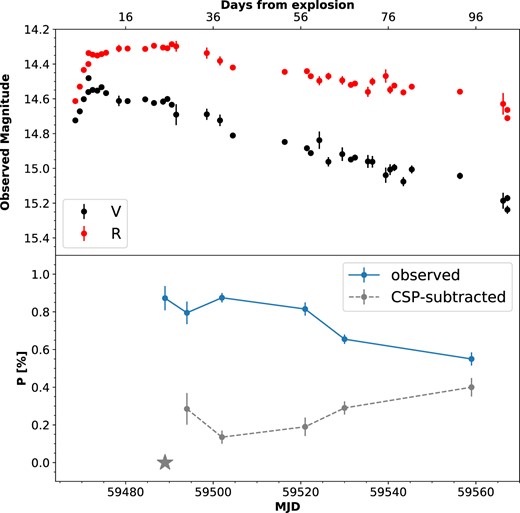
Upper panel is the same as in Fig. 9. Temporal evolution of the CSP-corrected broad-band polarization of SN 2021yja as compared to the observed values. Error bars indicate 1σ uncertainties, which do not account for the systematic uncertainty of the CSP correction. The grey star represents the assumed zero level of polarization on day 25. The presented values indicate the continuum level of the polarization calculated across the same wavelength range as in Fig. 9.
We extend this argument to explain the temporal evolution of the intrinsic polarization of SN 2021yja. This smooth transition between the outer and inner geometric configurations is compatible with a jet-driven explosion, where the relativistic jet breaks out of the helium core into the hydrogen envelope (Wang et al. 2001; Couch et al. 2009). Additional polarimetry of SN 2021yja during the plateau drop-off and the nebular phase is crucial for determining the geometry of the helium core (Nagao et al., in preparation).
3.4 Line polarization and the Stokes q − u diagrams
Polarization across prominent spectral lines can be used to map the distribution of individual elements within the SN ejecta. In order to better illustrate the geometry of various elements and compare their symmetry axes with that of the SN ejecta, we adopt a mathematically convenient alternative expression to p and PA by presenting the fractional Stokes q and u parameters per wavelength bin on a two-dimensional plane (Wang et al. 2001). When the ejecta share a common axis of symmetry, their values for the q and u Stokes parameters fall on a straight line in the q − u plane, colloquially known as the dominant axis (Wang et al. 2003; Maund et al. 2010). We use the ‘kmpfit’ least-squares fitting code, which is part of the kapteyn python Package,4 to fit the dominant axis to the polarization data.
On the other hand, when ejecta depart from an axial symmetry, the values for q and u deviate from the dominant axis in the form of loops or a continuous rotation of the PA as a function of wavelength across the corresponding line profile. Loop structures in the q − u plane are treated as indicators of ‘clumpiness’ in the ejecta and are perhaps most well studied for the Ca ii NIR3 line (Kasen et al. 2003). Multidimensional hydrodynamics simulations of the SN atmosphere using Monte Carlo radiative-transfer methods will be essential to quantify the size, distribution, and optical depth of these clumps.
A commonly observed behaviour across prominent Balmer lines is the progressive depolarization toward the centre of the emission features. The emission process scrambles preferentially oriented electric-field vectors of the incoming (absorbed) photons (Jeffery 1991). As the SN ejecta expand over time, the column density drops, and the scattering opacity decreases. In the case of the optically thick regime (τ > 1), the decline of multiple scattering will initially result in an increase of pcont until the optical depth of electron scattering drops to ∼1; then pcont will begin to decrease monotonically (see fig. 1 of Höflich 1991). Apart from the depolarized Balmer features, we also note that major absorption lines, such as Ca ii NIR3, exhibit their highest polarization close to the absorption minimum of the feature (McCall 1984; Leonard et al. 2001). The line-forming region sits just above the photosphere, thus probing a different region of the ejecta.
The left column of Figs 12 and 13 shows the spectropolarimetry of SN 2021yja presented on the q − u plane for all six epochs from days +25 to +95. Black dashed lines fit the dominant axis to the observed polarization of SN 2021yja in the wavelength range 4600 ≤ λ ≤ 8900 Å, representing the direction of axial symmetry. Data points within the wavelength covered by the significantly depolarized Balmer lines, the highly polarized Ca iI NIR3, and the major telluric bands were excluded. The slopes of the linear fit in Figs 12 and 13 can be converted to a PA using the following relation: |$\text{PA} = 0.5 \arctan (m)$|, where m is the slope of the linear fit of the form y = mx + b.
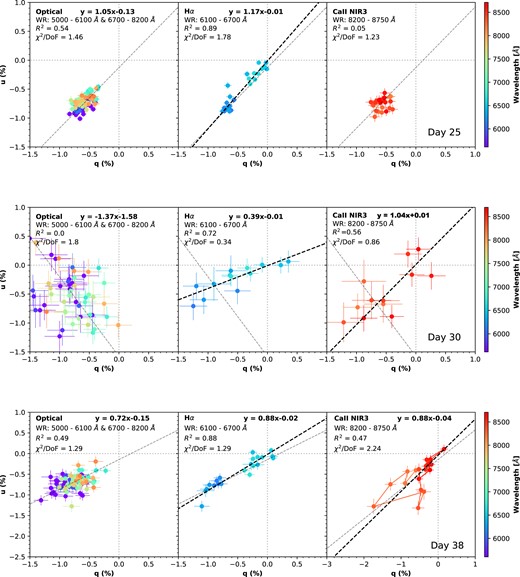
Stokes parameters of SN 2021yja displayed on the q − u plane. The polarization data have been rebinned to 25, 50, and 30 Å for the observations at epoch 1 (day 25), epoch 2 (day 30), and epoch 3 (day 38), respectively. Error bars represent 1σ uncertainties. Panels from left to right show the optical (5000–6100 and 6700–8200 Å), Hα (6100–6700 Å), and Ca ii NIR3 (8200–8750 Å) regions. The dashed grey line in the second and third panels indicates the optical dominant axis computed from data in the ranges 5000–6100 and 6700–8200 Å (note the distinction from the wavelength range used to compute the continuum polarization and PA). Bold, dashed lines in the second and third panels fit the dominant axis for the Hα and the Ca ii NIR3 profiles, corresponding to a velocity range from roughly −21 200 to +6200 and −12 000 to +7300 km s−1, respectively.
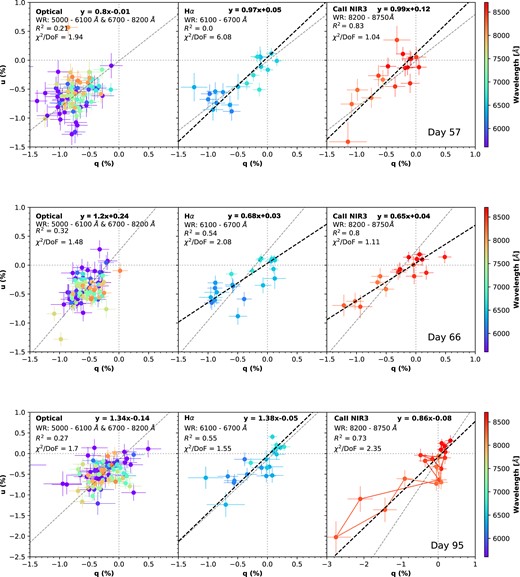
Similar to Fig. 12, but for epochs 4 (day 57, top row), 5 (day 66, middle row), and 6 (day 95, bottom row). Data are binned to 30 Å.
The middle and the right columns of Figs 12 and 13 are the same as the left column but for the Hα line from ∼−21 200 to + 6200 km s−1 with respect to a central wavelength of |$\lambda _{0}^{\rm H\alpha }=6564.6$| Å and the Ca ii NIR3 profile from ≈−12 000 to +7300 km s−1 with respect to a central wavelength of |$\lambda _{0}^{\rm CaII}=8542$| Å, corresponding to the middle component of the triplet. Linear fits to the displayed data points that cover the Hα and the Ca ii NIR3 profiles are represented by the grey-dotted lines in the middle and the right columns, respectively.
The Hα and Ca ii NIR3 lines show similar axial symmetry with the optical continuum, which was chosen over the range 4600–8900 Å (ignoring major spectral lines). At all epochs, the PA across the Hα profile also exhibits little wavelength dependence. Moreover, the PA of the Hα is overall persistently aligned with the dominant axes fitted over the optical wavelength range (4600–8900 Å, ignoring Hα and Ca ii NIR3) for each epoch with the exception of day +30. The optical dominant axis on day +30 was rotated nearly 90° with respect to the optical dominant axes obtained for all other epochs. However, both Hα and Ca ii NIR3 (Fig. 12, middle row) on day +30 share roughly the same axis of symmetry as at the other epochs. The anomalous rotation of the optical dominant axis from day +25 to day +30 is most likely due to the poor polarization signal quality at this epoch, as evidenced by the significant difference in data quality when comparing Fig. 3 to Figs 2 and 4–7, and the second panel in Fig. 8 with the other panels. Therefore, we suggest that the continuum-emitting region in the ejecta and the H-rich envelope share a similar axial symmetry.
Nearly complete depolarization occurs near the Ca ii NIR3 emission peak on day 30, whereas on day 25, the polarization across the line follows the continuum. The lack of a strong Ca ii line feature in both the flux and polarization spectra for the earlier VLT epoch suggests that the receding photosphere has not yet reached the calcium layer. Strong line polarization in Hα and Ca ii NIR3 does not appear until day + 38.
This can also be illustrated by projecting the polarization onto the dominant axis (Pd) that characterizes the direction of global asphericity (see the middle panel of Fig. 14). The residual will be the polarization signal orthogonal to the dominant axis (Po), which represents the deviations from axial symmetry (see the bottom panel of Fig. 14). At day + 25, all major polarization modulations are observed in the dominant polarization component, while the signals in the orthogonal polarization component do not show significant deviation from zero. Such a low residual across the entire observed wavelength range implies a well-defined symmetry axis shared by the continuum and various line-forming regions (Wang & Wheeler 2008).
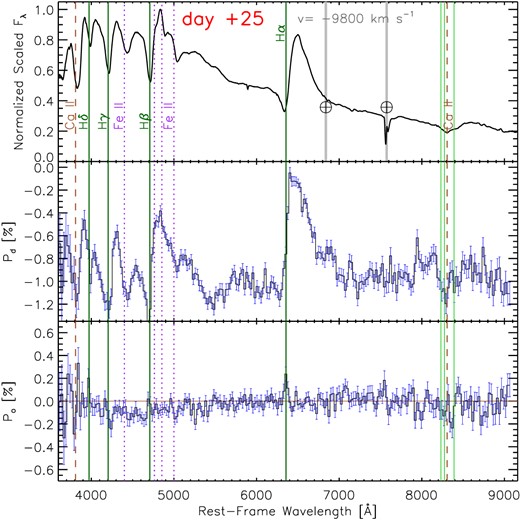
Normalized total-flux spectrum (upper panel) together with the principal component analysis of SN 2021yja spectropolarimetry at day + 25. The polarization spectra projected onto the dominant and the orthogonal axes are shown in the middle and the bottom panels, respectively. Some major telluric lines are labelled by ⊕ and vertical grey-shaded bands.
On day + 95, we observe only a slight rotation in both the continuum dominant axis and Hα (Fig. 13). Therefore, we conclude that the dominant axes of both Hα and Ca ii NIR3 share a similar direction with that of the SN ejecta. The common symmetry axis of SN 2021yja does not rotate significantly during the photospheric phase, suggesting a global asphericity in the hydrogen-rich envelope. Additionally, we observe a possible loop structure in the q − u plot for Ca ii NIR3 on days 38 and 95, which may suggest a clumpy distribution of calcium deeper in the ejecta. The low S/N complicates the determination of loop structures for the Hα line. Additional spectropolarimetry during the nebular phase will be necessary to determine if a greater deviation from spherical symmetry exists in the inner He-rich core, which may reflect an enhanced instability during the SN explosion (Nagao et al., in preparation).
SN 2021yja shows an increase in the level of polarization across the Ca ii NIR3 line throughout the six epochs of spectropolarimetry. For example, the peak polarization across Ca ii NIR3 grows almost monotonically from ∼1.5 per cent on day +38 to ≳ 3 per cent on day + 95. Meanwhile, the continuum polarization decreases over time, indicating a considerable decline in electron-scattering opacity in the SN ejecta. Therefore, given opacity distributions that do not change dramatically across the radial direction, the corresponding line polarization is expected to drop, contradicting the observed polarization behaviour of SN 2021yja (Figs 2–7). A similar trend of increase of Ca ii NIR3 polarization in the nebular phase has been reported for the Type Ia SNe 2006X (Patat et al. 2009) and 2021rhu (Yang et al. 2022). This result is unexpected under the framework that line polarization is produced primarily when the element opacity unevenly masks the underlying photosphere. Additionally, as the ejecta expand over time, it becomes progressively unlikely for a thermally emitted photon to be destroyed by absorption. In other words, a high and continuously rising line polarization is also unexpected given the reduced thermalization depth over time. Therefore, apart from the line polarization created through an interplay between line occultation and thermalization (Höflich et al. 2023), other mechanisms would be essential to explain the late-time rise of the Ca ii NIR3 polarization.
An alternative explanation is that the late-time increase of the Ca ii NIR3 line polarization was the result of the geometric alignment of the ground and metastable states of this ion through photo-excitation by an anisotropic radiation field (Yang et al. 2022). The angular momentum of atoms can be realigned through magnetic precession in a weak magnetic field under the condition that the Larmor precession rate is greater than the photo-excitation rate (Happer 1972; Landolfi & Landi Degl’Innocenti 1986). This type of magnetic alignment leads to an uneven distribution of atoms across magnetic sublevels and produces polarized radiation (Yan & Lazarian 2006, 2012). Photons become polarized through the interaction between optical pumping by an anisotropic radiation field and the ambient magnetic field. Therefore, the presence of the polarized lines for which corresponding atomic states can be magnetically aligned may provide an opportunity to infer the magnitude and configuration of the magnetic field. For example, all three of the Ca ii NIR3 triplet components, with air wavelengths of 8498.02 Å (2D3/2 → 2P3/2), 8542.09 Å (2D5/2 → 2P3/2), and 8662.14 Å (2D3/2 → 2P1/2), are metastable states. Each of them can be geometrically aligned and individually polarized through photo-excitation when placed in an anisotropic radiation field.
In the case of SN 2021yja, the increase of Ca ii NIR3 polarization (from ∼1.5 per cent on day +38 to ≳ 3 per cent on day + 95) is not as significant as in the Type Ia SN 2021rhu (from ∼0.4 per cent around the peak luminosity to ∼2.5 per cent after 79 d, Yang et al. 2022). Additionally, the calcium opacity and/or the asphericity of its distribution may vary as the photosphere tomographically samples the inner layers of the ejecta. From day +38, the dominant axis over the Ca ii NIR3 feature maintains good agreement with that of the continuum. Despite the small sample size, the agreement between the dominant axes of the continuum and Ca ii NIR3 in the two observed cases warrants further attention in future measurements. However, without detailed theoretical modelling, it is difficult to discern whether occlusion of the photosphere, optical pumping effects, or a combination of both explains the late-time rise of the Ca ii NIR3 polarization.
4 CONCLUSIONS
Spectropolarimetric observations of SN 2021yja during the photospheric phase reveal significant departures from global sphericity, suggesting a highly aspherical distribution of free electrons in the outer layers of the ejecta.
The early continuum polarization was measured to be |$p \approx 0.9~{{\ \rm per\ cent}}$|, placing SN 2021yja among the most polarized known SNe IIP during the photospheric phase. The observed continuum polarization shows a slight decline over time, which is unprecedented in the literature for SNe II. We find almost complete depolarization near the centre of the Hα emission line, suggesting a negligible amount of ISP contributed by the line-of-sight dust. Therefore, the unusually high observed continuum polarization is unlikely to be contaminated by the ISP. Meanwhile, both the orientation of the dominant axis and the continuum PA measured for SN 2021yja remained constant from days 25 to 66, indicating a persistent axial symmetry from the outer and inner regions of the SN ejecta.
Following an approach similar to that of Nagao et al. (2021), we assumed that the continuum polarization of SN 2021yja during the early photospheric phase is dominated by ejecta interacting with the aspherical CSM. We then subtract this interaction component from the polarization measured at later phases to measure the continuum polarization instrinsic to the SN, which shows a steady rise throughout the photospheric phase.
By modelling ultraviolet spectra of SN 2021yja obtained between +9 and +21 d after the explosion, Vasylyev et al. (2022) find no significant flux contribution from the CSM. Hosseinzadeh et al. (2022) do not find evidence for dense CSM from modelling the early-time light curves of SN 2021yja using the model presented by Sapir & Waxman (2017), suggesting a red supergiant progenitor with weak mass loss. However, the light-curve modelling by Kozyreva et al. (2022) as well as observations of X-rays, radio emission, a blue excess, and a rapid rise time suggest that at least some CSM interaction is occurring. These seemingly incompatible observations paint a confusing picture. We propose a compromise similar to that of Hosseinzadeh et al. (2022), where the density of the CSM is low enough to not manifest in spectral lines, but is sufficiently high to produce the observed properties listed above.
The spectropolarimetric observations could also be explained by an aspherical, extended hydrogen envelope, with a possible contribution by an additional heating source, such as interaction with a low-density CSM. However, the observed polarization can instead be interpreted as the result of an aspherical explosion with an extended hydrogen envelope, indistinguishable from low-density CSM adjacent to the SN. Additionally, the observed preferential axis of symmetry shared among the continuum and prominent spectral lines (Hα, Ca ii NIR3) is compatible with the presence of bipolar relativistic jets. We caution overinterpretation of the continuum dominant axis rotation observed on day +30, as the data quality is significantly lower at this epoch. More robust fitting methods are needed to properly describe the dominant axis when the polarization data have large scatter and the Stokes parameters are weakly correlated.
The observed high polarization as early as 25 d after the explosion, the constant symmetry axis of the ejecta, and the lack of scatter in the q − u diagram may suggest that a binary process distorted the massive hydrogen stellar envelope that was initially unperturbed by the explosion. In this scenario, Rayleigh–Taylor instabilities would not have reached the hydrogen envelope, where the photosphere is located at these early times. This interpretation adds to the ambiguity of the physical mechanisms responsible for the observed polarization. However, the consistency of this argument requires verification through nebular polarimetric observations and detailed multidimensional hydrodynamic simulations. Future work adding to the sample of SNe IIP will be crucial in resolving the degeneracy in explosion models and geometries. A larger sample will also allow us to test correlations between the level of polarization and other SN parameters such as synthesized 56Ni mass and explosion energy (see discussion by Chornock et al. 2010).
ACKNOWLEDGEMENTS
We are grateful to an anonymous referee who helped us improve this manuscript. We thank Takashi Nagao and Ryan Chornock for fruitful discussions. The European Organisation for Astronomical Research in the Southern Hemisphere (ESO) provided a generous allocation of observing time. Polarimetric studies in this work are based in part on observations made with the VLT at ESO’s La Silla Paranal Observatory under program ID 105.20AU.002 and 108.228K.001. We especially thank the staff at Paranal for their proficient and highly motivated support of this project in service mode. A major upgrade of the Kast spectrograph on the Shane 3 m telescope at Lick Observatory, led by Brad Holden, was made possible through gifts from the Heising-Simons Foundation, William and Marina Kast, and the University of California Observatories. KAIT and its ongoing operation were made possible by donations from Sun Microsystems, Inc., the Hewlett-Packard Company, AutoScope Corporation, Lick Observatory, the U.S. National Science Foundation, the University of California, the Sylvia & Jim Katzman Foundation, and the TABASGO Foundation. We appreciate the expert assistance of the staff at Lick Observatory. Research at Lick Observatory is partially supported by a generous gift from Google.
Generous financial support was provided to A.V.F.’s supernova group at U.C. Berkeley by the Christopher R. Redlich Fund, Steven Nelson, Landon Noll, Sunil Nagaraj, Sandy Otellini, Gary and Cynthia Bengier, Clark and Sharon Winslow, Sanford Robertson, Alan Eustace, Briggs and Kathleen Wood, and numerous other donors.
Based in part on observations collected at the European Southern Observatory under ESO programmes 105.20AU.002 and 108.228K.001.
DATA AVAILABILITY
The VLT spectropolarimetry data used in this work can be retrieved from the ESO Science Archive, program ID: 105.20AU.002 (PI: Y. Yang). The reduced Lick data used in this work may be shared upon request to Sergiy S. Vasylyev ([email protected]) or Yi Yang ([email protected]).
Footnotes
iraf is distributed by the National Optical Astronomy Observatories, which are operated by the Association of Universities for Research in Astronomy, Inc., under cooperative agreement with the U.S. National Science Foundation (NSF).
Following the definition adopted by Patra et al. (2022), where q = Q/I and u = U/I.
The first and the second loops were obtained through ESO program 105.20AU.002, while the third loop was acquired through ESO program 108.228K.001.
References
APPENDIX A: A TEST OF THE FORS2 SPECTROPOLARIMETRY PRECISION
The first epoch of VLT spectropolarimetry was obtained by calculating the mean flux spectra of the o- and e-rays obtained at three consecutive loops of a set of four exposures at different retarder plate angles during the night of 2021 Januay 2, with starting times of approximately 04:44, 05:08, and 05:50, respectively.5 For the purposes of inspecting the precision and stability of FORS2 spectropolarimetry, we compare the q and u spectra for all three loops by presenting their differences in Fig. A1. The pink and the light-blue shaded horizontal bands are vertically centred at the average q and u values across the entire observed wavelength range, respectively. The width of the shaded regions corresponds to twice the median uncertainty of the difference between the 25 Å binned Stokes parameters from the loops considered.
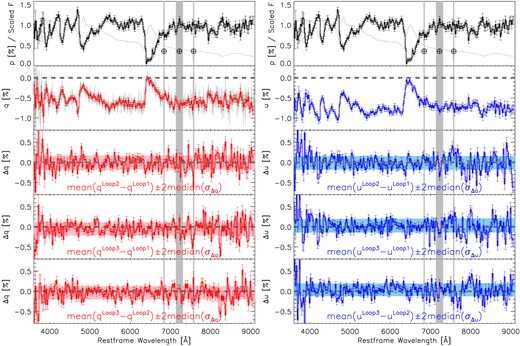
Left column: the five panels (from top to bottom) give (1) the polarization spectrum (p, black histogram) and the scaled-flux spectrum (grey line); (2) the normalized Stokes parameter q, and (3)–(5) the difference between q derived for loops 2 and 1, loops 3 and 1, and loops 3 and 2, respectively. The horizontal shaded bands represent the mean differences of q ± 2 times the median uncertainty among all 25 Å bins presented in the figure across the observed wavelength range. Right column: similar to the left column but for u. Some major telluric lines are labelled by red-shaded lines marked with ⊕.
As shown in the third to the fifth rows of Fig. A1, most of the bins in the difference spectra of the Stokes parameters computed from individual loops of spectropolarimetry are within two times the typical size of the statistical uncertainty. Therefore, we suggest that the Stokes parameters derived for the three consecutive loops agree within their 2σ uncertainties. The outcome of such a sanity check also demonstrates the high precision and reproducibility of FORS2 spectropolarimetry, despite moderate variations in the airmass and the seeing conditions during the observations (see Table 1).
Author notes
Steven Nelson Graduate Fellow in Astronomy
Bengier-Winslow-Robertson Postdoctoral Fellow in Astronomy
Nagaraj-Noll-Otellini Graduate Fellow in Astronomy
Wood Specialist in Astronomy
Eustace Specialist in Astronomy
