


ABSTRACT
A multiparameter analysis was conducted to evaluate the impact of meteorological parameters, night sky brightness and seismic hazards on proposed sites for the new optical/infrared Egyptian astronomical telescope. The European Centre for Medium-Range Weather Forecasts (ECMWF) Reanalysis v5 (ERA5) data set is used to obtain the following meteorological parameters: total cloud coverage fraction, precipitable water vapour, relative humidity, wind speed and direction, and air temperature. To estimate the aerosol optical depth, we used the Modern-Era Retrospective analysis for Research and Applications version 2 (MERRA-2). Light pollution over the candidate sites was measured using the Visible Infrared Imaging Radiometer Suite (VIIRS) day/night band. In order to assess the seismic hazards for the candidate sites, the seismic input in terms of maximum acceleration and response spectra was computed using a physics-based ground motion approach to assess the seismic hazards and, consequently, the designation of a seismic-resistant structure for the proposed sites. Of the seven nominated sites, two sites are found to have the best measurements and might be considered as future sites for the new Egyptian astronomical telescope. The first site is located in the south of the Sinai peninsula, while the second site is located in the Red Sea mountains region.
7
7
1 INTRODUCTION
The geographical location of Egypt is one of the most important reasons for building astronomical telescopes there that would bridge the gap in observations between the Northern and Southern hemispheres. Kottamia Astronomical Observatory (KAO) (at 29°55′35|${_{.}^{\prime\prime}}$|24N, 31°49′45|${_{.}^{\prime\prime}}$|85W), which hosts a 1.88-m optical telescope and is operated by the National Research Institute of Astronomy and Geophysics (NRIAG), is considered the largest optical telescope in the Middle East and North Africa region (MENA), so far. The unique site of the KAO enables Egypt’s researchers to carry out Galactic and extragalactic research, as well as studying stellar variability and stellar evolution (Saad et al. 2016; Darwish et al. 2017a, b), and discovering a list of variable stars (e.g. Darwish et al. 2017c; Shokry et al. 2017; Abdel-Sabour et al. 2024).
More recently, and because of the rapid increase of artificial light at night (ALAN) pollution coming from the New Administrative Capital, the faintest observable magnitude at the KAO site has shifted towards a brighter magnitude. Consequently, objects fainter than 18 mag can no longer be observed. Fig. 1 depicts the evolution of sky brighteness above the KAO using the Visible Infrared Imaging Radiometer Suite (VIIRS) day/night band (DNB) during the period 2012–2022, where the DNB is in the visible band, 0.5–0.9μ m (Nurbandi et al. 2016). Therefore, a new contemporary optical/infrared telescope (>4 m) is needed.
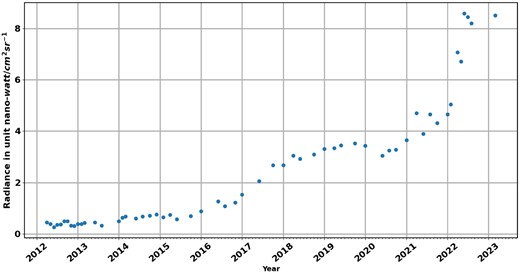
Average night sky brightness above the KAO measured in nW cm−2 sr−1 during the period 2012–2023.
The first step is to think about the quality of the astronomical site, which is important for getting the best performances from ground-based optical telescopes. This quality can be characterized by several conditions, including atmospheric parameters such as air temperature (AT), wind speed (WS), wind direction (WD), relative humidity (RH), precipitable water vapour (PWV), total cloud coverage (TCC) and aerosol optical depth (AOD). These parameters play an important role in the quality of astronomical observations from ground-based sites (e.g. Ardeberg 1983; Lombardi, Zitelli & Ortolani 2009; Varela & Muñoz-Tuñón 2009). The second step is to consider the sky brightness and light pollution, which are also issues affecting the quality of astronomical observations and their limiting magnitude.
Night sky brightness (NSB), as seen from the ground, is mainly a result of natural or artificial sources. Natural sources are both extraterrestrial (e.g. unresolved stars/galaxies, diffuse galactic background and zodiacal light) and atmospheric (e.g. auroral activity and air-glow) phenomena, while artificial sources are a result of the so-called artificial light that is scattered by the troposphere and caused by human activity (e.g. Roach 1964; Leinert & Mattila 1998; Patat 2003; Taylor, Jansen & Windhorst 2004; Masana et al. 2021; Barentine 2022). Last but not least, site accessibility and seismic hazard parameters are also important considerations. Seismic hazards, in particular, can play a crucial role in both the structure and cost of the telescope’s construction, and its operational and survival conditions (e.g Tsang et al. 2008; Eff-Darwich et al. 2010; Usuda et al. 2014; Sugimoto et al. 2022).
Considering the MENA region, a few studies have been carried out in order to search for the best sites for an optical telescope (e.g Abdelaziz et al. 2017). Abdelaziz et al. (2017) focused only on some meteorological parameters such as AT, barometric pressure (BP), RH, WD, WS, AOD and PWV. They concluded that, for Egypt, the best site to locate an optical telescope is at the Egyptian western desert. More recently, Aksaker et al. (2020) presented some meteorological parameters to select not only MENA but also global astronomical sites. We discuss this work in detail in Section 2.
In this paper, we investigate the meteorological conditions, NSB and seismic hazard assessment for a list of candidate sites proposed for the new Egyptian Large Optical Telescope. In Section 2, we describe the selection criteria for the candidate sites. In Section 3, we give the meteorological conditions, including their parameters, and the light pollution for each site. Section 4 deals with the seismic hazard assessment. Finally, we present our conclusions in Section 5.
2 CANDIDATE SITES AND SELECTION CRITERIA
A fundamental parameter in the search for a site for a ground-based telescope is to look at the region’s spatial information or topography, which is usually presented by digital elevation model (DEM) maps. In order to generate the DEM maps for Egypt, NASA’s Shuttle Radar Topography Mission (SRTM V3) is used, which has a resolution of around 30 m (see Farr et al. 2007). The high resolution provided by the SRTM V3 enables us to locate very good curvatures and plateaus that might be candidate sites for a new ground-based telescope. Fig. 2 shows the full map of Egypt with preliminary selection criteria including elevation (>1000 m), site accessibility, distance from the city lights of the nearest city (≥ 50 km) and NSB (fainter than 21.85 mag arcsec−2). Following these criteria, a number of sites are selected, listed and displayed in Table 1 and Fig. 2, respectively.
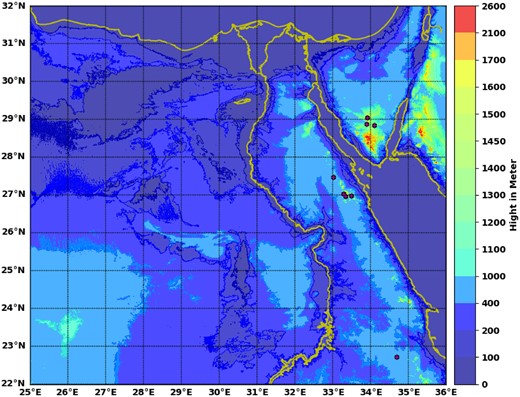
Topography of Egypt along with the candidate mountains (black dots). The elevation through the map is colour coded.
List of the candidate sites including ID, name, longitude, latitude and elevation.
| Site number | N latitude (deg) | E longitude (deg) | Elevation (m) |
|---|---|---|---|
| 1 | 28.847995 | 34.096922 | 1583 |
| 2 | 28.880113 | 33.891536 | 1612 |
| 3 | 29.045706 | 33.910842 | 1626 |
| 4 | 27.470417 | 33.011806 | 1381 |
| 5 | 26.978606 | 33.487795 | 2100 |
| 6 | 27.027083 | 33.28625 | 1631 |
| 7 | 26.966806 | 33.332917 | 1531 |
| 8 | 22.7185 | 34.696 | 1315 |
In order to confirm those sites as good candidates, we first compared them with the high-resolution satellite global data published by Aksaker et al. (2020). They introduced an index to evaluate the site’s suitability, called the suitability index for astronomical sites (SIAS), with A, B, C and D series. Of these data, we consider only data above 1000 m for Egypt.
As shown in Fig. 3, most of the candidate sites are in good agreement with the criteria of Aksaker et al. (2020) except for site 8 (see Table 1), which consequently will no longer be taken into account.
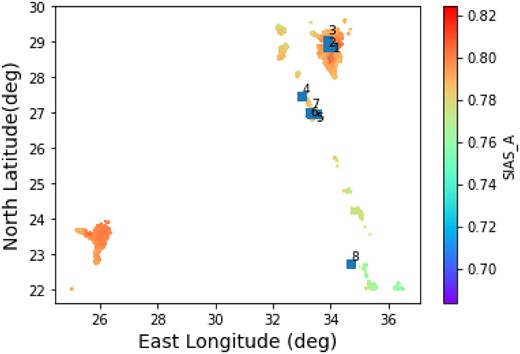
Series A of the SIAS of Aksaker et al. (2020). The eight candidate sites are marked with blue squares, where the SIAS through the map is colour coded.
3 METEOROLOGICAL CONDITIONS OF SITES
In this section, we focus on some important meteorological parameters that would help in the site evaluation process. These parameters are near-surface (2 m) AT (°C) and RH (per cent), WS (m s−1) and WD (deg) at 10 m, PWV (mm) and TCC (fraction from 0 to 1).
These parameters were obtained as monthly averaged data from the European Centre for Medium-Range Weather Forecasts (ECMWF) Reanalysis v5 (ERA5) data set (Hersbach et al. 2019) at 0|${_{.}^{\circ}}$|25 × 0|${_{.}^{\circ}}$|25 grid spatial resolution for the climate period of 40 yr (1979–2019). The data were extracted at the candidate sites using bilinear interpolation between the nearest four grid points. ERA5 is the fifth and latest generation of ECMWF global atmospheric (climate and weather) reanalysis data sets, which combines vast amounts of historical observations into global estimates using advanced modelling and data assimilation systems. For more details on ERA5, see https://www.ecmwf.int/en/forecasts/datasets/reanalysis-datasets/era5.
Owing to the ERA5 spatial resolution (0|${_{.}^{\circ}}$|25 × 0|${_{.}^{\circ}}$|25), sites 6 and 7 are taken as one site with the ID label 6&7, because of the similarity in their interpolated geographical locations, which give the same parameter values. The local seasons are defined by grouping months as follows: winter is December, January and February; spring is March, April and May; summer is June, July and August; autumn is September, October and November.
For further statistical analysis and interpretation of daytime and nighttime changes for selected meteorological variables such as AT and WS, the monthly averaged reanalysis by hour of day from the ERA5 data set is used. Daytime and nighttime separation for meteorological analysis was determined by the times of sunset and sunrise; however, for estimation on clear nights (see Section 3.6), nighttime is better defined by nautical twilight. In addition, the maximum, minimum, mean, standard deviation, and the different percentages (5 per cent, 25 per cent, 50 per cent, 75 per cent, and 95 per cent) for each variable are computed to determine its variation (highest and lowest) during the daytime and nighttime at the different sites, as demonstrated in Tables 2 and 3.
Daytime and nighttime changes of AT for each candidate site. The ERA5 monthly averaged reanalysis by hour of day is used.
| Daytime | Nighttime | |||||||||||||||||||||||
|---|---|---|---|---|---|---|---|---|---|---|---|---|---|---|---|---|---|---|---|---|---|---|---|---|
| 07 | 08 | 09 | 10 | 11 | 12 | 13 | 14 | 15 | 16 | 17 | 18 | 19 | 20 | 21 | 22 | 23 | 00 | 01 | 02 | 03 | 04 | 05 | 06 | |
| Site 1 | 15.36 | 16.88 | 17.85 | 21.25 | 21.98 | 23.69 | 23.76 | 23.69 | 23.47 | 22.50 | 21.43 | 20.95 | 18.52 | 17.80 | 17.47 | 15.90 | 15.31 | 13.80 | 13.66 | 13.50 | 13.47 | 12.71 | 12.89 | 13.10 |
| Site 2 | 14.92 | 16.55 | 17.58 | 21.02 | 21.74 | 23.43 | 23.43 | 23.28 | 23.02 | 22.05 | 21.00 | 20.58 | 18.21 | 17.51 | 17.15 | 15.54 | 14.89 | 13.35 | 13.18 | 13.01 | 12.96 | 12.20 | 12.35 | 12.60 |
| Site 3 | 14.45 | 16.04 | 17.12 | 20.64 | 21.46 | 23.21 | 23.26 | 23.15 | 22.92 | 21.95 | 20.87 | 20.42 | 18.02 | 17.28 | 16.88 | 15.23 | 14.53 | 12.95 | 12.76 | 12.58 | 12.55 | 11.83 | 12.01 | 12.22 |
| Site 4 | 18.89 | 20.19 | 21.27 | 25.08 | 26.00 | 28.12 | 28.37 | 28.52 | 28.53 | 27.86 | 26.94 | 26.36 | 23.62 | 22.90 | 22.58 | 21.02 | 20.42 | 18.75 | 18.46 | 18.14 | 17.88 | 16.77 | 16.65 | 16.72 |
| Site 5 | 20.30 | 21.60 | 22.39 | 25.74 | 26.46 | 28.33 | 28.51 | 28.57 | 28.46 | 27.65 | 26.76 | 26.31 | 23.87 | 23.27 | 22.94 | 21.41 | 20.85 | 19.26 | 19.07 | 18.84 | 18.68 | 17.67 | 17.64 | 17.83 |
| Site 6&7 | 19.83 | 21.11 | 22.03 | 25.51 | 26.29 | 28.26 | 28.50 | 28.64 | 28.62 | 27.93 | 27.12 | 26.69 | 24.14 | 23.47 | 23.08 | 21.46 | 20.84 | 19.19 | 18.96 | 18.71 | 18.53 | 17.51 | 17.48 | 17.57 |
| Statistics | Max | Min | Mean | SD | 5% | 25% | 50% | 75% | 95% | Max | Min | Mean | SD | 5% | 25% | 50% | 75% | 95% | ||||||
| Site 1 | 34.34 | 1.58 | 21.07 | 7.21 | 8.51 | 15.24 | 21.98 | 27.32 | 31.10 | 29.04 | 0.95 | 14.84 | 6.39 | 4.71 | 9.28 | 15.67 | 19.91 | 24.60 | ||||||
| Site 2 | 34.13 | 1.21 | 20.72 | 7.19 | 8.09 | 14.89 | 21.68 | 26.98 | 30.64 | 28.84 | 0.71 | 14.41 | 6.32 | 4.43 | 8.94 | 15.19 | 19.31 | 24.30 | ||||||
| Site 3 | 33.84 | 1.36 | 20.46 | 7.12 | 7.90 | 14.80 | 21.29 | 26.67 | 30.32 | 28.51 | 0.93 | 14.07 | 6.21 | 4.29 | 8.67 | 14.79 | 18.75 | 24.05 | ||||||
| Site 4 | 38.29 | 4.23 | 25.51 | 7.48 | 11.85 | 19.78 | 26.41 | 32.11 | 35.83 | 34.22 | 3.86 | 19.49 | 6.89 | 8.43 | 13.62 | 20.08 | 24.91 | 30.14 | ||||||
| Site 5 | 37.84 | 4.95 | 25.92 | 7.01 | 13.39 | 20.43 | 26.91 | 32.09 | 35.53 | 34.03 | 4.43 | 20.11 | 6.74 | 9.24 | 14.31 | 20.73 | 25.56 | 30.29 | ||||||
| Site 6&7 | 38.26 | 4.39 | 25.88 | 7.31 | 12.73 | 20.14 | 26.88 | 32.35 | 35.81 | 34.55 | 3.96 | 20.08 | 6.88 | 8.94 | 14.20 | 20.80 | 25.48 | 30.63 | ||||||
Daytime and nighttime changes of WS for each candidate site. The ERA5 monthly averaged reanalysis by hour of day is used.
| Daytime | Nighttime | |||||||||||||||||||||||
|---|---|---|---|---|---|---|---|---|---|---|---|---|---|---|---|---|---|---|---|---|---|---|---|---|
| Hour | 07 | 08 | 09 | 10 | 11 | 12 | 13 | 14 | 15 | 16 | 17 | 18 | 19 | 20 | 21 | 22 | 23 | 00 | 01 | 02 | 03 | 04 | 05 | 06 |
| Site 1 | 1.11 | 1.55 | 1.86 | 1.91 | 1.90 | 1.96 | 2.14 | 2.36 | 2.61 | 2.84 | 2.95 | 2.85 | 2.64 | 2.41 | 2.09 | 1.79 | 1.54 | 1.31 | 1.25 | 1.20 | 1.16 | 1.11 | 1.05 | 0.97 |
| Site 2 | 1.15 | 1.26 | 1.39 | 1.50 | 1.70 | 2.02 | 2.42 | 2.76 | 3.01 | 3.14 | 3.11 | 2.84 | 2.48 | 2.14 | 1.79 | 1.48 | 1.25 | 1.01 | 0.96 | 0.96 | 0.99 | 1.04 | 1.09 | 1.13 |
| Site 3 | 0.92 | 1.13 | 1.44 | 1.73 | 2.00 | 2.32 | 2.74 | 3.13 | 3.45 | 3.64 | 3.59 | 3.23 | 2.75 | 2.31 | 1.87 | 1.48 | 1.18 | 0.91 | 0.81 | 0.77 | 0.77 | 0.79 | 0.82 | 0.86 |
| Site 4 | 2.21 | 2.80 | 3.36 | 3.48 | 3.32 | 3.10 | 3.14 | 3.31 | 3.56 | 3.80 | 3.90 | 3.75 | 3.43 | 3.21 | 3.07 | 3.01 | 2.95 | 2.74 | 2.67 | 2.60 | 2.53 | 2.44 | 2.31 | 2.15 |
| Site 5 | 1.88 | 2.34 | 2.81 | 2.99 | 2.99 | 2.92 | 2.96 | 3.07 | 3.20 | 3.25 | 3.03 | 2.62 | 2.36 | 2.26 | 2.23 | 2.22 | 2.20 | 2.10 | 2.08 | 2.07 | 2.05 | 2.00 | 1.94 | 1.85 |
| Site 6&7 | 1.66 | 2.05 | 2.45 | 2.52 | 2.46 | 2.42 | 2.55 | 2.71 | 2.86 | 2.94 | 2.84 | 2.57 | 2.31 | 2.19 | 2.11 | 2.05 | 1.99 | 1.83 | 1.79 | 1.78 | 1.78 | 1.76 | 1.71 | 1.63 |
| Statistics | Max | Min | Mean | SD | 5% | 25% | 50% | 75% | 95% | Max | Min | Mean | SD | 5% | 25% | 50% | 75% | 95% | ||||||
| Site 1 | 5.50 | 0.07 | 2.17 | 1.04 | 0.68 | 1.37 | 2.06 | 2.84 | 4.12 | 4.76 | 0.05 | 1.54 | 0.85 | 0.57 | 0.98 | 1.33 | 1.79 | 3.51 | ||||||
| Site 2 | 5.30 | 0.03 | 2.19 | 1.10 | 0.52 | 1.35 | 2.10 | 2.96 | 4.18 | 4.63 | 0.03 | 1.36 | 0.85 | 0.31 | 0.77 | 1.22 | 1.63 | 3.33 | ||||||
| Site 3 | 5.93 | 0.00 | 2.45 | 1.32 | 0.53 | 1.35 | 2.34 | 3.39 | 4.85 | 5.07 | 0.02 | 1.28 | 0.97 | 0.29 | 0.66 | 0.97 | 1.50 | 3.59 | ||||||
| Site 4 | 6.67 | 0.44 | 3.31 | 1.13 | 1.54 | 2.50 | 3.24 | 4.14 | 5.22 | 5.85 | 0.54 | 2.76 | 0.95 | 1.48 | 2.00 | 2.62 | 3.42 | 4.49 | ||||||
| Site 5 | 5.38 | 0.72 | 2.84 | 0.88 | 1.49 | 2.16 | 2.78 | 3.51 | 4.33 | 3.94 | 0.52 | 2.11 | 0.52 | 1.34 | 1.74 | 2.07 | 2.44 | 3.04 | ||||||
| Site 6&7 | 4.84 | 0.28 | 2.50 | 0.84 | 1.20 | 1.85 | 2.48 | 3.15 | 3.87 | 3.82 | 0.46 | 1.91 | 0.55 | 1.15 | 1.49 | 1.85 | 2.25 | 2.92 | ||||||
3.1 Air temperature
Air temperature is an atmospheric parameter that directly affects the telescope’s detectors, for example the charge coupled device (CCD) and mirror (Lowne 1979; Zhang et al. 2015). An increase or decrease in the ambient AT by an amount greater than 2 °C or less than −2 °C than the telescope mirror temperature degrades seeing and affects the imaging performance of the telescope (Lowne 1979; Volkmer et al. 2003; Dalrymple, Oschmann & Hubbard 2004; Banyal & Ravindra 2011). Moreover, the large-scale variations of AT lead to pressure gradients and winds that play a significant role in promoting atmospheric turbulence, which affects the operation of the telescope and leads to bad seeing (e.g. Lowne 1979; Davies & Kasper 2012). In addition to the operation of optical telescopes, AT is expected to have a serious influence on radio telescopes, leading to thermal deformation of their mechanical structures (Otárola et al. 2019). Thus, analysing the temperature at the chosen observatory locations is very important to interpret and understand the temperature gradient and variation.
Table 2 clearly highlights that there is no significant variation in the AT at the nighttime in all the candidate sites. The minimum AT value recorded is found to be in the range from 0.7 °C to 4 °C, while for 95 per cent of the nights the AT ranges between 24 °C and 30 °C. Compared with the Very Large Telescope (VLT) at the Paranal Observatory, these values are aligning with safe operation conditions.
Fig. 4 illustrates the monthly climate average of the 2-m temperature for the proposed seven sites; sites 1, 2, and 3 have lower temperatures than sites 4, 5, and 6&7 over the year. Furthermore, for all sites, the minimum temperature is observed during winter and gradually increases during spring followed by autumn, while the maximum temperature is seen during summer, as shown in Table 4. In addition, the lowest annual climate average temperature (16.94 °C) is detected at site 3, while the highest (22.94 °C) is observed at site 5.
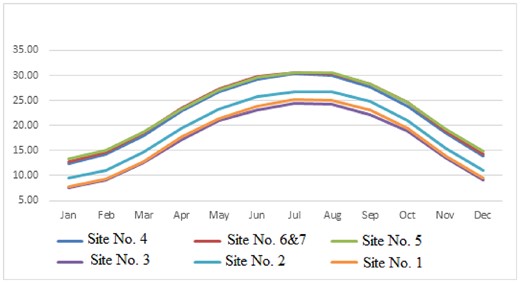
Monthly average of the AT during the period from 1979 to 2019 over the candidate sites.
List of the climatological parameters, both monthly and annual averages, over the candidate sites.
| Month | Site 1 | Site 2 | Site 3 | Site 4 | Site 5 | Site 6&7 | |
|---|---|---|---|---|---|---|---|
| T (°C) | Jan | 7.77 | 9.47 | 7.63 | 12.44 | 13.35 | 12.83 |
| Feb | 9.28 | 11.02 | 9.12 | 14.27 | 15.05 | 14.67 | |
| Mar | 12.82 | 14.61 | 12.55 | 18.02 | 18.62 | 18.53 | |
| Apr | 17.69 | 19.39 | 17.25 | 22.84 | 23.27 | 23.47 | |
| May | 21.47 | 23.23 | 20.96 | 26.83 | 27.19 | 27.4 | |
| Jun | 23.87 | 25.73 | 23.16 | 29.29 | 29.69 | 29.76 | |
| Jul | 25.14 | 26.78 | 24.47 | 30.32 | 30.64 | 30.61 | |
| Aug | 25.08 | 26.67 | 24.26 | 30.08 | 30.5 | 30.4 | |
| Sep | 23.19 | 24.77 | 22.21 | 27.76 | 28.32 | 28.36 | |
| Oct | 19.43 | 20.96 | 18.88 | 23.97 | 24.56 | 24.65 | |
| Nov | 13.87 | 15.51 | 13.6 | 18.5 | 19.21 | 18.99 | |
| Dec | 9.48 | 11.09 | 9.23 | 13.9 | 14.84 | 14.35 | |
| Annual | 17.42 | 19.1 | 16.94 | 22.35 | 22.94 | 22.84 | |
| WS-10m (m s−1) | Jan | 2.42 | 2.53 | 2.82 | 3.35 | 3.07 | 2.66 |
| Feb | 2.7 | 2.67 | 3.11 | 3.62 | 3.26 | 2.93 | |
| Mar | 2.87 | 2.93 | 3.23 | 3.83 | 3.39 | 3.12 | |
| Apr | 2.92 | 3.05 | 3.22 | 3.89 | 3.41 | 3.18 | |
| May | 2.99 | 3.17 | 3.29 | 4.14 | 3.51 | 3.25 | |
| Jun | 3.16 | 3.4 | 3.54 | 4.83 | 3.96 | 3.55 | |
| Jul | 2.8 | 3.15 | 3.27 | 4.27 | 3.68 | 3.22 | |
| Aug | 2.68 | 3.09 | 3.16 | 4.3 | 3.73 | 3.23 | |
| Sep | 2.6 | 3.08 | 2.98 | 4.27 | 3.57 | 3.07 | |
| Oct | 2.24 | 2.79 | 2.53 | 3.38 | 3 | 2.58 | |
| Nov | 2.19 | 2.64 | 2.51 | 3.17 | 2.87 | 2.47 | |
| Dec | 2.24 | 2.52 | 2.59 | 3.21 | 2.95 | 2.52 | |
| Annual | 2.65 | 2.92 | 3.02 | 3.86 | 3.37 | 2.98 | |
| WD-10m (deg) | Jan | 283.84 | 90.16 | 279.66 | 322.62 | 314.13 | 309.71 |
| Feb | 285.22 | 196.79 | 283.7 | 322.34 | 316.15 | 294.94 | |
| Mar | 293.69 | 223.09 | 294.49 | 327.41 | 325.53 | 293.78 | |
| Apr | 304.77 | 263.96 | 308.09 | 271.54 | 327.28 | 270.34 | |
| May | 320.61 | 247.03 | 321.56 | 272.53 | 336.81 | 277.83 | |
| Jun | 263.39 | 118.94 | 321.25 | 342.26 | 335.66 | 338.99 | |
| Jul | 330.43 | 239.13 | 343.54 | 343.2 | 330.84 | 333.95 | |
| Aug | 299.83 | 132.62 | 348.05 | 342.36 | 329.27 | 334.11 | |
| Sep | 141.83 | 36.03 | 199.03 | 334.11 | 332.95 | 315.34 | |
| Oct | 214.16 | 43.7 | 229.72 | 191.15 | 336.41 | 169.64 | |
| Nov | 173.84 | 56.23 | 191.05 | 287.6 | 330.63 | 166.95 | |
| Dec | 229 | 63.81 | 256.65 | 324.68 | 319.47 | 226.89 | |
| Annual | 261.72 | 142.62 | 281.4 | 306.82 | 327.93 | 277.71 | |
| RH-2m (%) | Jan | 46.33 | 47.37 | 52.29 | 47.33 | 44.35 | 42.62 |
| Feb | 41.81 | 42.24 | 46.69 | 39.81 | 38.09 | 35.8 | |
| Mar | 36.64 | 36.18 | 40.82 | 33.79 | 33.09 | 30.26 | |
| Apr | 28.59 | 28.22 | 32.22 | 26.71 | 26.8 | 23.99 | |
| May | 27.73 | 27.06 | 31.37 | 24.7 | 24.83 | 22.5 | |
| Jun | 28.71 | 28.02 | 33.47 | 25.36 | 25.07 | 23.15 | |
| Jul | 30.97 | 30.63 | 35.83 | 27.98 | 27.89 | 25.77 | |
| Aug | 33.9 | 33.54 | 39.87 | 30.35 | 29.92 | 27.74 | |
| Sep | 37.5 | 37.33 | 45.43 | 34.37 | 33.35 | 30.57 | |
| Oct | 40.88 | 40.93 | 47.77 | 40.1 | 39 | 35.16 | |
| Nov | 44.3 | 44.34 | 49.82 | 45.56 | 43.65 | 40.45 | |
| Dec | 44.95 | 46.01 | 51.29 | 49.02 | 45.41 | 43.73 | |
| Annual | 36.86 | 36.82 | 42.24 | 35.42 | 34.29 | 31.81 | |
| PWV (mm) | Jan | 5.4 | 6.48 | 5.96 | 7.87 | 8.23 | 7.37 |
| Feb | 5.59 | 6.58 | 6.12 | 7.85 | 8.18 | 7.36 | |
| Mar | 6.48 | 7.31 | 6.98 | 8.69 | 9.1 | 8.21 | |
| Apr | 7.72 | 8.47 | 8.21 | 9.96 | 10.48 | 9.48 | |
| May | 9.69 | 10.42 | 10.22 | 12.36 | 12.95 | 11.83 | |
| Jun | 8.96 | 9.68 | 9.46 | 11.41 | 11.9 | 10.8 | |
| Jul | 10.5 | 11.39 | 10.95 | 13.54 | 14.54 | 13.1 | |
| Aug | 11.69 | 12.61 | 12.2 | 14.72 | 15.92 | 14.31 | |
| Sep | 10.92 | 11.83 | 11.6 | 13.65 | 14.74 | 13.17 | |
| Oct | 10.45 | 11.39 | 11.22 | 13.76 | 14.84 | 13.1 | |
| Nov | 7.85 | 8.99 | 8.54 | 10.76 | 11.42 | 10.14 | |
| Dec | 6.06 | 7.18 | 6.68 | 8.77 | 9.13 | 8.18 | |
| Annual | 8.44 | 9.36 | 9.01 | 11.11 | 11.79 | 10.59 | |
| TCC (fractions) | Jan | 0.28 | 0.25 | 0.32 | 0.21 | 0.19 | 0.2 |
| Feb | 0.24 | 0.22 | 0.27 | 0.19 | 0.18 | 0.18 | |
| Mar | 0.21 | 0.2 | 0.24 | 0.18 | 0.17 | 0.17 | |
| Apr | 0.19 | 0.17 | 0.2 | 0.17 | 0.16 | 0.16 | |
| May | 0.17 | 0.15 | 0.17 | 0.15 | 0.15 | 0.15 | |
| Jun | 0.02 | 0.02 | 0.02 | 0.02 | 0.02 | 0.02 | |
| Jul | 0.01 | 0.01 | 0.02 | 0.01 | 0.02 | 0.02 | |
| Aug | 0.02 | 0.01 | 0.03 | 0.01 | 0.01 | 0.01 | |
| Sep | 0.04 | 0.02 | 0.08 | 0.02 | 0.02 | 0.02 | |
| Oct | 0.13 | 0.09 | 0.16 | 0.08 | 0.09 | 0.08 | |
| Nov | 0.22 | 0.19 | 0.26 | 0.18 | 0.17 | 0.17 | |
| Dec | 0.28 | 0.26 | 0.32 | 0.24 | 0.22 | 0.23 | |
| Annual | 0.15 | 0.13 | 0.17 | 0.12 | 0.12 | 0.12 |
3.2 Wind speed and wind direction
Wind gusts or strong winds represent a critical hazard for the telescope’s instruments and therefore constrain the telescope’s operation (Tovmassian et al. 2016). The right panels in Fig. 5 display the histograms of the WS for all the candidate sites.
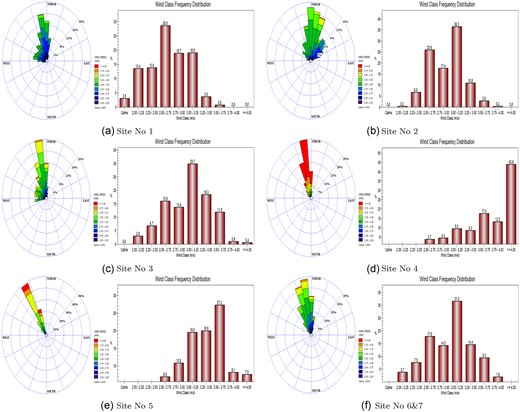
Wind rose density (left) and WS histograms (right) for each site during the period from 1979 to 2019.
The higher temporal resolution analysis for WS illustrated in Table 3 indicates that the nighttime maximum value for the candidate sites is in the range of 3.8–5.2 m s−1.
However, the maximum monthly average WS value is found to be 3.86 m s−1 at site 4, while site 1 shows the minimum WS measurement as 2.65 m s−1. These results (either the hourly or the monthly average) are in all cases lower than the safe operation limit (15 m s−1) suggested by Murdin (1985). This also agrees with the best condition to operate the VLT at the Paranal Observatory (<12 m s−1). Table 4 lists the monthly as well as the annual WS average measurements. As can be seen from Table 4, the WS values are slightly higher in the summer compared to winter.
Another important wind parameter is its direction. For astronomical observations, the stability of the wind direction is important, as it leads to the stability of both airflow and local turbulence (Geissler & Masciadri 2006).
The annual climate wind roses (Fig. 5, left panels) illustrate that the dominant wind direction for most of the candidate sites is north to north-west, which could provide a stable local turbulence. While we currently lack the means to present our own graph (due to the lack of seeing measurements), we find support for the link between wind direction and seeing in the work of Tillayev et al. (2023).
3.3 Relative humidity
In order to test the effect of moisture and water condensation on the telescope’s main mirror, instruments and, consequently, astronomical image quality (Radu et al. 2012), it is necessary to measure the RH. The safety limit for the RH – at which astronomical observations might be stopped – is ≥ 70 per cent at Paranal Observatory (Chile).
Fig. 6 shows the monthly RH at 2-m measurements for the candidate sites. The four sites (4, 5, 6 and 7) which are located north-west of the Red Sea (West of Hurghada) appear to have RH values lower and better than the other sites (i.e. 1, 2, and 3). Table 4 lists the annual as well as the monthly average values, where the summer months seem to have the best RH values. The annual average RH for all sites indicates that the RH is in general lower than 50 per cent.
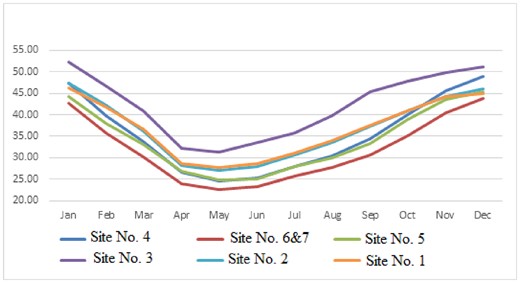
Monthly average of the RH during the period from 1979 to 2019 over the candidate sites.
3.4 Precipitable water vapour
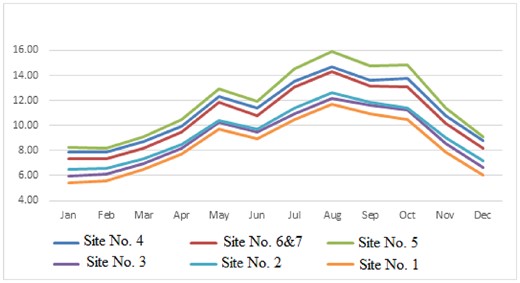
PWV is defined as the mass of the water for a column of unit size integrated from the surface to the top of the atmosphere. This atmospheric parameter is a crucial factor for telescopes operating at mid-infrared and submillimetre regimes (Chamberlin 2001; Otárola et al. 2010).
Fig. 7 shows the variation of the monthly averages of the PWV values where sites 1, 2, and 3 exhibit the lowest measurements, especially during winter. The annual values listed in Table 4 indicate that site 1 has the best PWV followed by site 3.
Monthly average of the PWV during the period from 1979 to 2019 over the candidate sites.
3.5 Total cloud coverage
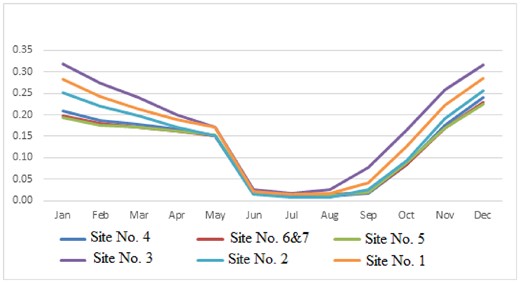
A fundamental and most important parameter for ground-based optical astronomical telescope site selection is the TCC (e.g. Sarazin, Graham & Kurlandczyk 2006; Varela et al. 2008; Aksaker et al. 2020). The presence of a high percentage of clouds over a certain site would lead to observations being stopped. The monitoring of cloud coverage is usually conducted through different methods, including all-sky cameras, satellite monitoring and naked-eye observations (Wang et al. 2020).
Fig. 8 shows the monthly TCC over all candidate sites. In addition, Table 2 displays the number of clear nights for each site during 2019 and the climate period 1979–2019, and Table 4 lists the monthly and annual climate averages of TCC. It is obvious that the TCC is lower in summer than other seasons, followed by autumn, and the highest TCC is detected in winter. It is also noted that the Red Sea sites (4, 5, and 6&7) have better TCC in comparison with the Sinai sites (1, 2, and 3).
Monthly average of the TCC during the period from 1979 to 2019 over the candidate sites.
3.6 Clear nights at each site
The quality of an optical astronomical observatory is significantly affected by the number of clear nights per year. The assessment of whether a night is adequately clear can be directly made by evaluating the level of cloud coverage. To estimate the number of clear nights per year, we followed the definition of clear nights by Ehgamberdiev et al. (2000), where a clear night should have cloud coverage of less than 25 per cent. The ERA5 night hourly data (from 6 pm to 4 am, local time) during 2019 is used to investigate this parameter.
Table 5 gives the number of clear nights per year for each site alongside their respective ratios. Among the potential locations, site 2 emerged with the highest count of clear nights at 302, followed by site 4. Although the number of clear nights at the other sites falls below that of sites 2 and 4, they too merit consideration as viable candidates for building an observatory due to their cloud coverage. Nonetheless, it is imperative to undertake further measurements and procedures to illustrate the quality of photometric observations at each site, as detailed in Kerber, Querel & Hanuschik (2014).
Number of clear nights for each site during 2019.
| ID | Number of clear nights | Ratio |
|---|---|---|
| 1 | 289 | 79.18% |
| 2 | 302 | 82.74% |
| 3 | 276 | 75.62% |
| 4 | 294 | 80.55% |
| 5 | 290 | 79.45% |
| 6&7 | 290 | 79.45% |
| ID | Number of clear nights | Ratio |
|---|---|---|
| 1 | 289 | 79.18% |
| 2 | 302 | 82.74% |
| 3 | 276 | 75.62% |
| 4 | 294 | 80.55% |
| 5 | 290 | 79.45% |
| 6&7 | 290 | 79.45% |
3.7 Aerosol optical depth
One of the important parameters used to characterize astronomical sites is the atmospheric extinction, which directly affects the sky transparency and consequently the quality of astronomical observations. Such an extinction is mainly caused by either precipitable water vapour or aerosols.
Atmospheric aerosols comprise a wide range of particle types with different compositions, sizes, shapes, and properties. Aerosols are ubiquitous in air and are often observable as dust, smoke, and haze. Their sizes occupy a wide range covering from 10−2 to about 102μm, where the most effective size in attenuating sunlight is in the range 0.1–1 μm (Ranjan et al. 2007). The amount of aerosols in the atmosphere is usually quantified by mass concentration or by an optical measure – the AOD – which is affected by various factors such as aerosol sources, weather conditions, landscape, and regional differences.
The AOD is the measurement of the total aerosols distributed through a column of air extending from the Earth’s surface to the top of the atmosphere. Usually numerical models and in situ observations use mass concentration as the primary measure of aerosol loading, whereas most remote sensing methods retrieve the AOD (Varela et al. 2008; Chin, Kahn & Schwartz 2009).
Because of the lack of in situ observations, the remote sensing technique has been used in this work to estimate the AOD values over the candidate sites. The AOD data were collected from the Modern-Era Retrospective analysis for Research and Applications version 2 (MERRA-2; https://disc.gsfc.nasa.gov/datasets/M2TMNXAER_5.12.4/summary).
These data are monthly averages with a spatial resolution of 0|${_{.}^{\circ}}$|5 × 0|${_{.}^{\circ}}$|625 at the visual (550 nm) wavelength during the period 2018 October to 2020 October. Fig. 9 displays the average distribution of the AOD over Egypt including our candidate sites marked with black pins. This figure clearly shows that the proposed sites have good AOD measurements in comparison with the other parts of Egypt.
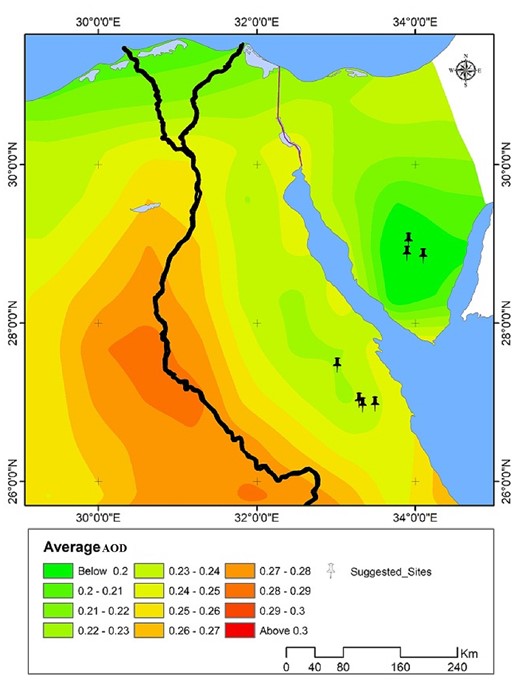
Map of average AOD measurements over Egypt during the period Oct 2018 - October 2020, the black pins refer to our candidate sites.
More detailed analysis has been performed on the candidate sites and the results are shown in Fig. 10. We noticed that, of the seven sites, sites 2 and 3 have the lowest AOD values with an average of 0.181 and 0.184, respectively. Sites 1 and 4 come next with an average AOD of 0.186 and 0.223, respectively. Fig. 10 shows that the peak values occur during spring, which could be influenced by prevailing winds, notably the Elkhamaseen wind, while the lowest values are recorded during the winter. In addition to the wind, this pattern can be attributed to the effect of temperature on aerosol behaviour: warmer air causes aerosols to ascend, while cooler air leads them to descend (see Alam et al. 2015; Kohil, Saleh & Ghatass 2017; Elshora 2023). The notion of temperature’s impact on aerosol radiative effects finds substantiation in the work of Goldstein et al. (2009), although this insight coexists with conflicting findings presented by Li et al. (2023). Therefore, any noticeable link between AT and AOD is probably part of a complex system of interactions and needs further investigation.
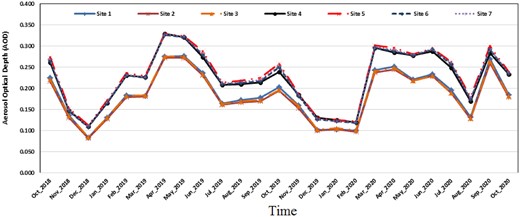
Average AOD values of the candidate sites during the period 2018 October to 2020 October at λ = 500 nm.
3.8 Night sky brightness
The most helpful way to estimate the impact of light pollution is to measure the NSB, from the ground location for the candidate site. There are various ways and devices to measure the NSB. One of the most widely and easiest devices used to measure the brightness of the sky is the SkysQuaqity Metmr (SQM). Because of the lack of on-site monitoring of the NSB, we relay on the zenith sky brightness from the 2015 World Atlas of VIIRS measured in mag arcsec−2. The results of the seven candidate sites are listed in Table 6.
NSB measurements over our candidate sites as extracted from the VIIRS 2015 World Atlas.
| Site | NSB (mag arcsec−2) |
|---|---|
| 1 | 21.97 |
| 2 | 21.97 |
| 3 | 21.98 |
| 4 | 21.96 |
| 5 | 21.89 |
| 6 | 21.94 |
| 7 | 21.93 |
| Site | NSB (mag arcsec−2) |
|---|---|
| 1 | 21.97 |
| 2 | 21.97 |
| 3 | 21.98 |
| 4 | 21.96 |
| 5 | 21.89 |
| 6 | 21.94 |
| 7 | 21.93 |
Table 6 indicates that the NSB value at all the candidate sites is good, although the first four sites are slightly darker than the other sites.
4 SEISMIC HAZARDS
For the safe design and operation of the observatory, it is preferable to select a site with low levels of seismic hazard, characterized by low seismicity, low ground-shaking intensity, and a safe distance from faults. Therefore, a comprehensive understanding and assessment of seismic input or seismic hazard, including ground motion peak parameters and response spectra (RS), are crucial for the selection of suitable sites in a multiparameter study. If multiple sites have similar observational, astronomical, and accessibility qualities, they may differ in terms of the severity of ground-shaking intensities, such as peak ground acceleration, maximum acceleration and RS, which require varying levels of seismic fortification and incur higher costs.
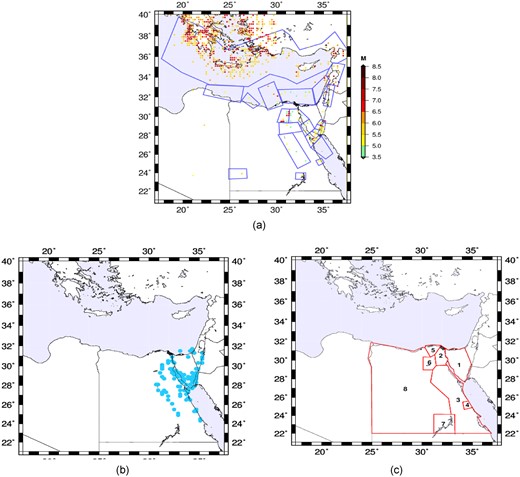
Engineers also require seismic input to construct structures with seismic resistance that ensure good performance and protection during earthquakes, minimizing risks, and safeguarding scientists and, potentially, expensive instruments and technologies. Simultaneously, it is important to ensure the functionality of the observatory during earthquake events. Therefore, a reliable seismic hazard assessment (SHA) is essential, employing physics-based multiscenario seismic hazard analysis to mitigate future losses. The candidate sites are located in a region known for relatively high levels of seismic hazard, including the north Red Sea and the gulfs of Suez and Aqaba (Mohamed et al. 2012; Sawires et al. 2016; Hassan et al. 2017a,, b). The seismicity map for the proposed sites is shown in Fig. 11.
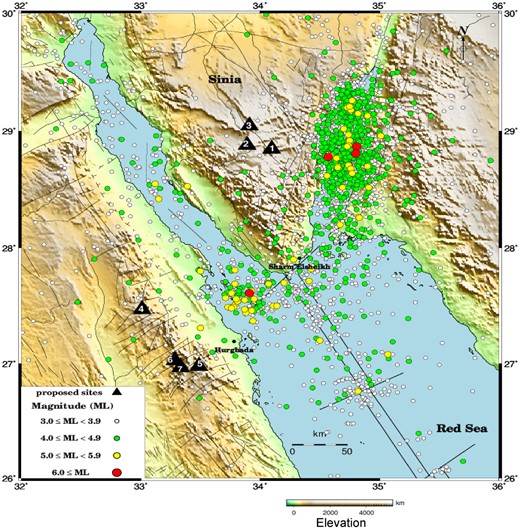
Locations of the proposed sites (black triangles) combined with seismicity (up to 2020) and surface faults in the region.
During the last decades, significant earthquakes have hit the Gulf of Aqaba, Gulf of Suez and northern Red Sea. Seismicity and seismotectonic setting of these sources have been studied by many (e.g. Ali & Badreldin 2019; Badawy et al. 2020; Badreldin et al. 2022) in order to get a better understanding of the present-day stress regime for them.
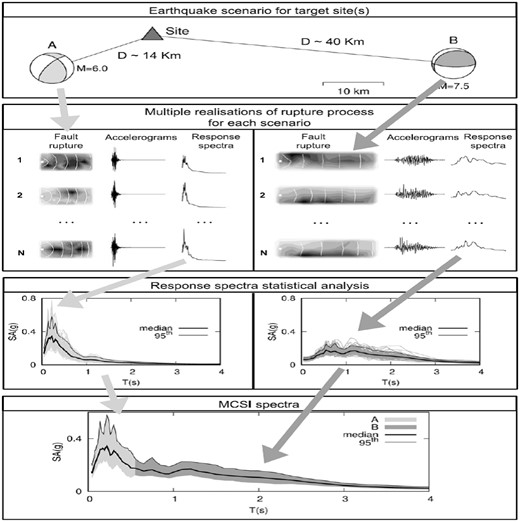
In this study, the Neo-Deterministic Seismic Hazard Analysis (NDSHA) approach is utilized to provide the seismic input parameters required for the multiparameter study in the site selection of a new ground-based telescope. A detailed description of the NDSHA methodology can be found in Panza, Romanelli & Vaccari (2001), and its updates and validations in Panza et al. (2012) and Magrin et al. (2016). The NDSHA approach enables the estimation of ground motion parameters, such as maximum acceleration, velocity, displacement, and RS, with a high degree of reliability. It utilizes information about potential seismic sources, seismicity, and the mechanical properties of the medium between these sources and the sites of interest; for further details, refer to Panza, Romanelli & Vaccari (2001), Panza et al. (2012), Bela, Kossobokov & Panza (2012), Magrin et al. (2016), Hassan et al. (2017b), Panza & Bela (2020), and Kossobokov & Panza (2022). NDSHA employs scenario-based methods for seismic hazard analysis, constructing realistic synthetic time series for earthquake scenarios. It is particularly suitable for computing ground motion parameters at 1 and 10 Hz cut-off frequencies for a set of one-dimensional structural models at epicentral distances greater than the focal depth of the source, at different spatial scales (see Fig. 12). Starting from the available knowledge about Earth’s structure and the propagation of seismic waves, as well as information about seismic sources and seismicity in the study area, it is possible to realistically compute synthetic seismograms. These synthetic seismograms allow the quantification of relevant parameters such as ground motion acceleration, velocity, displacement, and other parameters important for seismic engineering (e.g. percentiles, resultant, maximum).
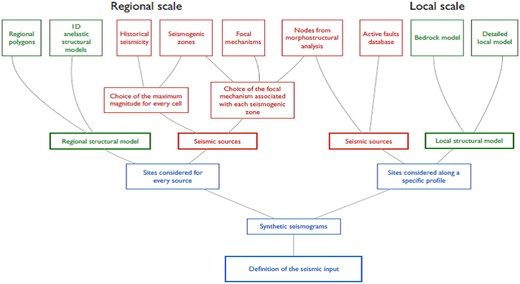
Flow chart of the different steps in the NDSHA approach for the regional-scale analysis.
4.1 Input parameters for NDSHA computation
In the current work, input data for seismic hazard assessment in the NDSHA framework are taken from Hassan et al. (2017b) and then updated. These data are then used to compute the seismic input (maximum acceleration) at the sites of interest for the purpose of multiparameter site selection for an astronomical observatory. The ground motion maps for Egypt were computed by Hassan et al. (2017b), utilizing revised and up-to-date input data, including an earthquake catalogue, seismotectonic zones with their representative focal mechanisms, and structural models (Fig. 13). In the current work, we found that the earthquake catalogue is the only component that should be upgraded as more data are available. The earthquake catalogue used by the NDSHA package requires the availability, as complete as possible, of earthquakes with Mw ≥ 5, which are capable of generating significant ground motion. The initial data set is the earthquake catalogue of Hassan et al. (2017b), updated to 2020, with a proper comparison with other available historical or instrumental earthquake catalogues from national1 and international2 sources. All this information has been used to compile a uniform and, as much as possible, complete earthquake catalogue (smoothed seismicity is shown in Fig. 13a). The pre-instrumental earthquake catalogue is taken from the revised and quality-controlled catalogue of NRIAG. The instrumental earthquake catalogue is compiled using all available national (either published or unpublished) and international catalogues, as well as existing publications about seismicity and source mechanisms. The earthquake’s magnitude is converted into the moment magnitude (Mw) scale for homogenization purposes (Fig. 13a). Hassan et al. (2017b) have defined 20 zones based on the available information, such as earthquake catalogues, refined focal mechanism solutions, surface geology, geophysical studies, surface faults, GPS data, crustal structure, and other related studies. In this work, seismogenic zone models from the work of Hassan et al. (2017b) combined with seismogenic nodes (earthquake-prone areas) were obtained based on morphostructural analysis and pattern recognition techniques (Gorshkov, Hassan & Novikova 2019; Gorshkov et al. 2022; see Figs 13a and 13b). According to the geological maps available for the study area, the proposed sites are located in mountainous areas dominated by igneous and metamorphic rock. Therefore, a structural model at the rock site is sufficient for hazard computation. In this work, eight average anelastic structural polygons are delineated by Hassan et al. (2017b) based on all the available crustal structure data from seismic reflection and gravity surveys, as well as the velocity models adopted by the Egyptian National Seismological Network (ENSN) and NRIAG for earthquake locations in Egypt (Fig. 13c).
(a) Earthquake catalogue Mw ≥ 5 up to 2020 plotted with the seismogenic zone model; (b) seismogenic nodes; (c) crustal structure model.
4.2 Seismic hazard input parameters
The synthetic seismograms have been computed at a 10-Hz cut-off frequency, and the seismic sources within the seismogenic zones are treated with proper seismic source approximation (Parvez, Romanelli & Panza 2011), combining the input parameters described above. The maximum acceleration or 95th percentile (hereafter referred to as A) values for the seven sites were computed for the vertical and horizontal components. Then, the maximum value at each site is extracted and plotted in Fig. 14. The map of maximum acceleration indicates that sites 1, 2, and 5 are exposed to high seismic hazards relative to the other sites (red circles in Fig. 14). Sites 6 and 7 are subjected to moderate seismic hazard (orange circles in Fig. 14), while sites 3 and 4 are exposed to low seismic hazard (yellow circles in Fig. 14). For earthquake engineering purposes, the maximum credible seismic input (MCSI) represents a reliable estimation of the expected ground-shaking level for a specific site, independent of the occurrence of earthquakes that could affect the investigated area. In NDSHA, thousands of ground motion time histories needed for engineering analysis are simulated, and all of these parameters can be summarized in the MCSI. It provides a reliable estimation of the upper-bound level of shaking that could occur at a selected site, neglecting the probability of occurrence. The aim is to define a reliable and effective design seismic input (Fasan 2017; Rugarli, Vaccari & Panza 2019). Regarding the physical definition of the MCSI response spectrum, it is thoroughly described in Fasan (2017) and Rugarli, Vaccari & Panza (2019). According to this definition, for each seismogenic source, n-scenarios (in terms of magnitude, epicentral distance, and focal mechanism of the earthquake) have been considered, and the obtained spectral acceleration (SA) values are compared, selecting the maximum median. In this study, the MCSI is computed at bedrock (MCSIBD) with a 10-Hz cut-off frequency for all the selected sites shown in Fig. 12. Because of the complexity of the rupture process on a fault (and the implicit impossibility of deterministically predicting future events), a hundred of its kinematic realizations have been used. The results, including the median and 95th percentile (median +2σ) of the computed MCSI at the selected sites (sites 1 to 7), are shown in Fig. 16. These curves represent the response spectra developed by combining the results of all individual scenarios within the area of influence, considering a hundred rupture realizations and 5 per cent damping. The computed MCSI spectra at sites 1, 2, and 5 (Figs 16a, b, and e, respectively) show high hazard at short periods (0.1–1.0 s). Site 5 also shows another peak at longer periods (1.3–3.0 s). Sites 6 and 7 (Figs 16f and g, respectively) exhibit two peaks, both indicating moderate seismic hazard. One peak occurs at short periods (0.1–1.0 s), and the other occurs at longer periods (1.3–3.0 s). Sites 3 and 4 (Figs 16c and d, respectively) experience low hazard and show peaks in the period range of 0.1–1.0 s, while site 4 shows an additional peak in the period range of 1.3–3.0 s. Considering the current results, the peak ground motion acceleration in Fig. 14, and the response spectra curves for all sites shown in Fig. 14, it can be concluded that site 3 poses the least seismic hazard. A summary of this section is presented in Table 7, where the sites are classified into three groups based on their expected hazard levels. This table can guide astronomers and decision-makers in making informed decisions about future observatory locations.
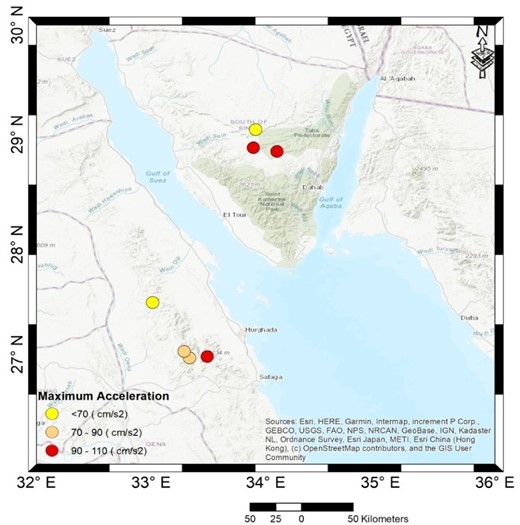
Peak ground motion acceleration map for the proposed sites. The red circles represent the highest seismic hazard sites, moderate seismic hazards are marked with orange circles while low seismic hazard sites are presented with yellow circles.
Description of the MCSI definition procedure.
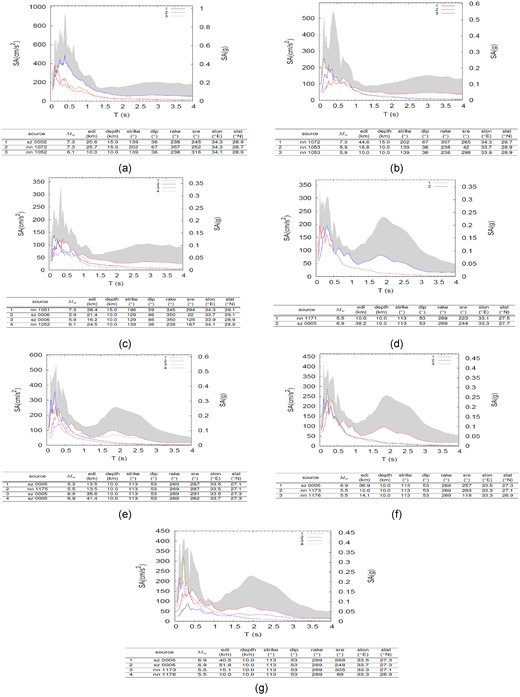
(a) The MCSIBD is set equal to the value of the 50th–95th percentile (shaded grey zone) for proposed sites 1 (a), 2 (b), 3 (c), 4 (d), 5 (e), 6 (f), and 7 (g), as shown in Fig. 11.
Seismic classification of the candidate sites.
| Site | Seismic hazard |
|---|---|
| 3 and 4 | Low |
| 6&7 | Moderate |
| 1, 2, and 5 | High |
| Site | Seismic hazard |
|---|---|
| 3 and 4 | Low |
| 6&7 | Moderate |
| 1, 2, and 5 | High |
Seismic classification of the candidate sites.
| Site | Seismic hazard |
|---|---|
| 3 and 4 | Low |
| 6&7 | Moderate |
| 1, 2, and 5 | High |
| Site | Seismic hazard |
|---|---|
| 3 and 4 | Low |
| 6&7 | Moderate |
| 1, 2, and 5 | High |
5 CONCLUSIONS AND RECOMMENDATIONS
After combining all the results from different parameters, we found that of the seven candidate sites, only four sites can satisfy the initial conditions for building a future Egyptian observatory (see Table 8). Nevertheless, we calculated the overall score of the estimated parameters over the four sites in order to evaluate them.
Overall score summary for the four proposed sites.
| Site | AOD | NSB | WS | Var(WD-10m) | RH | PWV | TCC | AT | A | Clear nights | Overall score |
|---|---|---|---|---|---|---|---|---|---|---|---|
| (mag arcsec−2) | (arcsec) | (m s−1) | (%) | (mm) | (fraction) | (°C) | (gal) | ||||
| 3 | 0.184 | 21.98 | 3.02 | 2784.3451 | 42.24 | 9.01 | 0.17 | 16.94 | 50.08 | 276 | 0.9128 |
| 4 | 0.223 | 21.96 | 3.86 | 1999.1101 | 35.42 | 11.11 | 0.12 | 22.35 | 61.52 | 294 | 0.8912 |
| 7 | 0.227 | 21.93 | 2.98 | 3607.1069 | 31.81 | 10.59 | 0.12 | 22.84 | 86.53 | 290 | 0.8571 |
| 2 | 0.181 | 21.97 | 2.92 | 7507.4972 | 36.82 | 9.36 | 0.13 | 19.1 | 93.44 | 302 | 0.8563 |
Table 8 summarizes the overall score of the best four selected sites. The values of all parameters involved are presented in the previous tables, except the wind direction (WD-10m). To consider the wind direction, we estimated the variance of its values across the year and we present the results in the fifth column, Var(WD-10m), while the letter A (tenth column) represents the ground motion acceleration (see Section 4.2). The scores are computed by averaging the normalized values of all parameters, as in Helmy et al. (2021), Helmy, Saad & Eid (2022), Hamdy, Elnagahy & Helmy (2019), Helmy, Elnagahy & Hamdy (2020), Eid et al. (2021), and Helmy & Choi (2022a, b, 2023). In particular, we can express the computation of the overall score as
Here, i = 1, … , NS, where NS is the number of sites, and Scorei indicates the overall score of each site.
The results clarify that site 3 has the best overall score of 0.9128 followed by site 4 with a score of 0.8912. Finally, sites 7 and 2 have almost the same scores of 0.8571 and 0.8563, respectively.
The results from this work provide are important for multiparameter site selection analysis and can guide decision-makers on which site is preferable from meteorological, observational, and earthquake hazard points of view.
Ultimately, on-site observations for the meteorological parameters, seeing with different tools, long-time light pollution observations, and detailed seismic hazard analysis for the new sites are highly recommended for further details of astronomical site selection as well as site testing.
ACKNOWLEDGEMENTS
The authors would like to express their appreciation to the anonymous reviewers for their valuable insights and suggestions, which have significantly improved the quality of this paper. The expertise and considerate feedback provided by the reviewers have contributed immensely to the refinement of the ideas presented in this paper.
We warmly thank Professors G. El-Qady (NRIAG’s Director), M. Nouh, H. Selim, Y. Azzam, A. Shaker, and our colleagues at the Department of Astronomy, NRIAG for their fruitful discussions and continued support throughout this work. MD and SS would like to acknowledge the Science and Technology Development Fund (STDF) N5217, Academy of Scientific Research and Technology (ASRT), Cairo, Egypt and Kottamia Center of Scientific Excellence for Astronomy and Space Sciences (KCSEASSc), National Research Institute of Astronomy and Geophysics. HMH and HB are grateful to the Department of Mathematics and Geosciences (DMG) staff, at Trieste University, Italy. The seismic hazard computation part was carried out using DMG’s facilities.
DATA AVAILABILITY
The data underlying this article will be shared on reasonable request to the corresponding author.
Footnotes
See, for example, the web site of the NRIAG Eygptian National Seismic Network, http://ensn.nriag.sci.eg/.
See, for example, the web site for the European Mediterranean Seismological Center (http://www.emsc-csem.org/) and International Seismological Center bulletins at http://www.isc.ac.uk/iscbulletin/search/.
