


ABSTRACT
We present the first set of broad-band spectral and timing studies of two transient X-ray pulsars, MXB 0656−072 and MAXI J1409−619 using NuSTAR observations conducted during quiescence. Despite being captured at one of their lowest luminosity states, both these targets show signs of ongoing low-level accretion. Results from the time-averaged spectral analysis indicate for the first time, the presence of a strong soft power-law component along with thermal emission from the neutron star hotspots. For both targets, the quiescent thermal X-ray emission is consistent with the deep crustal heating model. In MXB 0656−072, we do not detect any pulsation or indication of a cyclotron line during quiescence. However, in MAXI J1409−619 we detect strong pulsations at 502 s with a pulsed fraction of ∼66 per cent, which adds this pulsar to the list of a handful of quiescent-state pulsating systems.
1 INTRODUCTION
Accretion powered X-ray pulsars exhibit a broad dynamical range of X-ray luminosities ranging from 1032 to 1034 erg s−1 during the quiescent phase all the way up to 1037–1038 erg s−1 during outbursts, making them ideal laboratories to probe accretion flows in various accretion regimes. While there have been numerous studies of these systems during their highest luminosity states (see for example, Bachetti et al. 2014; Doroshenko et al. 2020; Raman et al. 2021), it is only with the advent of more sensitive missions like XMM–Newton, Chandra, and NuSTAR, which has it become possible to explore the low accretion rate regime of these sources in greater detail (for example, Campana et al. 2002; Rothschild et al. 2013; Elshamouty, Heinke & Chouinard 2016; Tsygankov et al. 2017a; Rouco Escorial et al. 2020). The advantage of quiescent state observations is that they offer a direct view of the emission from the neutron star (NS) atmosphere and hotspots without having to deal with additional complexities that come with increased accretion such as the presence of an accretion column and interactions of X-ray photons with matter in the vicinity of these columns. Moreover, transient pulsars spend a considerable amount of time in quiescence during which we anticipate the observation of cooling effects in the NS crust. These effects are directly influenced by the pulsar’s outburst history. Such cooling processes can significantly contribute to X-ray emission and/or variability, making it crucial to enhance our understanding of these low accretion states through careful observation.
As the post-outburst luminosity decreases, the NS spin (Pspin) and the surface magnetic field become crucial parameters in determining the system evolution (Rouco Escorial et al. 2020). In particular, for fast spinning pulsars at lower accretion states, their magnetospheric radius expands to beyond their co-rotation radius. This effect centrifugally inhibits the infall of incoming material and further expels material outwards. This is most commonly referred to as the ‘propeller effect’ (Illarionov & Sunyaev 1975). More recent works have suggested some improvement in the standard ‘centrifugal barrier’ picture (D’Angelo & Spruit 2011, 2012). According to these works, the mass transferred from a binary companion on to a spinning magnetosphere might be accreted cyclically rather than being propelled out. This takes place via the formation of a ‘Dead disc’ that is coupled with the NS magnetosphere. Observations have indicated that residual X-ray emission is observed in several Be X-ray pulsars at very low luminosities (Tsygankov et al. 2017a). There has also been evidence of pulsations being detected in several objects such as A0535+262 (Rothschild et al. 2013; Doroshenko et al. 2014; Tsygankov et al. 2017a), 4U 1145–619 (Rutledge et al. 2007), 1A 1118–615 (Rutledge et al. 2007), among others, indicating that matter might still be reaching the NS surface (Rouco Escorial et al. 2020).
The powering mechanism of quiescent state (below or close to the propeller luminosity) X-ray emission is still highly uncertain. Campana et al. (2001) proposed that there could be matter leaking via the magnetospheric centrifugal barrier and contributing to the observed emission. In particular, for slow-rotating systems (Pspin ∼ 10s of seconds), it has been shown that the required matter leakage can be achieved via quasi-stable accretion from a ‘cold’ recombined disc (Tsygankov et al. 2017b). Rapidly rotating systems will be unable to achieve a cold disc (CD) because of the onset of the propeller regime at fairly higher mass accretion rates. Another proposed origin for residual X-ray emission from quiescent pulsars is the ‘deep crustal heating’ model (Brown, Bildsten & Rutledge 1998). Freshly accreted matter compresses the NS crust thus inducing nuclear reactions that power the thermal emission observed during quiescence. This mechanism has been successful in explaining the quiescent state emission for several X-ray binaries hosting NS with low magnetic field strengths (e.g. Low Mass X-ray Binaries (LMXBs); Wijnands, Degenaar & Page 2017). In particular, for systems with no recent outburst episodes or other signatures of increased activity, it can be safely assumed that the NS crust and core are at thermal equilibrium (Wijnands et al. 2017). In such cases, we can probe the core temperatures and in turn, examine NS core physics by using the NS surface temperature as a proxy. Additionally, if the NS is highly magnetized, we can further study the effect of the magnetic field on the heating and cooling of NS crusts.
The Be X-ray binary transient, MXB 0656−072, was first discovered by SAS-3 in 1975 at a flux density of 80 mCrab (Clark, Schmidt & Angel 1975). It was followed by two more observations at 50 and 70 mCrab in 1976 (Kaluzienski 1976) and was initially classified to be a low-mass X-ray binary (Liu, van Paradijs & van den Heuvel 2001). After several decades of remaining in quiescence, the source went into an outburst in 2003 for a duration of about 2 months (Remillard & Marshall 2003). The source was identified as a pulsating object with periodicity at 160.7 s (Morgan, Remillard & Swank 2003). The optical counterpart was identified as an O9.7 Ve spectral type star using ROSAT PSPS observations (Pakull, Motch & Negueruela 2003) (later refined and reclassified as a O9.5 Ve star; Nespoli, Reig & Zezas 2012). The 2003 outburst was classified as a type II outburst using RXTE observations. Preliminary RXTE results during that outburst revealed the presence of a cyclotron resonant scattering feature at ∼33 keV (Heindl et al. 2003). Further detailed studies of the outburst characteristics were carried out by McBride et al. (2006), where they found that the width of the Cyclotron Resonant Scattering Feature (CRSF) increased during the decline, while no changes in CRSF properties were observed as a function of pulse phase. With an average pulse period of 160.4 ± 0.4 s, a spin-up of 0.45 s was observed across the outburst (McBride et al. 2006). Using optical observations, the source was estimated to be located at a distance of 3.9 ± 0.1 kpc (Pakull et al. 2003; McBride et al. 2006). The next set of outbursts took place between November 2007 to November 2008 that was monitored using INTEGRAL (Kreykenbohm et al. 2007), RXTE (Pottschmidt et al. 2007), and Swift-BAT (Kennea et al. 2007). Optical observations conducted between 2006 and 2009 indicated a steadily strengthening H α line, whose equivalent width was strongest just prior to the onset of the 2007 outburst (Yan, Liu & Li 2007). This was attributed to an extended circumstellar disc. Moreover, correspondingly fainter UBV magnitudes, during the same 2007 outburst, were indicative of inner disc dilution (Yan et al. 2007). Long-term X-ray observations using Swift and RXTE during the period 2006–2009 indicated an orbital period of 101.2 d, for the first time (Yan et al. 2012). The HEXTE spectrum obtained during outburst was described using a cut-off power law with a low energy absorption, along with a 6.4 keV Fe line and a CRSF at 30 keV (Yan et al. 2012). Additional X-ray/optical variability studies identified a correlation between the aperiodic variability and spectral parameters, similar to 1A 1118–615 (Nespoli et al. 2012).
MAXI J1409−619 is a transient first detected on board MAXI during outburst in October 2010 (Yamaoka et al. 2010). This was localized to a position corresponding to RA = 14:08:02.56 and Dec. = −61:59:00.3 using Swift-XRT (Kennea et al. 2010b). The lack of an optical counterpart and the presence of a nearby IR source suggested a possible high-mass X-ray binary nature for the transient (Orlandini et al. 2012). In November 2010, MAXI J1409−619 went into its second outburst that was seven times brighter than its previous event. This triggered the Swift Burst Alert Telescope (BAT). Pointed XRT observations of the source in the PC mode revealed the presence of a 503 ± 10 s periodicity with a 42 per cent pulsed fraction, which was associated with the spin period of the pulsar in the system (Kennea et al. 2010a). Fermi-GBM observations from December 2010 indicated a refined spin period of 506.95 s with the pulse profile having double peaked shape (Camero-Arranz, Finger & Jenke 2010). Interestingly, quasi periodic oscillations (QPOs) were detected in this object at 0.192 ± 0.006 Hz along with two higher harmonics using RXTE observations (Kaur et al. 2010). More recently, Dönmez et al. (2020) also reported correlations between the source flux state and the presence and strength of the QPOs and their harmonics. This source and 4U 0115+63 are the only two known accreting X-ray pulsars to exhibit QPO harmonics (Dönmez et al. 2020). The source continuum spectrum studied using RXTE observations during outburst was well described by a cut-off power law with index 1.3 along with either a partially covered absorption model or a reflection model (Dönmez et al. 2020). The spectrum also showed a strong 6.5 keV Fe line with no indication of a cyclotron feature (Yamamoto et al. 2010). The source was re-discovered with archival BeppoSAX observations from 2000 during its low state. The broad-band BeppoSAX spectrum in the 1.8–100 keV band was best described using an absorbed power law (Γ ∼ 0.8) (Orlandini et al. 2012). A cyclotron absorption feature with a fundamental at 44 keV (along with two higher harmonics at 73 and 128 keV) was also detected in the quiescent state that allowed for the measurement of the NS surface magnetic field of 3.8 × 10¹² G (Orlandini et al. 2012).
The two X-ray pulsars analysed as part of this work have been in their quiescent accretion state for more than a decade. A dedicated observing campaign was conducted using Chandra, XMM–Newton, and Swift to explore the quiescent state of X-ray pulsars (Wijnands 2003). As part of that observing campaign in 2012, MXB 0656−072 was observed using Chandra, where it displayed a soft thermal spectrum (Tsygankov et al. 2017a). The source was observed at a flux level of 2 × 10⁻¹² erg cm−2 s−1, which corresponds to a luminosity of 6.2 × 1033 erg s−1 (assuming a distance of 5.1 kpc obtained using recent Gaia measurements; Arnason et al. 2021). MAXI J1409−619 has been in quiescence since its last outburst in 2010 and has never been studied using current instruments since. In this paper, we study the broad-band spectral properties of these two transient X-ray pulsars using NuSTAR observations. In Section 2, we present the methods and observation details, followed by the analysis and results in Section 3. We further summarize our results and discussions in Section 4.
2 OBSERVATIONS AND DATA REDUCTION
The Nuclear Spectroscopic Telescope Array (NuSTAR) is a space-based high-energy mission capable of carrying out sensitive X-ray imaging and spectroscopy in the 3–79 keV band. It comprises of two co-aligned identical X-ray focal plane modules FPMA and FPMB, each with an FOV of 13 arcmin × 13 arcmin (Harrison et al. 2013). It provides a moderate spectral resolution of 400 eV around 10 keV. With its broad-band spectral sensitivity, NuSTAR is ideally suited to carry out cyclotron line studies and broad-band spectroscopy. The NuSTAR observations of MXB 0656−072 and MAXI J1409−619 were carried out in November 2021 and September 2022 with an exposure time of 50 and 56 ks, respectively. Details of the observations are given in Fig. 1 and Table 1. Both sources were observed during the ongoing low accretion states. Fig. 2 shows the long-term Swift-BAT 15–50 keV light curve marking the previous outbursts and the location of the NuSTAR observations used for this work.
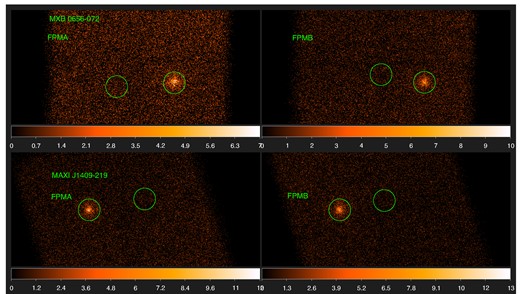
NuSTAR images are shown for MXB 0656−072 (top) and MAXI J1409−619 (bottom) in the two detector modules with the source and background regions marked.
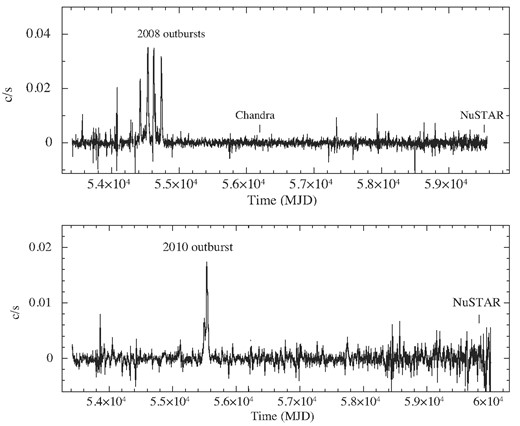
Figure shown the long-term Swift-BAT (15–50 keV) light curves for MXB 0656−072 (top panel) and MAXI J1409−619 (bottom panel) with the NuSTAR and Chandra quiescent state observations marked. Both targets have remained in quiescence since their previous major outbursts.
NuSTAR observations of MXB 0656−072 and MAXI J1409−619 used in this work.
| Target | Obs ID | Tstart (UTC) | MJD | Exp time | Count rate |
|---|---|---|---|---|---|
| (ks) | (s−1) | ||||
| MXB 0656−072 | 30701016002 | 2021-11-10 11:02:24 | 59528.46 | 50 | 0.04 |
| MAXI J1409−619 | 30801023002 | 2022-09-06 22:56:09 | 59828.95 | 56 | 0.06 |
| Target | Obs ID | Tstart (UTC) | MJD | Exp time | Count rate |
|---|---|---|---|---|---|
| (ks) | (s−1) | ||||
| MXB 0656−072 | 30701016002 | 2021-11-10 11:02:24 | 59528.46 | 50 | 0.04 |
| MAXI J1409−619 | 30801023002 | 2022-09-06 22:56:09 | 59828.95 | 56 | 0.06 |
The raw data were processed using the standard NuSTAR data analysis software nustardas version 2.1.1 along with the caldb version 20210210. Source photons were extracted from a circular region with radius 50 arcsec for both targets. The S/N was optimized by collecting background photons from a nearby source-free region, using the standard background extraction procedure. We used the routine NUPIPELINE to generate the calibrated level 2 event files. The photon arrival times in the source event file were corrected to the solar centre barycentre using the target coordinates (in J2000): RA = 104.57° and Dec. = −7.209° for MXB 0656−072, and RA = 212.01° and Dec. = −61.98342° for MAXI J1409−619. The light curves, spectra, and other auxiliary response files were extracted using the task nuproducts for both FPMA and FPMB instruments.
3 ANALYSIS AND RESULTS
3.1 Timing analysis
In order to examine their low-level accretion properties, we carried out a pulsation search for the targets. The source and background light curves were generated from the FPMA and FPMB modules. The background-subtracted light curves have a mean count rate of ∼0.04 and 0.06 c s−1, for MXB 0656−072 and MAXI J1409−619, respectively, in the 3–79 keV band. We further carried out a pulsation search using the ftoolefsearch around the previously reported spin period values and also searched for any detectable QPO peaks in the power spectrum using the ftools task powspec. For MXB 0656−072, we were unable to detect any signatures of excess power at any frequency during this observation. Our results are consistent with previous null reports of pulsations during quiescence using Chandra (Tsygankov et al. 2017a). In MAXI J1409−619, we were able to identify a clear peak in efsearch at 502 ± 3 s when the light curves from each of the detector modules were folded a resolution of 0.1 s (Fig. 3). The measured period is consistent with previous measurements of 503 ± 10 s during its 2010 outburst (Kennea et al. 2010a). The uncertainty on the spin measurement is computed using a thousand realizations of Gaussian randomized light curves (a method similar to what is described in Boldin, Tsygankov & Lutovinov 2013 and Varun, Iyer & Paul 2022). Since MAXI J1409−619 was known to exhibit quasi periodic oscillations (QPOs) during its low accretion state (Kaur et al. 2010; Dönmez et al. 2020), we carried out a search for QPOs in the power density spectrum between 0.0001 and 1 Hz using a light curve binned at 0.5 s. The power density spectrum was generated by averaging out 16 individual segments with 8192 s duration each. In Fig. 4, we show the PDS in the 0.0–4 mHz frequency range, where we detect the pulse peak at 1.99 mHz with an SNR of ∼5σ (Fig. 4). However, we do not observe any features that resemble a QPO beyond 0.1 Hz (as observed in prior works such as Dönmez et al. 2020) from both the detector modules in MAXI J1409−619. The 3–79 keV light curve was folded at the observed pulse period of 502 s at an epoch of MJD 59 828 and 32 folded phase bins. The pulse profile consists of a double-peaked shape with a pulse fraction1 of 66 per cent in the entire NuSTAR band (Fig. 5 last panel). We further extracted light curves in different energy bands – 3–5, 5–10, and 10–15 keV. Due to high background beyond 15 keV, we were unable to detect pulsations or measure pulsed fractions. We folded the energy resolved light curves using the same fold parameters to obtain energy resolved pulse profiles as shown in Fig. 5. We obtain pulsed fractions of 74 per cent, 84 per cent and 88 per cent in the 3–5, 5–10, and 10–15 keV bands.
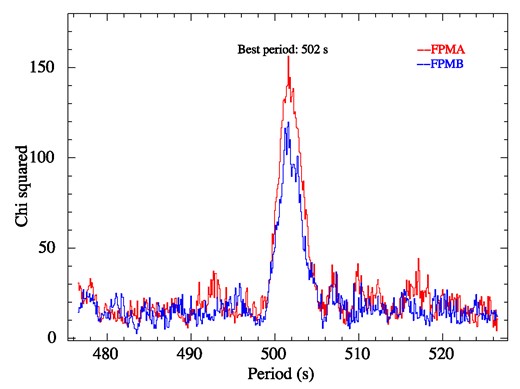
Period search results obtained using efsearch for MAXI J1409−619 shows a clear peak at 502 s in both detector modules.
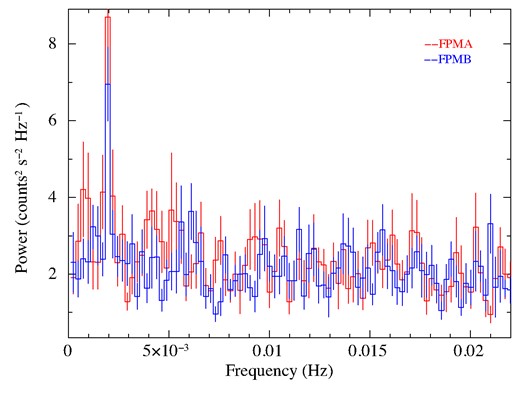
The power density spectrum for MAXI J1409−619 obtained using light curves from both detector modules showing the pulse peak at 1.99 mHz.
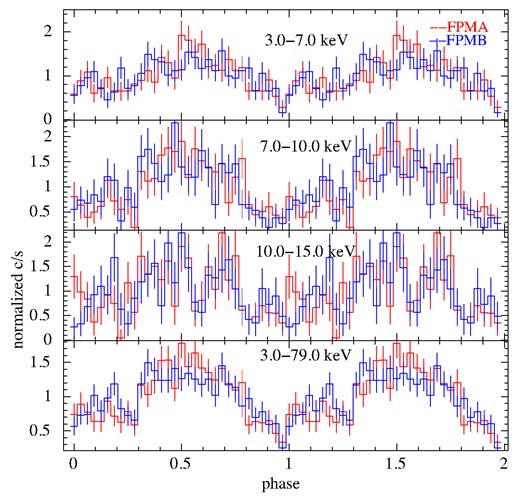
Energy resolved pulse profiles for MAXI J1409−619 light curves folded at the pulse period of 501.6 s.
3.2 Spectroscopy
We further carried out a phase averaged spectral analysis for MXB 0656−072 and MAXI J1409−619 in xspec v.12.12.0. For each individual pulsar, we carried out a joint fit using the FPMA and FPMB modules. The spectra were grouped using the tool grppha in such a way that they contain at least 20 counts per bin for MXB 0656−072 and 30 counts per bin for MAXI J1409−619, respectively. A constant normalization was included between the spectra from the two modules to account for any variations in the effective areas or potential uncertainties in their calibrations. The constant was kept fixed at 1.0 for FPMA and was allowed to vary for FPMB. We used the Tuebingen–Boulder ISM absorption model ‘TBabs’ model to describe the line-of-sight neutral hydrogen column density (NH) assuming WILMS abundances (Wilms, Allen & McCray 2000) and VERN cross-sections (Verner et al. 1996).
For characterizing the continuum spectra of accretion powered X-ray pulsars during the quiescence, their spectra have been traditionally described using several combinations of one or more phenomenological models, which include the following models: (1) a simple power law (with or without the addition of thermal blackbody components), (2) an NS atmosphere (NSA) model, which assumes emission from a magnetized NS (Pavlov et al. 1995), and (3) a model comprising of two Comptonization components (Tsygankov et al. 2019), among others. Chandra observations of quiescent pulsars such as GRO J1750−27 and V0332+53 have been well described using the NSA model (Elshamouty et al. 2016; Rouco Escorial et al. 2019). The double Compton model assumes Comptonization by hot and cold electrons and has been recently observed to fit spectra for at least three quiescent pulsars including A0535+262, GX 304–1, and X-Persei (Tsygankov et al. 2019) (see Sokolova-Lapa et al. 2021, for a detailed theoretical interpretation of the Compton double hump model for low accretion level emission). We describe the fitting process adopted for each of the pulsars using some of the models below.
3.2.1 MXB 0656−072
MXB 0656−072 has been in a low-luminosity state since its last outburst in 2008. Its quiescent state spectra, obtained using Chandra, 4 yr after the outburst, had a thermal shape with a blackbody temperature around 1 keV and a luminosity of ∼4 × 1033 erg s−1 (Tsygankov et al. 2017a). We use this as a starting point for the spectral analysis. Since the background counts start dominating above 20 keV, we ignore the energy range beyond 20 keV. The NH was kept fixed at the Galactic value2 of 0.6 × 1022 cm−2 (HI4PI Collaboration 2016). We first fit the 3.0–20.0 keV spectrum using a simple absorbed power-law model. This resulted in a reasonable fit with a χ2/dof of 93.2/93. We additionally also tried a combination of a blackbody and a power-law model that gave similar fit results. A single blackbody model was insufficient to fit the entire broad-band spectrum, so we discard that model. We also alternatively attempted the fit using the partial covering absorber model (pcfabs) instead of the blackbody function. We found that the resultant blackbody fits were marginally better (reduced χ2 ∼0.91 for 93 dof) compared to the pcfabs (reduced χ2 ∼0.96 for 107 dof). In addition to these models, we carried out a fit using a model comprising of two broad Comptonized components as prescribed by Tsygankov et al. (2019). We adopted the compTT model from xspec that describes the Comptonization process of soft photons in a hot plasma (Titarchuk 1994). We tied the seed photon temperatures of both the components together and allowed the plasma temperature and plasma optical depth parameters to vary. The fit was unable to constrain the plasma temperature for both Compton components. Alternatively, we tried modelling the possible two Comptonized components using two power-law functions. Although the fit did not seem to have any visible residuals, the resultant power-law index values were not getting constrained. We therefore disregard the double Comptonization models for this paper. The fit parameters for all the models discussed above, except the double Comptonization models (comptt + comptt and po + po), are shown in Table 2 and the spectral fit for the PL + bbodyrad model is shown in Fig. 6 (left panel). The data statistics beyond 20 keV were poor to constrain the CRSF line parameters.

Best-fitting spectrum using the PL + bbody model for MXB 0656−072 (left panel) and for MAXI J1409−619 (right panel). The dotted lines indicate the additive bbody and PL components. For MXB 0656−072, the PL component dominates beyond ∼6 keV, while for MAXI J1409−619 the emission in the entire spectral band is dominated by the PL component. For both targets, the addition of the bbody model improved the fits.
Best-fitting spectral parameters for the joint FPMA + FPMB fits for MXB 0656−072 assuming two model combinations as detailed in the text (see Section 3.2). Errors are indicated at 90 per cent confidence.
| Parameter/model | PL | PL + BB |
|---|---|---|
| const FPMA | 1.0 (fixed) | 1.0 (fixed) |
| const FPMB | 0.97 | 0.97 |
| NH (×1022 cm−2) | 0.6 (fixed) | 0.6 (fixed) |
| Γ | 2.69 ± 0.11 | 2.1|$^{+0.5}_{-0.7}$| |
| norm (× 10−4) | 5.6 | |
| T|$_\texttt {bbody}$| (K) | – | 0.99|$^{+0.16}_{-0.11}$| |
| R|$_\texttt {bbody}$| (km) | – | 0.11 ± 0.04 |
| Red. χ2(dof) | 1.01(93) | 0.91(93) |
| Unabsorbed flux (3–79 keV)a | 1.5 ± 0.15 | 1.82 ± 0.2 |
| Unabsorbed flux (3–20 keV)a | 1.3 ± 0.13 | 1.28 ± 0.12 |
In units of 10−12 erg cm−2 s−1.
In this current quiescent epoch, the source spectrum appears to be extremely soft. We used the CFLUX model to derive an average source flux of 1.5 × 10⁻¹² erg cm−2 s−1 in the 3–79 keV band. Assuming a source distance of 5.1 kpc (Arnason et al. 2021), we obtain a luminosity of 4.7 × 1033 erg s−1, which is lower by almost a factor of 2 from the previous Chandra measurement.
3.2.2 MAXI J1409−619
We have carried out the spectral fitting for MAXI J1409−619 following the spectral analysis from its previous low-state observations using BeppoSAX (Orlandini et al. 2012). We fix the line-of-sight column density (NH) to its Galactic value of 2.0 × 1022 cm−2. The grouped spectra were jointly fit for both the FPMA and the FPMB modules in xspec in the 3.0–30.0 keV band, since statistics were poor beyond that. We first fit an absorbed power-law model that yielded a reasonable fit with a χ2/d.o.f. of 107.4/86. Since the spectrum is background dominated above 30 keV, we were unable to identify signatures of the predicted CRSF line near 44 keV. To improve fit further and address the low-energy residuals, we added a thermal blackbody component. This improved the fit (Δχ2 ∼ 9 for 86 dof). Alternatively, we also tried the fit using the partial covering absorber model (pcfabs). The resultant fits were marginally better with the blackbody model (reduced χ2 ∼1.10 for 86 dof) compared to using pcfabs (reduced χ2 ∼1.26 for 90 d.o.f.). We again attempted to use a combination of two Comptonization models in the form of two comptt models and alternatively, two PL models. In both these cases, the fitting was unable to constrain the power law index or norm. Additionally, weird residuals at lower and higher energies showed up. We therefore ignore these double Comptonization models for further discussion. Details of the best-fitting parameters for the PL and PL + bbodyrad models are shown in Table 3 and the spectral fit for the PL + bbodyrad model is shown in Fig. 6 (right panel). MAXI J1409−619 had a source flux of 4.4 × 10⁻¹² erg cm−2 s−1. Assuming a source distance of 14.5 kpc, we obtain a luminosity of 1 × 1035 erg s−1.
Best-fitting spectral parameters for the combined (FPMA + FPMB) spectra for MAXI J1409−619 assuming two model combinations as detailed in the text (see Section 3.2). Errors are indicated at 90 per cent confidence.
| Parameter/model | PL | PL + BB |
|---|---|---|
| const FPMA | 1.0 (fixed) | 1.0 (fixed) |
| const FPMB | 1.1 | 1.1 |
| NH (× 1022 cm−2) | 2.0 (fixed) | 2.0 (fixed) |
| Γ | 1.73 ± 0.07 | 1.54 ± 0.25 |
| Norm (× 10−4) | 4.2 | 2.8 |
| T|$_\texttt {bbody}$| (K) | 1.75|$^{+0.8}_{-0.3}$| | |
| R|$_\texttt {bbody}$| (km) | 0.10 ± 0.05b | |
| Red. χ2(d.o.f.) | 1.24(86) | 1.1 (86) |
| Unabsorbed flux (3–79 keV)a | 4.41 ± 0.04 | 4.50 ± 0.11 |
| Unabsorbed flux (3–30 keV)a | 2.70 ± 0.02 | 2.63 ± 0.03 |
In units of 10−12 erg cm−2 s−1.
Assuming 10 per cent uncertainty in distance measurement for MAXI J1409−619.
4 DISCUSSION
In this paper, we present the results from the analysis of MXB 0656−072 and MAXI J1409−619 during one of their lowest-ever observed luminosity states using broadband NuSTAR observations conducted after a decade of quiescence. For the first time in these two systems, we have uncovered a dominant non-thermal contribution to the quiescent emission, whose origin we discuss below. Our results also reveal the presence of thermal hotspots that are indicative of ongoing accretion albeit at an extremely low level. In MAXI J1409−619, we detect pulsed emission with a spin period of 502 s.
4.1 The propeller regime
In the ‘propeller’ regime (Illarionov & Sunyaev 1975), a centrifugal barrier is generated by the rotating NS magnetosphere, due to which matter infall is halted. Further accretion will continue to remain inhibited if the velocity of the magnetic field lines is greater than the local keplerian velocity. Only when the magnetospheric radius shrinks below the corotation radius, which is easily realized during high accretion rates, can matter penetrate into the magnetosphere and can get accreted. Since the magnetospheric radius is a function of the mass accretion rate, one can determine the limiting luminosity for the onset of the propeller regime (Campana et al. 2002; Tsygankov et al. 2016) by equating the magnetospheric radius and the corotating radius:
Here, M1.4 is the NS mass in units of 1.4 M⊙, |$\dot{M}$| is the mass accretion rate, R6 is the radius of the NS in units of 106 cm, B12 is the magnetic field in units of 1012 G, and P is the spin period of the pulsar in seconds. The factor k is defined such that it relates the magnetospheric radius for disc accretion and the Alfvèn radius for spherical accretion and is typically assumed to be 0.5 (Ghosh & Lamb 1978; Tsygankov et al. 2016). In several cases, accreting pulsars transitioning to the propeller regime have been associated with sudden luminosity drops (for example 4U 0115+63 and V0332 + 53; Campana et al. 2001; Tsygankov et al. 2016).
MXB 0656−072 has been observed using NuSTARat a luminosity of 4.7 × 1033 erg s−1 which is lower from the previous quiescent state measurement using Chandra (Tsygankov et al. 2017a). We assume canonical NS mass and radius values of 1.4 M⊙ and 12 km (Nättilä et al. 2017), respectively, and further input the measured spin period of 160.4 s (McBride et al. 2006) and a magnetic field strength of 3.6 × 10¹² G (Heindl et al. 2003). We find the limiting luminosity for this source to be at 6.5 × 1032 erg s−1, which is down by a factor of 10 from the current source luminosity. For the case of MAXI J1409−619, the observed luminosity during the recent NuSTAR observations is 1 × 1035 erg s−1. By using the spin period measured in this work (501.6 s) and the magnetic field estimate of 3.8 × 10¹² G (Orlandini et al. 2012), we obtain a propeller limiting luminosity of 5.1 × 1031 erg s−1, which is well below the observed luminosity. Our findings are therefore in line with the expectations that both targets are in a low accretion regime rather than a propeller regime.
4.2 Origin of low-level emission
Following the above discussion on the limiting luminosity for transition to the propeller regime, we can safely assume that during the NuSTARobservations for these two objects, accretion is not centrifugally inhibited in any way, which suggests that the observed X-ray emission is indicative of ongoing accretion. Here, we first discuss various quiescent emission mechanisms and compute their predicted luminosity estimates. We will then discuss the applicability of these models for the two targets.
4.2.1 The cold disc model
Recent observations of slowly rotating pulsars accreting at low levels have demonstrated that not all pulsars undergo such transitions to the propeller regime (Tsygankov et al. 2017b). It has been proposed that for slow pulsars, a slowly rotating magnetosphere can further push down the limiting luminosity, while maintaining temperatures ∼6500 K that would sustain recombination of hydrogen. This model is known as the ‘cold’ accretion disc model (Tsygankov et al. 2017a, b). Below a critical mass accretion rate (|$\dot{M}_{\mathrm{ cold}}$|), such recombinations are predicted to set in (Lasota 1997; Tsygankov et al. 2017b):
where r10 = r/1010 cm is the inner disc radius. The luminosity at which the transition to a CD occurs will correspond to the following:
This is ∼2 × 1034 erg s−1 for typical pulsars with magnetic field strengths of ∼1012 G. Here, the value of k is taken as 0.5 as commonly considered for disc accretion (Ghosh & Lamb 1978). If Lcold > Lprop, then lower mass accretion rates can drive such systems to stably accrete from a CD. In the standard accretion scenario, the magnetospheric radius increases as the source gets dimmer. As opposed to that, for pulsars that transition to the ‘cold’ phase, the inner disc radius decreases at lower luminosity states. This ensures that these sources continue to stably accrete from a CD before switching to the propeller regime at even lower luminosities (Tsygankov et al. 2017a). Furthermore, according to this model, the luminosity is expected to fade as L ∝ t−0.7 and observations of sustained pulsed emission can be expected (Tsygankov et al. 2017b). The transition luminosity to the CD regime and the corresponding predicted luminosities (expected to be observed at any given t) are shown in Table 4.
Parameters determined in this study for MXB 0656−072 and MAXI J1409−619.
| Source | Perioda1 | Lprop | |$\langle \dot{ \rm M}\rangle$| | Lq,predicted,DCH | Lq,transition to CD | Lq, predicted, CD | Lbb | LPL |
|---|---|---|---|---|---|---|---|---|
| (s) | (1032 erg s−1) | (10−10 M⊙ yr−1) | (1033 erg s−1) | (1034 erg s−1) | (1031 erg s−1) | (erg s−1) | (erg s−1) | |
| MXB 0656−072 | – | 6.5 | 0.3 | 2.0 | 1.2 | 0.5 | 1.6 × 1033 | 4.1 × 1033 |
| MAXI J1409−619 | 502 | 0.5 | 1.1 | 10.0 | 1.3 | 1.9 | 1.1 × 1034 | 10.4 × 1034 |
Period measured during quiescence.
4.2.2 The deep crustal heating model
An alternative explanation for the origin of quiescent X-ray emission in pulsars is the deep crustal heating model. According to this model, the soft thermal component is assumed to arise from a cooling NS that is powered by nuclear reactions that occur during each outburst (Brown et al. 1998; Rouco Escorial et al. 2020). Matter that is deposited on the NS surface during every outburst compresses the deeper crustal layers, which then triggers nuclear reactions and releases heat. This will drive the heated crust out of equilibrium with the NS core. After the outburst is complete, and quiescence sets in, thermal radiation is emitted in the form of cooling radiation from the NS surface and eventually brings the crust and core back into equilibrium (see Wijnands et al. 2017; Rouco Escorial et al. 2019, and Section 4.3 in Tsygankov et al. 2017a for a detailed review).
For a population of non-pulsating LMXBs and accreting ms pulsars (Wijnands et al. 2017), it appears that enhanced cooling processes such as the direct URCA process (as against standard neutrino cooling via the modified URCA or bremsstrahlung processes) may need to be invoked in order to explain the observed crustal cooling curves. Wijnands et al. (2017) elaborate on the various cooling mechanisms applicable for different particle compositions of the NS core. In addition to the deep crustal heating (DCH) model, a ‘shallow heating’ mechanism has also been invoked in the past in order to explain crust cooling curves seen in LMXBs (Deibel et al. 2015; Rouco Escorial et al. 2019). Be X-ray pulsars being relatively young systems may not possess a crust that is completely made of accreted material. Instead, they can be expected to have as ‘hybrid’ crusts (Wijnands et al. 2017). It is unclear whether such hybrid crusts can support all kinds of accretion-induced nuclear reactions (Wijnands et al. 2017) or whether some of the deep crustal reactions that generate the necessary heating get inhibited (Rouco Escorial et al. 2019). Moreover, the presence of ‘shallow heating’ effects remains largely explored for Be pulsars (see Rouco Escorial et al. 2019 for the singular case of GRO J1750−27), since the effect of strong magnetic fields on the heating and cooling of the NS crusts is barely understood. For the Be systems that have shown signatures of cooling of an accretion heated NS, the emission has been found to arise from a small portion confined to the NS hotspots (Campana et al. 2002; Elshamouty et al. 2016; Wijnands et al. 2017). 4U 0115+63 and V0332 + 53 are the only two Be pulsars, for which signatures of crustal heating and cooling have been identified (Wijnands & Degenaar 2016; Rouco Escorial et al. 2017). Additional searches for signatures of crust cooling were carried out in other Be pulsars such as GRO 10750–27 (Rouco Escorial et al. 2019), with no success.
In order to understand the thermal heating and crust cooling effects in all categories of accreting NS systems, we construct a comprehensive plot of the observed quiescent luminosities as a function of their long-term mass accretion rate (Fig. 7). This plot includes compilations of measured quiescent thermal luminosities of (1) LXMBs, accreting ms-pulsars, and soft X-ray transients from Potekhin, Chugunov & Chabrier (2019) and (2) of Be-X-ray pulsars from Tsygankov et al. (2017a). Several key factors play into the estimation of the quiescent thermal luminosity for accreting NSs. These include the long-term averaged mass accretion rate, the composition of the crust, and the most relevant cooling process. We note that several uncertainties exist within these measurements. These include variations in the long-term average accretion rate (during different quiescent epochs), measurement methods of the long-term accretion rate, and distance estimates, to name a few. We therefore treat these estimates as crude. This plot can serve as a reference to test various crust cooling scenarios (as shown in Wijnands et al. 2017).
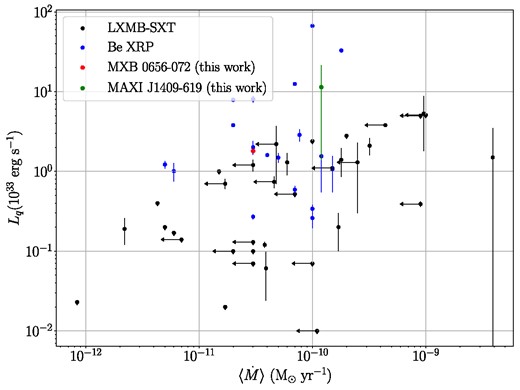
Plot showing the measured quiescent thermal luminosity as a function of the long term averaged mass accretion rate |$\langle \dot{M}\rangle$|. The quiescent luminosity data for LMXBs have been plotted from Potekhin et al. (2019) and those for Be X-ray pulsars are adopted from Tsygankov et al. (2017a). Results for MXB 0656−072 and MAXI J1409−619 are marked in red and green, respectively. We assume a 10 per cent uncertainty on the 14.5 kpc distance measurement for MAXI J1409−619 since no previously reported uncertainty exists in the literature.
In order to derive the expected quiescent luminosities from deep crustal heating, we adopt a procedure similar to what has been indicated in Tsygankov et al. (2017a) and Elshamouty et al. (2016). We use the long-term Swift-BAT light-curve count rates and convert it to flux using WebPIMMS3 and WebSPEC4 by assuming a simple power-law model with an index 1.0 and a high-energy cut-off at 15 keV, which is a representative spectrum for typical X-ray pulsars in this energy band. We use this flux to then estimate the average long-term luminosities for both targets. Assuming perfect accretion efficiency, we then compute the mass accretion rate as follows:
where G is the gravitational constant, M is the mass, and R is the radius of the NS. We assume canonical NS mass and radius values of 1.4 M⊙ and 12 km, respectively. This gives us an accretion rate of 0.3 × 10⁻¹⁰ and 1.1 × 10⁻¹⁰ M⊙ yr−1, for MXB 0656−072 and MAXI J1409−619, respectively. We then estimate the expected quiescent luminosity as described in Tsygankov et al. (2017a) and Brown et al. (1998) as follows:
This gives us predicted quiescent state thermal luminosities of 2.0 × 1033 and 1 × 1034 erg s−1, for MXB 0656−072 and MAXI J1409−619, respectively. The predicted luminosities are shown in Table 4.
4.2.3 Contribution from the companion star
Some fraction of the observed low-level X-ray emission can potentially be expected to come from the companion star. The companion for MXB 0656−072 is a Be star and that for MAXI J1409−619 has not been confirmed as yet. However, detailed estimates carried out by Tsygankov et al. (2017a) indicate that the X-ray luminosities of typical O or B type stars are of the order of ∼1031 erg s−1, which is several orders of magnitude lower than our measured luminosities for both MXB 0656−072 and MAXI J1409−619 as part of this work. We therefore assume that the companion does not, in any significant way, contribute to the observed X-ray emission for both sources.
4.2.4 Likely emission mechanism in MXB 0656−072 and MAXI J1409−619
The Be X-ray source MXB 0656−072 continues to exhibit thermal emission consistent with the predicted emission expected from the cooling of accretion heated NS during the current NuSTAR observation (this work and Chandra observations analysed in Tsygankov et al. 2017a). The radius of the blackbody emitting region (∼0.06 km) is consistent with that of an NS hotspot near the poles. In addition, we have detected a strong power-law component, for the first time, dominating over the thermal flux (see Table 4), as against a purely thermal spectrum observed using Chandra (Tsygankov et al. 2017a) in 2012. The origin of this power-law component provides additional incentive to better understand the processes occurring at low luminosities (see Section 4.4 below for detailed discussion). The cold accretion disc model (which supports continued accretion and therefore, pulsations) predicts a quiescent luminosity of 1.3 × 1031 erg s−1, which is two orders of magnitudes lower than what we observe using NuSTAR. This makes it an unlikely scenario for the current observations. Being a slowly rotating pulsar, it is unlikely that it will ever descend into a propeller regime where accretion is centrifugally inhibited. Our inability to detect pulsations for this pulsar using NuSTAR possibly hints at very low pulse fraction during this low-state observation. On the other hand, we detect the presence of a thermal component (which is preferred over a partial covering absorber) from our spectral fits, which we can attribute to that arising from deep crustal heating. Our measured quiescent luminosity obtained from the thermal component for MXB 0656−072 corresponds to 1.6 × 1033 erg s−1. The predicted quiescent state luminosities due to the deep crustal heating model is ∼2.0 × 1033 erg s−1, which is of the order of the observed thermal luminosities and is therefore likely to be the dominant source of quiescent emission in MXB 0656−072.
In MAXI J1409−619, the quiescent emission is observed to be extremely soft (Γ ∼1.6). Interestingly this source is among a few others that exhibit positive flux-spectral index correlations beyond 10−9 erg cm−2 s−1 (for example EXO 2030+275; Epili et al. 2017) and anticorrelation below these fluxes (Dönmez et al. 2020). Such correlations and anticorrelations are also observed in sources that exhibit cyclotron features (Malacaria et al. 2015; Dönmez et al. 2020). Our current low-luminosity NuSTAR observations align with this anticorrelation trend (Fig. 8). We also detect strong pulsations at 502 s which indicates ongoing low-level accretion. The decade-long quiescence should have ensured that the NS crust and core are at thermal equilibrium. The predicted luminosity for the transition to a CD is for MAXI J1409−619 is estimated as ∼1034 erg s−1. This would mean that during our current observations, MAXI J1409−619 could not have transitioned to this state. Moreover, the predicted luminosity as would be observable during these observations in September 2022 is of the order of 1.9 × 1031 erg s−1 (assuming an L ∝ t−0.7 behaviour; Tsygankov et al. 2017b). This is way lower than the observed luminosity using NuSTAR. We disregard the cold accretion disc model for MAXI J1409−619 as well. The observed residual thermal emission likely arises from the NS hotspots which were heated during outbursts. This is further supported by the size of the emission region, which is 0.1 km (far less than the NS radius). Thermal emission from accretion-heated hot spots has similarly been observed for other Be pulsars such as 4U 0115+63 (Rouco Escorial et al. 2017) and V0332+53 (Elshamouty et al. 2016). Keeping in mind the uncertainties in the distance estimates for MAXI J1409−619, the measured thermal luminosity from this work seems to prefer the DCH model over the CD model.
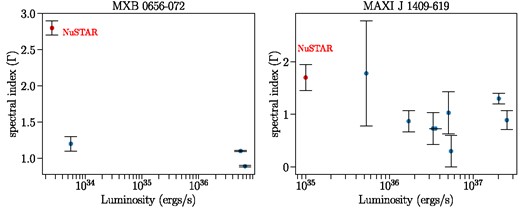
Variation of the spectral index as a function of luminosity. The red data point indicates the NuSTAR measurement obtained from this work.
4.3 Detection of pulsation in MAXI J1409−619 at low accretion states
At luminosities ∼1036 erg s−1, Orlandini et al. (2012) reported detection of CRSFs in MAXI J1409−619 (the fundamental and its two harmonics) in the BeppoSAX spectrum. However, no pulsations were reported from those observations in 2000. Our results are indicative that pulsed emission can be observed at low accretion levels as well. Indeed pulsations have been detected in several low luminosity Be pulsars – for example, SAX J2103.5+4545 (Reig, Doroshenko & Zezas 2014), 4U 078–25, GRO J1008−57 (Tsygankov et al. 2017b), 2S 1417–624 (Tsygankov et al. 2017a), etc. In some highly magnetized systems, only the hard X-ray component was found to be pulsed (see Cep X-4, McBride et al. 2007 and RX J0812.4–3114, Zhao et al. 2019). MAXI J1409−619 was observed at a luminosity of ∼1035 erg s−1 during the current NuSTAR observations, which happens to be one of its lowest to date, though not low enough to drive the system to a propeller regime. A strong pulsation has been measured at 502 s. Table 5 indicates all previously measured spin values using Swift (Kennea et al. 2010b), RXTE (Dönmez et al. 2020), and the Fermi-GBM (Malacaria et al. 2020) for MAXI J1409−619.
Table of measured pulse period for MAXI J1409−619 since the time of its discovery in 2010.
| Mission | MJD | Pulse period (Hz) |
|---|---|---|
| Swift-XRTa | 55 530 | 0.001988 ± 3.9524e−5 |
| Fermi-GBMb | 55531.96 | 0.00197045 ± 9.14e−8 |
| Fermi-GBMb | 55535.97 | 0.00197707 ± 7.61e−8 |
| Fermi-GBMb | 55540.01 | 0.00198282 ± 8.99e−8 |
| RXTE-PCAc | 55540.0150 | 0.00198287 ± 0.0004 |
| Fermi-GBMb | 55544.02 | 0.00198792 ± 1.40e−7 |
| Fermi-GBMb | 55548.09 | 0.001992423 ± 1.34e−7 |
| NuSTARd | 59828.95 | 0.00199203 ± 1.19e−5 |
Several X-ray pulsars have exhibited a large pulsed fraction during quiescence. For example, in RX J0812.4–3114, the hard component was observed to be pulsed with a pulsed fraction of ∼88 per cent (Zhao et al. 2019). The majority of pulsars studied by Tsygankov et al. (2017a), which had detectable pulsed emission (refer to table 3 in Tsygankov et al. 2017a), displayed significant pulsed fractions within the 50–70 per cent range. High pulsed fractions have been found to be common for X-ray pulsars at low accretion states (Lutovinov & Tsygankov 2009) (similar to this work for MAXI J1409−619) as well as for pulsars in complete quiescence (Negueruela et al. 2000; Reig et al. 2014). Variations in the behaviour of pulsed fractions as a function of energy as well as luminosity states have been characterized for several X-ray pulsars in terms of a simple accretion model that is a function of the emission region and accretion geometry (Lutovinov & Tsygankov 2009).
It is interesting to note here that we do not yet know the nature of the companion star in MAXI J1409−619. The source underwent an outburst in 2010 and has been in quiescence since. Based on what appears to be the erratic outburst of the source, it can be compared to a class of X-ray transients called the supergiant fast X-ray transients (SFXTs), like IGR J17544−2619, rather than persistent supergiant X-ray binaries like Vela X-1. SFXTs exhibit similar properties as classical systems, including supergiant companions and orbital period distribution. However, SFXTs display greater dynamic variability than classical systems, characterized by sporadic short X-ray outbursts and faint flares with fast rise times (tens of minutes) and typical durations of a few hours. On average, SFXTs have X-ray luminosities 2–3 orders of magnitude lower than classical systems with similar orbital periods, outside of these outburst events (Walter et al. 2015). There have been debates in the literature about the nature of compact objects in SFXTs. Should MAXI J1409−619 be classified as an SFXT, the presence of a pulsating NS would be in favour of a NS compact object scenario. In addition, the presence of cyclotron line at 44 keV could further indicate that magnetic field strengths of SFXTs can be ∼1012 G, contradicting some leading theories about them being accreting magnetars (Bozzo, Falanga & Stella 2008).
4.4 Non-thermal emission at low luminosities
In literature, there are at least three Be XRPs (A0535+262, GX 304–1, and X Persei) that have displayed an unusual spectrum at low luminosities – the presence of non-thermal components like the two Comptonization components (Tsygankov et al. 2019). The detection of a CRSF during quiescence (for example A0535+262; Tsygankov et al. 2017a), also indicates that the broad-band spectrum of Be XRPs in quiescence can be modelled with non-thermal components since CRSFs are generated through non-thermal origin (inverse Compton scattering of electrons off photons). Motivated by these findings, we modelled the broad-band spectra of MXB 0656−072 and MAXI J1409−619 using two non-thermal components (two Comptonization and two power law). Although we were not able to constrain both the non-thermal components – given the faintness of both sources compared against other bright Be XRPs like A0535+262 in quiescence – we could constrain at least one non-thermal component. The detection of this non-thermal component is crucial as it indicates ongoing accretion even in quiescence. The power-law component has been generally understood to arise due to low-level accretion in LMXBs (Wijnands et al. 2015) and even in some X-ray pulsars such as RX J0812.4−3114 (Zhao et al. 2019). In pulsars such as GS 0834–430, Swift J1626.6−5156, Cep X-4, etc., it was proposed that the non-thermal emission arose as a result of low-level accretion from a CD (Tsygankov et al. 2017a). For the case of MAXI J1409−619, the CD model is not favoured. Moreover, an accretion column is not expected to form at such low luminosity states. Additionally, the lack of knowledge about the companion star can indicate alternative sources of origin for the non-thermal emission. Possible avenues include the accretion disc (wind-fed systems could still form discs; Karino, Nakamura & Taani 2019) or the companion star’s circumstellar disc.
It is worthwhile to note that the presence of cyclotron lines at 33 and 44 keV for MXB 0656−072 and MAXI J1409−619, respectively, outside quiescence, also indicate the non-thermal origin of X-rays in these systems out of quiescence. Although we were limited by statistics to constrain these features in the quiescent spectrum, these features are tell-tale signatures of the non-thermal origin of X-rays in these systems.
The study of such low-luminosity HMXBs in quiescence can be greatly boosted with instruments having a larger effective area in hard X-rays. One such proposed probe class mission is the High-Energy X-ray Probe (HEX-P; Madsen et al. 2019). HEX-P provides focused hard X-rays up to ∼150 keV using two high-energy telescopes and soft X-ray coverage with a low-energy telescope with a much larger area than NuSTAR. HEX-P’s unique capabilities would enable the study of accretion onto NSs across a wide range of energies, including in low-luminosity regimes like the ones studied in this paper.
5 CONCLUSIONS
In this work, we study the quiescent state properties of MXB 0656−072 and MAXI J1409−619 using sensitive NuSTAR observations. We detect a strong pulsation at 502 s in MAXI J1409−619 with a 66 per cent pulsed fraction in the folded pulse profile. Our measured spin period is consistent with previous measurements. The observed pulse profile is typical of X-ray pulsars accreting at low levels. The pulsed fraction is seen to have an increasing trend as a function of energy, which is also consistent with what is observed in other X-ray pulsars. We do not detect QPOs in the power density spectra for MAXI J1409−619.
The fluxes measured in this work indicate that neither of these two sources, MXB 0656−072 and MAXI J1409−619, is in the propeller regime despite observations being carried out luminosities of 2.6 × 1033 and 1 × 1035 erg s−1, respectively. We show that the broad-band spectral fits for both pulsars are best described using a combination of thermal and non-thermal emission components. The non-thermal component, which is very soft, is likely to emerge as a result of low-level accretion. From the measured radius of the blackbody emitting region, we infer that the thermal emission likely arises from the accretion heated hot spots on the surface of the NS. The detection of pulsed emission along with non-thermal emission in MAXI J1409−619 is indicative of ongoing accretion during quiescence. Future sensitive broad-band observations of X-ray pulsars during quiescence will be useful to further understand low luminosity accretion processes.
ACKNOWLEDGEMENTS
This research has made use of data and software provided by the High Energy Astrophysics Science Archive Research Center (HEASARC), which is a service of the Astrophysics Science Division at NASA/GSFC and the High Energy Astrophysics Division of the Smithsonian Astrophysical Observatory. The analysis work has made use of the NuSTAR Data Analysis Software (NuSTARDAS) jointly developed by the ASI Space Science Data Center (SSDC, Italy) and the California Institute of Technology (Caltech, USA). GR was supported by NASA under award number 80NSSC22K1814. GR is grateful to Deepto Chakraborty and Ron Remillard for useful discussions.
DATA AVAILABILITY
The observational data utilized in this work are publicly available through the High Energy Astrophysics Science Archive Research Center. Any additional information will be shared on reasonable request to the corresponding author.
Footnotes
PF = (Imax − Imin)/(Imax + Imin), where Imax and Imin are the maximum and minimum normalized count rates associated with the pulse profile.
