


ABSTRACT
Using a semi-analytic galaxy formation model, we study analogues of eight z ≳ 12 galaxies recently discovered by James Webb Space Telescope (JWST). We select analogues from a cosmological simulation with a (311 cMpc)3 volume and an effective particle number of 1012 enabling the resolution of every atomic-cooling galaxy at z ≤ 20. We vary model parameters to reproduce the observed ultraviolet (UV) luminosity function at 5 < z < 13, aiming for a statistically representative high-redshift galaxy mock catalogue. Using the forward-modelled JWST photometry, we identify analogues from this catalogue and study their properties as well as possible evolutionary paths and local environment. We find faint JWST galaxies (MUV ≳ − 19.5) to remain consistent with the standard galaxy formation model and that our fiducial catalogue includes large samples of their analogues. The properties of these analogues broadly agree with conventional spectral energy distribution-fitting results, except for having systematically lower redshifts due to the evolving ultraviolet luminosity function, and for having higher specific star formation rates as a result of burstier histories in our model. On the other hand, only a handful of bright galaxy analogues can be identified for the observed z ∼ 12 galaxies. Moreover, in order to reproduce the z ≳ 16 JWST galaxy candidates, boosting star-forming efficiencies through reduced feedback regulation and increased gas depletion rate is necessary relative to models of lower redshift populations. This suggests star formation in the first galaxies could differ significantly from their lower redshift counterparts. We also find that these candidates are subject to low-redshift contamination, which is present in our fiducial results as both the dusty or quiescent galaxies at z ∼ 5.
1 INTRODUCTION
If the Hubble Space Telescope (HST) gave us a glimpse of the z ≳ 10 Universe through the keyhole, James Webb Space Telescope (JWST) has undoubtedly opened the door. Since its Early Release Observations (ERO; Pontoppidan et al. 2022) and Director’s Discretionary Early Release Science (ERS) programmes were made publicly available, a large number of z ≳ 10 candidates have been reported by various independent groups using NIRCam imagings (Whitler et al. 2020; Bradley et al. 2022; Castellano et al. 2022; Finkelstein et al. 2022; Ono et al. 2022; Naidu et al. 2022a, b; Atek et al. 2023; Cullen et al. 2023; Furtak et al. 2023; Robertson et al. 2023; Rodighiero et al. 2023; Yan et al. 2023; Zavala et al. 2023; Adams et al. 2023a; Donnan et al. 2023a; Harikane et al. 2023b). These preliminary results include some discoveries which challenge the current concordance model (Boylan-Kolchin et al. 2009; Haslbauer et al. 2022; Parashari & Laha 2023). Following up on the recent NIRSpec result (Curtis-Lake et al. 2023) pushing the earliest, spectroscopically confirmed high-redshift galaxy to |$z=13.2_{-0.07}^{+0.04}$|, we aim to quantify whether standard galaxy formation models are consistent with these observables at the cosmic dawn.
According to the standard galaxy formation model (see reviews by Somerville & Davé 2015; Naab & Ostriker 2017; Vogelsberger et al. 2020, and references therein), galaxies form from the gravitational collapse of over-dense regions of dark matter and gas, which subsequently grow through mergers and accretion. Gas cools and condenses to form stars, which illuminate the host galaxy and allow us to observe its complex structure. The standard model also accounts for the role of feedback processes, including energy, mass and metals injected by supernovae and central supermassive black holes. These have been proven essential to regulating star formation and shaping galaxy properties.
Using a semi-analytic galaxy formation model (introduced in Section 2), we make realizations of the early Universe including NIRCam broad-band photometry for billions of galaxies at z ≥ 5. By varying efficiencies of gas depletion and stellar feedback, this theoretical galaxy population is calibrated to represent summary statistics of the large sample observed before JWST, mostly at z ≤ 10. In this modelled galaxy catalogue, we then seek those having a spectral energy distribution (SED) close to the new JWST observations, for which we include both the NIRSpec targets and several NIRCam candidates1 at z ≳ 12. Our objective is to (1) probe the potential formation history and local environment of galaxies formed in the first ∼300 Myr of our Universe using modelled analogues, where identifiable; and otherwise (2) study the implications for standard galaxy formation model where the modelled galaxies are inconsistent with observations.
The cosmic chronology of our targets is illustrated in Fig. 1 and their inferred properties from various observational campaigns are summarized in Table 1. After discussing their implications for galaxy formation models in Section 3, we present analogues of these JWST galaxies in Section 4. Section 5 concludes our results. Cosmological parameters from Planck 2018 (Ωm, Ωb, ΩΛ, h, σ8, and ns = 0.312, 0.0490, 0.688, 0.675, 0.815, 0.968; Planck Collaboration VI 2020) are adopted in this study.
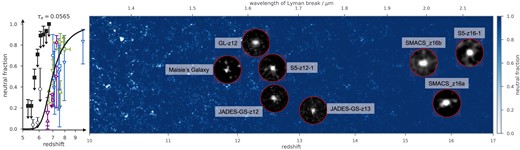
Right-hand panel: eight z ≳ 12 JWST targets explored in this work with background illustrating the early stage of reionization (projected with a depth of 4 cMpc, a typical bubble radius for high-redshift bright galaxies) according to our fiducial model. References for these galaxy observations are listed in Table 1. Left-hand panel: the predicted mean neutral fraction (at later times), resulting in a CMB optical depth of 0.0565 and consistent with Planck (Planck Collaboration VI 2020; Qin et al. 2020). Observational data are categorized roughly into the model-independent constraints from dark pixel measurements (black; McGreer, Mesinger & D’Odorico 2015; Jin et al. 2023), estimates from Lyman-α damping-wing absorption (blue; Greig et al. 2017; Bañados et al. 2018; Davies et al. 2018; Greig, Mesinger & Bañados 2019; Wang et al. 2020; Umeda et al. 2023), Lyman-α equivalent width of emitting galaxies (LAE; green; Mason et al. 2018; Jung et al. 2020; Whitler et al. 2020; Bolan et al. 2022; Bruton et al. 2023), and their luminosity function or clustering (purple; Inoue et al. 2018; Ouchi et al. 2018; Morales et al. 2021; Wold et al. 2022).
Properties of the z ≳ 12 JWST targets explored in this work.
| Section | ID | z | MUV | log10 (M*/M⊙) | |$\mathrm{SFR}(\mathrm{M}_{\odot}\mathrm{yr}^{-1})^{\mathrm{a}}$| | Referencesb | Commentsc |
|---|---|---|---|---|---|---|---|
| 4.1 | JADES-GS-z13 | |$13.20^{+0.04}_{-0.07}$| | −18.5 ± 0.2 | |$7.8^{+0.4}_{-0.5}$| | |$1.0_{-0.5}^{+1.0}$| | CL23, R22, D23b, H23a | |
| 4.1 | JADES-GS-z12 | |$12.63^{+0.24}_{-0.08}$| | −18.8 ± 0.1 | |$8.4^{+0.4}_{-0.7}$| | |$1.3_{-0.9}^{+1.9}$| | CL23, R22, H23a | Consistent with fiducial |
| 4.2 | S5-z12 − 1 | |$12.58^{+1.23}_{-0.46}$| | −20.2 ± 0.1 | |$8.53^{+0.61}_{-0.69}$| | |$5.5^{+4.7}_{-4.4}$| | H23b | |
| 4.3 | GLz12 | |$12.2^{+0.1}_{-0.2}$| | −21.0 ± 0.1 | |$9.1^{+0.3}_{-0.4}$| | |$6^{+5}_{-2}$| | N22, B23, D23a, H23b, O22, P23, S23 | Consistent with fiducial but challenging |
| 4.4 | Maisie’s Galaxy | |$11.44^{+0.09}_{-0.08}$| | |$-20.32^{+0.08}_{-0.06}$| | |$8.50^{+0.29}_{-0.44}$| | |$2.1^{+4.8}_{-2.0}$| | FI22, AH23, D23a, H23ab, O22, Z23 | |
| 4.5 | SMACS_z16a | |$15.92^{+0.17}_{-0.15}$| | −20.59 ± 0.15 | |$8.79^{+0.32}_{-0.33}$| | |$16.6^{+2.9}_{-16.4}$| | AT23, AD23, FU23, H23b | Inconsistent with fiducial, requiring maxSF |
| 4.5 | SMACS_z16b | |$15.32^{+0.16}_{-0.13}$| | −20.96 ± 0.14 | |$8.80^{+0.44}_{-0.25}$| | |$57.5^{+38.0}_{-29.4}$| | ||
| 4.6 | S5-z16 − 1 | |$16.41^{+0.66}_{-0.55}$| | −21.6 ± 0.3 | |$8.59^{+1.23}_{-0.31}$| | |$5.1^{+21.7}_{-1.8}$| | H23b, O22 | Inconsistent with fiducial, even challenging to maxSF |
aSFR is averaged over 50 Myr except for JADES-GS-z12, JADES-GS-z13, and Maisie’s Galaxy in which 30, 30, and 10 Myr are considered, respectively.
bReferences are Adams et al. (2023b, AD23), Arrabal Haro et al. (2023, AH23), Atek et al. (2023, AT23), Bakx et al. (2023, B23), Curtis-Lake et al. (2023, CL23), Donnan et al. (2023a, D23a), Donnan et al. (2023b, D23b), Finkelstein et al. (2022, FI22), Furtak et al. (2023, FU23), Harikane et al. (2023a, b, H23ab), Naidu et al. (2022b, N22), Ono et al. (2022, O22), Popping (2023, P23), Robertson et al. (2023, R22), Santini et al. (2023, S23), and Zavala et al. (2023, Z23). cThis last column states whether the galaxy is consistent with our galaxy-formation models.
2 MODELLING THE FIRST GALAXIES DURING THE EPOCH OF REIONIZATION
In this work, we use the Meraxes semi-analytic model (SAM; Mutch et al. 2016), designed to study the Epoch of Reionization (EoR). The model is applied to dark matter halo merger trees introduced in Balu et al. (2022), which were constructed (with the VELOCIraptor halo-finder and TreeFrog algorithm by Elahi et al. 2019a, b) from an N-body simulation of 210 h−1 cMpc (performed by Power et al., in preparation using swift by Schaller et al. 2023) that has been augmented (with DarkForest by Qiu et al. 2020) to resolve2 all atomic-cooling halos at z ≤ 20 (i.e. Mvir ≥ 3 × 10⁷M⊙). With halo properties inherited from the merger trees, our SAM assigns galaxies with a baryonic component according to the cosmic mean and the strength of local photoionization (following the 1D simulation result of Sobacchi & Mesinger 2013). It then evaluates galaxy properties based on various astrophysical processes including gas accretion and cooling, stellar evolution and feedback, as well as metal enrichment, satellite infall, and merger events.
We also incorporate standard stellar population synthesis (using the instantaneous model with nebular continuum included from starburst99 by Leitherer et al. 1999) and estimate attenuation by the interstellar medium (ISM) and intergalactic medium (IGM; following Charlot & Fall 2000 and Inoue et al. 2014) to calculate galaxy spectra as well as SEDs with the NIRCam wide-band filters. The model also includes feedback from active galactic nucleus (Qin et al. 2017) but their ultraviolet (UV) emission is ignored in this work. We assume 15 per cent of UV-ionizing photons and X-rays above 500-eV escape from the host galaxy, and study their impact on the large-scale neutral IGM (via an excursion-set algorithm based on 21cmFAST by Mesinger, Furlanetto & Cen 2011; see also Murray et al. 2020). Fig. 1 illustrates the early stage of reionization according to our fiducial model, for which the late-time prediction and integrated EoR history are consistent with quasar/Lyman-alpha emitter observations (McGreer et al. 2015; Greig et al. 2017; Bañados et al. 2018; Davies et al. 2018; Inoue et al. 2018; Mason et al. 2018; Ouchi et al. 2018; Greig et al. 2019; Jung et al. 2020; Wang et al. 2020; Whitler et al. 2020; Morales et al. 2021; Qin et al. 2021; Bolan et al. 2022; Greig et al. 2022; Wold et al. 2022; Jin et al. 2023; Campo et al., in preparation) and Planck’s latest measurement of the cosmic microwave background (CMB; Planck Collaboration VI 2020; Qin et al. 2020). This fiducial model also results in a high-redshift galaxy and quasar population that is statistically representative of the observed Universe, including the predicted stellar mass function and UV non-ionizing luminosity function calibrated against observations across cosmic time (z ∼ 5–10; Qin et al. 2017).
The adopted fiducial parameters3 and how we tuned them are outlined in detail by Qiu et al. (2019) where Bayesian inference was performed against the observed UV luminosity function and colour–magnitude relation prior to JWST. Here, we illustrate the luminosity function between z = 20 and 5 in Fig. 2 with some latest measurements including those taking advantage of the early JWST data. While the model was only calibrated against observations at lower redshifts, its prediction at z > 10 remains accurate with only some discrepancies at the very bright end which we further examine in the next section.
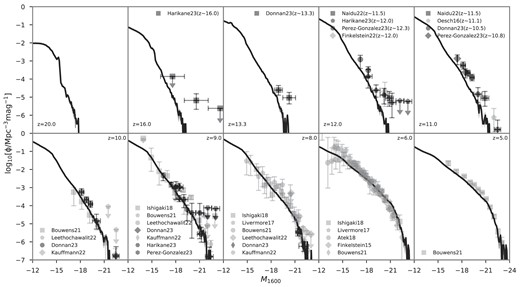
Galaxy UV non-ionizing luminosity functions from z = 20 to 5 predicted by our fiducial model, which was calibrated to reproduce the observational data (light grey) prior to JWST such as Finkelstein et al. (2015); Oesch et al. (2016); Livermore, Finkelstein & Lotz (2017); Atek et al. (2018); Ishigaki et al. (2018); Bhatawdekar et al. (2019); Bouwens et al. (2021); Leethochawalit et al. (2022); Bouwens et al. (2023); and Kauffmann et al. (2022). Shaded regions and error bars indicate the 1σ Poisson error from the model and observations. We also highlight (dark grey) recent JWST results from Finkelstein et al. (2022); Naidu et al. (2022b); Donnan et al. (2023a); Harikane et al. (2023b); and Pérez-González et al. (2023), which are still broadly consistent with our model prediction at least in the faint range. We also note that a z ∼ 16 candidate (CEERS-93316) selected by Donnan et al. (2023a) and Harikane et al. (2023b) has recently been refuted spectroscopically. However, Atek et al. (2023) reported two other z ∼ 16 candidates in the same field (SMACS J0723) and hence a revised number density will likely be at a similar level.
3 IMPLICATIONS OF BRIGHT JWST GALAXIES FOR A STANDARD GALAXY FORMATION MODEL
GLz12 (Naidu et al. 2022b) and Maisie’s Galaxy (Finkelstein et al. 2022) are two bright galaxies at z ∼ 12. However, observing them in these small-volume ERS programs indicates a surprisingly large number density for high-redshift bright galaxies – GLz12 sets the number density for galaxies of MUV ∼ −21 at ϕ ∼ 10−5 Mpc−3mag−1 together with another z ∼ 10 candidate reported in GLASS (Naidu et al. 2022b); while Maisie’s Galaxy suggests ϕ ∼ 2 × 10⁻⁵ Mpc−3 mag−1 at a luminosity ∼1 mag fainter. These values, although having large uncertainties, are consistent with each other and more recent estimates from much larger samples (Pérez-González et al. 2023; Donnan et al. 2023a; Harikane et al. 2023b).
On the other hand, theoretical models that tie galaxy formation closely to their host halo growth seem to struggle to simultaneously match both the bright and faint end of the luminosity function as well as its cosmic evolution (e.g. Dayal et al. 2014; Behroozi et al. 2019 used in Naidu et al. 2022b; see also discussion in Mason, Trenti & Treu 2023; Yung et al. 2023). This is also the case for our model. We highlight the galaxy UV luminosity function at z = 10–13 from multiple snapshots of Meraxes output in the left-hand panel of Fig. 3. To facilitate discussion of possible failures of semi-analytic galaxy formation models at high redshift, we also add results from
no dust, a fiducial model where dust attenuation in stellar birth clouds and in the ISM is ignored to explore the possibility that extrapolating our dust model to such early Universe might be inaccurate;
no dust or fb, a no dust model with supernova (and reionization) feedback further minimized to study scenarios where feedback in the first galaxies is much weaker than previously expected;
maxSF, a no fb model with gas depletion set at the dynamical time-scale. This model possesses the maximum star formation efficiencies our SAM can achieve without altering initial mass function (IMF). We will use this model to illustrate that some of these JWST candidates might be forming stars at much higher rates compared to galaxies at z ≲ 10.
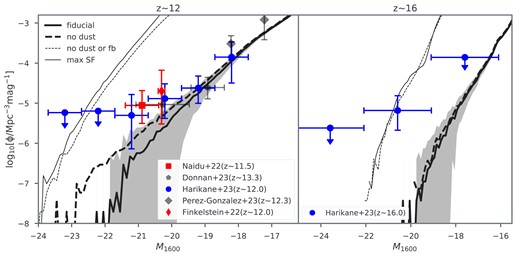
Left-hand panel: similar to Fig. 2 but focused on luminosity function at redshifts around S5-z12-1 (Harikane et al. 2023b), GLz12 (Naidu et al. 2022b) and Maisie’s Galaxy (Finkelstein et al. 2022) – 17 consecutive snapshots from Meraxes between z = 10 and 13 are considered as independent realizations to sample a single larger volume of bright galaxies. However, the sampling variance shown as the shaded region for the fiducial model becomes more profound using this approach which considers the Poisson error of each sub-volume to be independent. In addition to the fiducial prediction, models that ignore dust attenuation (no dust; its sampling variance is comparable to the fiducial result), supernova feedback (no dust or fb) and maximize star formation efficiency (maxSF) are shown for comparison together with the early JWST estimates by Naidu et al. (2022b); Pérez-González et al. (2023); Donnan et al. (2023a); Harikane et al. (2023b); and Finkelstein et al. (2022). Right-hand panel: luminosity function at redshifts around z = 16. Our simulation results are based on 10 consecutive snapshots between z = 15 and 17 while observational estimates come from Harikane et al. (2023b). As noted in Fig. 2, CEERS-93316 that was considered as a z ∼ 16 candidate by Harikane et al. (2023b) is, in fact, a z = 4.9 low star-forming dusty galaxy (Arrabal Haro et al. 2023). However, as the two z ∼ 16 candidates reported by Atek et al. (2023) remain promising and were found in the same field as what Harikane et al. (2023b) explored, a revised number density will likely be at a similar level.
3.1 Model modifications to reproduce more bright galaxies at high redshift
The dust model in our simulation is based on Charlot & Fall (2000), linking attenuation in stellar birth clouds and the ISM to star formation rates, metallicities and gas column densities. Its parameters were chosen after a rigorous Bayesian exploration (Qiu et al. 2019) with constraints from UV luminosity functions and colour–magnitude relations at relatively lower redshifts (z ∼ 4 − 7; Bouwens et al. 2014, 2015). At higher redshifts, the detection of GNz11 by Oesch et al. (2016) previously challenged the validity of these dust models at z > 10 (Mutch et al. 2016). This is evident in Fig. 2 with the predicted number density being barely consistent with the inferred value by GNz11 (but see the latest spectroscopic result from Bunker et al. 2023 which resets GNz11 with a fainter magnitude and lower redshift). However, the latest JWST result for fainter galaxies from Donnan et al. (2023a) and Harikane et al. (2023b) suggests that the model prediction is consistent with observations up to z ∼ 14. Should the dust model fail at z > 10 for the brightest galaxies (see e.g. Ferrara, Pallottini & Dayal 2023; Markov et al. 2023), the detection of GLz12 might still challenge our model as its luminosity function at z ∼ 12 when ignoring dust attenuation is still >2 times lower than GLz12 implies in Fig. 2. Only if multiple snapshots are considered, our cosmic-variance limited sample becomes 1σ consistent with GLz12 (see Fig. 3).
To explain the properties of these luminous galaxies, Harikane et al. (2023b) considered modifying the IMF4 and incorporate a top-heavy, PopIII-dominated IMF to increase the intrinsic UV luminosity (see also recent theoretical work by Haslbauer et al. 2022, Parashari & Laha 2023, Shen et al. 2023, Sun et al. 2023, Trinca et al. 2023, and Yung et al. 2023). Meraxes is being upgraded to enable accurate modelling of PopIII star formation to address this possibility (Ventura et al., in preparation). In this work, we limit our exploration to the supernova feedback.
Supernova feedback is modelled as a thermal and kinetic source to inhibit gas collapse and star formation. Its efficiencies are tied to the maximum circular velocity (Vmax) of the host halo and increase in galaxies with shallower gravitational potentials (Murray, Quataert & Thompson 2005; Guo et al. 2011). While the energy coupling efficiency has no redshift dependence for a given Vmax, earlier results suggest larger mass-loading factors are of necessity to heat more gas in the early Universe (Hopkins et al. 2014; Hirschmann, De Lucia & Fontanot 2016; Cora et al. 2018). This again is based on matching relatively lower redshift observations (cf. what we study in this work) and could fail at the early stages of the Epoch of Reionization (EoR). Assuming no supernova feedback at all (no dust or fb in Fig. 3) leads to higher number densities even with respect to the upper limits from the cosmic-variance-free results of SuperBoRG at relatively lower redshifts (Leethochawalit et al. 2022, see also Bagley et al. 2022). We can further enhance the number density by reducing the time-scale to convert gas into stars5 (i.e. maxSF). These suggest that boosting star-forming efficiencies through reduced supernova feedback and/or increased gas depletion rate6 at z > 10 is needed to better model these new observations from JWST.
3.2 JWST z ∼ 16 candidates are inconsistent with the standard model.
The necessity of alternative galaxy formation models has become increasingly pressing as observations have moved towards higher redshifts. The right-hand panel of Fig. 3 highlights our fiducial predictions for the galaxy population at z ∼ 16, which presents very few galaxies that are brighter than –20 mag at these redshifts. However, the faintest reported z ∼ 16 candidate has a UV magnitude of −20.4 ± 0.2. This implies that there are no analogues for any of the z ∼ 16 candidates in our fiducial catalogue.
One might argue that these early JWST surveys are limited to a small effective volume and can be potentially biased by sample variance (see estimates by Yung et al. 2023). However, our fiducial/standard galaxy formation model extrapolates to a number density of ≲ 10−12Mpc−3mag−1 at the magnitude of the brightest candidate (M1600 = − 21.6). This implies that if these galaxies are spectroscopically confirmed to be at z ∼ 16, they will only exist in our fiducial outputs if the simulation volume covers the entire observable Universe. Given this, we argue that the existence of those z ∼ 16 candidates is inconsistent with our standard galaxy formation model, which we emphasize again has a predicted galaxy population that is statistically representative of observations at relatively lower redshifts and/or luminosities.
At such high redshifts, dust is expected to have been produced in only trace amounts and therefore to not affect the UV luminosity function. However, we can still only reproduce z ∼ 16 galaxies with intrinsic UV magnitudes around −21 when feedback is assumed ineffective. In fact, to be consistent with the estimated number density for UV bright galaxies at z ∼ 16 (Harikane et al. 2023b), we need to effectively turn off supernova feedback and maximize star formation efficiency (see maxSF in the right-hand panel of Fig. 3). It is worth noting that when Harikane et al. (2023b, see also Donnan et al. 2023a and Naidu et al. 2022a) was estimating the number density of z ∼ 16 bright galaxies, CEERS-93316 was considered as a candidate. However, a recent NIRSpec result has refuted this z ∼ 16 nature and determined it is, in fact, a low star-forming dusty galaxy at z = 4.9 (Arrabal Haro et al. 2023). On the other hand, there are two additional z ∼ 16 candidates reported by Atek et al. (2023, and studied further in the next section) which remain promising. Since they were found in a sub-field that Harikane et al. (2023b) explored, a revised number density that considers these two candidates are likely to be at a similar level as estimated by Harikane et al. (2023b).
The detection of these extremely bright candidates at z ∼ 16 further illustrates that while feedback and regulated star formation are essential to galaxy formation across most cosmic time, this may not be the case at z ≳ 16.
4 JWST GALAXIES, OBSERVED, AND MODELLED
In this section, the eight high-redshift JWST galaxies (see Table 1) are discussed in order of their redshifts and luminosities – we start from intrinsically faint objects at relatively low redshifts, and then move onto bright ones found at much earlier times which also becomes increasingly challenging to study their analogues sometimes even with additional tuning of our model.
4.1 JADES-GS-z13 and JADES-GS-z12
Curtis-Lake et al. (2023) and Robertson et al. (2023) reported four spectroscopically confirmed galaxies at z > 10. The two targets studied here, JADES-GS-z13 and JADES-GS-z12 of redshifts |$z{=}13.30_{-0.07}^{+0.04}$| and |$z{=}12.63_{-0.08}^{+0.24}$|, respectively, come from an epoch even earlier than the previous record of high-redshift galaxies with spectroscopic confirmation, GNz11 (Oesch et al. 2016, see also Bunker et al. 2023 for an updated spectrum with NIRSpec). These galaxies are results from the JWST Advanced Deep Extragalactic Survey (JADES) that combines NIRCam and NIRSpec targeting at the GOODS (i.e. Great Observatories Origins Deep Survey) South (GS) field, reaching a 5σ mag limit of ∼28.4 mag for spectroscopy. When fitting the SEDs, Curtis-Lake et al. (2023) utilized the full spectra while Robertson et al. (2023) focused on the photometric data, leading to similar (but not identical) physical properties – both JADES-GS-z13 and JADES-GS-z12 are quite small with an intrinsic UV magnitude fainter than –19 mag and a stellar mass of only ∼108 M⊙.
4.1.1 Analogue selection
In this work, we focus on the SEDs and inferred galaxy properties reported by Robertson et al. (2023) when identifying analogues within our simulation. In particular, we look for modelled galaxies that have an SED consistent with the measurement by requiring the magnitude in bands F200W, F277W, F356W, and F444W (i.e. the ones above the Lyman-α break) to be within 2σ of the observational uncertainties7 while luminosities also have to be under the 2σ threshold for bands of non-detection (i.e. F090W, F115W, and F150W). We further apply a prior on the redshift range (i.e. z ∈ [10.8, 16.9] over 31 snapshots) to avoid low-redshift contamination and speed up the selection process.
It is worth highlighting an implicit prior built into our analogue selection as a result of the evolving luminosity function – within a cosmological simulation box, there are more galaxies with fainter magnitudes or lower redshifts (see Fig. 2). Therefore, when marginalizing the analogue sample distribution on to luminosity versus redshift, galaxies with low luminosities and redshifts are dominant. This often leads to lower values of these two properties (and other properties sharing a degeneracy) compared to observational results that do not impose such a prior.
Our selection leads to 1296 and 397 analogues in our fiducial output for JADES-GS-z13 and JADES-GS-z12, respectively, whose properties are summarized in Figs 4 and 5.
![JADES-GS-z13 analogues. Lower left-hand corner plot: marginalized galaxy property distributions of the model analogues with the redshift prior set to be between z = 10.8 and 16.9 (red) or within the 2σ uncertainties of the spectroscopic result from Curtis-Lake et al. (2023, blue), respectively. Note that in the 1D distributions, the vertical axes present number densities in linear scale with the total integral normalized to unity for both distributions. From the left- to right-hand panels or top-to-bottom panels, these are redshift, intrinsic UV magnitude, star formation rate averaged over 30 Myr and normalized by stellar mass (sSFR), stellar mass, metallicity, dust extinction, galaxy size, halo virial mass, the fraction of gas that is accessible to star formation, and the radius of surrounding ionized bubble. Indicated on the top of each 1D distribution are the median value and 1σ uncertainties ([16, 84] percentiles) based on the larger redshift prior. For comparison, estimates from Robertson et al. (2023) are shown as the grey-shaded regions and inside the parentheses. Top right-hand panel: modelled SED and spectra for an example analogue with thick solid and thin dashed lines indicating whether dust attenuation is considered. The nominated SEDs and 2σ uncertainties from Robertson et al. (2023, using forcepho) are shown with black circles while upper limits are presented as 5σ. Central right-hand corner plot: star formation rate in the past 100 Myr for 10 randomly selected analogues, to illustrate the bursty star formation nature of these low-mass galaxies in our simulation as a reason for the inferred high sSFR.](https://oup.silverchair-cdn.com/oup/backfile/Content_public/Journal/mnras/526/1/10.1093_mnras_stad2448/1/m_stad2448fig4.jpeg?Expires=1749136952&Signature=WMpAqmIyuREXGheZx5n9WZNUjspwkD01YKSQ2AcIzsr1T4Zi~8UTReHBgWJw1g53Y40O~7DS3OM-7eHiKPDDJW4dGjZms4JlsLO8Bqddx78IGjaN22kHUkcjSWtst2AXXcmH08PVcyZuT5oIzACQ1abW5ghKwyJClevPFhOGfUNd8PxflbejbYX3DKDSgCGRTxeZaMN19n76TfSJ~dUlXjg~IQhbQp9zO~ZJ8KrMT73SeTmGOW5H2x7fZsL-fZUjoClEf4ehNZqhmXhACZWdcY8mfTdiMZgQMyJ-hYMzpncjnhM-TFzZYOTyFGA8CGVQsll~zVIBKsyz8QxCS3Pulg__&Key-Pair-Id=APKAIE5G5CRDK6RD3PGA)
JADES-GS-z13 analogues. Lower left-hand corner plot: marginalized galaxy property distributions of the model analogues with the redshift prior set to be between z = 10.8 and 16.9 (red) or within the 2σ uncertainties of the spectroscopic result from Curtis-Lake et al. (2023, blue), respectively. Note that in the 1D distributions, the vertical axes present number densities in linear scale with the total integral normalized to unity for both distributions. From the left- to right-hand panels or top-to-bottom panels, these are redshift, intrinsic UV magnitude, star formation rate averaged over 30 Myr and normalized by stellar mass (sSFR), stellar mass, metallicity, dust extinction, galaxy size, halo virial mass, the fraction of gas that is accessible to star formation, and the radius of surrounding ionized bubble. Indicated on the top of each 1D distribution are the median value and 1σ uncertainties ([16, 84] percentiles) based on the larger redshift prior. For comparison, estimates from Robertson et al. (2023) are shown as the grey-shaded regions and inside the parentheses. Top right-hand panel: modelled SED and spectra for an example analogue with thick solid and thin dashed lines indicating whether dust attenuation is considered. The nominated SEDs and 2σ uncertainties from Robertson et al. (2023, using forcepho) are shown with black circles while upper limits are presented as 5σ. Central right-hand corner plot: star formation rate in the past 100 Myr for 10 randomly selected analogues, to illustrate the bursty star formation nature of these low-mass galaxies in our simulation as a reason for the inferred high sSFR.

Similar to Fig. 4 but for JADES-GS-z12 and its analogues.
4.1.2 Galaxy properties
We find both observed SEDs to be consistent with modelled star-forming galaxies at z ∼ 12.6 or ∼13.2, as is evident from the two modes in the redshift distribution. With minor differences, the high-redshift mode also indicates higher luminosities, lower metallicities, and less dust extinction. However, the overall distribution does not alter significantly after applying the redshift prior inferred by the spectral break at Lyman-α (Curtis-Lake et al. 2023). For instance, the distributions indicated by the blue colour in Figs 4 and 5 are for subsamples of these 1296 or 397 analogues whose redshifts are within the 2σ uncertainties of the spectroscopic results. We see the resulting galaxy properties remain comparable to estimates from Robertson et al. (2023) – both JADES-GS-z13 and JADES-GS-z12 analogues have an intrinsic UV magnitude around M1600 = −18.5, a stellar mass less than 108 M⊙ and a size of only ∼60 physical parsecs with very low metallicities and suffering little dust attenuation.
The major difference between our result and, for instance, Robertson et al. (2023) comes from the star formation history (SFH). Already flexible, the SFH considered by Robertson et al. (2023, see also other observational studies mentioned in this work) during the SED-fitting includes six snapshots between z ∼ 12 and 20 in order to capture the burstiness of high-redshift star formation. On the other hand, there are 35 snapshots in our simulation between these redshifts and, with such a high cadence, we are able to accurately simulate the SFH in the presence of time-resolved feedback (massive stars can take much longer to become supernovae than the dynamical time-scale of the galactic disc; Mutch et al. 2016). In addition, our model does not impose the bursty-continuity prior as in Robertson et al. (2023), but rather requires galaxies to accumulate enough cold and dense gas before being able to form stars.8 For instance, Figs 4 and 5 show that JADES-GS-z13 and JADES-GS-z12 are likely hosted by halos of ∼1010 M⊙ and, with around 40 per cent of their gas accessible to star formation (fgas).9 These galaxies might have five times more (in mass) star-forming gas than their stellar components. Also because our modelled galaxies have to reach this critical mass before forming stars, the analogues possess a much burstier SFH than Robertson et al. (2023), leading to higher recent star formation rates (SFRs averaged over the past 30 Myr; and specific SFR) and/or lower integrated stellar masses.
Finally, our model also predicts that (assuming all galaxies have a UV ionizing escape fraction of 0.15) JADES-GS-z13 and JADES-GS-z12 are likely located in ionized bubbles of ≲ 2 cMpc in radius.10 However, in rare cases where the analogue coexists with a more massive neighbour, it may have a much larger ionized bubble of up to ∼4 cMpc in radius (see also Qin et al. 2022; Whitler et al. 2023).
4.2 S5-z12-1
Harikane et al. (2023b) analyzed multiple NIRCam fields, producing a comprehensive study of high-redshift JWST galaxies. Their final sample consists of 10 z ≳ 12 candidates, mostly from CEERS (i.e. Cosmic Evolution Early Release Science led by Finkelstein et al. 2022) as well as GLASS (an ERS program led by Treu et al. 2022), SMACS J0723.3-7327 (hereafter SMACS; a z = 0.39 galaxy lensing cluster that has previously been searched for high-redshift candidates, e.g. Coe et al. 2019), and Stephan’s Quintet (a group of five local galaxies).
As the total effective area probed by these fields amounts to ∼90 deg2, Harikane et al. (2023b) estimate the galaxy UV luminosity function out to z ∼ 16. Fig. 2 shows that our fiducial model is consistent with their result at the faint end, echoing the large analogue sample that we have successfully identified for faint galaxies such as the two JADES-GS galaxies (see also McCaffrey et al. 2023) in Section 4.1. However, a significantly lower number density for bright galaxies is also seen from our simulation result, indicating that the identification of analogues is increasingly challenging for more luminous candidates.
Here, we focus on candidates from Harikane et al. (2023b) that have a UV magnitude brighter than ∼–20. Among these, we first present analogues for the faintest11 target in this section, S5-z12-1, which is a |$z{=}12.58^{+1.23}_{-0.46}$| galaxy with an intrinsic UV magnitude of −20.2 ± 0.1 found in Stephan’s Quintet.
4.2.1 Analogue selection
Photometry from only three filters was reported by Harikane et al. (2023b) for S5-z12-1. For analogue selection, we require 2σ consistency in band F200W and F356W between the forward modelling and the observational data; while the inferred magnitude in the non-detection band, F150W, must be lower than the 2σ threshold. We use the same 31 snapshots as before and focus on z ∼ 11–17. We end up with a surprisingly large number of 377 analogues, among which, however, only 22 have an intrinsic UV magnitude 2σ consistent with the estimate of Harikane et al. (2023b). We show a similar summary plot as before for S5-z12-1 in Fig. 6 but with the blue colour highlighting analogues with the high UV luminosity inferred by the observation.
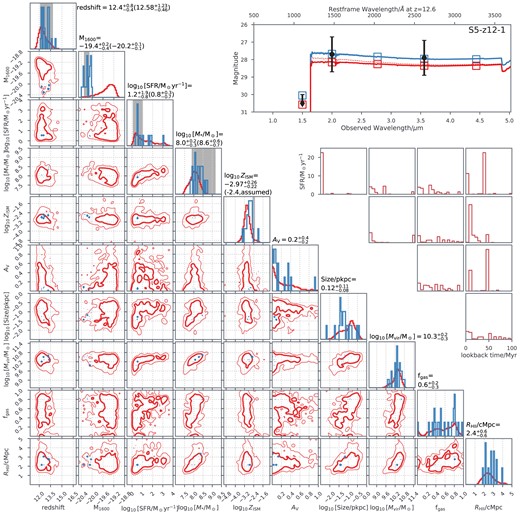
Similar to Figs 4 and 5 but for S5-z12-1 and its analogues. Note the upper limit in band F150W is 2σ and the blue colour now indicates a small number of analogues having M1600 consistent with the 2σ uncertainties of the inferred luminosities from Harikane et al. (2023b). Since the randomly selected analogue spectrum represents a low-luminosity galaxy, the top left-hand panel also highlights a second analogue with an intrinsic magnitude comparable to the observation. To ease comparison, we also replace the sSFR panels with SFR, which is now an averaged over 50 Myr following Harikane et al. (2023b).
4.2.2 Galaxy properties
Fig. 6 shows that our inferred properties are mostly consistent with those of Harikane et al. (2023b, compare 1D distributions with grey shaded regions), except for the intrinsic UV magnitude – our model suggests S5-z12-1 is a more massive, larger and brighter galaxy than the two confirmed z ∼ 12 galaxies but still with a low metallicity and minor dust attenuation. It has adequate gas available for star formation thanks to its 1010–1010.5 M⊙ halo mass. This indicates that S5-z12-1 is likely located in a more overdense region and hence surrounded by a larger ionized bubble of ∼2.5 cMpc radius.
The significantly lower luminosity (than Harikane et al. 2023b inferred) we obtain for S5-z12-1 is likely caused by our predicted z ∼ 12 UV luminosity function dropping to a level lack of statistical meaning at M1600 around −20.2. Therefore, when seeking analogues in our modelled cosmological lightcone where galaxy number evolves with not only redshift but also luminosity, we preferentially find galaxies on the higher magnitude end of the observed photometry uncertainties (see e.g. the red line in the SED panel of Fig. 6). When focusing on the 22 analogues that have the intrinsic UV magnitude between −20.4 and −20, the inferred properties become more consistent with the observational results. This includes SFR and stellar mass, which were shown in Section 4.1 to be systematically different from observations that assume the continuity prior for SFH. This improved consistency is likely due to the slightly larger masses of S5-z12-1 analogues, which facilitate a smoother (i.e. continuous) SFH in our model.
In the next two sections, we discuss even brighter z ∼ 12 targets. For them, because of the low predicted number density as seen by our fiducial model, we will no longer obtain a statistically meaningful analogue sample. Rather, the few analogues we present below can only be interpreted as possible solutions for these JWST high-redshift galaxies. This includes their evolutionary paths and contribution to the local ionization that we will present in more detail.
4.3 GLz12
Naidu et al. (2022b) were among the first (see also Castellano et al. 2022) to report z ≳ 10 galaxies soon after JWST images became publicly available.12 This includes GLz12 from GLASS, a |$z{=}12.2^{+0.1}_{-0.2}$| target that we discuss in this subsection. Its inferred properties include an average SFR of ∼10 M⊙yr−1, a stellar mass around 109 M⊙, an intrinsic UV magnitude of −21, a low dust extinction of Av ∼ 0.3 and an effective radius around 0.5 pkpc (see also Ono et al. 2022). This object was also identified by other independent groups (Santini et al. 2023; Donnan et al. 2023a; Harikane et al. 2023b) who inferred somewhat different physical properties. In this work, we adopt the reported values from Naidu et al. (2022b).
4.3.1 Analogue selection
We use the reported photometry from Naidu et al. (2022b, their table 2), update the 1σ uncertainties with a 10 per cent error floor, and seek galaxies in the 31 consecutive output snapshots between z = 10.8 and 16.9 that have magnitudes consistent with observations – we require the modelled SED in band F200W, F277W, F356W, and F444W (all above the Lyman-α break) to be within 2σ of the observational uncertainties while the flux also has to be below the 2σ threshold for bands of non-detection (i.e. F090W, F115W, and F150W).
We identify only one analogue, which is found at the nominated photometric redshift of GLz12 using easy (Brammer, van Dokkum & Coppi 2008), i.e. z = 12.2, with the same inferred intrinsic UV magnitudes of −21.0 mag. The top panel of Fig. 7 shows the spectrum and SED of this analogue. As with the two spectroscopically confirmed galaxies, it also shows the spectral features of typical star-forming galaxies at high redshift with a UV slope of ≲ − 2 (Bouwens et al. 2014) and negligible dust attenuation.
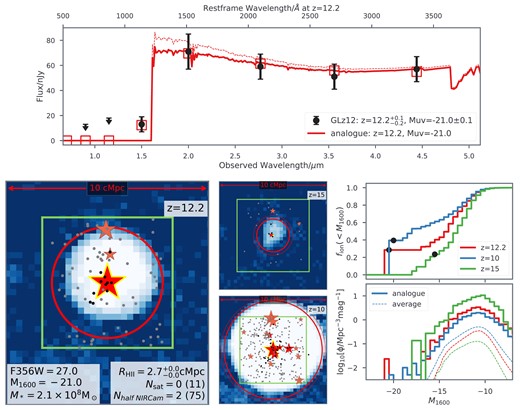
GLz12 analogue. Top panel: modelled SED and spectra are shown in colour while the nominated observed SED and the 2σ uncertainties or upper limits from Naidu et al. (2022b) are presented in black. Lower left-hand panel: local environment at the observed redshift with background indicating H i ionization (projection depth and colour follow Fig. 1). The apparent and intrinsic UV magnitudes are listed in the lower left-hand corner for the analogue followed by its stellar mass. Presented in the lower right-hand corners are the radii of the H ii bubble (with the mean indicated by thick red circles and thin ones for the 1σ uncertainties), the number of neighbouring bright galaxies (F356W < 30.7 mag) within the mean H ii bubble (indicated by filled stars) and that (indicated by the transparent stars if not inside the bubble) within half of JWST NIRCam FoV (2.2 × 2.2 arcmin2; 2D projection with Δz ∼ ±0.5, see the green squares). Numbers in the brackets indicate counting down to F356W=32.7 mag (with dark and light dots indicating faint galaxies within the bubble or within the FoV). These two magnitude thresholds are motivated by upcoming JWST deep and lensing fields, respectively. Lower middle panels: local environment at earlier and later times to visualize the evolution around the analogue. Lower right-hand panels: the normalized cumulative number of UV ionizing photons and number density as a function of UV magnitudes for galaxies within the ionized region. The UV magnitude of the GLz12 analogue as well as its progenitor and descendent is indicated by the circles.
4.3.2 Local environment
The lower panels of Fig. 7 present the local environment of our single analogue of GLz12 – from the left- to right-hand sides, we illustrate the local ionization at z = 12.2, 15, and 10 as well as the distribution of galaxies within the H ii bubble as in the normalized cumulative number of UV ionizing photons and the number density of galaxies as a function of luminosity. With a total stellar mass of 108.3M⊙, this analogue has ionized its surrounding IGM to a radius of 2.7 cMpc, larger than the majority of analogues presented in Sections 4.1 and 4.2. However, despite being the most massive galaxy in its ionized region and at least 4 mag brighter than all the other neighbouring galaxies in the H ii bubble, this analogue only contributes ∼30 per cent of the local UV-ionizing photons. Such a high and early local ionization is only possible when a significant portion (i.e. 15 per cent in the fiducial model) of ionizing photons manage to escape from the numerous low-mass galaxies that are as faint as M1600 ∼ − 15 to −12 mag.
The analogue is also in an overdense region of the universe. When counting the number of galaxies within the H ii region, the density is an order of magnitude higher than the average field inferred from the UV luminosity function (cf. Fig. 2). For instance, follow-up of GLz12 with deeper JWST observations (e.g. WDEEP led by Finkelstein et al. 2021 aims to reach a magnitude limit of F356W = 30.7) is expected to uncover another two neighbouring galaxies within 2.2 × 2.2 arcmin2 (Δz ∼ ±0.5 is considered). This is shown in Fig. 7 (see also recent follow-ups on bright LAE galaxies at relatively lower redshifts, e.g. Leonova et al. 2022; Tacchella et al. 2023; Whitler et al. 2023; Witten et al. 2023). However, among these neighbours, none sits inside the ionized bubble of the GLz12 analogue since reionization is still at its infant stage at these high redshifts and the ionized regions correspond to sizes of only Δz ∼ ± 0.01.
When probing the progenitors and descendants of GLz12, our model suggests that it is among the first galaxies that start reionization and remains highly efficient in forming stars and contributing UV ionizing photons across cosmic times. At earlier redshifts such as z ∼ 15, the analogue sits in a non-spherical ionized region of around 1.5–1.8 cMpc in radius, which is already more than half the size it will grow to by z = 12.2. Its intrinsic UV magnitude is fainter than –16 mag. Therefore, unlike GLz12 at z = 12.2, the progenitor is instead ∼3 mag fainter than the brightest in the region and has a very minor contribution to reionization at these early times. On the other hand, its dominance grows at lower redshifts. For instance, with a stellar mass exceeding 109 M⊙ at z = 10, this descendant alone contributes 40 per cent in the local ionizing budget, expanding its H ii territory to nearly 5 cMpc in radius. From the lower right-hand panels of Fig. 7, we also find the ionized region is increasingly biased towards higher redshifts with fainter galaxies becoming relatively more significant to reionization.
4.3.3 Formation history and subsequent evolution
We next look at the possible evolutionary path of GLz12 using Fig. 8, in which the history of our analogue in terms of its UV magnitude, SFR, stellar mass, halo mass, gas content, size, metallicity, and optical depth to UV non-ionizing photons is presented. The inferred properties using Prospector (Leja et al. 2017) reported in Naidu et al. (2022b) as well as estimates from Harikane et al. (2023b) and Ono et al. (2022) are also shown in the figure for comparison.

GLz12 analogue history as in (1) the intrinsic UV magnitude (thick and thin lines consider or exclude dust attenuation); (2) SFR averaged over each snapshot (blue) or ∼50 Myr following Naidu et al. (2022b, red); (3) stellar mass; (4) halo mass; (5) fraction of gas accessible to star formation; (6) galaxy half-light radius; (7) ISM metallicity; and (8) optical depths for photons with a wavelength of 1600Å (thick and thin lines for τ1600 in the birth cloud of the emitting stars or in the ISM). GLz12 properties estimated by Naidu et al. (2022b), Harikane et al. (2023b), and Ono et al. (2022) are also indicated in corresponding panels. For comparison, thin grey lines illustrate property histories for the next five brightest galaxies (only dust attenuated M1600 and τ1600 in the birth cloud are shown to not crowd the plot).
We see that the GLz12 analogue grows its UV luminosities very rapidly at z ≥ 12 with the analogue showing a 100 times increment from z ∼ 15 to 12 which is less than 100 Myr. When averaged over 50 Myr, this analogue possesses a steady growth of SFR in the past and reaches ∼10 M⊙yr−1 at z ∼ 12.2, consistent with the observational results. On the other hand, the snapshot-averaged SFR presents a bursty SFH, similar to analogues of less massive galaxies discussed in the previous two sections. However, due to its relatively large dark matter component which has created a deeper gravitational potential, a greater amount of gas has been accreted by the GLz12 analogue to fuel star formation for a longer period of cosmic time. Therefore, its SFH is less bursty compared to the low-mass counterparts such as JADES-GS-z12 and JADES-GS-z13 (cf. Figs 4 and 5). Our model predicts the GLz12 analogue has a stellar mass of only 2 × 10⁸M⊙, which is five times lower than Naidu et al. (2022b) but more consistent with Harikane et al. (2023b). These two studies adopt the same continuity prior to the SFH, highlighting the potentially underestimated systematics in these ERS results which can result in such a large difference in the inferred galaxy properties (see more discussion in Naidu et al. 2022a, b).
The halo mass evolution suggests that a number of merger events might have occurred in the formation history of galaxies like GLz12. For this particular analogue, its progenitor merges into a more massive halo at z ∼ 13, which introduces a significant increase in its star-forming gas component and triggers a re-ignition of star formation at a rate of more than 1 M⊙yr−1. Late on, around z = 12.2, the analogue encounters another major merger, further boosting star formation activities and reaching an SFR of ≳ 10 M⊙yr−1. These also lead to significant fluctuations in the predicted galaxy size (around z ∼ 12.2) between the measured values of ∼0.5 pkpc (Naidu et al. 2022b) and 0.06 ± 0.01pkpc (Ono et al. 2022), which chose different point spread functions and images during the analysis.
Note that in our model, star-forming discs are assumed to be rotationally supported, conserving specific angular momenta when the gas cools from an initially virialized state, and following an exponential surface density profile. These assumptions, made by many theoretical models (e.g. Henriques et al. 2015; Stevens, Croton & Mutch 2016) facilitating evaluation of galaxy sizes from their host halo properties, have been shown successful when predicting low-redshift observations – the scale radius is |$R_{\rm s}{=}R_{\rm vir}(\lambda /\sqrt{2})$| where Rvir and λ are the virial radius and halo spin parameter while the effective radius (or half-light radius) is Re ∼ 1.68Rs. However, the increasing merger rate towards higher redshifts implies that galaxies may not have enough time to recover from previous merger events despite having shorter dynamical time-scales (Poole et al. 2016). Although GLz12 shows no sign of multiple clumps down to 0.05 kpc, there are an increasing number of observations suggesting that galaxies at high redshift do not have a simple disc-like morphology and present signs of interaction (e.g. Treu et al. 2023; Whitler et al. 2023; Witten et al. 2023). Therefore, we caution against overinterpreting our prediction of galaxy sizes.
The fate of the GLz12 analogue is to steadily increase its UV luminosity and the stellar content with a stellar-to-halo-mass ratio that increases from 0.5 per cent at z = 12.2 to 5 per cent at z ∼ 6. It is evident from Fig. 8 that despite the bursty nature of star formation in GLz12’s analogue, its extremely bright UV radiation is not transient. For comparison, we show the property histories for the next five most luminous galaxies identified at z = 12.2. More than half of these galaxies become much fainter than the GLz12 analogue at later times with some even dropping luminosities for ≳ 100 Myr after z = 12.
Finally, in agreement with the expectation (e.g. Bouwens et al. 2010, 2014) for galaxies with a UV continuum slope of ∼-2.3 ± 0.1 (Naidu et al. 2022b, see also Cullen et al. 2023 for a larger JWST sample), our model also suggests that the GLz12 analogue experiences negligible dust attenuation at z ≳ 12.2. This is mainly driven by its low metallicity,13 which is only ∼10 per cent of the solar value and aligns with recent ALMA follow-up finding no strong [O iii] emission from GLz12 (Bakx et al. 2023, see also Popping 2023). The theoretical interpretation for such massive galaxies experiencing little dust attenuation is that either they have ejected their dust contents or current star-forming clouds are segregated from dust that was generated in earlier episodes of star formation (see e.g. Ziparo et al. 2023). As the gas fraction of the GLz12 analogue remains high at z ∼ 12, it is likely that UV-emitting regions and dust are indeed of different origins in high-redshift galaxies (see e.g. Behrens et al. 2018; Sommovigo et al. 2020). In fact, the star-forming disc only reaches the level of solar metallicity at z ∼ 8 where the optical depth to UV non-ionizing photons inside the birth cloud of stars exceeds τ1600 = 1. At this point, the cloud can absorb a significant fraction of UV photons (e.g. compare the thick and thin coloured lines in panel 1 of Fig. 8) before having dissipated after 10 Myr (Charlot & Fall 2000). UV photons also experience attenuation by the diffuse ISM dust although our model suggests this only becomes significant at very late times (z ∼ 6).
4.4 Maisie’s Galaxy
Maisie’s Galaxy at |$z=11.44^{+0.09}_{-0.08}$| was reported by multiple teams including Finkelstein et al. (2022), Donnan et al. (2023a), Harikane et al. (2023b), and Arrabal Haro et al. (2023) showing consistent inferred properties14 Using its photometric data (e.g. Finkelstein et al. 2022; |$z=11.8^{+0.2}_{-0.3}$|), it is estimated that Maisie’s Galaxy possesses a low SFR of ∼2M⊙yr−1, a stellar mass around 108.5M⊙, an intrinsic UV magnitude of −20.3, a steep UV slope of −2.5, a low dust extinction of Av ∼ 0.1, and an effective radius around 0.34 pkpc. Given its lower luminosity, identifying analogues for this galaxy should be less challenging than GLz12.
4.4.1 Analogue selection
Within our 31 simulation snapshots between z = 10.8 and 16.9, 7 galaxies are identified having fluxes consistent within at least 2σ of the observed photometry (Finkelstein et al. 2022) in the filters F150W, F200W, F277W, F356W, and F444W, as well as being lower than the 2σ upper limit in the non-detection band F115W. Although we do not forward model luminosities from the HST or JWST F410M filters, the spectra of our analogues are found also consistent with these measurements/upper limits.
Our analogues share similar physical properties with the observations, including an intrinsic UV magnitude around −20.3, a stellar mass of ∼108.5M⊙, and a redshift between 11 and 12. To be concise, only two example analogues, dubbed analogues-a and b, are presented here which are found at z = 11.3 and 12.0. From the top panel of Fig. 9, we see the SED fitting is well-performed overall with a slightly flatter predicted spectrum compared to the observation. We notice the same challenge in fitting the UV slope was also faced by Finkelstein et al. (2022, fig. 4) and Harikane et al. (2023b, fig. 8) while Donnan et al. (2023a, fig. A6) found a better fit at z = 12.3 instead. However, there are still differences between these observational results – for instance, F200W is measured to be 27.3 mag by Finkelstein et al. (2022) and 27.8 mag by the other two groups while the colour F200W–F356W is –0.4 in Donnan et al. (2023a) unlike the –0.6 by the rest of the teams. These might explain why Maisie’s Galaxy is reported to be brighter by Finkelstein et al. (2022) and less blue by Donnan et al. (2023a). Nevertheless, such a steep UV slope is consistent with most high-redshift star-forming galaxies having low metallicities (Bouwens et al. 2014), aligning with the properties of our analogues which suffer little dust attenuation.
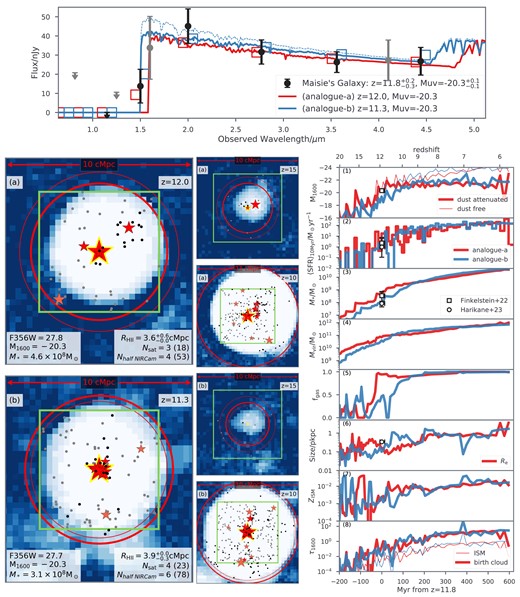
Maisie’s Galaxy analogues. See captions of Figs 7 and 8 for more plot details. However, two example analogues are presented here with additional photometry from HST and JWST F410M (still consistent with the analogue despite not being included during selection) indicated in grey in the top pane. Also note that SFR at z ≳ 11.5 is averaged over several snapshots with total intervals of ∼10 Myr following Finkelstein et al. (2022) while at later times it is averaged over one snapshot with an increasing time step from 10 to 20 Myr. Observational results are taken from Finkelstein et al. (2022) and Harikane et al. (2023b).
We note that Zavala et al. (2023) reported no detection of Maisie’s Galaxy in a number of far-infrared and millimetre observations such as SCUBA-2, Spitzer and Hershel, and hence ruled out the scenario of strong dust emission. Moreover, while preparing this manuscript, Arrabal Haro et al. (2023) presented NIRSpec result of Maisie’s Galaxy which verifies its cosmic origin – both the spectroscopic redshift (|$z=11.44_{-0.08}^{+0.09}$|) and inferred galaxy properties remain consistent with the photometric results.
4.4.2 Local environment and evolutionary paths
Interestingly, despite being fainter than the GLz12 analogue presented in Section 4.3, both analogues of Maisie’s Galaxy are located in slightly larger ionized bubbles of a radius around 3.6 cMpc. This implies a dense local environment for these two analogues, which is evident in the central and lower left-hand panels of Fig. 9. We see that analogues-a and b have crowded local environment at z ∼ 11.8 with three or four galaxies brighter than 30.7 mag in F35W within the corresponding H ii bubbles (cf. zero in the lower left-hand panel of Fig. 7). A deep photometric follow-up would identify ∼5 or 50 depending on whether the field is lensed.
Looking further at their evolutionary histories, we see analogue-a is in fact a satellite galaxy at z = 15 with the central galaxy having already ionized the surrounding IGM. The two are likely undergoing merger at z ∼ 13 with our analogue having its mass stripped first before the final merger. This is indicated by a 50 Myr trough in the halo mass history. The merger triggers an influx of star-forming gas, leading to a subsequent star formation rate (averaged over 10 Myr following Finkelstein et al. 2022) of ∼20 M⊙yr−1 and leading to a much higher luminosity than observed. By z = 12 (see the lower right-hand panels of Fig. 9), at which we identify analogue-a, its SFR drops to <1M⊙yr−1 and luminosity becomes more consistent with Maisie’s Galaxy. On the other hand, analogue-b has a much younger stellar age as most of its stars are formed in a burst at z = 11.3 with an SFR of nearly 30 M⊙yr−1. This burst costs all star-forming gas that analogue-b has gradually accumulated over the past 100 Myr, during which its SFR is kept low at <1 M⊙yr−1. Moreover, the predicted galaxy size (∼0.25 pkpc) and metallicity (of the order of 0.001–0.01) are similar and consistent with what is suggested by the observation.
As for the potential subsequent evolution of Maisie’s Galaxy, properties of the two analogues diverge after z ∼ 12. As analogue-b has consumed all of its star-forming gas, its subsequent star formation becomes quenched. On the other hand, analogue-a remains highly efficient in forming stars and its stellar component at z ∼ 11 reaches nearly an order of magnitude larger mass than that of analogue-b. At z ∼ 11, a major merger event happens to analogue-b, bringing it to a similar evolutionary path as analogue-a from then on and both of them keep forming stars at a high level of 10–100 M⊙yr−1 until z ∼ 6.
4.5 SMACS_z16a and SMACS_z16b
In the field of SMACS, Atek et al. (2023) identified two galaxies at z ∼ 16 – SMACS_z16a and SMACS_z16b (see also Adams et al. 2023b; Harikane et al. 2023b), which have intrinsic UV magnitudes of around −20.5. To account for gravitational lensing, we also demagnify their observed SEDs by a factor of 2.18 and 1.13 and update the uncertainties to further incorporate errors of the lensing models. The exact values are taken as the average magnification among different strong lensing models based on Furtak et al. (2023).
4.5.1 Analogue selection
As we have argued in Section 3 using the estimated number density of z ∼ 16 candidates, these candidates are too bright to remain consistent with our fiducial model. Therefore, we instead seek star-forming analogues in the maxSF output in this section. However, as these candidates are still subject to spectroscopic confirmation and may be low-redshift quiescent or dusty galaxies (see e.g. Naidu et al. 2022a; Arrabal Haro et al. 2023; Harikane et al. 2023b), we also present low-redshift analogues in the fiducial output for comparison.
We apply the same criteria when performing high- or low-redshift analogue searches – the modelled SED has to be within the 2σ observational uncertainties for filters above the break (F200W, F277W, F356W, and F444W) and lower than the 2σ flux threshold for non-detection (F090W and F150W). However, the redshift range for the star-forming analogue search is extended to 57 snapshots between z = 10 and 23 while for the low-redshift search, it is limited to z ≥ 5 as our N-body simulation has not reached later times yet.
From maxSF, we identify 2886(505) high-redshift galaxies possessing similar SEDs as the observed one for SMACS_z16a(b). On the other hand, when looking at the fiducial model, only 34(3) low-redshift analogues are found at z ≥ 5. As these two z ∼ 16 candidates possess qualitatively similar SEDs, we only discuss analogues of SMACS_z16a, and present SED examples of its analogues as well as their distribution as functions of various properties in Fig. 10.
![Analogues of the z ∼ 16 candidate from Atek et al. (2023, ID: SMACS_z16a). Top panel: we show examples for four different scenarios including quiescent and dusty galaxies at z ∼ 6 in the fiducial as well as high-redshift, star-forming counterparts with or without noticeable dust attenuation at z ∼ 10–17 in maxSF where feedback is turned off and star formation efficiency is maximized. We additionally show the brightest galaxy in the fiducial model for comparison. See the caption of Figs 7 and 9 for more figure details, but here we offset the central wavelength of the modelled SEDs for better visualization. Bottom panels: distribution of galaxy properties including redshift; intrinsic UV magnitude; star formation rate averaged over 50 Myr; stellar mass; halo mass; the fraction of gas available for forming stars; size; metallicity; and dust extinction parameters for 471 high-redshift (dusty) analogues, 2415 high-redshift (dust-free) analogues, 30 low-redshift (dusty) analogues and 4 low-redshift (quiescent) analogues. Median values and [16,84] percentiles are presented in the top corner of each subpanel with estimated intrinsic UV magnitude, stellar mass and size from Atek et al. (2023) and SFR from Furtak et al. (2023) indicated by shared regions.](https://oup.silverchair-cdn.com/oup/backfile/Content_public/Journal/mnras/526/1/10.1093_mnras_stad2448/1/m_stad2448fig10.jpeg?Expires=1749136952&Signature=rjDdFUUPjtVT1M9Ryzq2lB3KOg4ihdAT-pnTLdCJ9bm8Mr2hKh-SGoFrgt7poJ99SJDP6mFtrfE8M5v7zPmd3agT7y3nQs79BDDcLfqL2S8zhkwzbIOpgAHfRGL1~lzmknYQk9w2SUgXeisVbiOzz2ttrDurFsxo54w9NNtTEcXyHKhcqCmTWhWP7JabFPwm9nXIXyBxR38uU6OFFiFYn7N63JbS8fMYwUEwBB7a3bNksHNnVaxz5ZXY2IUx3QX6ohKzjIf7~t6JDnwxBdzCxMlBogwm-uc~wwWZB7I4UDNVCZmxFHMQcAPsVKKZEc1Tr~1pmRCeEYQ0ntoEcYxL0A__&Key-Pair-Id=APKAIE5G5CRDK6RD3PGA)
Analogues of the z ∼ 16 candidate from Atek et al. (2023, ID: SMACS_z16a). Top panel: we show examples for four different scenarios including quiescent and dusty galaxies at z ∼ 6 in the fiducial as well as high-redshift, star-forming counterparts with or without noticeable dust attenuation at z ∼ 10–17 in maxSF where feedback is turned off and star formation efficiency is maximized. We additionally show the brightest galaxy in the fiducial model for comparison. See the caption of Figs 7 and 9 for more figure details, but here we offset the central wavelength of the modelled SEDs for better visualization. Bottom panels: distribution of galaxy properties including redshift; intrinsic UV magnitude; star formation rate averaged over 50 Myr; stellar mass; halo mass; the fraction of gas available for forming stars; size; metallicity; and dust extinction parameters for 471 high-redshift (dusty) analogues, 2415 high-redshift (dust-free) analogues, 30 low-redshift (dusty) analogues and 4 low-redshift (quiescent) analogues. Median values and [16,84] percentiles are presented in the top corner of each subpanel with estimated intrinsic UV magnitude, stellar mass and size from Atek et al. (2023) and SFR from Furtak et al. (2023) indicated by shared regions.
4.5.2 High-redshift solutions
We identify two modes for the high-redshift star-forming analogues found in maxSF (see also Figs 4 and 5). Therefore, we further split the sample (approximately) based on redshift and the dust extinction parameter (AV).15 This results in a z ∼ 11.5 population (2415 analogues) with AV ∼ 1, which we consider as high-redshift, dusty galaxies; while the second group (471 analogues) is centred at z = 15 with very little dust attenuation. For SMACS_z16a, these two solutions correspond to the different redshifts inferred by Atek et al. (2023, |$z=15.92^{+0.17}_{-0.15}$|) and by Harikane et al. (2023b, |$z=10.61^{+0.51}_{-8.55}$|), with the latter rejecting SMACS_z16a as being z ∼ 16 because the colour F200W–F277W is not red enough. This is further illustrated by the example high-redshift, dusty analogue shown in the top panel of Fig. 10, whose F200W flux sits on the 2σ upper limits of the observation while F277W is closer to the lower threshold.
As expected, these high-redshift analogues are forming stars at very high rates (∼10 M⊙yr−1), and have managed to build a relatively large stellar content with a stellar-to-halo mass ratio of nearly 10 per cent (i.e. M* ∼ 109 M⊙ and Mvir ∼ 1010 M⊙). As they represent areas where the first episode of star formation occurs in our universe which assumes negligible stellar feedback, they have been able to convert all accreted gas into stars (fgas ∼ 1), fuelling long-lasting star-forming events. However, this also leads to an overprediction of the ISM metallicity compared to results from Furtak et al. (2023). This is because in maxSF, while supernovae do not provide thermal or kinetic feedback to remove metals (and gas) from the host galaxy, they continue polluting their environment. As our dust attenuation model assumes the optical depth increases towards later times and scales (almost) linearly with the metallicity (see more in Qiu et al. 2019), this results in the two SED solutions we see here – while the higher redshift analogues prefer lower metallicities and are dust-free, the lower redshift most likely exhibit an opposite trend.
4.5.3 Low-redshift solutions
The low-redshift analogues found in our fiducial model can also be divided into two groups – based on the extinction parameter, 30 out of the 34 galaxies are with Av > 0.2 and considered to be dusty star-forming galaxies. These are isolated from the 4 quiescent counterparts. Example SEDs and property distributions for these two scenarios are shown in Fig. 10 for comparison.
Although it is a small sample,16 we see that the low-redshift analogues are on average 3 mag fainter than the high-redshift cases, with a much lower stellar-to-halo mass ratio of around 2 per cent – they are galaxies with similar stellar mass (∼109M⊙) but inside much larger halos (∼5 × 10¹⁰ M⊙). Compared to the dusty high-redshift scenario, the dusty analogues at low redshift are also forming stars at ∼10 M⊙yr−1 but out of a relatively smaller gas content (mostly fgas ≲20 per cent) as a result of supernova feedback implemented in standard galaxy formation modelling (i.e. our fiducial). In addition, with similar disc sizes and metallicities, the low-redshift dusty galaxies suffer significant attenuation. On the other hand, the quiescent analogues have zero star formation rate, larger discs and low attenuation. Observationally, even though quiescent galaxies with such low masses are not common at z ≳ 5, there have been tentative reports with JWST of quiescent galaxies at early times (Looser et al. 2023) and lower masses (Strait et al. 2023).
4.6 S5-z16-1
S5-z16-1 (Harikane et al. 2023b) is a |$z{=}16.41^{+0.66}_{-0.55}$| candidate identified from Stephan’s Quintet. With an intrinsic UV magnitude of −21.6, S5-z16-1 is even brighter than the two lensed candidates discussed in the previous section. Therefore, identifying its analogues becomes more challenging and the maxSF model presents only five galaxies that share its SED (selection criteria identical to Section 4.5).
As mentioned in Section 3.2, CEERS-93316 was also a bright z ∼ 16 candidate (Naidu et al. 2022a; Donnan et al. 2023a; Harikane et al. 2023b) but is now considered to be a z = 4.9 dusty galaxy (Arrabal Haro et al. 2023). The NIRSpec observation reveals that strong nebular lines such as [O iii] and Hα have boosted its NIRCam photometry (particularly for band F277W), leading to an apparent break as well as the biased interpretation of its redshift. In fact, because these two galaxies have very similar SEDs, their inferred galaxy properties (when assuming they are at z ∼ 16) are also very close (see data points at z ∼ 16 in Fig. 11). One of the five analogues, we find for S5-z16-1 happens to also be the only analogue we can find for CEERS-93316 in maxSF. Therefore, the revised interpretation of CEERS-93316 provides a warning that SED fitting, including that done in this work, requires better handling of the emission profile.
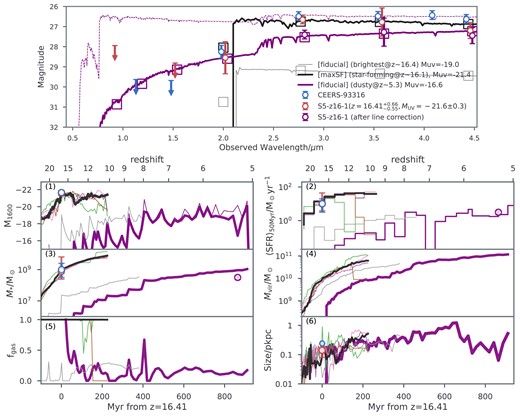
Top panel: (a) spectrum (thick black curve) and SED (black squares) of a star-forming galaxy at z ∼ 16 in maxSF which can be considered as an analogue for both S5-z16-1 (red circles; Harikane et al. 2023b) and CEERS-93316 (if it were at z ∼ 16; blue circles; Naidu et al. 2022a; Donnan et al. 2023a; Harikane et al. 2023b). (b) spectra and SED (thick, purple) of a dusty galaxy (in the fiducial catalogue) that is analogue to S5-z16-1 after line correction (purple circles). Note that the central wavelengths of these SEDs are offset for better visualization. Bottom panels: possible evolution as in (1) intrinsic UV magnitude; (2) star formation rate averaged over ∼50 Myr; (3) stellar mass; (4) halo mass; (5) fraction of star-forming gas; and (6) galaxy disc size for analogues shown above (thick lines) with observational results from Harikane et al. (2023b) and Donnan et al. (2023a) also indicated for comparison (red and blue circles; also note that the two results overlap with each other and sizes are measured by Ono et al. 2022). Stellar mass and star formation rate of CEERS-93316 at z = 4.9 obtained by Arrabal Haro et al. (2023) is shown (purple circles) as a comparison for our dusty analogue identified at z ∼ 5.3. We additionally show the brightest galaxy (thin grey lines) in the fiducial model as well as the remaining four star-forming analogues (thin coloured lines) of S5-z16-1 found in maxSF, which stops at z ∼ 10.
4.6.1 High-redshift solutions
Fig. 11 shows the SED and possible evolutionary path of S5-z16-1 with a comparison against the observations. The property histories for the other four analogues of S5-z16-1 are also included and we see that the prediction at z ∼ 16 from our maxSF model agrees very well with the observational results. The S5-z16-1 analogues are extremely bright with stellar masses around 109 M⊙ and high stellar-to-halo mass ratios of ∼10 per cent (Harikane et al. 2023b). When averaged over 50 Myr, the star formation rates are of the order of 10M⊙yr−1.
It is also remarkable that all five analogues show consistent formation histories before z ∼ 13 – they build their stellar contents very rapidly in this 200 Myr interval starting with M* ∼ 107M⊙ and Mvir ∼ 3 × 10⁸ M⊙ at z ∼ 25, reaching M* ∼ 3 × 10⁹ M⊙ and Mvir ∼ 2 × 10¹⁰ M⊙ at z ∼ 13. This is because maxSF includes no feedback, which allows these analogues to be able to convert all their gas into stars and significantly reduces the stochasticity in the formation history. We see that from z ∼ 13, the evolution of these analogues starts to diverge as a result of different merger histories.
4.6.2 Low-redshift solutions
Using the broad-band photometry measured by Harikane et al. (2023b), no low-redshift analogues can be identified in our fiducial output (which stops at z = 5). However, based on the line correction Arrabal Haro et al. (2023) inferred for CEERS-93316, we alter the SED of S5-z16-1 by +0.75, +0.50, and +0.25 mag in F277W, F356W, and F444W to account for potential contamination.17 Using this updated SED (see purple circles in Fig. 11), we successfully identify 1225 dusty analogues between z = 5 and 6 in the fiducial catalogue.
Fig. 11 presents an additional example analogue for low-redshift dusty galaxies (at z ∼ 5.3). This analogue has a dramatically different evolutionary path compared to all high-redshift analogues we have studied in this work. The example analogue is first identified18 at z ∼ 15 with a halo mass of ∼6 × 10⁸ M⊙ and a less than 0.1 per cent stellar content. Although bursty, it keeps forming stars at ≲ 1 M⊙ yr-1 (when averaged over 50 Myr) until z ∼ 8 when its stellar mass reaches 2 × 10⁸ M⊙ and the stellar-to-halo-mass ratio increases to 0.3 per cent. Afterwards, this galaxy quickly gains more masses and, at z ∼ 5.3, its halo and stellar masses become nearly 1011 and 109 M⊙, respectively. While the metallicity of this galaxy is twice the solar level at z ≲ 6, its shrinking disc size caused by a reducing halo spin makes the disc more opaque and therefore a significant amount of UV radiation becomes saturated, making this galaxy a non-detection in JWST’s F090W and F150W bands (see the top panel of Fig. 11). It is worth noting that this dusty galaxy has an extinction parameter of Av ∼ 3.5 which is consistent with typical values at 3 < z < 6 (e.g. Barrufet et al. 2023; Rodighiero et al. 2023).
5 CONCLUSION
JWST has delivered unprecedented data of our early Universe, revealing galaxy formation in the first 300 Myr of the cosmic time. In this work, we utilize a large-volume, high-resolution cosmological simulation coupled with a semi-analytic galaxy formation model to study the possible evolutionary paths as well as the local environment for eight JWST galaxy candidates at z ≥ 12. These include three faint (MUV ≳ 19.5) galaxies at z ∼ 12 – JADES-GS-z13, JADES-GS-z12, S5-z12-1; two bright galaxies at z ∼ 12 – GLz12, Maisie’s Galaxy; and three bright galaxies at z ∼ 16 – SMACS_z16a, SMACS_z16b, S5-z16-1 (e.g. Finkelstein et al. 2022; Naidu et al. 2022b; Atek et al. 2023; Curtis-Lake et al. 2023; Harikane et al. 2023b).
We find faint JWST galaxies to be consistent with the standard galaxy formation model while the bright ones are challenging or inconsistent depending on their redshift. Using our fiducial model, which is statistically representative of the observed Universe across most cosmic time (5 < z < 13) and the observed magnitude range, we show
Large samples of analogues have broad-band photometry that is consistent with the faint JWST galaxies. The distribution of our modelled galaxy properties is also broadly aligned with the SED-fitting results to observations. But due to the burstier nature of star formation predicted by our model, the inferred stellar masses are lower than observations that commonly assume a more continuous SFH.
As a result of low number density, bright z ∼ 12 galaxies only have a handful of analogues in the fiducial model, whose properties are similar to values obtained through inverse modelling of observed SEDs. Although a small sample, these analogues in general suggest that bright JWST targets have a rapid build-up of their stellar content and are located in dense regions with their local environment having diverse possibilities.
Our fiducial simulation does not contain bright analogues for z ∼ 16 candidates found in the small volume of these ERS programs. However, the observed SED of these z ∼ 16 candidates can still be reproduced by low-redshift galaxies in the fiducial model, which either are experiencing strong dust attenuation of their UV radiation or have quenched star formation to exhibit a Balmer break.
To reproduce bright z ∼ 16 JWST candidates, we find that highly efficient star formation with no feedback regulation is required. The formation history of these extremely bright analogues in this model demonstrates that they have an incredibly high stellar-to-halo mass ratio that is close to the cosmic mean baryon fraction. This suggests that while feedback-regulated star formation is a key part of galaxy formation during most of the cosmic time, the confirmation of z ∼ 16 galaxies would indicate that this was not the case for the first massive galaxies formed during the cosmic dawn.
Before finishing, we would like to point out that ‘how does star formation evolve from such a highly efficient regime which seems necessary to reproduce these extremely bright candidates into a more self-regulated process seen at later times?’ remains puzzling. Perhaps, the transient nature of PopIII-dominated galaxies is key – due to the pristine environment in the very early Universe, the first galaxies are more likely to host these massive stars, for which we have little constraint on their properties or formation histories; while at later times when the Lyman–Werner photodissociating background has been established or the overall metal enrichment has reached a critical point, galaxies no longer form PopIII stars and their growth becomes more prone to feedback. We plan to revisit this point in the future.
ACKNOWLEDGEMENTS
We thank S. Finkelstein, S. Tacchella, D. Breitman, and the anonymous referee for their comments. This research was supported by the Australian Research Council Centre of Excellence for All Sky Astrophysics in 3 Dimensions (ASTRO 3D), through project #CE170100013. Part of this work was performed on the OzSTAR and Gadi national computational facilities. YQ acknowledges HPC resources from ASTAC Large Programs, the RCS NCI Access scheme, and its Cloud at The University of Melbourne.
DATA AVAILABILITY
The data underlying this paper will be shared on reasonable request to the corresponding author.
Footnotes
As earlier releases of the NIRCam candidates are often revised in the final publications, we only discuss targets that are currently in press.
Unresolved halos are expected to have a minimum contribution to the bright galaxies studied here. However, as theoretical studies suggest minihalo-hosted galaxies might possess different properties including the IMF and UV-ionizing escape fraction (e.g. Wise et al. 2012; Xu et al. 2016), we will study their contribution in the future (Ventura et al., in preparation).
A further tuning was needed when the new merger trees are employed (see more in Balu et al. 2022).
Observational data shown in this work have been converted accordingly to match our Kroupa (2001) IMF using the astrodatapy package (https://github.com/qyx268/astrodatapy).
Our fiducial model (as well as no dust or fb) takes 10 times the dynamical time to deplete gas on the disc and form stars, roughly 1/20 of the Hubble time.
In extreme models like maxSF, it is the reduced feedback that plays the most important role in boosting the overall star formation efficiencies.
Throughout this paper, a 10 per cent error floor is additionally considered in the observed photometry for all targets to account for potentially underestimated systematics (see e.g. Naidu et al. 2022b). This includes the two z ∼ 16 candidates found in lensing fields (see Section 4.5) before errors of the lensing model are further added. In addition, the negative 2σ threshold of non-detection is reset to zero during analogue selection.
This was motivated by observations of low-redshift galaxies presenting a critical surface density before star formation can occur (e.g. Kennicutt 1998; Daddi et al. 2010; Azeez et al. 2016). However, as observations and simulations of high-redshift galaxies often show more turbulent and clumpy structure, we have been following Henriques et al. (2015) and considering the threshold as a free parameter in our model. This parameter was also explored in the earlier Bayesian inference study (Qiu et al. 2019).
Meraxes reserves a so-called ejected gas reservoir for each modelled galaxy, as a response to supernova feedback. Gas in this reservoir is considered to have a cooling time-scale much longer than the Hubble time and therefore does not contribute to star formation.
500 sight-lines towards the target are randomly drawn and the distance between the galaxy and the nearest cell on each sightline that has a neutral fraction no less than 90 per cent is measured. 50, 16, and 84 percentiles are then calculated with the median nominated as the H ii bubble radius.
In fact, there is another object, CR2-z12-1, which is considered as a fainter z ∼ 12 galaxy with an intrinsic UV magnitude of −19.9 ± 0.1 by Harikane et al. (2023b). However, Finkelstein et al. (2022) consider the same object, which they call Maisie’s Galaxy, as –20.3 mag. We return to this candidate in Section 4.4. Furthermore, S5-z12-1 was initially considered at |$z{=}13.72^{+0.86}_{-1.92}$|. Using the earlier photometric results from the preprint version, we reached a similar conclusion and saw lower intrinsic luminosities with respect to the observation.
Throughout this paper, a few footnotes present a brief summary of our analogue study when earlier observational results including the SEDs were utilized. This is to demonstrate the stochasticity of analogue studies as minor changes in the SED can lead to different identifications. However, while the comparison addresses the sampling issue when studying these bright galaxies, the conclusion from using different versions of SED remains qualitatively consistent. For instance, GLz12 was previously considered at |$z{=}13.1^{+0.8}_{-0.7}$| by Naidu et al. (2022b) with the initial NIRCam calibration. Using the earlier SED from its preprint, we identified two analogues showing qualitatively similar evolution and environment as the analogue presented here.
Mass and radius of galaxies also play a role in determining dust attenuation according to our model (Qiu et al. 2019). However, the impact from differences between the predicted and measured galaxy sizes can be minimized by a normalization factor, which was calibrated against the observed UV luminosity function and colour across a large magnitude range.
Maisie’s Galaxy was initially considered to be at |$z{=}14.3^{+0.4}_{-1.1}$|(Finkelstein et al. 2022), and therefore became the second object that we looked into as it had an even higher redshift than GLz12 which was previously thought at z ∼ 13. Using the SED from the first version of its preprint, we identified two analogues showing similar evolution and environment as the analogue presented here but with a burstier SFH.
Moderate degeneracy between redshift, dust extinction, UV magnitude, and metallicity is present in the high-dimensional distribution.
The small sample is a result of the limited redshift prior imposed by our parent N-body simulation, in particular for the quiescent galaxy scenario. In addition, using the earlier preprint version of Atek et al. (2023) that has higher luminosities than the publication, we found hundreds of low-redshift analogues with much distinct and statistical differences between dusty and quiescent galaxies and from their high-redshift, star-forming counterparts.
We choose to not perform line correction for SMACS_z16a(b) in Section 4.5 due to the highly uncertain emission strength for high-redshift dusty galaxies. However, assuming the flux of the emission line is proportional to the continuum, we expect similar levels of alteration in magnitude to SMACS_z16a(b). Qualitatively, this improves the fitting of the two example low-redshift analogues shown in the top panel of Fig. 10.
In this work, augmentation is not applied to halos identified at such low redshifts when reionization has already finished.
