


ABSTRACT
Infrared dark clouds (IRDCs) represent the earliest stage of high-mass star formation and host molecular cores at different states of activity from quiet state without any IR-signature of star formation to active state with IR-signatures and pronounced maser activity. Many IRDCs show indications of shocked gas associated with protostar outflows and can contain class I methanol masers (cIMMs). The aim of this study is to probe different types of cores in IRDCs with cIMMs and thermal molecular emission and to investigate the relationship between presence of cIMMs and physical conditions in IRDCs. For a sample of 37 molecular cores, using the 20-m Onsala radio telescope, we collected molecular line data at 44, 85, and 97 GHz for more than 15 species including CH3OH, CH3CCH, and CS. Kinetic temperature of the gas and molecular column densities were obtained. Methanol emission at 44 GHz was detected in 29 sources, with 4 sources are being new discoveries. None of the cores in quiescent state show emission at 44 GHz. Our results testify that cIMM emission is a reliable marker of advanced state of molecular cores. The higher detection rate for intermediate and IR-quiet sources suggests that cIMMs most readily trace the early stages of star formation characterized by moderate IR-signatures. We found that masers with higher flux densities tend to be associated with emission in the CH3CCH lines with higher integrated intensities. Sources undetected at 44 GHz have 4 times lower integrated intensities of CH3CCH and exhibit poorer molecular spectra than the most sources with cIMMs.
1 INTRODUCTION
The study of the birth and earliest evolution of massive stars remains one of the key tasks of stellar astrophysics. The initial conditions of massive stars formation are still not fully understood, as massive young stellar objects (MYSO) evolve very quickly and form in clusters deeply embedded in distant, high-density molecular clouds (Zinnecker & Yorke 2007; Motte, Bontemps & Louvet 2018). Models of the earliest stages of massive protostars, from clump fragmentation to mass accumulation (through disc formation and outflow generation), have so far been tested on a limited sample of sources. Cold and dense infrared dark clouds (IRDCs) are considered to be precursors to star clusters and represent the ideal sites to investigate the earliest stages of massive star-formation (Rathborne, Jackson & Simon 2006).
The IRDCs were discovered in ISO (Infrared Space Observatory; Kessler et al. 1996) and MSX (Midcourse Space Experiment; Price et al. 2001) surveys as dark areas of high contrast against the bright mid-infrared background of the Galaxy (Perault et al. 1996; Carey et al. 1998). The typical sizes of IRDCs are 1–10 pc, with masses of several hundreds to several thousands solar masses, and H2 column densities of (2–10) × 1023 cm−2 (Carey et al. 2000; Rathborne et al. 2006; Vasyunina et al. 2009). These regions host compact molecular cores at an early stage of high-mass star formation, which can be identified as millimeter and submillimeter continuum sources (Beuther, Sridharan & Saito 2005; Carey et al. 2000). Molecular cores are compact structures with a typical size of 0.02–0.8 pc, mass of 10–103 solar masses, temperature 15–30 K and density n(H2) ∼103–107 cm−3 (Rathborne et al. 2006). Some of the cores have a larger temperature up to 100–200 K and this special type of cores is called ‘hot cores’. Typical mass of the hot cores is 100–300 solar masses, size is up to 0.1 pc and density ∼105–108 cm−3 (Shu, Adams & Lizano 1987; Kurtz et al. 2000; Rathborne et al. 2006).
Molecular masers are proved to be one of the powerful tools to probe the dense environments in star formation regions, as they arise in proximity of MYSOs and their features, such as accretion discs, outflows and jets (Bartkiewicz & van Langevelde 2012). For example, recently, masers helped to identify several ‘bursting’ MYSOs undergoing accretion events (Brogan et al. 2019; Burns et al. 2020; Bayandina et al. 2022). Since masers have shown themselves to be such a fruitful source of information in the case of individual massive protostars, we can try to use masers for studying clump-scale events indicating activity of a forming young star (i.e. clump fragmentation and mass flows).
Molecular outflows are readily traced by class I methanol maser (cIMM) emission in the transition 70 − 61A+ at 44 GHz, which is the strongest cIMM maser line according to both observational results and model predictions (Leurini, Menten & Walmsley 2016). cIMM arise under collisional pumping (Menten 2012) and reside at offsets of 0.1–1 pc from the associated MYSO, highlighting the interacting regions of outflows with the ambient dense molecular gas of the parental cloud (Plambeck & Menten 1990; Kurtz et al. 2004a; Voronkov et al. 2006; Cyganowski et al. 2009a). Thus, cIMM emission provides us with a unique tool for locating and investigating large-scale outflow activity. This is especially true for the high extinction regions, where other standard shock tracers are too weak to be detected. For example, a bipolar outflow in DR21(OH) was detected in cIMM (Araya et al. 2009), but not in H2 lines (Davis et al. 2007).
Although a tight correlation between the parameters of cIMMs and their host dust clumps is reported (e.g. Ladeyschikov et al. 2020), it is still not clear if outflows (and associated cIMMs) are shaped by the central source (e.g. no correlation between the cores’ mass and the outflows’ maximal length and velocity is found in Nony et al. 2020) or by the ambient material (e.g. high-density clouds limit the propagation of protostellar outflows; in Nony et al. (2020), a clear anti-correlation between the outflow maximal length and the visual extinction of the background cloud was found).
Hence, before we can use class I masers as a probe, we need to firmly understand their nature and relation to both host clump and core properties. Since maser activity is one of the signposts of star formation process, detection of masers in some clumps in IRDCs indicates that these clumps contain cores appearing to be actively forming protostars. However, it is not clear at what stage of evolution physical conditions in cores become suitable for the appearance of cIMM, in particular, cIMM emitting at 44 GHz. To address this issue, it is necessary to study large samples of high-mass young stellar objects at different stages of evolution.
To clarify the evolutionary status of class I methanol masers and their association with compact molecular cores of various types, we proposed to perform a single-dish search of 44 GHz cIMMs towards a sample of 37 IRDCs with known properties of their embedded cores previously identified by different signatures: millimeter and/or submillimeter emission combined with mid-IR or far-IR emission (see Section 2 below). The aim is to probe which type of cores is more prone for hosting class I methanol masers and to show that many cIMMs still remain undiscovered. Also, we intended to estimate physical conditions in the targets such as kinetic temperature and density in order to reveal possible relationship between these parameters and presence of cIMMs in the sources.
There is a variety of good traces of dense and cold gas that can be used for estimation of kinetic temperature and density in the observing region, as well as for indicating signatures of gas motions such as outflows and infalls. Methylacetylene CH3CCH is considered a good thermometer for dense gas (Bergin et al. 1994). Whereas CS molecule is a good tracer of dense gas (Bronfman, Nyman & May 1996), mostly in layers surrounding the central cores (Vasyunina et al. 2011). Some molecules such as SiO and HCO + are used as tracers of the outflow activity in the region (e.g. Hofner, Wiesemeyer & Henning 2001; Lo et al. 2007). Specific line shapes of HCO+ and HCN can be considered as evidence for infall motion (Xie et al. 2021; Pillai et al. 2023), indicating an ongoing process of star formation. Finally, the fact of detection or non-detection of some species may tell us about the evolutionary status of observing sources.
In this paper, we present single-dish observations of 44 GHz masers and associated core and outflow molecular line tracers. Given that the Onsala beam is 83 arcsec at 44 GHz, our results are relevant for the scale of clumps rather than individual cores. For our purpose, we observed the sample (see below) in 3-mm band covering molecular lines of CH3CCH, CS, CH3OH and other species (see Table 1) allowing us to probe the environments of cIMMs.
Summary of observational parameters for molecular lines.
| Molecule | Transition | Rest freq. | HPBW |
|---|---|---|---|
| (MHz) | (arcsec) | ||
| CH3OH | 70 − 61 A + | 44069.476 | 83 |
| (cIMM) | |||
| CH3OH | 5−1 − 40 E | 84 521.206 | 43 |
| CH3CCH | 53 − 43 | 85 442.600 | 43 |
| 52 − 42 | 85 450.765 | ||
| 51 − 41 | 85 455.665 | ||
| 50 − 40 | 85 457.299 | ||
| OCS | 7 − 6 | 85 139.104 | 43 |
| HC18O + | 1 − 0 | 85 162.223 | 43 |
| c-C3H2 | 21 − 10 | 85 338.906 | 43 |
| HCS + | 2 − 1 | 85 347.869 | 43 |
| HC15N | 1 − 0 | 86 054.967 | 43 |
| SO | JN = 22 − 11 | 86 093.983 | 43 |
| H13CN | 11 − 01 | 86 338.735 | 43 |
| 12 − 01 | 86 340.167 | ||
| 10 − 01 | 86 342.256 | ||
| HCO | 1 − 0 3/2 − 1/2 F = 2 − 1 | 86 670.820 | 43 |
| C34S | 2 − 1 | 96 412.950 | 38 |
| CH3OH | 2−1 − 1−1 E | 96 739.363 | 38 |
| 20 − 10 A + | 96 741.377 | ||
| 20 − 10 E | 96 744.549 | ||
| 21 − 11 E | 96 755.507 | ||
| 21 − 11 A− | 97 582.808 | ||
| C33S | 2 − 1 1/2 − 1/2 | 97 171.840 | 38 |
| 2 − 1 7/2 − 5/2 + 5/2 − 3/2 | 97 171.840 | 38 | |
| OCS | 8 − 7 | 97 301.209 | 38 |
| 34SO | JN = 23 − 12 | 97 715.401 | 38 |
| CS | 2 − 1 | 97 980.953 | 38 |
Note. For all frequencies, the main-beam efficiency is 0.6. The typical rms is 0.2 Jy at 44 GHz with spectral resolution 0.13 km s−1, and 0.1 Jy at 85 and 97 GHz with spectral resolution 0.26 km s−1.
2 SAMPLE
In order to achieve the goals of our study, we selected a sample of cores of different evolutionary stages from the literature. We selected our target sample from a few different core surveys which employed different criteria of the core status identification (mostly the presence or lack of emission at a particular frequency, see examples below). By working with a diverse pool of possible targets, we aimed to collect a comprehensive and unbiased list of sources. However, the limited available telescope time restricted the size of the final sample.
A sample of 37 sources was selected from previous works as follows. From Chambers et al. (2009), Rathborne et al. (2010), Feng et al. (2016), and Pon et al. (2016), we adopted 25 cores of three types (active, intermediate and quiescent). The improved sensitivity of the Spitzer Space Telescope Legacy programme Galactic Legacy Infrared Mid-Plane Survey Extraordinaire (GLIMPSE) (Churchwell et al. 2009) reveals that some cores within IRDCs contain previously undetected mid-infrared emission. For example, IRDCs show indications of shocked gas known as ‘green fuzzies’ or EGOs (Chambers et al. 2009), the presence of which may be a necessary condition for the occurrence of cIMM. Chambers et al. (2009) suggested identifying star-forming cores within IRDCs by simultaneous presence of 4.5 μm ‘green fuzzies’ and 24 μm point sources as indicators of star formation. Cores meeting this criterion are referred to as ‘active’, and cores containing no IR signature are classified as ‘quiescent’. Chambers et al. (2009) concluded that ‘active’ cores have smaller sizes, higher densities and more pronounced water and methanol maser activity; and ‘quiescent’ cores are starless cores in the earliest evolutionary stage and show little evidence for active-star formation. Cores containing only one IR signature, but not both, are called ‘intermediate’ implying that they represent an intermediate phase between the active and quiescent cores. Cores associated with MSX 8 μm emission are initially assigned as ‘red’ in the work of Rathborne et al. (2006), and considered to be sources probably associated with H ii regions, ionized by stars forming within the IRDC. Further, with improved angular resolution of Spitzer, it was clarified that the 8 μm emission is clearly offset from many cores (Chambers et al. 2009). Thus, we included the ‘red’ sources in the sample in order to probe such cores as well.
We also included 12 sources from the IRAM large programme CORE (Beuther et al. 2018). This programme was aimed to study the fragmentation process of the initial gas clumps resulting in the final clusters and individual cores, and for that purpose a number of star-forming regions were observed in the 1.37 mm continuum. All sources from (Beuther et al. 2018) contain the 8 and 21 μm emission and, thus, have mid-IR signatures indicating an active star formation process. These sources were divided by Beuther et al. (2018) into two categories: IR-bright and IR-quiet. The following criterion has been used: if the source had a luminosity at 21 μm of 10 Jy or higher at a distance of 1.7 kpc, then it belongs to the IR-bright category; in the opposite case, it is classed as IR-quiet. This criterion was suggested in Motte et al. (2007) in order to classify dense cores as infrared-luminous and infrared-quiet cores in the Cygnus X molecular cloud complex located at 1.7 kpc. The first ones are usually considered to be the best candidates to host high-mass protostars. In contrast, the massive infrared-quiet cores are not likely expected to host high-mass protostars. Names of selected sources and their coordinates are given in Table A1. Appendix A1 provides detailed notes for each of 37 sources.
In addition, five starless cores, known as Bok globules, were selected from (Lippok et al. 2016). Bok’s globules are isolated patches of optical obscuration visible against background stars (Bok & Reilly 1947), and they are located near objects proven to host the earliest phase of low-mass star formation in isolated clumps (Ward-Thompson et al. 1994). Since class I methanol masers have been found in some low-mass star formation regions previously (Kalenskii et al. 2010), we included Bok’s globules in our study to probe this interesting class of objects with cIMM. However, since these objects have properties that are very different from other sources of the sample, we did not include these data in the main analysis. Results for Bok globules are presented separately in Section 4.4.
Since the sources of the main sample were adopted from core surveys using different identification criteria, it is possible that a particular source may be assigned to more than one type. For example, an IR-bright source may also be classified as a red core. However, we are not able to perform such analysis surely due to the lack of observational information; we have no information on 21 μm fluxes for red cores, while this parameter is the main criterion for IR-bright and IR-quiet source identification. Nevertheless, keeping the original sample categories allows us to probe potentially different types of sources and make a starting point for further study.
3 OBSERVATIONS AND DATA REDUCTION
The observations were carried out using the 20-m millimeter-wave telescope of the Onsala Space Observatory (project ID codes O2018b-04 and O2019b-06). There were two periods of observations: from 2019 June 7 to 16 and from 2020 March 5 to 9. Main parameters of observations are summarized in Table 1. The rest frequency of the transition 70 − 61A+ of CH3OH was set to 44 069.476 MHz (Xu & Lovas 1997; Xu et al. 2008). At 44 GHz, the average main beam efficiency value was 0.6, the aperture efficiency was 0.46, and the half-power beam width was 83 arcsec. The pointing accuracy was 3 arcsec rms both in azimuth and elevation. The observations were performed in a position switching mode (PSW) with one typical observing cycle of 120 s (60 s on-source and 60 s off-source). The total integration time was from 24 to 60 min per source, depending on source position and weather conditions. An HEMT (high-electron-mobility transistor) amplifier was used in the receiver for 36–50 GHz frequency range with dual circular polarization. The noise temperature of the receiver was 30–40 K for both polarizations. The system noise temperature, corrected for atmospheric contribution, varied between 180 and 500 K (mostly between 250 and 350 K) during the two periods of observations depending on weather conditions and elevation of a source. The antenna temperature was calibrated using the chopper-wheel method (Ulich & Haas 1976). One Kelvin of antenna temperature corresponded to 19 Jy, and for the main beam temperature the scale was 11.4 Jy K−1. Typical 1σ noise level was about 0.2 Jy at 0.13 km s−1 after applying Hanning smoothing over four channels. The total intensity calibration uncertainty (due to the hot load calibration, the uncertainty in main beam efficiency, and pointing/focus errors) was estimated to be 10 per cent. The backend was the Onsala Spectrometer A (OSA), the total bandwidth was set to 156.25 MHz with 32 768 channels and a resolution of 4.768 kHz, which corresponds to 0.03 km s−1 at a frequency of 44 GHz.
Observations of thermal lines were performed with two sidebands of 2.5 GHz width separated by 12 GHz. The lower sideband was centred at 85.5 GHz, and the upper sideband was centred at 97.5 GHz. We used this advantage in order to cover not only CH3CCH lines, but also CS lines at 98 GHz, and CH3OH lines at 96.7 GHz. Also, the high-resolution data for CH3CCH lines at 85.5 GHz covering range 100 MHz were recorded in the same time. The main-beam efficiency and full-width at half power at 85 GHz were 0.6 and 43″, and at 97.5 GHz – 0.6 and 38 arcsec. However, due to many of our sources being observed exclusively at low elevations, we decided not to use the standard model for the elevation dependence of the main beam efficiency at the 20 m telescope. Instead, we adopted an ad-hoc model that had been shown to be more accurate at low elevations in recent planet test observations1 at the frequencies observed here. We estimate that this model has a 10 per cent uncertainty based on the scatter of efficiencies derived from Jupiter observations (using the class software brightness model) below 35° elevation.
Data reduction was performed in Continuum and Line Analysis Single-dish Software (class) for reducing spectroscopic data obtained with a single-dish telescope2 For each spectrum, the amplitude calibration was performed using model main beam efficiency, which varies with source elevation. Then all spectra were averaged over the whole time range of observations. For 98 GHz data (upper sideband), a correction of the frequency axis was performed in order to correct errors in the frequency channel separation due to Doppler effect (so-called accordion effect). This effect means the stretching or shrinking of the spectrometer bandpass in the source’s rest frame, depending on if the net Doppler shift observer-source is blue or red. For spectral lines located at sufficient offset from the central frequency of the band (for example, CS line at 98 GHz), such correction was necessary.
4 RESULTS
4.1 cIMM detection statistics
Statistical analysis of observations showed the following. Methanol emission at 44 GHz was detected in 29 of 37 sources (detection rate 78 per cent). Out of these 29, 4 sources had not been detected in any cIMM lines before; and 10 sources were known to show the cIMM emission at other frequencies, but not at 44 GHz. We summarize the detection statistics in a diagram at Fig. 1. Detections and non-detections are indicated by blue and red, respectively. It is clearly seen that cores with any IR signature have high detection rate. Both active and intermediate cores in our target sample exhibit cIMM at 44 GHz. Quiescent cores are undetected at 44 GHz. Spectra of the detected 44 GHz cIMMs are shown in Figs A1 and the Gaussian parameters of the maser lines are given in Table A2.
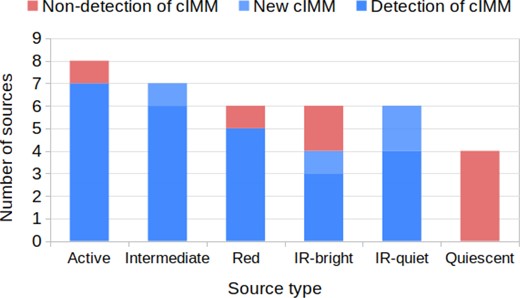
44-GHz methanol maser detection statistics. Detections of cIMM are highlighted by blue and non-detections are indicated with red. New detected masers are highlighted with light blue. More details on detections in individual sources are given in Table A1.
4.2 Molecular lines
Along with the masers, we observed 27 sources of the sample in a number of molecular lines in spectral ranges 84.4–86.7 GHz and 96.3–98.6 GHz. The remaining 10 sources were not observed due to limited observing time. Thermal CH3OH lines at 96.7 GHz were identified in all observed sources. Thermal lines of methyl acetylene CH3CCH at 85.5 GHz were detected in 24 out of 27 sources. The CH3CCH detection statistics for different types of sources is shown in diagram at Figs 2. CS emission at 98 GHz was detected in all observed sources. Other molecules identified in our observations are H13CN, 13CH3OH, C34S, OSC, HCS + , c-C3H2, HC15N, SO, and HCO. A summary of detection rate for each observed molecule is presented in Fig. 3. Detection rates of molecular lines in different types of sources based on data of 15 most detected molecular species (CH3OH, CH3CCH, CS, OCS, HC18O + , c-C3H2, HCS + , HC15N, SO, H13CN, HCO, C34S, C33S, OCS, and 34SO) are presented in Fig. 4. Each column corresponds to a particular source from our sample (see Table A1 for the reference). Numbers above the columns mean corresponding percentage of molecular line detections.

CH3CCH detection statistics. Detections of CH3CCH are highlighted by blue and non-detections are indicated with red. Sources not observed at 85 GHz due to technical reasons are shown with sloped lines pattern. More details on detections in individual sources are given in Table A1.
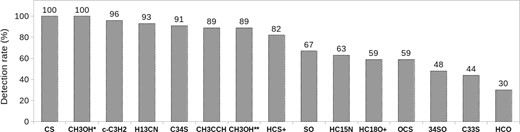
Detection rates of the observed molecular species for the sample of 37 sources. Numbers above the columns mean corresponding percentage of detections. Thermal methanol emission was observed at 96.7 GHz (marked by *) and at 84.5 GHz (marked by **).
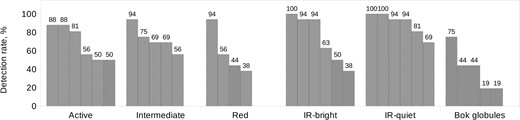
Detection rates of molecular lines in different types of sources based on data of most detected 15 molecular species (CH3OH, CH3CCH, CS, OCS, HC18O + , c-C3H2, HCS + , HC15N, SO, H13CN, HCO, C34S, C33S, OCS, and 34SO). Each column corresponds to a particular source. Details on each source can be found in Table A1. Numbers above the columns mean the corresponding percentage of the overall molecular line detections. Columns filled with slope pattern correspond to the sources with no detected cIMM emission.
Spectra of CH3CCH, CS, and CH3OH lines are presented in Figs A2, A3, and A4, respectively. The corresponding Gaussian parameters of the four CH3CCH line components, CS line profiles, four CH3OH line components are presented in Tables A3, A4, and A2.
4.3 Kinetic temperature and molecules’ column density
We obtained the rotational temperature and column density of CH3CCH using a method of rotational diagrams, since we observed several rotational transitions. Assuming that the lines are optically thin and local thermodynamics equilibrium (LTE) condition is established, we used the following relationships between the integrated line intensity W = ∫Tmb dV, rotational temperature Trot, and column density N :
where Nu is the upper level population, ν0 is the rest frequency of the transition, gu is the upper state degeneracy, S is the line strength, μ is the dipole momentum, Qrot is the partition function, and Eu is the energy of the upper level. We used the values gu, Sμ2, and Eu from the data base CDMS (The Cologne Data base for Molecular Spectroscopy; Müller et al. 2001). The partition function Qrot was calculated for every source with Tex by interpolating the data from CDMS. It is known that CH3CCH species is a good thermometer of interstellar medium (see e.g. Vasyunina et al. 2011), so assuming LTE conditions, we can consider that kinetic temperature Tkin is equal to rotational temperature Trot. The results of calculating column density and Tkin using rotational diagrams are presented in columns 3 and 4 of Table 2.
CS and CH3CCH column density Ncol and kinetic temperature Tkin of the sources. Tkin is determined from observations of CH3CCH emission.
| Source | Ncol(CS) | Ncol(CH3CCH) | Tkin |
|---|---|---|---|
| (1014 cm−2) | (1014 cm−2) | (K) | |
| G018.82−00.28* | 6.17 | 3.69 | 24.07 |
| G019.27+00.07* | 3.35 | 2.36 | 24.51 |
| G022.35+00.41* | 2.74 | 5.47 | 27.47 |
| G023.60+00.00* | 4.33 | 25.80 | 56.42 |
| G024.33+00.11* | 1.46a | 67.30 | 124.23 |
| G027.94−00.47* | 0.67a, b | – | – |
| G028.37+00.07a* | 9.34 | 8.97 | 27.95 |
| G028.37+0.07d* | 2.46 | 5.93 | 14.80 |
| G030.57−00.23* | 2.66 | 5.51 | 48.20 |
| G031.97+00.07* | 7.58 | 15.40 | 32.70 |
| G034.43+00.24a* | 10.71 | 13.00 | 39.24 |
| G034.43+0.24b* | 5.26 | 2.02 | 10.71 |
| G034.77−00.50 | 6.13 | 5.31 | 25.78 |
| G053.11+00.05* | 7.06 | 5.80 | 33.52 |
| G053.25+00.04* | 0.21 | 1.53 | 17.13 |
| G084.95−00.69* | 3.4 | 2.35 | 18.72 |
| IRAS21078+5211* | 10.92 | 10.80 | 31.08 |
| G094.60−01.80 | 1.67 | 2.59 | 44.68 |
| G100.38−03.58 | 0.34b | – | – |
| CepAHW2* | 6.31 | 8.75 | 50.88 |
| G108.76−00.99* | 0.55 | 2.89 | 25.96 |
| IRAS23033+595* | 6.01 | 2.64 | 22.92 |
| NGC7538S* | 35.79 | 24.10 | 39.07 |
| NGC7538IRS1* | 27.10 | 11.50 | 45.61 |
| NGC7538IRS9* | 12.92 | 12.10 | 31.92 |
| IRAS23385+605* | 0.32b | – | – |
| IRAS23151+5912* | 2.35b | – | – |
Notes. * Sources exhibiting cIMM emission at 44 GHz.
aIn these sources, C34S lines were not detected, and Ncol(CS) was calculated under the assumption of optically thin CS lines.
bIn these sources, CH3CCH lines were not detected or were too weak to determine kinetic temperature, and the typical value 30 K was adopted.
To estimate column density of CS, we firstly calculated the column density of C34S lines assuming LTE conditions and optically thin emission. Since we have only one transition in C34S line, the following formula was used to estimate molecular column densities:
where λ is the rest wavelength of the transition, A is the Einstein coefficient, gu is the upper state degeneracy, Jν(Tex) and Jν(Tbg) are the Rayleigh–Jeans equivalent temperatures, Qrot is the partition function, and El is the energy of the lower level. We adopted the excitation temperature Tex as Tkin from the CH3CCH analysis, since we assume LTE conditions. To estimate Ncol(CS), we scaled Ncol(C34S) by averaged abundance ratio 32S/34S ∼ 15 adopted from (Yu et al. 2020) for Galactocentric distances 3–7 kpc. The results of CS column density calculations are presented in column 2 of Table 2. For sources, where C34S lines were not detected, Ncol(CS) was calculated under the assumption of optically thin CS lines.
4.4 Bok globules
We observed five Bok globules at 44 GHz and in spectral ranges 84.4–86.7 GHz and 96.3–98.6 GHz. None of these starless cores were detected at 44 GHz. All five cores showed thermal CS emission. Thermal lines of CH3OH were identified in L1262, L1389, and L1512-S. Thermal lines of methyl acetylene CH3CCH were detected in L1262 and L1512-S. Spectra of detected molecular emission in Bok globules are presented in the latest plots in Figs A2–A4. Gaussian parameters of thermal CH3OH, CH3CCH, and CS lines are given in the end of Tables A2–A4 below a separation line.
5 DISCUSSION
5.1 Relationship between cIMMs and thermal emission
Here, we present comparison between parameters of cIMMs and thermal molecular emission. Fig. 3 shows the detection rates of the observed thermal molecular lines. It is clearly seen that most of the observed lines have high association with our sources. The detection of H13CN and HC18O + in most of the sources indicates the presence of dense gas at the locations of all targets. Fig. 4 represents detection rates of molecular emission in different types of sources based on data of 15 most detected molecular species. The sources, in which no cIMM emission was detected (filled with the slope pattern), exhibit ‘poorer’ molecular spectra than the most sources with cIMMs. It may indicate that cIMMs are more prone to be detected in sources with richer molecular spectra.
There is a moderate relation between maser integral flux density and CH3CCH integral intensity (see Fig. 5): cIMMs with higher integrated flux densities tend to be associated with molecular lines with higher integrated intensities. This indicates that the integrated flux density of the maser lines scales with the overall amount of gas. This is also supported by the fact that the sources undetected in cIMM line at 44 GHz have lower integral intensities of CH3CCH than sources with detected cIMMs: median values of integral intensity for cIMMs and sources non-detected at 44 GHz are 1.25 and 0.30 K km |$\rm {s^{-1}}$|, respectively (see Table A3).
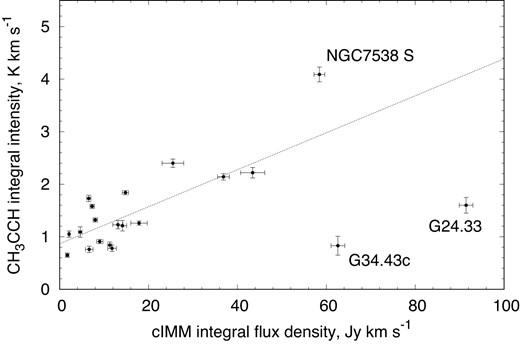
Relationship between integral flux density of cIMM and CH3CCH lines. The dashed line corresponds to a linear fit to the data excepting three sources, which are not fitted (see details in the text). They are indicated with their names: NGC7538S, G24.33, and G34.43c. The Pearson’s correlation coefficient is 0.75.
There are three sources indicated in Fig.5, which are different from most others. Two of them are quite inconsistent with the discussed trend: G24.33 and G34.43c. These sources are bright cIMMs, but have relatively weak lines of CH3CCH. Nevertheless, the value of the integral intensity of CH3CCH for these sources is typical among other sources, it is approximately in the middle of the whole range for the sample. The fact that the cIMMs in these sources are brighter may be due to different factors. It may not be related to the abundance of other molecules, but, for example, to shocks and local gas movements or special orientation of the emitting gas volume with respect to the line of sight, what might increase the brightness of cIMM. It is known that G24.33 demonstrates accretion bursts traced in methanol maser lines at 6.7 GHz (Kobak et al. 2023), what gives additional evidence in favor of existing special conditions in this source. Regarding the source G34.43c, it belongs to a crowded region, which is probably hosting many cores. Thus, the maser and molecular emission might come from different sources (note that, the difference in the beams size of the maser and molecular line data was of ∼ × 2). Third source indicated in Fig. 5 is NGC7538 S. It is also a bright cIMM, and it shows the largest value of the integrated flux density of CH3CCH among other sources, what is well consistent with the trend discussed above. Since all three outliers are bright cIMMs, in this case, it is necessary to be careful in identifying patterns between cIMM fluxes and molecular line parameters, because many additional factors increasing the maser brightness should be taken into account.
A linear fit to the data excepting three outliers is shown in Fig. 5 as a stright line. The Pearson’s correlation coefficient is r = 0.75, which can be interpreted as a strong correlation. The p-value3 is 0.00055, which confirms the high statistical significance of the observed correlation. In case if we include the three sources in the fit analysis, the correlation coefficient r = 0.46 and the p-value is 0.041.
There is a relation between amplitude of CH3CCH lines and presence of cIMM as can be seen from Table A3. Sources with detected cIMMs tend to have a higher temperature of the CH3CCH lines than sources with no cIMM.
Relationship between integral flux density of maser lines and kinetic temperature determined from CH3CCH data is shown at Fig. 6. The Pearson’s correlation coefficient is 0.22 and the p-value is 0.39, which means that our data do not show significant correlation between the cIMM flux and Tkin. Relationship between cIMM flux and CH3CCH column density is shown at Fig. 7. In this case, the Pearson’s correlation coefficient is 0.42 and the p-value is 0.094. This result can be interpreted as a moderate correlation, but the reached level of statistical significance 0.1 seems ambiguous since it is generally accepted as 0.05. Thus, this analysis requires improvement and more observational data are needed. Also, we should mention that the accuracy of calculations of Ncol and Tkin may be less for the sources showing only 2–3 transitions of CH3CCH at 85.5 GHz. Observations at other frequencies can improve the accuracy of these parameters. In the above analisys, the three brightest cIMMs were not fitted for consistency with the data presented in Fig. 5.
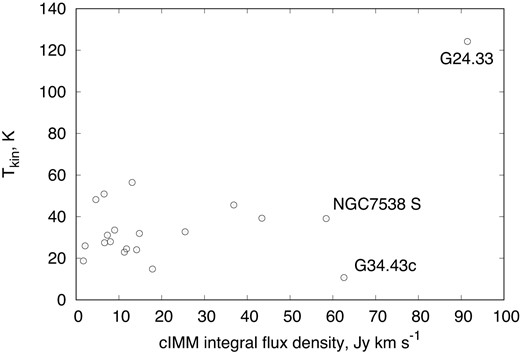
Relationship between flux density of the detected 44 GHz methanol masers and kinetic temperature Tkin obtained from CH3CCH lines.
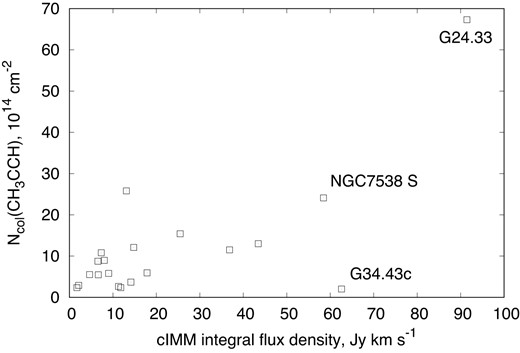
Relationship between flux density of the detected 44 GHz methanol masers and column density Ncol of CH3CCH lines.
We analysed the relationship between velocity peaks of cIMM lines and thermal lines – see spectra at Fig. A3 with vertical lines indicating velocities of cIMMs (green) and CH3CCH (red). This relation may point to an association of masers with quiet gas material or with possible outflows. It is important that maser lines in the spectra of all detected sources are at velocities close to the systemic velocity of a particular cloud, which is an additional evidence in favour of association with the observed cores.
The velocity peaks of thermal CH3OH, CH3CCH, and CS lines are coincident. The only exception is the source G022.35+00.41 exhibiting three peaks of CS emission. The third peak at 80 km s−1 probably belongs to another molecular core, which falls into the beam. Comparison of line width for three species showed that the FWHM of CS and CH3OH lines is almost the same, while the FWHM of CH3CCH lines is significantly smaller (see Table 3). This suggests that CS and CH3OH emission comes from a greater volume of gas. CH3CCH is known to originate from the extended, but not expanding gas (Santos et al. 2022), as can be seen in its spectra: CH3CCH narrow lines indicate small velocity gradient.
Average and median values of FWHM for CS, CH3OH, and CH3CCH thermal lines.
| Molecule | Average FWHM | Median FWHM |
|---|---|---|
| km s−1 | km s−1 | |
| CS | 4.19 | 4.24 |
| CH3OH | 4.36 | 4.58 |
| CH3CCH | 2.84 | 2.67 |
| Molecule | Average FWHM | Median FWHM |
|---|---|---|
| km s−1 | km s−1 | |
| CS | 4.19 | 4.24 |
| CH3OH | 4.36 | 4.58 |
| CH3CCH | 2.84 | 2.67 |
5.2 Relationship between infrared emission and cIMMs
All sources detected at 44 GHz in our work show IR signatures at 4.5, 8, or 24 μm. Emission at 4.5 μm indicates the presence of shocks, and it was proven that cIMMs are associated with shocks in regions of forming protostars (Cyganowski et al. 2009b). The presence of 8.0 μm emission in red sources might hint at gas ionized by young stars forming within the IRDC. The 24 μm emission is considered as indication of a point source, which is probably an actively forming protostar (Chambers et al. 2009). Thereby, it is more promising to search for cIMM at 44 GHz in the sources previously identified in IRDCs by different signatures, millimeter, and/or submillimeter emission combined with mid-IR or far-IR emission.
5.3 Notes on different types of sources
The sources with IR-signs show more molecular line emission than the quiescent Bok globules. This is expected because in the earlier stages of clumps evolution, most molecules are not in gas phase and bound with dust grains. As a clump becomes more evolved, more molecules are evaporated from dust grains due to heating from a protostar. The active and IR-bright sources show a somewhat bimodal distribution, as seen from Fig. 4 with the one group of sources exhibiting rich molecular spectra, and the other one showing sparse spectra with less number of detected lines. This may be explained if the sources from the first group have more molecular gas in the surrounding environment due to less ionization from the central protostar, as compared with the second group of probably more evolved sources. The sources, in which no cIMM emission was detected, have molecular line detection rates 50 per cent (active), 44 per cent (red), 50 per cent, and 38 per cent (IR-bright). It may indicate that cIMMs are more prone to be detected in sources with richer molecular spectra.
The 8 active and 6 intermediate molecular cores in our sample contain cIMM at 44 GHz with the detection rate of 88 and 100 per cent, respectively. For those sources which were detected at 44 GHz in previous works, we compare our results with other observations (for references, see Section B). No significant changes of the flux are noticed. Flux variations are mostly within observational sensitivity.
All molecular cores exhibiting cIMM emission at 25 GHz in the work Chambers et al. (2009) were also detected at 44 GHz in this work. Leurini et al. (2016) showed that maser emission in the 25 GHz lines occurs at higher densities n(H2) > 106 cm−3 than other cIMM. The coincidence of the detected 44 GHz masers with 25 GHz masers points to higher densities in cores exhibiting both types of masers. It also supports the conclusion made in Chambers et al. (2009) that active cores are more dense than other types of cores.
CS emission was detected in all sources with the same probability. Three sources with cIMMs and one source without cIMM show signatures of infall motions seen in CS line profiles, what indicates the ongoing formation of a protostar.
Starless (Bok globules) and quiescent cores at the very early stages of star formation without IR-signatures do not exhibit cIMMs. This is also confirmed in Chambers et al. (2009) by the non-detection of 25 GHz methanol masers in quiescent cores. We did not find any association of H2O masers, cIIMMs, and OH masers with quiescent and starless cores from the previous works (see Ladeyschikov, Bayandina & Sobolev 2019). Since no 44 GHz emission was detected in quiescent cores, their density is lower than 104 cm−3 (Leurini et al. 2016). Also, since quiescent cores from our sample do not exhibit H2O masers, this might be considered as an additional observational evidence in favour of the earlier evolutionary stage of these cores than active and intermediate cores.
Both IR-bright and IR-quiet sources of the IRAM sample were detected at 44 GHz with the detection rate of 67 and 100 per cent, respectively (see Fig. 1. Three of 10 cIMMs in this sample are the newly discovered cIMMs. It is also interesting that IR-quiet sources G108.76−00.99 and IRAS21078+5211 are found to have 30SiO emission at 84.7 GHz in our observations. This result may suggest that infrared-quiet cores are in a more active accretion phase than infrared-bright sources. Considering the fact that IR-quiet sources from our sample exibit cIMM with 100 per cent probability (and two new cIMMs are found in IR-quiet sources), we conclude that infrared-quiet sources may be promising targets for searching cIMMs.
5.4 Sources with discovered cIMMs
Four new cIMMs were discovered in our observations: in the IR-bright source G084.95−00.69, in two IR-quiet cores G108.76−00.99 and IRAS 21078+5211, and in the intermediate source G034.43+0.24f. We used the online data base of astrophysical masers 4 (Ladeyschikov et al. 2019, 2022) to check for previous detection of other maser species, including cIMM within the search radius of 83 arcsec from the observed position. Since the radius corresponds to the beam size at the half-power level at 44 GHz, the search area covers a diameter of twice the beam.
A cIMM in G084.95−00.69 has a peak flux density of 2.5 Jy at VLSR = −35 km s−1. It was not detected at 95 GHz at the level of 1.1 Jy in Yang et al. (2017a). An H2O maser in this source was found in Urquhart et al. (2011), and a cIIMM was recently detected in 6.7 GHz Methanol Maser Survey performed towards a sample of young stellar objects selected as WISE point sources (Yang et al. 2019). No observations of OH masers have been conducted towards the source to date.
The discovered cIMM in IRAS 21078+5211 has a peak flux density of 6 Jy at VLSR = −6.7 km s−1. There is an H2O maser (Palla et al. 1991; Sunada et al. 2007) at the angular separation of ∼74 arcsec from the pointing coordinates used in this work. An interferometric search for the 44 GHz class I methanol maser towards this H2O maser has been performed with the VLA by Gómez-Ruiz et al. (2016), but no cIMM is detected. Also, a number of class II methanol maser searchers have been performed, and no cIIMM is found in this source (see for example, the recent survey of Yang et al. 2017b). OH masers have not been observed in the source.
A new cIMM in G108.76−00.99 source has a peak flux density of 1.2 Jy at VLSR = −50 km s−1. The source hosts an H2O maser (Urquhart et al. 2011) and a cIIMM (Yang et al. 2019). OH masers have not been observed to date.
A new cIMM in the core G034.43+0.24f is discovered at 44 GHz with a peak flux density of 2.6 Jy at VLSR = 59.3 km s−1. No emission at 95 GHz was found in this source at the level of 1.6 Jy (Yang et al. 2017a). No H2O maser is detected towards this source at the level of 0.1 Jy (Wang et al. 2006). Other maser species have not been observed in the source to date. This molecular core is associated with a 24 μm point source (Chambers et al. 2009).
6 CONCLUSIONS
A sample of 37 molecular cores located in infrared dark clouds was observed with the 20 meter Onsala radio telescope in order to search for class I methanol masers (cIMMs) at a frequency of 44 GHz in 70 − 61A+ transition. The cIMM emission at 44 GHz is detected in 29 of 37 sources with detection rate of ∼78 per cent. 4 detections out of 29 are newly discovered cIMMs at 44 GHz: G034.43+0.24f (intermediate core), G084.95−00.69 (IR-bright core), G108.76−00.99, and IRAS21078+5211 (IR-quiet core). The high detection rate of our study shows that the catalogue of known 44 GHz methanol masers is still far from saturation and more surveys are needed to acquire a fare statistic for the specie.
No 44 GHz cIMM are found to be associated with quiescent cores. But at the same time, the most IR-active and evolved sources of our sample show lower detection rate of 44 GHz cIMM than IR-dimmer and younger sources. Active (showing 24 μm compact source and 4.5 μm outflow signatures), red (probable H ii regions), and IR-bright (showing the flux density at 21 μm of greater than 10 Jy) cores are detected at 44 GHz in 7/8 (7 out of 8), 5/6 and 4/6 sources, respectively. While 8/8 intermediate cores (showing either 24 μm compact source or 4.5 μm outflow signature) and 6/6 IR-quiet sources (showing the flux density at 21 μm of less than 10 Jy) show 44 GHz cIMMs. Note that, despite the small size of our sample, the presented detection trend persists for cores identified in different surveys and using different criteria.
The statistic clearly shows that quiescent cores at the very early stages of star formation are unlikely to exhibit cIMMs. Our results reinforce the assumption that cIMMs are likely to appear in regions with signs of ongoing star-forming activity indicated by various IR-signatures; however, IR-advanced cores are found to be less prone to host cIMM. We conclude that 44 GHz methanol maser emission most readily trace the early stages of star formation characterized by moderate IR-signatures. We emphasize that intermediate and IR-quiet cores may be the most fruitful targets for future class I methanol maser surveys.
Molecular line data for CH3CCH, CH3OH, CS, and a number of other species at frequencies 85.5, 96.7, and 98 GHz were collected. The most of the observed molecular species have high detection rate and association with our sources. CH3CCH emission was detected in 24 sources, and CS emission was detected in all 27 sources observed in this line. Where possible, kinetic temperature of the gas (Tkin) and corresponding molecular column densities (Ncol) for CH3CCH and CS species were obtained. For the most clumps, Tkin falls into the range 10–40 K, Ncol(CS) ∼(1 − 35) × 1014 cm−2 and Ncol(CH3CCH) ∼(2–15) × 1014 cm−2. The detection of H13CN and HC18O + in most of the sample indicates the presence of dense gas at the locations of observed clumps in IRDCs.
We found a moderate correlation between cIMM flux density and molecular integral line intensity, which indicates a relationship between overall gas volume and maser intensity. There is a correlation between the 44 GHz maser detection and presence CH3CCH lines of the higher amplitude. The sources undetected in cIMM line at 44 GHz have ∼4 times lower integral intensities of CH3CCH than sources with detected cIMMs. The sources, in which no cIMM emission was detected, exhibit poorer molecular spectra than the most sources with cIMMs. It may indicate that cIMMs are more prone to be detected in sources with richer molecular spectra.
ACKNOWLEDGEMENTS
We express our gratitude to the Onsala Space Observatory for the provisioning of its facilities and observational support. The Onsala Space Observatory national research infrastructure is funded through Swedish Research Council grant no. 2017–00648. OB acknowledges financial support from the Italian Ministry of University and Research—Project Proposal CIR01|$\_$|00010.
DATA AVAILABILITY
The data underlying this article will be shared on reasonable request to the corresponding author.
Footnotes
Olofsson, A. O. H., private communication
P-value is the probability of getting the same or more extreme result, given that the null hypothesis is true (see, for example, https://www.math.net/p-value).
References
APPENDIX A: TABLES


Spectra of the 70 − 61A+ 44-GHz emission of methanol. The velocity resolution after smoothing is 0.13 km s−1.


Spectra of thermal emission of CH3CCH in the 6K–5K lines at 85.5 GHz. The LSR velocity corresponds to the peak of the 60–50 line. The velocity resolution after smoothing is 0.5 km s−1.


Spectra of the thermal emission of CS (J = 2 − 1) at 98 GHz. The velocity resolution is 0.23 km s−1. Red vertical lines indicate velocity of CH3CCH line, and green vertical lines show velocity of cIMM spectral components.


Spectra of CH3OH emission at 96.7 GHz. The LSR velocity corresponds to the peak of the line 2−1–1−1 E. The velocity resolution is 0.23 km s−1.
List of observed sources, detected 44 GHz class I methanol masers, molecular species, and other associated masers and infrared features.
| Source | Source | RA (J2000) | Dec. (J2000) | VLSR | Dist.f | Det/non-Det | IRa | Associated masers | ||||||
|---|---|---|---|---|---|---|---|---|---|---|---|---|---|---|
| type | name | (h m s) | (° arcmin arcsec) | km s−1 | kpc | cIMM | CH3CCH | CH3OH | CS | features | cIMMb | H2Oc | cIIMMd | OHe |
| 44 GHz | 85.5 GHz | 96.7 GHz | 98 GHz | 25/95 GHz | 22 GHz | 6.7 GHz | 1.6 GHz | |||||||
| Active | G022.35+00.41 | 18:30:24.23 | −09:10:39.80 | +53.3 | 4.3 | Y | Y | Y | Y | GF, PS | Y | Y | – | – |
| cores1, 2 | G023.60+00.00 | 18:34:11.41 | −08:19:08.90 | +106.9 | 3.9 | Y | Y | Y | Y | GF, PS | Y | Y | – | – |
| G028.37+0.07b | 18:42:52.03 | −03:59:52.20 | +76.4 | 5.0 | Y | n/o | n/o | n/o | GF, PS | Y | Y | Y | Y | |
| G028.37+0.07d | 18:42:53.98 | −04:02:37.40 | +79.7 | 5.0 | Y | Y | Y | Y | GF, PS | Y | Y | – | – | |
| G031.97+00.07 | 18:49:36.55 | −00:45:47.10 | +95.2 | 5.1 | Y | Y | Y | Y | GF, PS | Y | Y | Y | Y | |
| G034.43+0.24a | 18:53:17.93 | +01:25:25.20 | +57.5 | 3.8 | Y | Y | Y | Y | GF, PS | Y | Y | Y | Y | |
| G034.43+0.24e3 | 18:53:16.50 | +01:26:09.00 | +57.1 | 3.7 | Y | n/o | n/o | n/o | GF, PS | Y | Y | Y | Y | |
| G053.25+00.04 | 19:29:31.06 | +17:59:54.50 | 1.9 | N | Y | Y | Y | GF, PS | ||||||
| Intermediate | G018.82−00.28 | 18:25:56.09 | −12:42:47.80 | +38.2 | 4.8 | Y | Y | Y | Y | PS | Y | Y | Y | Y |
| cores1, 2 | G019.27+00.07 | 18:25:58.48 | −12:03:59.10 | +27.3 | 2.4 | Y | Y | Y | Y | PS | Y | Y | – | – |
| G024.60+00.08 | 18:35:40.75 | −07:18:26.70 | +50.9 | 3.7 | Y | n/o | n/o | n/o | GF | Y | Y | Y | – | |
| G028.37+0.07a | 18:42:37.59 | −04:02:04.90 | +82.4 | 4.3 | Y | Y | Y | Y | PS | Y | Y | – | – | |
| G034.43+0.24f3 | 18:53:19.20 | +01:26:53.00 | +57.1 | 3.7 | Y* | n/o | n/o | n/o | PS | – | – | – | – | |
| G030.57−00.23 | 18:47:59.69 | −02:07:27.20 | +88.4 | Y | Y | Y | Y | GF | Y | Y | Y | – | ||
| G034.43+0.24c | 18:53:19.93 | +01:28:26.40 | +59.6 | 3.8 | Y | Y | Y | Y | GF | Y | Y | – | – | |
| Red | G024.33+00.11 | 18:35:07.90 | −07:35:04.00 | +113.3 | 7.1 | Y | Y | Y | Y | R, PS | Y | Y | Y | Y |
| cores1, 2 | G027.94−00.47 | 18:44:03.60 | −04:37:59.80 | +45.4 | 3.2 | Y | N | Y | Y | R, PS | Y | Y | – | – |
| G028.28−00.34 | 18:44:14.99 | −04:17:54.00 | +47.8 | 3.0 | Y | n/o | n/o | n/o | R | Y | Y | Y | Y | |
| G034.43+0.24b | 18:53:18.59 | +01:24:40.10 | +60.3 | 3.8 | Y | n/o | n/o | n/o | R, PS | Y | Y | Y | Y | |
| G034.77−00.55 | 18:56:48.19 | +01:18:46.90 | +78.9 | N | Y | Y | Y | R, PS | ||||||
| G053.11+00.05 | 19:29:17.20 | +17:56:20.90 | +21.9 | 1.8 | Y | Y | Y | Y | R, PS | Y | Y | Y | Y | |
| Quiescent | IRDC18306 | 18:33:32.04 | −08:32:28.62 | +54.8 | 3.6 | N | n/o | n/o | n/o | – | – | – | – | – |
| cores4 | IRDC18308 | 18:33:35.09 | −08:36:00.12 | +73.7 | 4.4 | N | n/o | n/o | n/o | – | – | – | – | – |
| G28.34S | 18:42:46.60 | −04:04:11.94 | +78.4 | 4.8 | N | n/o | n/o | n/o | – | – | Y | – | – | |
| IRDC18530 | 18:55:30.13 | +02:17:09.30 | +75.9 | 4.6 | N | n/o | n/o | n/o | – | – | – | – | – | |
| IR-bright | G084.95−00.69 | 20:55:32.47 | +44:06:10.10 | −34.6 | 0.6 | Y* | Y | Y | Y | R, S21 | – | Y | Y | – |
| sources5 | G094.60−01.80 | 21:39:58.25 | +50:14:20.90 | −43.6 | 4.9 | N | Y | Y | Y | R, S21 | – | Y | Y | – |
| G100.38−03.58 | 22:16:10.35 | +52:21:34.70 | −37.6 | 3.5 | N | Y | Y | Y | R, S21 | – | Y | – | – | |
| NGC7538 IRS1 | 23:13:45.36 | +61:28:10.50 | −57.3 | 2.7 | Y | Y | Y | Y | R, S21 | Y | Y | Y | Y | |
| NGC7538 IRS9 | 23:14:01.67 | +61:27:19.10 | −57.0 | 2.7 | Y | Y | Y | Y | R, S21 | Y | Y | Y | – | |
| IRAS23151+5912 | 23:17:21.01 | +59:28:47.40 | −54.4 | 3.3 | Y | N | Y | Y | R, S21 | Y | Y | – | – | |
| IR-quiet | IRAS21078+5211 | 21:09:21.64 | +52:22:37.50 | −6.1 | 1.6 | Y* | Y | Y | Y | R, S21 | – | Y | – | – |
| sources5 | CepheusA HW2 | 22:56:17.97 | +62:01:49.50 | −10.0 | 0.7 | Y | Y | Y | Y | R, S21 | Y | Y | Y | Y |
| G108.76−00.99 | 22:58:47.24 | +58:45:01.60 | −51.5 | 3.5 | Y* | Y | Y | Y | R, S21 | – | Y | Y | – | |
| IRAS23033 + 595 | 23:05:25.00 | +60:08:15.40 | −53.1 | 4.3 | Y | Y | Y | Y | R, S21 | Y | Y | – | – | |
| NGC7538 S | 23:13:44.86 | +61:26:48.10 | −56.4 | 2.7 | Y | Y | Y | Y | R, S21 | Y | Y | Y | Y | |
| IRAS23385+605 | 23:40:54.40 | +61:10:28.20 | −50.2 | 4.9 | Y | N | Y | Y | R, S21 | – | Y | – | – | |
| Bok | L1262 | 23:25:26.80 | +74:18:22.00 | . | 0.20 | N | Y | Y | Y | – | – | – | – | – |
| globules6 | CB4-SMM | 00:39:05.20 | +52:51:47.00 | . | 0.35 | N | N | N | Y | – | – | – | –– | |
| L1389 | 04:04:37.10 | +56:56:02.00 | . | 0.25 | N | N | Y | Y | – | – | – | – | – | |
| L1439 | 05:00:14.50 | +52:05:59.00 | . | 0.14 | N | N | N | Y | – | – | – | – | – | |
| L1512-S | 05:04:08.10 | +32:43:30.00 | . | 0.14 | N | Y | Y | Y | – | – | – | – | – | |
Notes. 1–6 References: 1 – Chambers et al. (2009); 2 – Rathborne et al. (2010); 3 – Pon et al. (2016); 4 – Feng et al. (2016); 5 – Beuther et al. (2018); 6 – Lippok et al. (2016).
* cIMMs discovered in this work.
n/o – not observed at particular frequency.
aIR-signatures associated with sources are indicated as follows: GF: green fuzzy (4.5 μm); PS: 24 μm point source; R: red core (8 μm) (see Chambers et al. 2009 and Section 2); S21: source emission at 21 μm; IR(b): IR-bright; IR(q): IR-quiet (see Beuther et al. 2018 and Section 2 for detailed explanation).
bcIMMs at frequencies other than 44 GHz (Kim, Kim & Park 2018; Chambers et al. 2009; Yang et al. 2017a, 2020; Chen et al. 2011).
cAssociated H2O masers at 22 GHz (Urquhart et al. 2011; Kim et al. 2018; Palla et al. 1991; Sunada et al. 2007; Walsh et al. 2011; Wang et al. 2006; Cyganowski et al. 2013; Furuya et al. 2003; Svoboda et al. 2016; Chambers et al. 2009).
dAssociated cIIMM at 6.6 GHz (Yang et al. 2019, 2017b; Hu et al. 2016; Breen et al. 2016; Fontani, Cesaroni & Furuya 2010).
fDistances are adopted from the same papers as sample sources. In case information was not available, the distances were calculated using the Bayesian distance estimator (Reid et al. 2019).
Methanol emission line parameters in maser transition 70 − 61A+ at 44 GHz and in thermal transitions 2K−1K at 96.7 and 97.6 GHz with 1σ errors.
| Source | cIMM parameters | CH3OH parameters | |||||||||
|---|---|---|---|---|---|---|---|---|---|---|---|
| name | Vpeak | ΔV | Fpeak | ∫F44 dV | Vpeak | ΔV | |$\int T_{\rm mb}^{*}$| dV | ||||
| (km s−1) | (km s−1) | (Jy) | (Jy km s−1) | (km s−1) | (km s−1) | (K km s−1) | |||||
| K = −1 (E) | K = 0 (A +) | K = 0 (E) | K = 1 (E) | K = 1 (A−) | |||||||
| G018.82−00.28 | 40.14 (0.03) | 3.51 (0.23) | 2.81 | 10.50 (0.62) | 39.43 (0.03) | 5.61 (0.03) | 6.97 (0.07) | 9.12 (0.07) | 2.29 (0.07) | 0.70 (0.06) | 0.90 (0.07) |
| 44.75 (0.01) | 1.08 (0.14) | 3.17 | 3.64 (0.44) | ||||||||
| G019.27+00.07 | 23.35 (0.02) | 0.51 (0.06) | 5.26 | 2.87 (0.28) | 24.16 (0.02) | 4.71 (0.03) | 5.64 (0.06) | 6.82 (0.06) | 1.96 (0.06) | 0.44 (0.06) | 0.91 (0.07) |
| 27.36 (0.11) | 2.56 (0.32) | 2.68 | 7.30 (0.65) | ||||||||
| 27.49 (0.02) | 0.25 (0.04) | 5.99 | 1.62 (0.27) | ||||||||
| G022.35+00.41 | 53.67 (0.13) | 3.16 (0.33) | 1.98 | 6.65 (0.56) | 50.92 (0.03) | 4.68 (0.03) | 6.12 (0.08) | 6.37 (0.08) | 1.43 (0.07) | 0.37 (0.07) | 0.55 (0.06) |
| G023.60+00.00 | 106.55 (0.25) | 4.70 (0.69) | 1.36 | 6.79 (0.76) | 104.33 (0.04) | 4.55 (0.04) | 4.69 (0.08) | 5.69 (0.08) | 1.47 (0.08) | 0.24 (0.07) | 0.62 (0.12) |
| 106.80 (0.03) | 0.80 (0.08) | 5.48 | 4.66 (0.53) | ||||||||
| 107.53 (0.02) | 0.36 (0.06) | 4.35 | 1.65 (0.30) | ||||||||
| G024.33+00.11 | 113.84 (0.13) | 1.01 (0.13) | 49.84 | 53.53 (1.35) | 113.53 (0.08) | 4.25 (0.09) | 4.54 (0.20) | 5.53 (0.20) | 1.62 (0.19) | 0.63 (0.19) | – |
| 115.14 (0.13) | 1.07 (0.13) | 24.87 | 28.37 (1.35) | ||||||||
| 116.58 (0.13) | 0.91 (0.13) | 9.92 | 9.55 (1.35) | ||||||||
| G024.60+00.08 | 51.22 (0.03) | 0.68 (0.09) | 4.84 | 3.50 (0.36) | not observed | ||||||
| 52.59 (0.06) | 1.10 (0.21) | 2.79 | 3.27 (0.44) | ||||||||
| G028.37+0.07a | 80.06 (0.12) | 0.73 (0.30) | 1.27 | 0.98 (0.34) | 79.32 (0.24) | 3.68 (0.24) | 5.72 (0.09) | 7.08 (0.09) | 1.52 (0.09) | 0.34 (0.09) | 0.47 (0.04) |
| 80.85 (0.08) | 0.49 (0.14) | 1.77 | 0.93 (0.30) | ||||||||
| 82.05 (0.03) | 1.06 (0.06) | 5.41 | 6.11 (0.30) | ||||||||
| G028.37+0.07b | 76.82 (0.01) | 0.44 (0.01) | 55.01 | 25.59 (1.63) | not observed | ||||||
| 77.23 (0.02) | 0.94 (0.02) | 57.40 | 57.68 (1.83) | ||||||||
| 78.49 (0.02) | 0.71 (0.05) | 18.17 | 13.71 (0.84) | ||||||||
| 79.20 (0.02) | 0.44 (0.04) | 13.14 | 6.08 (0.81) | ||||||||
| 79.82 (0.01) | 0.56 (0.02) | 29.60 | 17.64 (0.52) | ||||||||
| G028.37+0.07d | 80.08 (0.26) | 4.27 (0.61) | 1.69 | 7.66 (1.23) | 79.32 (0.05) | 4.58 (0.06) | 7.26 (0.19) | 8.69 (0.20) | 1.80 (0.18) | – | – |
| 79.11 (0.04) | 0.39 (0.08) | 6.09 | 2.54 (0.90) | ||||||||
| 79.66 (0.04) | 0.63 (0.14) | 8.23 | 5.50 (1.16) | ||||||||
| 80.29 (0.04) | 0.25 (0.09) | 3.43 | 0.92 (0.39) | ||||||||
| 80.84 (0.05) | 0.45 (0.11) | 2.56 | 1.24 (0.39) | ||||||||
| G027.94−00.47 | 45.42 (0.05) | 1.10 (0.09) | 7.80 | 9.11 (0.82) | 45.16 (0.12) | 1.51 (0.19) | 0.50 (0.14) | 0.85 (0.16) | – | – | – |
| 45.72 (0.01) | 0.39 (0.03) | 14.75 | 6.18 (0.73) | ||||||||
| G028.28−00.34 | 48.57 (0.02) | 0.59 (0.05) | 6.74 | 4.26 (0.29) | not observed | ||||||
| G030.57−00.23 | 88.80 (0.04) | 0.53 (0.10) | 2.39 | 1.34 (0.22) | 88.62 (0.08) | 5.33 (0.10) | 2.80 (0.09) | 3.65 (0.09) | 0.84 (0.08) | – | – |
| 89.81 (0.04) | 0.58 (0.11) | 2.74 | 1.70 (0.26) | ||||||||
| 90.52 (0.03) | 0.33 (0.08) | 2.79 | 0.10 (0.23) | ||||||||
| 91.01 (0.02) | 0.35 (0.07) | 3.98 | 1.49 (0.23) | ||||||||
| G031.97+00.07 | 95.46 (0.15) | 3.73 (0.45) | 3.99 | 15.84 (1.62) | 93.80 (0.02) | 5.56 (0.02) | 9.76 (0.07) | 11.81 (0.08) | 3.15 (0.07) | 1.05 (0.07) | 1.49 (0.08) |
| 94.76 (0.08) | 0.90 (0.18) | 3.75 | 3.59 (1.01) | ||||||||
| 95.67 (0.02) | 0.53 (0.07) | 10.73 | 6.05 (0.91) | ||||||||
| G034.43+0.24a | 56.98 (0.14) | 2.18 (0.22) | 6.13 | 14.18 (1.81) | 57.79 (0.02) | 4.59 (0.02) | 12.15 (0.12) | 14.03 (0.12) | 3.95 (0.11) | 1.56 (0.11) | 2.19 (0.12) |
| 57.95 (0.02) | 0.64 (0.08) | 7.87 | 5.37 (1.26) | ||||||||
| 58.99 (0.02) | 0.86 (0.03) | 12.13 | 11.06 (0.51) | ||||||||
| 59.86 (0.02) | 0.47 (0.03) | 8.43 | 4.19 (0.11) | ||||||||
| 60.50 (0.01) | 0.50 (0.03) | 16.08 | 8.63 (0.38) | ||||||||
| G034.43+0.24b | 58.08 (0.02) | 0.68 (0.07) | 9.63 | 6.99 (1.19) | not observed | ||||||
| 59.10 (0.01) | 0.59 (0.04) | 14.14 | 8.92 (0.68) | ||||||||
| 60.11 (0.02) | 1.17 (0.04) | 30.43 | 37.86 (1.26) | ||||||||
| 60.53 (0.01) | 0.32 (0.02) | 25.58 | 8.83 (0.83) | ||||||||
| G034.43+0.24c | 59.27 (0.04) | 2.86 (0.08) | 12.58 | 38.35 (1.03) | 59.51 (0.07) | 5.84 (0.08) | 9.56 (0.16) | 10.0 (0.19) | 3.47 (0.15) | 0.55 (0.16) | 0.90 (0.13) |
| 60.12 (0.02) | 0.57 (0.03) | 12.21 | 7.38 (0.41) | ||||||||
| 59.61 (0.00) | 0.49 (0.01) | 45.91 | 23.94 (0.35) | ||||||||
| G034.43+0.24e | 57.83 (0.07) | 0.68 (0.19) | 4.97 | 3.62 (1.07) | not observed | ||||||
| 58.92 (0.07) | 1.02 (0.32) | 4.59 | 5.01 (1.14) | ||||||||
| G034.43+0.24f* | 59.31 (0.13) | 0.91 (0.13) | 2.65 | 2.58 (0.11) | not observed | ||||||
| G034.77−00.55 | – | – | – | – | 43.79 (0.07) | 4.04 (0.08) | 2.87 (0.12) | 3.72 (0.13) | 0.59 (0.11) | – | – |
| G053.11+00.05 | 22.23 (0.01) | 0.58 (0.03) | 14.50 | 9.02 (0.46) | 21.37 (0.02) | 4.10 (0.02) | 4.64 (0.04) | 5.87 (0.05) | 1.17 (0.04) | 0.34 (0.04) | 0.57 (0.06) |
| G053.25+00.04 | – | – | – | – | 23.46 (0.02) | 1.49 (0.03) | 0.70 (0.02) | 0.94 (0.03) | – | – | – |
| G084.95−00.69* | −35.07 (0.02) | 0.33 (0.04) | 1.95 | 0.68 (0.09) | −33.24 (0.03) | 3.81 (0.04) | 1.22 (0.02) | 1.54 (0.02) | 0.16 (0.02) | 0.08* (0.02) | |
| −35.03 (0.15) | 1.39 (0.23) | 0.70 | 1.04 (0.24) | ||||||||
| G094.60−01.80 | – | – | – | – | −43.09 (0.09) | 4.68 (0.10) | 1.01 (0.05) | 1.49 (0.05) | 0.25 (0.05) | – | – |
| G100.38−03.58 | – | – | – | – | −35.75 (0.38) | 4.82 (0.39) | 0.16 (0.03) | 0.26 (0.04) | – | – | – |
| IRAS21078+5211* | −7.31 (0.05) | 0.66 (0.17) | 2.61 | 1.84 (0.29) | −4.05 (0.01) | 3.90 (0.02) | 3.22 (0.03) | 4.49 (0.03) | 1.51 (0.03) | 0.58 (0.03) | 0.71 (0.04) |
| −6.75 (0.04) | 0.53 (0.06) | 5.40 | 3.03 (0.19) | ||||||||
| −6.12 (0.07) | 0.74 (0.11) | 3.12 | 2.45 (0.33) | ||||||||
| CepA HW2 | −12.84 (0.01) | 0.30 (0.01) | 7.43 | 2.39 (0.09) | −10.67 (0.04) | 4.56 (0.05) | 2.42 (0.06) | 3.63 (0.06) | 0.77 (0.06) | 0.40 (0.06) | 0.45* (0.08) |
| −11.07 (0.17) | 4.41 (0.36) | 0.89 | 4.16 (0.32) | ||||||||
| G108.76−00.99* | −51.40 (0.04) | 0.50 (0.09) | 1.01 | 0.54 (0.09) | −47.80 (0.01) | 3.69 (0.02) | 3.04 (0.03) | 4.35 (0.04) | 0.56 (0.03) | 0.09 (0.03) | – |
| −50.31 (0.04) | 0.96 (0.13) | 1.19 | 1.24 (0.13) | ||||||||
| −49.05 (0.07) | 0.52 (0.20) | 0.62 | 0.34 (0.10) | ||||||||
| IRAS23033+595 | −53.66 (0.03) | 0.29 (0.06) | 2.69 | 0.83 (0.18) | −49.73 (0.02) | 3.97 (0.02) | 3.75 (0.04) | 4.84 (0.04) | 0.71 (0.04) | 0.21 (0.03) | 0.13* (0.04) |
| −54.22 (0.01) | 0.39 (0.01) | 20.62 | 8.57 (0.19) | ||||||||
| −52.66 (0.07) | 0.95 (0.21) | 1.87 | 1.89 (0.31) | ||||||||
| NGC7538 S | −56.97 (0.07) | 0.70 (0.07) | 27.73 | 20.79 (0.53) | −56.02 (0.01) | 4.63 (0.02) | 16.12 (0.12) | 20.74 (0.12) | 5.42 (0.12) | 1.81 (0.11) | 2.47 (0.16) |
| −56.23 (0.07) | 0.65 (0.07) | 6.32 | 4.38 (0.53) | ||||||||
| −55.47 (0.00) | 0.99 (0.04) | 7.89 | 8.33 (0.08) | ||||||||
| −54.14 (0.02) | 1.28 (0.08) | 9.78 | 13.32 (0.81) | ||||||||
| −53.05 (0.01) | 0.42 (0.01) | 26.33 | 11.62 (0.35) | ||||||||
| NGC7538 IRS1 | −58.95 (0.03) | 0.37 (0.07) | 2.63 | 1.04 (0.20) | −54.08 (0.00) | 4.72 (0.01) | 6.75 (0.01) | 9.21 (0.01) | 2.68 (0.04) | 1.11 (0.04) | 1.26 (0.05) |
| −57.01 (0.07) | 3.32 (0.28) | 3.94 | 13.91 (0.61) | ||||||||
| −56.99 (0.01) | 0.67 (0.01) | 28.21 | 20.23 (0.59) | ||||||||
| −56.23 (0.01) | 0.26 (0.02) | 6.03 | 1.67 (0.17) | ||||||||
| NGC7538 IRS9 | −57.34 (0.02) | 0.70 (0.04) | 11.18 | 8.33 (0.47) | −54.45 (0.02) | 5.35 (0.02) | 5.19 (0.04) | 8.02 (0.04) | 1.73 (0.04) | 0.57 (0.04) | 0.50 (0.04) |
| −56.68 (0.02) | 0.48 (0.04) | 6.50 | 3.33 (0.38) | ||||||||
| −56.09 (0.01) | 0.43 (0.02) | 6.76 | 3.13 (0.06) | ||||||||
| IRAS23151 + 5912 | −54.43 (0.01) | 0.25 (0.03) | 4.87 | 1.31 (0.14) | −51.19 (0.26) | 3.90 (0.33) | 0.17 (0.03) | 0.22 (0.03) | 0.11 (0.03) | – | – |
| −52.40 (0.02) | 0.52 (0.05) | 3.78 | 2.10 (0.19) | ||||||||
| IRAS23385+605 | −51.67 (0.09) | 0.57 (0.21) | 1.17 | 0.71 (0.31) | −46.65 (0.07) | 5.18 (0.08) | 1.35 (0.05) | 2.02 (0.05) | 0.48 (0.04) | – | – |
| −49.42 (0.03) | 0.21 (0.05) | 2.14 | 0.48 (0.12) | ||||||||
| L1262 | – | – | – | – | 3.93 (0.004) | 0.48 (0.01) | 0.58 (0.02) | 0.77 (0.02) | 0.08 (0.02) | – | – |
| L1389 | – | – | – | – | −4.66 (0.01) | 0.44 (0.02) | 0.19 (0.01) | 0.25 (0.01) | 0.03* (0.01) | – | – |
| L1512-S | – | – | – | – | 7.11 (0.01) | 0.32 (0.02) | 0.15 (0.02) | 0.21 (0.02) | – | – | – |
Note. Symbol ‘–’ denotes that no cIMM emission at 44 GHz was detected in a source.
Gaussian parameters for detected CH3CCH lines at 85.5 GHz with 1σ errors.
| Source | RA (J2000) | Dec. (J2000) | VLSR | FWHM V | |$\int T_{\rm mb}^{*}$| dV | |||
|---|---|---|---|---|---|---|---|---|
| (h m s) | (° arcmin arcsec) | (km s−1) | (km s−1) | (K km s−1) | ||||
| K = 0 | K = 1 | K = 2 | K = 3 | |||||
| G018.82−00.28 | 18:25:56.09 | −12:42:47.80 | 41.64 (0.27) | 5.25 (0.28) | 0.60 (0.05) | 0.44 (0.05) | 0.17 (0.04) | |
| G019.27+00.07 | 18:25:58.48 | −12:03:59.10 | 26.25 (0.07) | 2.48 (0.12) | 0.37 (0.03) | 0.30 (0.03) | 0.11 (0.02) | |
| G022.35+00.41 | 18:30:24.23 | −09:10:39.80 | 53.46 (0.12) | 2.81 (0.15) | 0.29 (0.03) | 0.33 (0.04) | 0.10 (0.03) | <0.04 |
| G023.60+00.00 | 18:34:11.41 | −08:19:08.90 | 106.39 (0.06) | 2.21 (0.08) | 0.66 (0.04) | 0.57 (0.04) | ||
| G024.33+00.11 | 18:35:07.90 | −07:35:04.00 | 112.90 (0.27) | 3.49 (0.30) | 0.62 (0.12) | 0.54 (0.12) | 0.44 (0.12) | |
| G028.37+00.07a | 18:42:37.59 | −04:02:04.90 | 80.66 (0.04) | 2.69 (0.06) | 0.61 (0.02) | 0.51 (0.02) | 0.12 (0.02) | <0.08 |
| G028.37+0.07d | 18:42:53.98 | −04:02:37.40 | 78.72 (0.51) | 4.42 (0.54) | <0.64 | <0.62 | ||
| G030.57−00.23 | 18:47:59.69 | −02:07:27.20 | 90.16 (0.12) | 2.77 (0.18) | 0.38 (0.05) | 0.44 (0.05) | <0.13 | 0.14 (0.04) |
| G031.97+00.07 | 18:49:36.55 | −00:45:47.10 | 95.28 (0.06) | 3.55 (0.07) | 1.04 (0.04) | 0.86 (0.04) | 0.32 (0.04) | 0.18 (0.04) |
| G034.43+00.24a | 18:53:17.93 | 01:25:25.20 | 57.83 (0.07) | 2.90 (0.09) | 0.92 (0.05) | 0.73 (0.05) | 0.36 (0.05) | 0.21 (0.05) |
| G034.43+0.24c | 18:53:19.93 | 01:28:26.40 | 60.07 (0.58) | 5.14 (0.55) | 0.55 (0.09) | <0.28 | ||
| G034.77−00.5 | 18:56:48.19 | 01:18:46.90 | 44.21 (0.13) | 2.48 (0.19) | 0.55 (0.07) | 0.41 (0.06) | ||
| G053.11+00.05 | 19:29:17.20 | 17:56:20.90 | 21.51 (0.05) | 2.07 (0.07) | 0.39 (0.02) | 0.32 (0.02) | 0.13 (0.02) | 0.07 (0.02) |
| G053.25+00.04 | 19:29:31.06 | 17:59:54.50 | 23.70 (0.03) | 1.07 (0.05) | 0.20 (0.02) | 0.20 (0.02) | 0.04 (0.01) | |
| G084.95−00.69 | 20:55:32.47 | 44:06:10.10 | −34.74 (0.06) | 2.77 (0.09) | 0.34 (0.02) | 0.24 (0.02) | 0.07 (0.02) | |
| IRAS21078+5211 | 21:09:21.64 | 52:22:37.50 | −6.06 (0.03) | 2.65 (0.04) | 0.66 (0.02) | 0.54 (0.02) | 0.28 (0.02) | 0.10 (0.02) |
| G094.60−01.80 | 21:39:58.25 | 50:14:20.90 | −44.16 (0.12) | 1.94 (0.18) | 0.19 (0.03) | 0.14 (0.03) | <0.09 | <0.05 |
| G100.38−03.58 | 22:16:10.35 | 52:21:34.70 | −38.19 (0.34) | 1.80 (0.69) | <0.09 | |||
| CepAHW2 | 22:56:17.97 | 62:01:49.50 | −11.84 (0.036) | 1.88 (0.05) | 0.68 (0.04) | 0.57 (0.04) | 0.25 (0.08) | 0.23 (0.08) |
| G108.76−00.99 | 22:58:47.24 | 58:45:01.60 | −50.64 (0.06) | 2.64 (0.08) | 0.51 (0.03) | 0.35 (0.02) | 0.14 (0.02) | <0.05 |
| IRAS23033+595 | 23:05:25.00 | 60:08:15.40 | −53.12 (0.07) | 2.79 (0.11) | 0.39 (0.03) | 0.34 (0.03) | 0.11 (0.02) | |
| NGC7538S | 23:13:44.86 | 61:26:48.10 | −56.13 (0.08) | 3.99 (0.09) | 1.60 (0.07) | 1.43 (0.07) | 0.68 (0.07) | 0.38 (0.07) |
| NGC7538IRS1 | 23:13:45.36 | 61:28:10.50 | −57.07 (0.05) | 3.70 (0.06) | 0.84 (0.03) | 0.73 (0.03) | 0.32 (0.03) | 0.25 (0.03) |
| NGC7538IRS9 | 23:14:01.67 | 61:27:19.10 | −57.08 (0.03) | 2.94 (0.04) | 0.77 (0.02) | 0.68 (0.02) | 0.26 (0.02) | 0.13 (0.02) |
| L1262 | 23:25:26.80 | 74:18:22.00 | 3.84 (0.02) | 0.38 (0.03) | 0.09 (0.01) | 0.07 (0.01) | ||
| L1512-S | 05:04:08.10 | 32:43:30.00 | 7.07 (0.01) | 0.22 (0.02) | 0.09 (0.01) | 0.08 (0.01) | ||
Note. Sources marked with bold are ones with cIMM detection.
Gaussian parameters for detected CS (J = 2 − 1) and C34S (J = 2 − 1) lines with 1σ errors.
| Source | CS lines | C34S lines | |||||||
|---|---|---|---|---|---|---|---|---|---|
| VLSR | ΔV | |$T_{\rm mb}^{*}$| | |$\int T_{\rm mb}^{*}dV$| | VLSR | ΔV | |$T_{\rm mb}^{*}$| | |$\int T_{\rm mb}^{*}dV$| | ||
| (km/s) | (km/s) | (K) | (K km/s) | (km/s) | (km/s) | (K) | (K km/s) | ||
| G018.82−00.28 | 38.28 (0.02) | 5.21 (0.06) | 2.00 | 11.07 (0.10) | 39.07 (0.12) | 5.44 (0.26) | 0.25 | 1.47 (0.06) | |
| G019.27+00.07 | 23.78 (0.03) | 4.77 (0.08) | 1.18 | 6.01 (0.08) | 24.03 (0.10) | 3.50 (0.33) | 0.21 | 0.80 (0.05) | |
| G022.35+00.41 | 50.30 (0.15) | 3.65 (0.23) | 1.25 | 4.86 (0.06) | 50.62 (0.15) | 4.56 (0.46) | 0.15 | 0.71 (0.05) | |
| 54.13 (0.20) | 2.28 (0.25) | 0.27 | 0.66 (0.05) | 57.81 (0.14) | 1.79 (0.43) | 0.13 | 0.25 (0.06) | ||
| 57.66 (0.15) | 2.64 (0.17) | 0.60 | 1.69 (0.05) | 60.48 (0.36) | 2.54 (0.67) | 0.07 | 0.19 (0.05) | ||
| 60.98 (0.23) | 3.77 (0.23) | 0.18 | 0.71 (0.06) | ||||||
| 81.53 (0.50) | 2.02 (0.50) | 0.18 | 0.38 (0.05) | ||||||
| G023.60+00.00 | 106.45 (0.08) | 5.76 (0.21) | 1.48 | 9.07 (0.27) | 104.42 (0.20) | 4.76 (0.55) | 0.20 | 1.03 (0.09) | |
| G024.33+00.11 | 112.43 (0.11) | 4.56 (0.28) | 1.08 | 5.22 (0.27) | − | − | − | − | |
| G027.94−00.47 | 45.35 (0.14) | 3.08 (0.32) | 0.73 | 2.38 (0.21) | − | − | − | − | |
| G028.37+00.07a | 79.21 (0.02) | 6.28 (0.05) | 1.44 | 9.63 (0.07) | 79.31 (0.03) | 3.12 (0.09) | 0.67 | 2.22 (0.05) | |
| G028.37+0.07d | 77.81 (0.08) | 4.45 (0.25) | 1.57 | 7.42 (0.33) | 79.31 (0.03) | 3.12 (0.09) | 0.67 | 2.22 (0.05) | |
| 83.33 (0.22) | 3.71 (0.47) | 0.56 | 2.20 (0.27) | 78.88 (0.18) | 2.12 (0.43) | 0.43 | 0.96 (0.17) | ||
| G030.57−00.23 | 87.70 (0.08) | 5.94 (0.23) | 0.64 | 4.02 (0.12) | 88.88 (0.18) | 3.06 (0.60) | 0.19 | 0.63 (0.10) | |
| G031.97+00.07 | 92.56 (0.23) | 5.48 (0.23) | 2.56 | 14.96 (0.17) | 93.56 (0.07) | 4.56 (0.17) | 0.43 | 2.09 (0.01) | |
| 96.33 (0.23) | 9.76 (0.23) | 0.60 | 6.27 (0.17) | 97.87 (0.16) | 4.69 (0.88) | 0.09 | 0.47 (0.06) | ||
| G034.43+00.24a | 57.80 (0.02) | 5.96 (0.06) | 3.87 | 24.56 (0.18) | 57.43 (0.13) | 3.76 (0.26) | 0.64 | 2.55 (0.20) | |
| G034.43+0.24c | 59.16 (0.04) | 5.88 (0.12) | 2.37 | 14.80 (0.22) | 58.92 (0.16) | 3.35 (0.57) | 0.35 | 1.25 (0.15) | |
| G034.77−00.5 | 43.86 (0.05) | 5.26 (0.12) | 1.62 | 9.08 (0.17) | 44.40 (0.18) | 3.92 (0.65) | 0.35 | 1.46 (0.16) | |
| G053.11+00.05 | 21.27 (0.01) | 3.39 (0.02) | 5.03 | 18.16 (0.08) | 21.44 (0.03) | 2.95 (0.10) | 0.54 | 1.68 (0.04) | |
| G053.25+00.0 | 23.40 (0.01) | 1.78 (0.02) | 1.62 | 3.07 (0.03) | 23.45 (0.07) | 1.45 (0.18) | 0.16 | 0.25 (0.02) | |
| G084.95−00.69 | −33.05 (0.02) | 4.89 (0.05) | 1.62 | 8.44 (0.07) | −33.06 (0.05) | 3.44 (0.15) | 0.22 | 0.81 (0.02) | |
| IRAS21078+5211 | −4.33 (0.00) | 3.15 (0.004) | 6.14 | 20.57 (0.04) | −4.24 (0.02) | 2.64 (0.04) | 0.93 | 2.60 (0.03) | |
| G094.60−01.80 | −43.97 (0.01) | 2.38 (0.03) | 1.77 | 4.49 (0.05) | −43.08 (0.16) | 4.22 (0.38) | 0.16 | 0.70 (0.05) | |
| −41.25 (0.002) | 2.56 (0.05) | 1.25 | 3.41 (0.01) | ||||||
| G100.38−03.58 | −37.33 (0.06) | 2.14 (0.14) | 0.29 | 0.66 (0.04) | −35.52 (0.38) | 4.66 (0.61) | 0.04 | 0.20 (0.03) | |
| −34.23 (0.04) | 2.14 (0.11) | 0.41 | 0.93 (0.04) | ||||||
| CepheusA HW2 | −11.79 (0.23) | 3.04 (0.23) | 4.26 | 13.80 (0.24) | −10.53 (0.03) | 3.53 (0.08) | 0.68 | 2.56 (0.05) | |
| −9.25 (0.23) | 2.86 (0.23) | 3.18 | 9.68 (0.24) | ||||||
| G108.76−00.99 | −52.11 (0.23) | 1.76 (0.23) | 0.48 | 0.90 (0.16) | −51.19 (0.14) | 2.35 (0.31) | 0.11 | 0.28 (0.03) | |
| −48.96 (0.23) | 2.51 (0.23) | 2.38 | 6.36 (0.16) | −47.74 (0.03) | 3.21 (0.06) | 0.61 | 2.07 (0.001) | ||
| −46.39 (0.23) | 2.68 (0.23) | 3.11 | 8.87 (0.16) | ||||||
| IRAS 23033+595 | −49.66 (0.004) | 3.92 (0.01) | 3.94 | 16.43 (0.04) | −49.88 (0.03) | 2.66 (0.08) | 0.51 | 1.43 (0.03) | |
| NGC 7538 S | −56.71 (0.00) | 5.37 (0.02) | 9.82 | 56.09 (0.20) | −56.23 (0.03) | 4.29 (0.08) | 1.86 | 8.52 (0.13) | |
| NGC 7538 IRS1 | −54.06 (0.01) | 5.07 (0.02) | 9.79 | 52.81 (0.18) | −54.20 (0.01) | 4.28 (0.04) | 1.41 | 6.45 (0.04) | |
| NGC 7538 IRS9 | −54.46 (0.003) | 6.13 (0.01) | 4.58 | 29.87 (0.03) | −57.13 (0.32) | 3.43 (0.61) | 0.23 | 0.83 (0.20) | |
| −45.71 (0.03) | 2.35 (0.06) | 0.46 | 1.14 (0.03) | −53.86 (0.11) | 3.39 (0.16) | 0.65 | 2.36 (0.19) | ||
| IRAS 23385+605 | −50.54 (0.04) | 1.74 (0.08) | 0.44 | 0.82 (0.04) | −50.05 (0.24) | 2.04 (0.24) | 0.10 | 0.23 (0.01) | |
| −46.28 (0.01) | 4.25 (0.04) | 1.74 | 7.89 (0.06) | −47.10 (0.24) | 1.97 (0.24) | 0.27 | 0.57 (0.01) | ||
| IRAS 23151+5912 | −51.17 (0.02) | 3.11 (0.05) | 1.43 | 4.72 (0.06) | −51.43 (0.06) | 2.45 (0.17) | 0.22 | 0.56 (0.03) | |
| L1262 | 3.94 (0.01) | 0.74 (0.03) | 0.99 | 0.78 (0.02) | 4.00 (0.02) | 0.44 (0.03) | 0.47 | 0.22 (0.01) | |
| CB4−SMM | −11.38 (0.04) | 0.21 (0.14) | 1.02 | 0.22 (0.17) | – | – | – | – | |
| L1389 | −4.70 (0.004) | 0.61 (0.01) | 1.99 | 1.29 (0.02) | −4.64 (0.02) | 0.44 (0.04) | 0.32 | 0.15 (0.01) | |
| L1439 | 5.76 (0.02) | 0.68 (0.04) | 0.62 | 0.45 (0.02) | – | – | – | – | |
| L1512-S | 7.09 (0.01) | 0.40 (0.02) | 0.96 | 0.41 (0.02) | − | – | – | – | |
Note. Symbol ‘–’ denotes that no C34S emission at 96.4 GHz was detected in a source.
APPENDIX B: NOTES ON INDIVIDUAL SOURCES
We used the online data base of astrophysical masers described in Ladeyschikov et al. (2019, 2022) to check for previous detection of other maser species including cIMM within the search radius of 83 arcsec from the observed position. The radius corresponds to the beam at 44 GHz. The data base is constantly being updated and allows identifying already known maser species in the vicinity of an observed position. Names of the sources detected at 44 GHz for the first time are marked in bold, and newly discovered cIMM are indicated with an asterisk after the name of the source. IR signatures associated with sources are indicated in column 11 in Table A1. We also indicated cIMMs at frequencies other than 44 GHz, H2O masers, cIIMMs, and OH masers in columns 12–15 in Table A1.
G018.82−00.28 . The 44-GHz methanol profile consists of at least two lines with flux density of 3.5 Jy and width of ∼3.5 and 1 km s−1. However, it is hard to identify whether the line at 3.5 km s−1 is thermal or it is a blend of a number of narrow maser lines. We assume that some spectral features might be class I methanol maser lines, but further investigation is required. This molecular core exhibits a point source at 24 μm, but does not contain extended 4.5 μm emission thus it is classified as an intermediate core in Chambers et al. (2009). Also, cIMM at 25 GHz was found in this core in Chambers et al. (2009). The source is not detected at 95 GHz at the level of 1.2 Jy (Yang et al. 2017a). The source also hosts H2O masers (Walsh et al. 2011), OH maser (Beuther et al. 2019), and cIIMM at 6.7 GHz (Hu et al. 2016).
G019.27+00.07 . Two cIMM spectral features of ∼5 and 6 Jy at 23 and 27.5 km s−1 are reported. The source was previously found to exhibit class I methanol emission at 95 GHz in Yang et al. (2017a). Chambers et al. (2009) report a presence of cIMM at 25 GHz in this molecular core. This core contains a point source at 24 μm and no extended 4.5 μm emission, so that we refer to it as an intermediate core. There is also bright emission at 3.6 μm and thus this core is classified as a ‘blue’ core in Chambers et al. (2009); however, this emission might indicate a foreground star. The source also hosts an H2O maser (Wang et al. 2006). No observations of OH masers and cIIMM have been performed towards this source to date.
G022.35+00.41 . The cIMM emission is detected in the source with peak flux density of 2.8 Jy at 54 km s−1. Previously, cIMM in this source was detected at 25 GHz in Chambers et al. (2009) and at 95 GHz in Yang et al. (2017a). Chambers et al. (2009) consider this line at 25 GHz as a thermal line. H2O maser was found towards G022.35+00.41 in (Svoboda et al. 2016), other maser species have not been observed to date. Chambers et al. (2009) classify this core as ‘active’ due to presence both a point source at 24 μm and a ‘green fuzzy’ at 4.5 μm.
G023.60+0.00 . Two spectral features separated by 1.4 km s−1 are identified, the brighter feature has a peak flux density of ∼5 Jy at ∼107 km s−1. This source was also detected at 25 GHz in Chambers et al. (2009) and at 95 GHz in Yang et al. (2017a). No other maser species have been found in the source to date. Chambers et al. (2009) classify this molecular core as ‘active’ due to the presence both a point source at 24 μm and a ‘green fuzzy’ at 4.5 μm.
G024.33+00.11 . The spectral profile of this source has three peaks, the brightest one has flux density of ∼50 Jy at 114 km s−1. cIMM was previously detected at 25 GHz (Chambers et al. 2009) and at 95 GHz (Yang et al. 2017a). It also hosts H2O, class II CH3OH, and OH masers (Walsh et al. 2011; Chen et al. 2011; Qiao et al. 2014). This molecular core exhibits a 24 μm point source and bright 8.0 μm emission, so that it is classified as a ‘red’ core in Chambers et al. (2009); and it is noted that the ‘red’ core might be an H ii region, ionized by an OB star forming within the particular IRDC. Though it might be the chance coincidence of H ii region and core, because IRDCs are located in the crowded Galactic plane. No extended 4.5 μm emission is associated with this core (Chambers et al. 2009).
G024.60+00.08 . Emission with a peak flux density of ∼6 Jy at 51 km s−1 is detected in this source. cIMM was also found at 25 GHz (Chambers et al. 2009) and at 95 GHz (Yang et al. 2017a). The source also hosts a faint H2O maser (Cyganowski et al. 2013) and class II CH3OH masers (Yang et al. 2019). OH masers have not been observed towards this region to date. Following Chambers et al. (2009), we refer to this molecular core as ‘intermediate’, because it is associated with extended 4.5 μm emission, but no other IR signatures exist in the core.
G028.37+0.07. We targeted 3 positions in this region (see Table A2). At the first position, indicated as G028.37+0.07a, we detected emission of two close features with flux density of ∼5.4 and ∼5.8 Jy at 82 km s−1. Previously, cIMM at 44 GHz was detected in (Kim et al. 2018); there are also two close spectral lines of 5.5 and 6.8 Jy at 81.5 km s−1, which is quite consistent with our results. cIMM at 25 and 95 GHz were found towards this source in (Chambers et al. 2009; Yang et al. 2017a). H2O maser is not detected at the level of 0.04 Jy (Svoboda et al. 2016), and cIIMM is not found at the level of 0.6 Jy (Szymczak, Hrynek & Kus 2000). OH masers have not been observed towards this position to date. This molecular core exhibits a point source at 24 μm and bright 8.0 μm emission; Chambers et al. (2009) classify this core as ‘red’.
At the second position G028.37+0.07b, separated from the first one by 4 arcmin, we detected several bright spectral lines. The brightest two lines with fluxes of 55 and 57 Jy are separated by 0.5 km s−1 and located at velocity ∼77 km s−1. Another bright line at 79.8 km s−1 has a flux of 29.6 Jy. This source was detected at 44 GHz previously in Kang et al. (2016), two spectral lines with fluxes of 61 Jy at 76.4 km s−1 and 49 Jy at 79.4 km s−1 were reported. These results are consistent with ours; however, we identify two different lines at 77 km s−1, while Kang et al. (2016) report only one spectral component at 76.4 km s−1. Different masers are found in this source: cIMM at 25 GHz (Chambers et al. 2009) and at 95 GHz (Yang et al. 2017a), H2O masers (Svoboda et al. 2016), cIIMM at 6.6 GHz (Hu et al. 2016), and OH masers (Beuther et al. 2019). This molecular core is classified as an ‘active’ core in Chambers et al. (2009) due to the presence both an extended ‘green fuzzy’ at 4.5 μm and a point source at 24 μm.
The third core G028.37+0.07c is located at 2.5 arcmin from the second core and at 4 arcmin from the first one. We identify several spectral features, with the brightest one of 8.2 Jy at 79.7 km s−1. This source was previously detected at 25 GHz in Chambers et al. (2009) and at 95 GHz in Yang et al. (2017a). An H2O maser associated with this molecular core is reported in (Svoboda et al. 2016). No cIMM and OH masers have been observed to date. Chambers et al. (2009) assign this molecular core as ‘active’, because both the extended 4.5 μm emission and a 24 μm point source are found towards this core.
G027.94−00.47 . The cIMM in this source is found with a peak flux density of 20 Jy at 46 km s−1. The source was previously detected at 25 GHz (Chambers et al. 2009) and at 95 GHz (Yang et al. 2017a). It also hosts an H2O maser (Cyganowski et al. 2013). cIIMM and OH masers have not been observed towards this source to date. Chambers et al. (2009) classifies this core as ‘red’ due to the presence of bright 8.0 μm emission. The core exhibits a 24 μm point source as well.
G028.28−00.34. The source has a single peak of 6.7 Jy at 48.6 km s−1. Previously, Kim, Kim & Kim (2019) detected the flux of 5.3 Jy at 48.3 km s−1 at 44 GHz. The source was detected at 25 GHz in Chambers et al. (2009), but no detection is at 95 GHz at the level of 0.48 Jy (Chen et al. 2011). The existence of H2O maser is reported in Chambers et al. (2009). However, in several other observations no H2O masers have been found in this source to date at a level of 0.25 Jy (for example, Kim et al. 2019, see also Ladeyschikov et al. 2019). The source hosts cIIMM (Breen et al. 2016; Hu et al. 2016) and OH maser (Beuther et al. 2019). Chambers et al. (2009) classify this core as ‘active’ due to the presence of both a point source at 24 μm and a ‘green fuzzy’ at 4.5 μm. This molecular core is also associated with an EGO from the catalogue of Cyganowski et al. (2009b).
G030.57−00.23 . The 44 GHz spectral profile has 4 spectral lines of 3–4 Jy within the interval of velocities 88.8–91.0 km s−1. The cIMM emission at 25 GHz was detected in Chambers et al. (2009). Yang et al. (2017a) observed this source at 95 GHz, but no emission was found at the level of 1.0 Jy. The 6.7 GHz class II maser emission was detected in this source in Yang et al. (2019). No other maser species have been observed to date. Following Chambers et al. (2009), we classify this molecular core as ‘intermediate’ due to the presence of only extended 4.5 μm emission, but no other IR signatures.
G031.97+00.07. Detection of cIMM line with a flux of 10.7 Jy at 95.7 km s−1 is reported. The source was detected previously at 44 GHz (Kim et al. 2018), there are two spectral features with flux of 12.0 and 17 Jy at 95.3 km s−1. The source was also detected at 95 GHz in Yang et al. (2017a). It also exhibits an H2O maser (Urquhart et al. 2011), OH maser (Beuther et al. 2019), and cIIMM masers (Yang et al. 2019). This molecular core is an ‘active’ core, because it contains both 4.5 and 24 μm emission (Chambers et al. 2009).
G034.43+0.24. We targeted five positions in this region. Three positions, assigned as a, b, c, are molecular cores from Chambers et al. (2009) and other two positions, assigned as e and f, are cores with signatures of shocked gas as seen from CO shock tracing observations Pon et al. (2016) and are considered as prestellar cores. The cores a and b are turned to be separated by 46.3 arcsec, so they likely fall into the same beam pattern, and below we comment both cores together.
In the core G034.43+0.24a, at least 5 methanol emission features of 6 to 17 Jy are detected within a velocity range from 57 to 60.5 km s−1. In the core G034.43+0.24b, we identify 4 maser lines of 18–47 Jy within velocity range 58–60.5 km s−1. The previous detection of cIMM at 44 GHz towards the position close to these sources was found by Fontani et al. (2010), they reported a flux of 7 Jy at 60.3 km s−1. Interferometric observations at the VLA of the same position were performed by Gómez-Ruiz et al. (2016), and 10 features with fluxes of 0.4 to 21.2 Jy were identified within the velocity range 54.9–60.2 km s−1. Both methanol thermal and maser emission at 25 GHz are detected in the cores in Chambers et al. (2009). There are detections of 95 GHz emission found in Chen et al. (2011) and Yang et al. (2017a). Both cores are associated with H2O maser (Urquhart et al. 2011), class II methanol maser (Fontani et al. 2010; Yang et al. 2019), and OH maser (Qiao et al. 2014). The core a is ‘active’, because it exhibits a ‘green fuzzy’ at 4.5 μm and a point source at 24 μm. The core b is referred to as ‘red’ since it contains 8.0 μ and 24 μm emission (Chambers et al. 2009). Both cores are associated with an EGO from the catalogue provided by Cyganowski et al. (2008).
In the core G034.43+0.24c, a cIMM with a peak flux density of ∼60 Jy at 59.6 km s−1 is detected. The source was previously detected at 25 GHz (Chambers et al. 2009) and at 95 GHz (Yang et al. 2017a). It hosts a faint H2O maser (Wang et al. 2006). No cIIMMs have been detected in this source at the level of 9 mJy (Olmi et al. 2014), hinting at an earlier evolutionary stage of this core than the state of cores G034.43+0.24a and G034.43+0.24b. No OH masers have been observed towards this source to date. This molecular core is classified as an ‘active’ core due to the presence of both 4.5 μm extended emission and a 24 μm point source (Chambers et al. 2009).
The fourth core G034.43+0.24e was included in our sample as core with signatures of shocked gas from CO shock tracing observations (Pon et al. 2016), but it turned to be separated from the core G034.43+0.24a by 49 arcsec. Thus, they likely fell into the same beam pattern. We detected cIMM with flux density of 3.5–5.5 Jy in the velocity range 57–60 km s−1, and the spectrum of the core e is rather a replica of the spectrum of the core a. No emission at 95 GHz is detected at the level of 1.5 Jy at the angular separation of ∼80 arcsec from our pointing position (Yang et al. 2017a). The source exhibits an H2O maser (Wang et al. 2006). No observations of cIIMM and OH masers have been performed towards this source to date. This molecular core is associated with extended 4.5 μm emission and a 24 μm point source (Chambers et al. 2009), thus, it can be considered as an ‘active’ core.
A cIMM in the fifth core G034.43+0.24f* is discovered at 44 GHz with a peak flux density of 2.6 Jy at VLSR = 59.3 km s−1. No emission at 95 GHz is found at the level of 1.6 Jy (Yang et al. 2017a). No H2O maser is detected towards this source at the level of 0.1 Jy (Wang et al. 2006). Other maser species have not been observed in the source to date. This molecular core is associated with a 24 μm point source (Chambers et al. 2009) and is classified as an ‘intermediate’ core.
G053.11+00.05. A detection of cIMM with the flux of 14.5 Jy at 22.2 km s−1 is reported. The source was previously detected at 44 GHz in Kim et al. (2018), two lines with fluxes of 1.6 and 19.9 Jy at 22 km s−1 were reported. Thermal methanol emission at 25 GHz was found in this molecular core in (Chambers et al. 2009). The source is also detected at 95 GHz (Kim et al. 2018; Yang et al. 2017a). It exhibits an H2O maser (Urquhart et al. 2011), cIIMM masers (Yang et al. 2019), and OH maser (Beuther et al. 2019). This core contains 8.0 and 24 μm emission and, thus, is a ‘red’ core (Chambers et al. 2009).
G084.95–00.69* . A cIMM in this source has been discovered with a peak flux density of 2.5 Jy at VLSR = −35 km s−1. It was not detected at 95 GHz at the level of 1.1 Jy in Yang et al. (2017a). An H2O maser in this source was found in Urquhart et al. (2011), and a cIIMM was recently detected in 6.7 GHz Methanol Maser Survey performed towards a sample of young stellar objects selected as WISE point sources (Yang et al. 2019). No observations of OH masers have been conducted towards the source to date. This is an IR-bright source as classified in Beuther et al. (2018).
IRAS 21078+5211* . The discovered cIMM has a peak flux density of 6 Jy at VLSR = −6.7 km s−1. There is an H2O maser (Palla et al. 1991; Sunada et al. 2007) at the angular separation of ∼74 arcsec from the pointing coordinates used in this work. An interferometric search for the 44 GHz class I methanol maser towards this H2O maser has been performed with the VLA by Gómez-Ruiz et al. (2016), but no cIMM is detected. Also, a number of class II methanol maser searchers have been performed, and no cIIMM is found in this source (see for example, the recent survey of Yang et al. 2017b). OH masers have not been observed in the source. The source is classified as IR-quite (Beuther et al. 2018).
G108.76−00.99* . A cIMM with a peak flux density of 1.2 Jy at VLSR = −50 km s−1 is discovered. The source hosts an H2O maser (Urquhart et al. 2011) and a cIIMM (Yang et al. 2019). OH masers have not been observed to date. The source is IR-bright (Beuther et al. 2018).
CepA HW2. The spectrum of this source contains a single narrow peak of 8 Jy and a wide thermal line of 0.9 Jy at −12.8 and −11.0 km s−1, respectively. In the previous observations at 44 GHz, the peak flux was 6.1 Jy at 13.1 km s−1 (Kim et al. 2018) and 8.2 Jy at 13.1 km s−1 (Kim et al. 2019). The cIMM emission at 95 GHz was also found in Kim et al. (2018). This star-forming region is hosting numerous H2O masers extensively observed at 22 GHz both with single-dish (see for example, Furuya et al. 2003) and interferometric facilities including RadioAstron (Sobolev et al. 2018). The HW2 source in the complex Cepheus A is associated with an outflow jet (Curiel et al. 2006) traced by class II methanol masers at 12 GHz (Moscadelli et al. 2009). OH masers also exist in this region (Qiao et al. 2014). The source is IR-quite according (Beuther et al. 2018).
IRAS 23033+595. There are two cIMM lines in the spectrum, the first line has a peak flux of ∼20 Jy at VLSR = −54.2 km s−1 and the second one is 1.9 Jy at −52.7 km s−1. This cIMM was discovered at 44 GHz in Litovchenko et al. (2011), the two reported spectral features have fluxes of 14.0 Jy at −54.1 km s−1 and 1.9 Jy at −52.6 km s−1. Interferometric observations of this source were performed with the VLA in (Rodríguez-Garza et al. 2017), two maser components were detected: 17.8 Jy at −54.4 km s−1 and 2.1 Jy at −52.9 km s−1. This source was also observed in Kim et al. (2018), there are two features of 25.7 Jy at −54.4 km s−1 and 13.7 Jy at −54.6 km s−1. The source is also detected at 95 GHz (Kim et al. 2018). It hosts H2O masers (Urquhart et al. 2011; Kim et al. 2018). Class II methanol masers have not been detected in this source in a number of observations at the level of 0.6 Jy (see Ladeyschikov et al. 2019). OH masers in the source have not been observed yet. This source is IR-quite (Beuther et al. 2018).
NGC7538. We targeted three positions in this high-mass star-forming region: NGC7538 S, IRS 1, and IRS 9. The brightest two peaks detected towards NGC7538 S are ∼27.7 and ∼26.3 Jy at −57.0 and −53.0 km s−1, respectively. NGC7538 IRS1 is separated from NGC7538 S by 83 arcsec and has the brightest peak of 28.2 Jy at −57 km s−1. The third source NGC7538 IRS9 is located at 2 arcmin from the other two and shows emission with flux of 11.2 Jy at −57.3 km s−1. All three sources are centres of young clusters and exhibit different masers. Both NGC7538S and NGC7538 IRS1 have been extensively observed at different cIMM frequencies and have detections at almost all of them (the full list of observations can be found in maser data base by Ladeyschikov et al. 2019). Particularly, the recent observations at 44 GHz show peaks of 12.4 Jy at −57.3 km s−1 and 16.0 Jy at −53.4 km s−1 (Yang et al. 2020). A cIMM at other frequencies is also detected (see for example, Val’tts et al. 1995; Kim et al. 2018). There are several H2O masers (Urquhart et al. 2011; Kim et al. 2018), cIIMM (Hu et al. 2016), and OH masers (Qiao et al. 2014). In NGC7538 IRS9, there are a cIMM at 95 GHz (Kim et al. 2018), an H2O maser (Urquhart et al. 2011), a cIIMM (Yang et al. 2019), but no OH maser has been observed yet. NGC7538S is IR-quiet, and IRS1 and IRS9 are IR-bright sources according to Beuther et al. (2018).
IRAS 23151+5912. There are two spectral components of almost the same peak flux density of 4.9 and 3.8 Jy at −54.4 and −52.4 km s−1. This source was discovered as a cIMM at 44 GHz in Litovchenko et al. (2011) with peak fluxes of 2.0 and 3.9 at velocities −54.3 and −52.3 km s−1, respectively. Further, it was observed in several surveys both at 44 and 95 GHz (see for example, Rodríguez-Garza et al. 2017; Yang et al. 2020). H2O masers are also present in the source. No cIIMM has been detected at the level of 0.6 Jy (Szymczak et al. 2000) and no OH masers have been detected down to the level of 0.3 Jy (te Lintel Hekkert 1991). The source is classified as IR-bright (Beuther et al. 2018).
IRAS 23385+605. A cIMM with a peak flux of 2 Jy at −50 km s−1 is detected. The 44 GHz flux of 0.9 Jy at −50.6 km s−1 is reported in Fontani et al. (2010). The source was also studied at 44 GHz in a VLA survey of high-mass star-forming regions (Kurtz, Hofner & Álvarez 2004b). It exhibits a number of H2O masers (Palla et al. 1991). The cIIMM has not been found in the source down to 0.7 Jy (Szymczak et al. 2000) and no OH masers have been detected to date. The source is IR-quite (Beuther et al. 2018).
