


ABSTRACT
We present a framework to build realistic mock spectroscopic observations for state-of-the-art hydrodynamical simulations, using high spectral resolution stellar population models and full radiative transfer treatment with skirt. As a first application, we generate stellar continuum mock observations for the Auriga cosmological zoom simulations emulating integral-field observations from the Sydney–AOO Multi-object Integral Field Spectrograph (SAMI) Galaxy Survey. We perform spectral fitting on our synthetic cubes and compute the resulting rotation velocity (Vrot) and velocity dispersion within 1Re (σe) for a subset of the Auriga sample. We find that the kinematics produced by Auriga are in good agreement with the observations from the SAMI galaxy survey after taking into account the effects of dust and the systematics produced by the observation limitations. We also explore the effects of seeing convolution, inclination, and attenuation on the line-of-sight velocity distribution. For highly inclined galaxies, these effects can lead to an artificial decrease in the measured V/σ by nearly a factor of two (after inclination correction). We also demonstrate the utility of our method for high-redshift galaxies by emulating spatially resolved continuum spectra from the Large Early Galaxy Census (LEGA-C) survey and, looking forward, the European Extremely Large Telescope (E-ELT) High Angular Resolution Monolithic Optical and Near-infrared Integral field spectrograph (HARMONI). Our framework represents a crucial link between the ground truth for stellar populations and kinematics in simulations and the observed stellar continuum observations at low and high redshift.
1 INTRODUCTION
Spatially resolved spectroscopy has become a fundamental tool for understanding the formation and evolution of galaxies. The continuum and its absorption features allow us to probe stellar population properties, such as ages and metallicities, but also their morphologies through their kinematics. By looking at the spatially resolved kinematics of galaxies, we can learn about their assembly histories, as the different mechanisms that drive growth in galaxies leave an imprint on their stellar and gas distributions.
Early works using integral field spectroscopy (IFS) surveys to observe stellar kinematics, such as Emsellem et al. (2004), using the Spectroscopic Areal Unit for Research on Optical Nebulae (SAURON: Bacon et al. 2001) instrument and later ATLAS3D(Cappellari et al. 2011), started to uncover formerly hidden structures in the two-dimensional stellar distribution of some systems. Systems previously thought of as smooth and structureless from their light distributions, such as early-type galaxies (ETG), showed a rotational component when looking at the kinematics (Cappellari et al. 2007; Emsellem et al. 2007). Several other irregular and complex structures were also revealed, increasing the number of kinematic classes and adding more complexity to the picture of galaxy evolution.
More recently a new generation of IFS surveys, such as Calar Alto Legacy Integral-Field Area (CALIFA: Sánchez et al. 2016), Mapping Nearby Galaxies at Apache Point (MaNGA: Bundy et al. 2015), and the Sydney–AOO Multi-object Integral field spectrograph (SAMI) galaxy survey (Bryant et al. 2015), have been finding exciting new results associating these structures with other physical properties. Links between the morphological, kinematical, and star-formation states of galaxies have been observed (Barrera-Ballesteros et al. 2015; Cortese et al. 2016; van de Sande et al. 2017b; Graham et al. 2018; Fraser-McKelvie et al. 2021), helping to disentangle the connections between mass growth and its internal and external drivers.
However, these observations are affected by the angular resolution limitations set by the atmospheric conditions. Due to beam smearing, the kinematic distribution gets blended, leading to under- and overestimation of the line-of-sight velocity and velocity dispersion, respectively. As the inner profile is generally steeper than the outskirts, the difference in apertures in observations can lead to biases in the observed trends (van de Sande et al. 2017a; Graham et al. 2018; Harborne et al. 2020b). These issues become more dire at high redshift, as a consequence of the smaller apparent sizes of the targets.
Most studies of the stellar continuum target present-day galaxies (at z ≲ 0.1), as obtaining high signal-to-noise ratio (S/N) observations of this kind at high z requires long integration times. Nonetheless, the Large Early Galaxy Census survey (LEGA-C: van der Wel et al. 2016) exploited the capabilities of the Very Large Telescope (VLT) VIsible Multi-Object Spectrograph (VIMOS) to observe the stellar continuum of ∼ 4000 galaxies at z ∼ 1 in the COSMOS field for the first time. Using these data, Bezanson et al. (2018) studied the dynamical state of a sample of quiescent galaxies and compared them with their local counterparts from the CALIFA survey, finding evolution in the rotational support. However, the distances to these galaxies and the ground-based nature of the observations result in angular resolutions similar to the sizes of the sources. This poses a challenge for the measurement of kinematics, especially in the central regions of galaxies.
The recently launched JWST and potential future large ground-based telescopes such as ESO’s Extremely Large Telescope (ELT), the Giant Magellan Telescope (GMT) in Chile, and the Thirty Meter Telescope (TMT) in Hawaii, will allow for the exploration of galaxy populations at an even earlier cosmic epoch (z > 2) and unprecedented spatial resolution. In order to account for the effects of seeing and inclination beyond the present-day Universe, we must rely on dynamical models (van Houdt et al. 2021), but for galaxies with high star-formation rates and large dust columns, as well as galaxies with irregular morphologies, the commonly made underlying assumptions in such models (e.g. mass follows light) are no longer valid.
Cosmological hydrodynamical simulations then play a key role in interpreting the observations of galaxies across cosmic time. These simulations come in two flavours. On one hand, large-volume simulations produce large samples of galaxies at the cost of limited spatial resolution, while zoom-in simulations focus on recreating individual galaxies and smaller-scale processes (Vogelsberger et al. 2020).
A new generation of cosmological simulations, of both large-volume and zoom-in kinds, such as the Auriga Project (Grand et al. 2017), FIRE-2 (Feedback In Realistic Environments, Hopkins et al. 2018) (zoom-in), IllustrisTNG (Naiman et al. 2018; Nelson et al. 2018; Pillepich et al. 2018), ARTEMIS (Assembly of high-ResoluTion Eagle-simulations of MIlky Way-type galaxieS, Font et al. 2020), and NewHorizon (Dubois et al. 2021) (large-volume), generate galaxies with resolutions that permit the computation of spatially resolved quantities while also providing large enough samples to allow for statistical comparisons with the observed surveys.
Although the spatial resolution has increased substantially, these simulations still rely on subgrid recipes to implement many of the feedback mechanisms that act on much smaller scales but control the star-formation process, illustrating the need for observations to test and constrain the models. In order for this feedback loop to function, we need a tool to compare simulations and observations (that creates realistic mock observations of the stellar continuum spectrum), accounting for limitations in spatial and spectral resolution, projection effects, and attenuation (seen/found/expected in observations).
There are many methods to create mock observations, from simple, flexible, and computationally cheap to complex and expensive. Among the simpler methods is the projection and binning of particle data to obtain line-of-sight velocity distribution (LOSVD) mass-weighted moment maps directly. Complexity can be added to this method by assigning single stellar populations to each particle and light-weighting the resulting maps or using a convolution kernel to mimic seeing effects. This approach was used by Tescari et al. (2018) to generate synthetic gas rotation velocity and velocity dispersion maps of Evolution and Assembly of GaLaxies and their Environments (EAGLE) galaxies and make comparisons with SAMI galaxy survey data. Another example of a similar procedure is presented in Harborne, Power & Robotham (2020a): their software, simspin, was used to generate mock observations of various types of galaxies at multiple spatial resolutions to compute corrections for the offsets produced in λR and V/σ measurements due to seeing limitations. Recently, Bottrell & Hani (2022) introduced RealSim-IFS, a tool that uses this method to generate IFS-like observations from simulated data, and applied it to 893 galaxies from the TNG50 simulation to generate MaNGA-like kinematics.
More complex methods involve the generation of IFS-like spectra from which kinematic properties can be retrieved using the same tools and models applied to observed data. Guidi et al. (2018) introduced a method to generate mock spectra and applied it to three galaxies emulating the CALIFA survey setup, including stellar and nebular emission with kinematic broadening. Ibarra-Medel et al. (2019) produced MaNGA-like spectra for two simulated galaxies and explored the effects that inclination, resolution, signal-to-noise ratio, and attenuation have on the recovered stellar mass and age radial profiles. More recently, Nanni et al. (2022) presented imanga, a method to generate mock MaNGA spectroscopic observations including all the systematics found in the survey data. Using galaxies from the TNG50 simulation, they generated a catalogue of 1000 MaNGA mock spectra from which they measured ages, metallicities, and kinematics using spectral modelling (Nanni et al. 2023), reporting consistency within 1σ between the intrinsic galaxy properties and those derived through their method. Using the same simulation, Sarmiento et al. (2023) present MaNGIA (Mapping Nearby Galaxies with Illustris-TNG Astrophysics), a catalogue of mock observations matching the MaNGA survey instrumentals and target selection, designed to study the star-formation history, age, metallicity, mass, and kinematics of these galaxies.
Even though many of the studies mentioned strive to replicate the observational conditions of their targeted surveys, most of them tend to overlook the impact of interstellar dust on the radiation emitted by the stars (Bottrell & Hani 2022) or often apply simple, general recipes to reproduce it (Ibarra-Medel et al. 2019; Sarmiento et al. 2023). Stellar light can be absorbed or scattered by dust grains in the interstellar medium and these events affect as much as 30–50 per cent of the light emitted in the Universe (Viaene et al. 2016). This processing can result in the distortion of optical images and the structural and morphological parameters derived from them (e.g. Möllenhoff, Popescu & Tuffs 2006; Gadotti, Baes & Falony 2010; Pastrav et al. 2013a,b; de Graaff et al. 2022). In Baes et al. (2003), the authors showed how the introduction of dust modified the shape of the rotation curves of disc galaxy models as well as their dispersion profiles. These discrepancies increase with increasing inclination of the disc and optical depth, so it is expected that at high redshift (z ≳ 1), where star-forming galaxies are gas-rich and dusty, these effects would be exacerbated. In addition, due to limited spatial resolution, it will be impossible to reconstruct the intrinsic stellar mass and dust distribution from the observations alone. Out of the studies listed, only Guidi et al. (2018) and Nanni et al. (2022) use some form of radiative transfer in the generation of their mocks, but their methodologies consider attenuation effects on the resulting fluxes and disregard the effect of the interaction between photons and dust particles on the Doppler shift, which would lead to changes in the observed kinematics. Nevin et al. (2021), on the other hand, use the code sunrise (Jonsson 2006; Jonsson, Groves & Cox 2010) to incorporate radiative transfer in their mock MaNGA spectroscopy. Despite not being the primary focus of their study, they note how dust attenuation and scattering perturb the 2D kinematic distribution of their simulated galaxies, highlighting the need for a proper dust treatment in the production of mock spectroscopy.
We address this issue by creating a framework for producing synthetic spatially resolved spectra from cosmological simulations using radiative transfer to simulate the effects of the interestellar medium (ISM). In this work we make use of the 3D Monte Carlo radiative transfer code skirt (Camps & Baes 2020), which in its latest version allows for the inclusion of velocity information in the radiative transfer process and therefore produces spectra including these signatures. The code has been used previously to generate synthetic observations of hydrodynamical simulations, including studies based on integrated fluxes (Camps et al. 2016; 2018; Trayford et al. 2017; Baes et al. 2020; Katsianis et al. 2020; Trčka et al. 2020, 2022; Vijayan et al. 2022) to study luminosity functions and other physical properties derived from multiwavelength photometry and also spatially resolved imaging (Rodriguez-Gomez et al. 2019; Bignone et al. 2020; Kapoor et al. 2021; Whitney et al. 2021; Camps et al. 2022; Guzmán-Ortega et al. 2023) to look at the morphology and size of the simulated galaxies.
We use our methodology to produce synthetic observations imitating the specifications of the SAMI galaxy survey, using as input the simulated galaxies from the Auriga Project. We illustrate the capabilities of our framework by describing discrepancies in the recovered absorption-line features and kinematics when the effects of limited seeing conditions, spatial resolutions, and attenuation are accounted for. We use these derived kinematics to compare with observed scaling relations obtained using the SAMI galaxy survey data and explore the sources of bias in the relations. We also test our method at higher z, by mocking the LEGA-C survey at z ∼ 1 and future observations with the European Extremely Large Telescope (E-ELT), and assess the dominant sources of bias in the recovered rotational support for each of these observational setups.
In Section 2, we give a general description of the Auriga Project and the properties of the galaxies used in this work. In Section 3.1, we give some background on the radiative transfer code skirt and the specific configuration and parameters used to produce our synthetic spectra. Further information about the addition of instrumental effects to reproduce the observations in the SAMI galaxy survey is provided in Section 4. Analysis of the mock spectroscopy kinematics and comparison with the observational sample it emulates are shown in Section 4.6 and in Section 4.7 we explore further the sources of bias in the global kinematics produced by our methodology. Section 5 contains the higher z test for LEGA-C and High Angular Resolution Monolithic Optical and Near-infrared Integral field spectrograph (HARMONI) spectroscopy and its analysis and, lastly, in Section 6 we summarize our findings and give an overview of the capabilities of our method and possible applications.
2 THE AURIGA SIMULATION
As the input model for our synthetic observations we used the galaxies from the Auriga Project (Grand et al. 2017), a suite of 30 cosmological magnetohydrodynamical zoom simulations of Milky Way sized galaxies, simulated in a cosmological environment. The simulations were performed using the moving-mesh code arepo (Springel 2010) and following a Λ Cold Dark Matter (ΛCDM) cosmology with parameters h = 0.693, Ωm = 0.307, Ωb = 0.048, and ΩΛ = 0.693 (Planck Collaboration XVI 2013). The simulations were run at different resolution levels, with level 4 being the ‘standard’ version and the one we used for this work. At this level the typical mass resolutions for the high-resolution dark matter and baryonic particles are |$\sim 3\times 10^5 \, {{\rm M}_{\odot }}$| and |$\sim 5\times 10^4 \, {{\rm M}_{\odot }}$|, respectively. The gravitational softening length for dark matter and star particles evolves with the scalefactor, reaching a maximum value of 369 pc at z = 1, after which it remains constant. For gas cells, the softening length is scaled by the mean radius of the cell, and can range from 369 pc to 1.85 kpc, from z = 1 to z = 0. The galaxy formation model implemented in these simulations follows the evolution of the different components in the halo, including prescriptions for the ISM evolution and subsequent star formation, which occurs stochastically and following a Chabrier (2003) initial mass function (IMF). It also includes stellar and chemical evolution, stellar and active galactic nucleus (AGN) feedback, and the seeding and evolution of magnetic fields.
This comprehensive physical model coupled with the high resolution of the baryonic particles makes Auriga a very well-suited sample of simulated galaxies to explore the resolved physical properties, such as the kinematics.
Since the aim of the Auriga project was to simulate Milky Way like galaxies, the sample at z = 0 has the properties of typical late-type discs, with masses ranging between 1010 and |$10^{11}\, \rm {M_{\odot }}$| and mostly subdominant bulge components, as illustrated in Fig. 1, where only |$\sim 17~{{\ \rm per\ cent}}$| (5) of the galaxies show disc-to-total mass ratio values of D/T < =0.4.
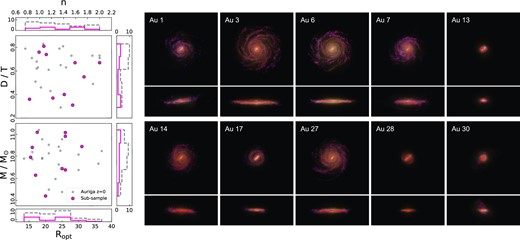
Left: physical properties of the galaxies in the Auriga sample at z = 0 (grey). Stellar masses, optical radii, disc-to-total mass ratios, and Sersic indexes of the bulges were taken from table 1 in Grand et al. (2017). Pink dots indicate the subsample of galaxies used to generate the z = 0 SAMI-like synthetic observations used in this study. Right: face-on and edge-on synthetic RGB image cutouts of the 10 galaxies selected at z = 0 for this study. The post-processed images were generated by Kapoor et al. (2021) and use a combination of SDSS-u, -g, -r, and -z for the optical channel, GALEX-FUV for the blue, and SPIRE-250-|$\mu$|m for the red channel.
3 POST-PROCESSING SCHEME WITH skirt
3.1 The skirt radiative transfer code
To generate the synthetic spectroscopic observations for this study, we use the public 3D radiative transfer code skirt (Baes et al. 2011; Camps & Baes 2015).1 This code uses the Monte Carlo technique to simulate the physical processes that radiation experiences while propagating through dusty media, including scattering, absorption, and thermal emission by dust.
We use the most recent version of the code, skirt 9 (Camps & Baes 2020), in which kinematic effects owing to both the motion of the sources and the media can be included as an option in the simulations. This is implemented by storing the wavelength of each photon packet during the simulation and its changes due to Doppler shifts induced by the emitting sources and interactions with the medium (re-emission and scattering by dust). This key feature provides us with a tool to derive the kinematic properties of the simulated galaxies, taking into account the effects of dust.
In essence, skirt has three components: sources of radiation, e.g. stars, star-forming regions, AGN, etc.; the media they propagate through, in our case interstellar dust; and the instruments that record the radiation reaching a specific viewpoint. The code samples photon packets from the spatial and spectral distribution of the radiation sources and follows their paths between the source and the instruments, simulating interactions with the media through a Monte Carlo simulation.
The code features multiple built-in 3D geometries for radiation sources and media (Baes & Camps 2015) in addition to mechanisms for importing models generated by hydrodynamical simulations from particle- or grid-based representations. For particle-based imported sources, such as the stars in the Auriga simulations, the spectral distribution is selected from SED templates. skirt provides a library of templates ready to be used and also the choice of importing custom libraries.
Different detector types permit the recording of fluxes in the spatial and spectral dimensions assuming a specific orientation of the source in the sky and a distance. In this work we use skirt to generate IFS data cubes with the Auriga galaxies as our input models. We follow a procedure similar to the one described in Kapoor et al. (2021) where, as illustrated in Fig. 2, particle data are extracted from a simulation snapshot as input for a skirt run, which results in a simulated data cube that contains recorded fluxes. The main difference lies in the type of detector and wavelength range chosen for the output. In their work, the radiative transfer simulations generated photometry and images for various filters, while in this work we store spectra at each pixel in our field of view (FOV). In the following sections we present a general description of the data extraction and simulation configuration, along with the main changes in the simulation configuration with respect to Kapoor et al. (2021). For a more in depth discussion about the choice of model parameters, see Kapoor et al. (2021).
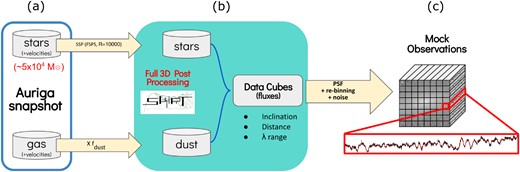
Scheme of the methodology used to create the synthetic observations. (a) Stellar particles and gas cell positions and velocities are taken from a particular snapshot in the Auriga output, along with information relevant for the models used (i.e. age, metallicity, density, etc.). (b) Using skirt, a Monte Carlo simulation is performed where each particle is assigned a SSP from FSPS (C. Conroy, personal communication). The result from this step is an IFS-like data cube with spectra at each spatial position. The wavelength range and viewing angle of the synthetic observations are set in this step. (c) Further processing of the data cubes is performed by convolving spatially with a particular PSF, adding noise and rebinning the data to specific spatial and spectral resolution elements.
3.2 Input model extraction from Auriga snapshots
For our input models we use two components, an emission source given by the stellar distribution from Auriga and a medium, for the radiation to propagate through. Since the Auriga simulations do not include dust, we adopt interstellar gas as a tracer of the dust distribution. For each galaxy in our sample, we extract the stellar particles and gas cells at a particular snapshot using a cubical aperture centred on the galaxy’s centre of mass and oriented using the momentum vector aligned with the z-axis. The length of the cube is set by a stellar surface mass density threshold of 0.2 M⊙ pc−2; stellar particles and gas cells outside this volume are ignored. Along with the 3D positions and velocities, additional information on the stellar and gas properties of each particle/cell is extracted to aid in the selection of models as explained in the following sections.
3.2.1 Emission sources
Our Monte Carlo simulations follow the paths of randomly sampled photon packets emitted by the stellar particles from a particular Auriga galaxy. The wavelength of each of these photons is sampled from the spectral energy distribution, which in our case is a different single stellar population (SSP) spectrum depending on the mass, age, and metallicity of the stellar particle. We use the FSPS-based models (Flexible Stellar Population Synthesis, Conroy, Gunn & White 2009) but with the C3K high-resolution synthetic stellar spectra computed by C. Conroy (personal communication), assuming a Salpeter (1955) IMF. The Auriga simulations use a Chabrier IMF, but this difference in choice of the IMF does not affect the spectra at a crucial level for the specific goal of this work, investigating the effect of dust attenuation and instrumental characteristics on the observed stellar kinematics. We note that using a top-heavy IMF would change the spectra, with possible effects on the extracted kinematic and stellar population properties. The C3K templates offer a spectral resolution of σmod ∼ 12 km s−1, allowing for the computation of velocities at high resolution. The age grid for these templates goes from log10(age yr−1) =5.0 to log10(age yr−1) =10.3 with a spacing of Δlog10(age yr−1) =0.05 and the metallicities available are Z = 0.0001, 0.0003, 0.0004, 0.0008, 0.0014, 0.0025, 0.0045, 0.008, 0.0142, 0.0253, 0.0449. The code interpolates between these templates to provide a model for the specific age and metallicity of each stellar particle. In this work we focus on the stellar kinematics of the simulated galaxies and therefore we do not add an extra emission source for those stellar particles young enough to be considered star-forming regions, as other works with similar procedures have done (Camps et al. 2016; Kapoor et al. 2021; Trčka et al. 2022).
3.2.2 Diffuse dust distribution
We trace the dust distribution from the gas in the simulation, assuming that a constant fraction of the metals in the ISM is in the form of dust grains. In order to separate the cool interstellar gas from the hot circumgalactic medium, we only assign dust mass to gas cells that satisfy the temperature–density condition proposed by Torrey et al. (2012):
Different partitioning schemes have been used in previous studies to allocate the dust-containing ISM, and we refer the reader to Kapoor et al. (2021) and Trčka et al. (2022) for a more thorough discussion. Figs 2 and 3 of these works, respectively, show the impact of these choices on the resulting dust distribution. We use the current prescription, as it belongs to one of the Kapoor et al. (2021) fiducial models. Dust is allocated to the cells that meet the condition in (1) as ρdust = fdustZρ, where ρ and Z, the local density and metallicity of the gas cell, are taken from the Auriga snapshot and fdust, the dust-to-metal ratio, is chosen to be fdust = 0.14. The choice in value for fdust was taken from Kapoor et al. (2021), where this free parameter of the model was calibrated through comparisons with the observational DustPedia galaxy sample (Davies et al. 2017) using colour–colour and other broad-band luminosity correlations.
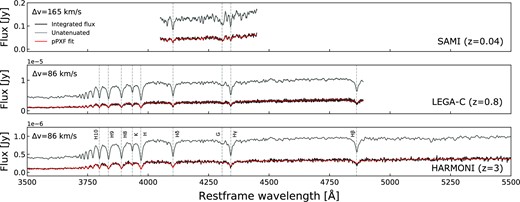
Integrated synthetic spectra for the SAMI-like (top), LEGA-C-like (middle), and HARMONI-like (bottom) simulations of haloes Au-6 at z=0, Au-6 at z=0.8, and Au-29 at z = 3 from the Auriga sample. The intrinsic unattenuated stellar spectra are shown in grey. Black shows the spectra after post-processing; this includes noise addition and seeing convolution. Red lines indicate the best-fitting model obtained with pPXF. Absorption features relevant for the kinematics analysis are highlighted.
The dust density distribution is discretized using an octree structure computed by skirt (Saftly et al. 2013; Saftly, Baes & Camps 2014) from the original Voronoi mesh. The parameters used in the construction of the octree are the same as used in Kapoor et al. (2021). For the dust model, our simulations use the THEMIS (Jones et al. 2017) dust mixture, which contain silicates and hydrocarbon particles, and we select 15 grain-size bins per population.
3.3 Radiative transfer simulation parameters
Radiative transfer simulations are performed in extinction-only mode, since we are only interested in the optical wavelength range; the re-emission of absorbed flux by dust in the infrared is not needed. This results in a reduction of the simulation computational time.
Because skirt uses a Monte Carlo technique to perform the radiative transfer in the simulations, the resulting fluxes will have a noise associated with them related to the number of photon packets used. We run our simulations using 5 × 10⁹ photon packets. This choice was made by considering two statistical diagnostic quantities: the relative error, R, and the variance of the variance, VOV, as defined in Camps & Baes (2020).
As described in Camps & Baes (2020), for a simulated flux to be reliable it must have values of |${R} \le 0.1$| and |$\rm {VOV} \le 0.1$|. This condition is not matched everywhere in the data cubes we generate, so spaxels that do not meet this condition were not considered in the analysis. However, all spaxels within 1Re of the centre of the galaxies are within the confidence interval, and in most cases it covers the area inside |$\sim 2 {R}_\mathrm{ e}$|.
The goal of this work is to produce synthetic spatially resolved spectroscopic observations of the Auriga galaxies. To do this, we make use of the FullInstrument object within skirt, which allows recording the surface brightness at every pixel of a given field of view and each wavelength within a given range. The result is an IFS-like data cube that stores the spectra for each spaxel. The specific wavelength range, spatial extent, and resolution are dependent on the target observational sample to mock and therefore these parameter selections will be described in the next section.
We use the skirt functionality that allows for separate recording of the flux components in our simulations. Apart from the standard data cube, which accounts fully for dust attenuation, a ‘transparent’ data cube is generated by this option, where the light coming from stellar particles arrives at the instrument unaltered (it does not interact with the dust). This unattenuated data set is used as ‘ground truth’ in the comparisons ahead.
4 SYNTHETIC STELLAR KINEMATICS AND COMPARISON WITH THE SAMI GALAXY SURVEY
In this section we describe the methods used to convert the resulting skirt data cubes into synthetic observations mimicking the specifications of the SAMI galaxy survey of present-day galaxies. We also present the kinematic analysis performed on the synthetic observations, along with comparisons between the global kinematics obtained from the simulated data using our mock observations and those measured from SAMI galaxy survey spectra.
4.1 The SAMI galaxy survey
The SAMI galaxy survey (Croom et al. 2012), performed using the 3.9-m Anglo-Australian Telescope, observed 2964 galaxies in range 0.004 < z < 0.095; this includes 2083 targets from the Galaxy and Mass Assembly (GAMA) G09, G12, and G15 regions (Driver et al. 2011) and 881 from eight clusters presented in Owers et al. (2017), resulting in a sample with a broad range of environments and galaxy stellar mass (|${M}_* \sim 10^8$|–|$10^{12} \,\rm {M}_{\odot }$|). SAMI is a multi-object integral field spectrograph consisting of 13 hexabundles, sets of 61 individual optical fibres that feed into the AAOmega spectrograph (Saunders et al. 2004; Smith et al. 2004; Sharp et al. 2006). Each of these fibres has a diameter of 1.6 arcsec, resulting in a ∼15-arcsec diameter region on the sky per bundle.
Each galaxy in the survey is observed using both the blue (3750–5750 Å) and red (6300–7400 Å) arms of the spectrograph at spectral resolutions of R = 1808 and 4304, respectively (Croom et al. 2021).
As reported in Allen et al. (2015), the point-spread function (PSF) for the survey varies from observation to observation and is determined primarily by the atmospheric conditions at the telescope. The distribution of the PSF full width at half-maximum (FWHM) measured on the final cubes of the survey varies within the range 1.4–3.0 arcsec with a median value of 2.1 arcsec.
The redshifts of the observations in the SAMI galaxy survey lie in the range 0.004 < z < 0.095, with a median value of z∼0.04, resulting in physical sizes of ∼12 kpc for the FOV diameter and ∼1.3 kpc for each optical fibre at this distance.
4.2 Original skirt setup
To recreate the specifications mentioned above in our mocks, we choose a field of view of 50 × 50 kpc2 where the major axis of the galaxy is aligned with the x-coordinate in the sky. In this configuration, each pixel is a square with a side of 0.5-kpc width. This serves as the base spatial sampling. We note that the SAMI FOV typically covers a smaller physical area than chosen for our simulations, however at this redshift it should reach at least 1Re, the area that most of our analysis is based on. The skirt simulations are run in ‘local universe mode’, where the instrument stores the resulting fluxes at the rest-frame wavelength. In this case the wavelength range chosen spans 4050 < λ < 4450 Å, with a spacing of Δv = 15 km s−1. This range was chosen to be shorter than the SAMI observations to reduce the simulation time needed. However the range chosen contains important absorption features necessary for the extraction of the stellar kinematics, including |$\rm {H}\delta$|, |$\rm {H}\gamma$|, the G band at 4303.61 and various Fe features, as can be seen in the top panel of Fig. 3, which shows the integrated spectrum for one of the galaxies in our sample.
To examine the dependence of inclination on the observed kinematics, we generate data cubes for a series of inclination angles: i = 25.84°, 45.57°, 60°, 72.54°. These were chosen to match some of the inclinations included in the Kapoor et al. (2021) final broad-band imaging catalogue. The azimuth was arbitrarily chosen at ϕ = 142.47° to match one of the orientations in the mock photometry in Kapoor et al. (2021). We also added instruments with azimuth values ϕ = 0° and ϕ = 90° for the i = 72° view, to assess the dependence of our results on the specific geometry of the simulated galaxies.
We generate these mock data cubes for a subsample of the original 30 Auriga galaxies, consisting of ten haloes: 1, 3, 6, 7, 13, 14, 17, 28, 29, and 30. We chose this set to represent the variety in the Auriga sample (Fig. 1). As stated above, all galaxies have similar masses and SFR, as the original purpose of the Auriga project was to produce Milky Way analogues. However, our sample contains several bulge-dominated systems, such as haloes 13, 17, and 30.
4.3 Addition of observational effects
The first step into the process of adding instrumental effects to our synthetic data cubes is to match the spectral resolution of the SAMI galaxy survey data. We start by convolving the spectra at each spaxel with the line-spread function (LSF). We use a Gaussian kernel with FWHM set by the square root of the quadratic difference of the C3K and SAMI spectra FWHM. For SAMI we assume FWHM = 165 km s−1, the resolution of SAMI’s blue arm as reported in Croom et al. (2021).
We then proceed by degrading the spatial resolution of each resulting skirt data cube. We emulate the seeing effect by convolving the images at each wavelength slice of our data cubes with a Moffat function (Moffat 1969). The profile is determined by two parameters: α, which is the core width, and β, the power, which depends on the seeing following |$\rm {FWHM} = 2\alpha \sqrt{2^{1/\beta }-1}$|. We use a fixed β = 4.765 (Trujillo et al. 2001) and FWHM=2 arcsec, which at the chosen redshift of z = 0.04 represents a physical size of 1.64 kpc. We also rebin each spatial element to twice its side, resulting in physical sizes of 1 kpc per spaxel.
Lastly, we emulate the signal-to-noise conditions of the survey by perturbing the fluxes in our cubes following Gaussian noise. We use a constant noise value across the cube. In combination with the simulated fluxes, this results in a distribution of signal-to-noise where the central brightest pixels have higher S/N values than the dimmer ones on the outskirts. We determine the noise level assuming a fixed signal-to-noise at 1Re of S/N =5 Å−1.
For actual spectroscopic observations, we expect to see a wavelength dependence on the noise level due to the varying sensitivity of the detector and spectrographs. Even within each arm of the SAMI instrument, the detector response fluctuates at the edges, which translates to higher noise (Bryant et al. 2015; Sande et al. 2017b). We note that the spectral range of our mock spectra is much narrower than that used in the survey and corresponds to only a portion of the coverage of the blue arm, so we chose to use a constant level of noise across all wavelengths for simplicity. We expect that including more realistic noise, derived from observations or from detector response models (Ibarra-Medel et al. 2019), would contribute to the uncertainty in the measured kinematics. The addition of different noise models is easy to implement, and it is the approach we follow for the generation of our LEGA-C long-slit mocks (see Section 5.1.2).
4.4 Spectral fitting
Once we have the final version of our synthetic cubes, we measure line-of-sight kinematics and absorption-line indexes. In the outskirts of our selected FOV, S/N is too low for the spectra to be used individually. To alleviate this issue, analogous to observed IFS data, we bin spaxels to reach a minimum of S/N=3 Å−1. We perform this using the Cappellari & Copin (2003) Voronoi tesselation method implemented in the vorbin2 package.
To recover the stellar kinematics, we used the penalized pixel-fitting code pPXF (Cappellari & Emsellem 2004; Cappellari 2017)3 to fit a Gaussian line-of-sight velocity distribution (LOSVD) at each spaxel in the data cube. We use the same high-resolution synthetic SSP templates from FSPS that were used to generate the spectra to perform the fitting. We fit the first two moments of the LOSVD, the line-of-sight velocity, vlos, and velocity dispersion, σ, and use a polynomial of degree 12 to fit the continuum. We follow a procedure similar to that described in Sande et al. (2017b), where as a first stage we create annular binned spectra of higher S/N to derive local optimal templates. We select five elliptical annular bins following the orientation of the light distribution and for each bin derive the mean flux of the spaxels within it. For each of the five spectra we perform a fit, which will result in five sets of optimal templates for each annular bin. Then, each spaxel is fitted using the set of templates corresponding to the annulus the spaxel belongs to. As a result we obtain vlos and σ maps at all orientations and for all components described previously. Columns 3 and 4 of Fig. 4 show the LOSVD maps for both the original skirt output data cube and the resulting SAMI-like data. An intermediate step, with the skirt post-processed cube but without instrumental effects applied, is also shown. There are subtle differences in the velocity distributions for the unattenuated and attenuated cases, but in general they seem to agree. The largest loss of structure happens for the fully mocked data, due to the noise addition and degradation in spatial resolution. The most noticeable changes in the 2D kinematics maps are in the velocity dispersion distributions. As a result of post-processing, the dispersion values at the centre of the galaxy become higher. The maximum velocity dispersion in the central pixels reaches a value 15 km s−1 higher for the fully mocked observations compared with the original model. In this case, the spatial binning of the spaxels contributes to the offset in velocity dispersion. We also measure the equivalent width of the Hδ Balmer absorption, EW(|$\rm {H}\delta _{\rm A}$|), at each spaxel on the cube. We use the definition in Worthey & Ottaviani (1997) and use the wavelength range 4083.50–4122.25 Å for the line index. The resulting maps are shown in the second column of Fig. 4, where all maps show a radial trend, with higher values at the outskirts compared with the centre. The addition of dust results in some loss of the spiral arm structure traced by the unattenuated EW measurements, especially at the centre. This structure is not visible in the lower panel of Fig. 4, where the spatial resolution is degraded.
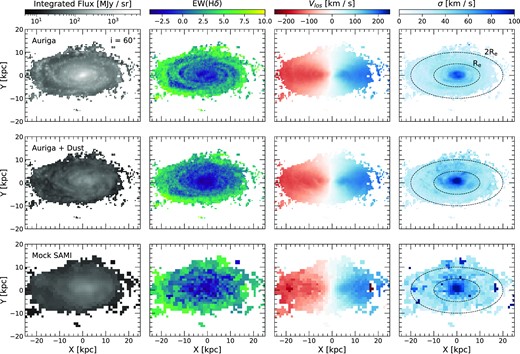
Example of our SAMI-like synthetic observations for halo Au-6 in the Auriga sample. The top row shows (a) unattenuated flux, (b) |$\rm {H\delta }$| equivalent width, (c) line-of-sight velocity, and (d) velocity dispersion distributions at an inclination i =60°. In the middle row are the maps for the post-processed version of the data cubes and the bottom row shows the results after the skirt run and further processing, i.e. PSF convolution and noise addition. Ellipses in the last column (d) denote 1Re and 2Re, derived using the particle data in Grand et al. (2017). Only ‘reliable’ pixels, as defined by the R statistic described in Section 3.3, are shown and used in the analysis.
4.5 Global kinematics
To quantify the effects that spatial resolution, instrumental effects, and dust attenuation have on the synthetic spectra, we compute the global stellar kinematics within 1Re. The radius chosen corresponds to Re = 1.68rd, where the exponential radius rd is taken from Grand et al. (2017), where Sérsic and exponential profiles are fitted simultaneously to the stellar surface density profile of each halo. We select the pixels within this radius in our resulting pPXF maps and compute the rotation velocity, Vrot, as
where W corresponds to the velocity width, the difference between the 90th and 10th percentiles of the histogram of rotation velocities (W = V90 − V10). The inclination, i, corresponds to the inclination chosen for each instrument in skirt and z is a fixed value for all haloes set in the simulation. We also measure the velocity dispersion, σe, as
where σj corresponds to the velocity dispersion in each spaxel and Fj to the corresponding continuum flux.
In addition to these measurements, we also measure line-of-sight kinematics for spectra produced using only partial elements of the mock process. These will help us understand better the effects of adding instrumentals and dust.
These extra versions of the mock spectra correspond to the following.
‘Intrinsic’: Mock data cubes generated with skirt (without radiative transfer) at a high spectral (Δv = 15 km s−1) and spatial resolution (Δx = 0.5 kpc). These mocks are oriented at a face-on (i = 0°) and edge-on (i = 90°) view of the galaxy disc.
‘Dust only’: Data cubes generated with skirt (with radiative transfer) at the native resolution (none of the instrumentals are added). At all orientations in the original run.
‘Instrumentals only’: Data cubes generated with skirt (without radiative transfer) with all instrumentals added, including LSF and PSF convolution, binning, and noise addition. At all orientations in the original run.
Global kinematics are also measured from these data cubes. From here on, we will refer to the rotation velocity, Vrot, from the ‘intrinsic’ edge-on mock and the velocity dispersion, σe, from the ‘intrinsic’ face-on mock as the ‘ground-truth’ kinematics for each galaxy.
4.6 Comparison with SAMI galaxy survey observational data
We start our analysis by comparing the properties derived from our synthetic SAMI galaxy survey data with the actual observations obtained in the survey (Croom et al. 2021). In Fig. 5, we compare the positions of the global kinematics derived from our i = 72° realization in the M⋆–Vrot (top panel) and M⋆–σe (bottom panel) spaces with respect to the SAMI galaxy survey derived quantities from Oh et al. (2020). As shown in the top panel, the rotation velocities derived from our synthetic data are consistent with those observed in disc galaxies in the SAMI galaxy survey, as shown by the agreement between our data points and the fiducial stellar mass Tully–Fisher relation derived by Oh et al. (2020) using single-component kinematic fits to late-type galaxies with D/T < 0.2. When we consider the values retrieved from our ‘ground-truth’ realization, these are still consistent with the SAMI sample; however, we see a systematic offset towards lower values in the fully processed sample, produced by the addition of dust and instrumental systematics added to the simulation data.
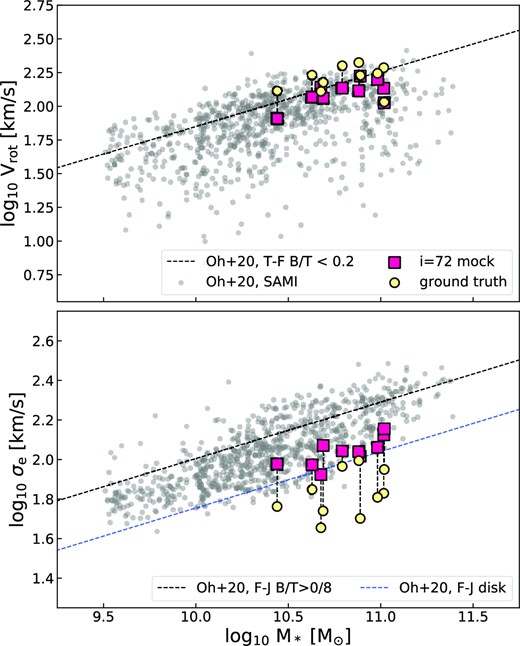
Comparison of observed versus simulated scaling relations with stellar mass. The stellar mass Tully–Fisher (top) and Faber–Jackson (bottom) relations as observed for the galaxies in the SAMI galaxy survey (Croom et al. 2021). Individual galaxies in the survey are shown in grey, while magenta squares indicate the recovered kinematics from the synthetic observations of a subsample of the Auriga galaxies from this work. The inclination of the observations displayed corresponds to i = 72°, the highest inclination used. The ground-truth values, corresponding to edge-on rotation velocity and face-on velocity dispersion from unattenuated, unperturbed data, are shown as yellow circles. Black dashed lines indicate the best-fitting relations calculated by Oh et al. (2020) using galaxies with B/T < 0.2 and B/T > 0.8 for T–F and F–J respectively. There is good agreement between our Auriga derived kinematics and the results from the SAMI galaxy survey; however, offsets from the ground-truth values can be observed, especially for velocity dispersion. All our velocity dispersion measurements fall below the F–J relation (calculated only using bulge-dominated systems) and are closer to the best-fitting relation recovered by Oh et al. (2020) using only the disc components resulting from their disc/bulge decomposition (in blue).
Velocity dispersions, on the other hand, while still consistent with the distribution of the SAMI sample, fall below the Faber–Jackson relation derived by Oh et al. (2020). Their fiducial relation was computed using bulge-dominated galaxies with B/T > 0.8, a condition that none of the galaxies in the Auriga sample at z=0 holds. The galaxy with the lowest D/T value, Au-11 with D/T = 0.29, was excluded from our selection due to its ongoing interaction with another system, which would complicate our analysis of its kinematics. We still see a correlation between our derived velocity dispersions and stellar mass, with a slope similar to the fiducial derivation from Oh et al. (2020), but offset downwards, closer to the Faber–Jackson relation they derived using only the disc component from their disc–bulge kinematic decomposition. The tension between the best-fitting relation and the data derived from our synthetic observations can be attributed to the fact that, as mentioned before, galaxies in the Auriga sample are designed to resemble the Milky Way, resulting in a sample of disc-dominated galaxies.
However, when we compare our results with the ground-truth data we see a stronger disagreement between the data sets. Intrinsic velocity dispersions are lower than the ones derived from fully post-processed data by around 0.2 dex, and fall outside the observed distribution of σe in the SAMI galaxy survey. Van De Sande et al. (2019) have already shown how multiple cosmological simulations consistently underpredicted velocity dispersion at fixed stellar mass. In their work they measure offsets ranging from 0.14–0.23 dex between the median velocity dispersion from the SAMI galaxy surveys and simulated data from the EAGLE, HORIZON-AGN, and MAGNETICUM cosmological simulations. This means that the stellar kinematics produced by the Auriga models is in agreement with spatially resolved observations at z = 0 from the SAMI galaxy survey; however, to reach this agreement a correct dust treatment and implementation of the instrumental effects must be taken into account. Specifically, the measured σe scales with galaxy stellar mass, following the Faber–Jackson relation, but only because it is dominated by beam-sheared rotation, not the intrinsic velocity dispersion.
We note that the stellar masses used for our synthetic sample come directly from the simulation (table 1 in Grand et al. 2017), in contrast to the SAMI galaxy survey values, derived from i-band luminosities and g − i colours (Taylor et al. 2011). This difference could introduce biases in the placement of the data with respect to the observed correlations. Nevertheless, for the intrinsic Auriga σe values to be consistent with the observed data, a shift of ∼1 dex in stellar mass would be needed. In Kapoor et al. (2021), stellar mass estimates were obtained from synthetic photometry for the Auriga galaxies using SED fitting with cigale. In general, they found good agreement between their results and particle-based stellar masses, so we conclude that the systematics in the kinematics due to the post-processing are playing a key role in the agreement of both samples.
As for the scatter in the relations, both ground-truth and mocked Auriga Tully–Fisher relations appear very tight, with little scatter in our sample, in contrast to the galaxies observed by Oh et al. (2020). On the other hand, the relation between σe and stellar mass has larger amounts of scatter, particularly for the ground-truth case. The mock velocity dispersions measured at i = 72° show a tighter relation with reduced scatter. In Oh et al. (2020) it is shown that one source of scatter in both relations is variation in the morphologies of galaxies; in particular, B/T is shown to correlate with the residuals of both Tully–Fisher and Faber–Jackson relations. We explore this possibility in Fig. 6. We observe only faint correlations between the ground-truth σe and V/σ with the disc-to-total ratio (D/T) measured in Grand et al. (2017). However, these correlations get washed away once the dust treatment and instrumentals are added, hinting at a differential effect of dust and PSF on the kinematics, dependent on the morphology of the galaxies. It is worth noting that our sample is reduced in size and the range of values of D/T is much smaller than the one observed in galaxies from the SAMI galaxy survey, thus limiting our analysis.
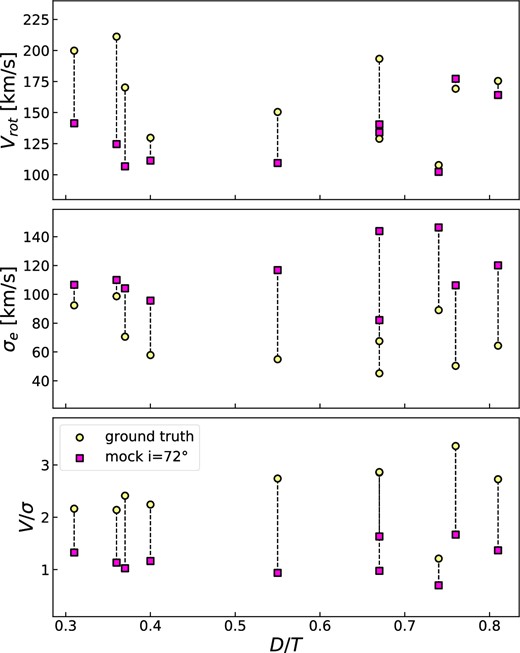
Global kinematic measurements and their dependence on the disc-to-total ratio. Rotation velocity (top), velocity dispersion (middle), and V/σ (bottom) for our subsample of Auriga simulated galaxies at z = 0. Magenta squares indicate the values measured from the i = 72° mocks of each galaxy in the sample. Yellow circles connected to the squares by a dashed vertical line correspond to the ground-truth values calculated from unattenuated, unperturbed data cubes. In this case, edge-on (i = 90°) and face-on (i = 0°) data cubes are used to measure rotation velocity and velocity dispersion, respectively. Values are displayed as a function of the disc-to-total ratio of the galaxy, calculated from a two-component fit to the light profiles derived in Grand et al. (2017).
4.7 Disentangling dust attenuation and observational effects
We can analyse our retrieved global kinematics further and study the root of the observed offsets by separating the contributions of dust attenuation and instrumental effects. This is done by performing our analysis on partially processed data cubes, one with radiative transfer but at the native resolution of our Monte Carlo simulations and a second one without radiative transfer but including spectral and spatial convolution, pixel binning, and noise addition.
The results are shown in Fig. 7. The leftmost panel shows our fiducial run, including both radiative transfer with skirt and mimicking the instrumental specifications of the SAMI galaxy survey. Each grey curve shows the offsets in rotation velocity, |$V_{\rm {rot}}/V_{\rm {rot}}^{\rm int}$|, and velocity dispersion, |$\sigma _\mathrm{ e}/\sigma _\mathrm{ e}^{\rm int}$|, within 1Re for a single Auriga galaxy in our sample. Connected by dashed lines, data points in each curve correspond to increasing inclinations. We find that the offsets in both rotational velocity and velocity dispersion values for our fully treated data cubes show a clear inclination dependence. Rotational velocity underestimations get larger as inclination increases, while the resulting velocity dispersion is increasingly overestimated with respect to the ground-truth line-of-sight velocity dispersion.
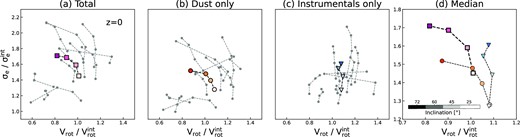
Effects of post-processing on the recovered global kinematic properties for our subsample of Auriga galaxies at z = 0. Global kinematic properties were computed from our SAMI-like IFS data cubes and correspond to rotation velocity (x-axis) and velocity dispersion (y-axis) within 1Re of the centre of the galaxies. Properties are plotted as fractions of the ‘intrinsic’ values, calculated using unattenuated data cubes with i = 90° (edge-on) for the rotation and i = 0° (face-on) for the velocity dispersion. For each individual galaxy in our selected sample, we generate synthetic spectra from four different viewing angles, at increasing inclination angles. The results from these realizations are plotted as grey dots connected by dashed lines in each panel. Each column shows a different step of the post-processing, from left to right: (a) the complete post-processing treatment including both radiative transfer and instrumental effects, (b) only post-processing with skirt at high spatial resolution, and (c) only PSF convolution and noise addition, but no radiative transfer or dust attenuation of any kind. The median values per inclination are shown as magenta squares in (a), orange circles in (b), and blue triangles in (c), with the shades of each colour going from lightest (i = 25°) to darkest (i = 72°) to indicate the inclination. In panel (d) we compare these trends, highlighting the separate effects that dust and instrumentals have on the recovered global kinematics from our analysis. The rotation velocities presented are inclination-corrected following equation (2).
Repeating our analysis on a set of data cubes that were post-processed with skirt but with no further degradation of the spectral and spatial resolution, we see behaviour similar to that in our fiducial run. This agreement is highlighted by the median trends in the rightmost panel of Fig. 7, where both trends evolve in the same direction, however with different amplitudes in the offset values.
The trends with inclination can be attributed to the higher amounts of dust in the line of sight due to the inclination of the disc. A behaviour similar to this for the rotational velocity was already been reported by Baes et al. (2003), where they analysed the effects of inclination and optical depth on the mean projected velocity and velocity dispersion of modelled discs. They show that, even at small optical depths, the effects of dust attenuation are very noticeable at high inclinations, and interpret these discrepancies as the result of only capturing the radiation coming from the optically thin part of the galaxy. This would result in shallower rotation curves, tending towards solid-body rotation, that would translate to lower Vrot at the highest inclinations, even after applying the usual inclination correction term, sin (i), for the difference in velocity components.
On the other hand, the instrumental effects appear to affect mostly the velocity dispersions derived, an effect that also correlates with the inclination of the disc. This is a result of the limited resolution, which leads to spatial mixing of radiation from stars with different velocities. This effect is most noticeable in the centre, where the velocity changes between adjacent pixels are largest, as shown in Fig. 4. The trend is then a result of the face-on views of the disc having smaller velocity gradients and thus resulting in lower velocity dispersions when the PSF convolution blends the light, an effect that has been reported on by multiple studies (D’Eugenio et al. 2013; Sande et al. 2017a; Harborne et al. 2020b; Nevin et al. 2021).
The combination of underestimating rotation velocities while overestimating velocity dispersion produces negative offsets in the recovered Vrot/σe, as displayed in Fig. 8. These offsets are more severe for the more inclined discs and the discrepancies can reach up to a factor ∼2 for our fully post-processed synthetic observations. This quantity is often used to measure the amount of ordered versus random motion in a system, so a systematic bias of this magnitude could lead to confusion in the classification of fast and slow rotators in a galaxy population.
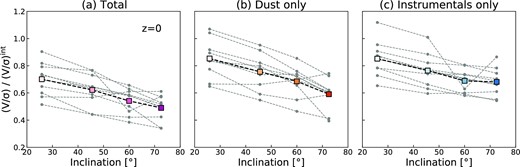
Effect of the post-processing on the inferred rotational support, V/σ, from the SAMI-like IFS data cubes as a function of the inclination of the synthetic observation. The y-axis shows the ratio between V/σ within 1Re, as recovered from our post-processed data cubes, and the ‘ground truth’ we define as the rotational velocity and velocity dispersion calculated from unattenuated data cubes from edge-on (i = 90°) and face-on (i = 0°) views of the galaxy. Values for individual galaxies in the sample are shown as grey dots joined by dashed lines, connecting the recovered values for the increasing inclination viewing angle used in the synthetic observations. Columns 2 and 3 separate the effects produced by (b) dust attenuation and (c) instrumentals on the recovered rotational support. Squares indicate the median value per inclination in the sample. On average the recovered rotational support is underestimated, an effect that becomes more prominent with inclination, reaching a factor ∼2 at the highest inclination measured (i = 72°).
At the resolution level of the SAMI galaxy survey, both dust and observational systematics produce offsets of similar magnitude. The discrepancies in rotational support are dominated by overestimation of the velocity dispersion, which shows offsets of a higher magnitude than the line-of-sight velocity.
We can compare our results with those found in Harborne et al. (2020b). In their study, they generate mock kinematics for 25 modelled galaxies at different inclinations and seeing conditions and explore the dependence of λR and V/σ on the spatial resolution and other galaxy properties (ϵ, n, Reff). For the range of sizes and resolution of our SAMI mocks, they find values in the range Δ(V/σ) = 0.9–0.7, depending on the projection and shape of the observed galaxies, which is consistent with what we recover for the run with only instrumental effects.
5 HIGH-REDSHIFT MOCK CONTINUUM SPECTROSCOPY
In this section we test our methodology further to produce synthetic spatially resolved spectroscopy at higher z. We generate mock observations resembling the long-slit spectra from the LEGA-C survey at z = 0.8 for a single galaxy and analyse the kinematics derived from them. We also generate an IFS data cube following the instrumental characteristics of the future E-ELT instrument HARMONI and simulate an observation for a source at z = 3.
5.1 Simulating LEGA-C observations at z = 0.8
5.1.1 The LEGA-C survey
The LEGA-C survey (Wel et al. 2016; Straatman et al. 2018; van der Wel et al. 2021) is an ESO Public Spectroscopic survey with VLT/VIMOS. The survey targets >3000 Ks-band selected galaxies in the COSMOS field in range 0.6 ≤ z ≤ 1.0. The 20-h long integrations result in high S/N stellar continuum detections of on average ∼19 Å−1 at a spectral resolution of R = 3500 in the range 6000–9000 Å. These conditions make the LEGA-C data an ideal sample to study the stellar kinematics of galaxies at high z. The field of view covered by the slits is 1.025 arcsec in width in the wavelength direction and at least 8 arcsec in length, with a pixel size of 0.205 arcsec (and 0.6 Å in wavelength).
5.1.2 Generation of the mock spectroscopy
In contrast to the sample at z = 0, we only perform our high-z test using a single galaxy from the Auriga sample, Au-6. This galaxy was chosen arbitrarily, with the only criterion being a sufficiently large stellar mass at the extraction snapshot corresponding to z = 0.8. At this stage in the simulation, Au-6 has a stellar mass of ∼1.6 × 10¹⁰ M⊙ and a dust mass fraction of fdust = 0.016 (as estimated from our dust assignment procedure on the star-forming cells in the simulation).
To simulate the effects of the slit width on the resulting 2D spectra, we first generate an IFS-like data cube that at a later step is stacked in the wavelength direction to obtain a mock 2D slit observation. At z ∼ 0.8, the FOV used is 30.4 × 8 kpc and each pixel has a size of 1.6 kpc; this results in a data cube with 19 spaxels of length and a width of 5 spaxels.
The wavelength grid used for these simulations spans the 6300 < λ < 9000 Å range, at the observed frame, with a resolution of Δv = 86 km s−1. At z = 0.8, the rest-frame wavelength range covers a wealth of absorption features useful for the kinematic analysis. Among them are lines in the Balmer series from |$\rm {H}\beta$| at 4861.35 Å to H10 at 3798.0 Å, and it also includes the CaK (3934.7 Å), CaH (3969.5 Å), and G band (4304.6 Å) absorption features useful for age and metallicity determination. An example of the resulting integrated spectra is shown in the middle panel of Fig. 3, where both unattenuated (grey) and attenuated (black) spectra are shown.
We choose a set of inclinations i = 25°, 60°, 80°, and 90°, where the major axis of the galaxy is aligned with the slit. We also add an observation with inclination i = 60° and ω = 20°, where the variation in roll angle is meant to explore the effects of misalignment between the slit and galaxy major axis.
Before going from the three-dimensional data cubes to two-dimensional spectra, we perform a PSF convolution to match the typical resolution of the survey at z ∼ 0.8. We adopt a 2D Moffat profile with FWHM = 7.5 kpc (∼ 1 arcsec) and a fixed β = 765. Then we combine the five pixel rows representing the width of the slit by shifting the wavelength of the spaxel depending on the corresponding distance to the centre of the slit to simulate the effect of the light as it projects on the CCD.
Once we have a 2D spectrum that matches the dimensions of the LEGA-C data, the final step is the addition of realistic noise. In this case, the assumption of constant noise the across wavelength range is not valid. Compared with our SAMI mocks, the wavelength range selected for LEGA-C is much larger, and also in the observed range the amount of telluric absorption and emission is higher at these longer wavelengths, making the noise highly dependent on wavelength. We select a real LEGA-C spectrum (ID:123292) matched in redshift and approximate stellar mass and extract its 1D noise curve. We then compute an extra normalization of the noise spectrum by setting the S/N of the central five pixels combined to S/N=20 Å−1. The perturbed spectrum is then created by drawing from a Gaussian distribution centred on the flux in our mock and a standard deviation given by the noise level at the corresponding sampled wavelength in the noise spectrum.
5.1.3 Spectral fitting and analysis
Analogous to the analysis performed for the low-z synthetic spectra, we perform a spectral fit with pPXF to the mock 2D LEGA-C observations. We use a procedure similar to the one described in Section 4.4 with two key differences. Since our synthetic observations are generated in the observed frame at high z, we first bring them to rest-frame using the redshift of the simulation. Also, instead of using median stacked spectra for annuli at different radii to obtain optimal templates, the first fit we perform is on the 1D integrated spectrum. The resulting set of templates is then used to fit each of the pixels along the slit and get the line-of-sight velocity and velocity dispersion curves.
Fig. 9 showcases the resulting line-of-sight rotation velocity and velocity dispersion curves along the slit for the simulated spectra of the Auriga halo Au-6 at the different inclinations. Compared with the intrinsic vlos, derived from the unattenuated spectra, we see shallower slopes in the rotation curves for our post-processed spectra. Both observations reach similar velocities at the outskirts, within the measurement uncertainty, for r ≲ 10 kpc, but the velocities near the centre are higher than those estimated for the attenuated spectra. These offsets become as high as 70 km s−1 around the r = 5 kpc distance. As mentioned in the previous section, a similar effect had already been reported by Baes et al. (2003). However, these effects become almost negligible at i ≤ 60° for their disc models, in contrast with our sample. Beam smearing due to the blending of light would also contribute to the flattening of the profile. In the case of the velocity dispersion profiles, we measure consistently higher dispersions for the attenuated spectra with respect to the stellar-only intrinsic values. This effect can be associated with the PSF limitations, which for the LEGA-C sample are as large as the size of the slit. We also compute the equivalent width of the |$\rm {H}\rm {\delta }$| absorption feature across the galaxy’s major axis as shown in the second row of Fig. 9. This illustrates that recovering subtle variations in stellar population properties at this resolution is challenging (but see D’Eugenio et al. 2020).
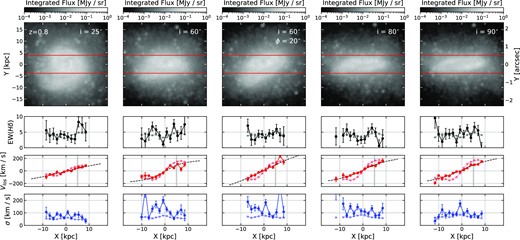
Example of our LEGA-C-like synthetic observations for halo Au-6 in the Auriga sample at z = 0.8. The rows show, from top to bottom, (a) unattenuated flux distribution, (b) |$\rm {H\delta }$| equivalent width, (c) line-of-sight velocity, and (d) velocity dispersion curves. Realizations of the synthetic observation at different angles are shown in each column, increasing with inclination to the right. For each of the curves in the three bottom rows, a version in a lighter shade was plotted indicating the intrinsic values obtained from mock observations without post-processing. Only pixels along the slit with sufficient photon packets in the skirt run are displayed, as the rest are deemed unreliable. The mock-slit position is marked in red in the top panel and in the third row a grey dashed line indicates the best-fitting arctangent model to the rotational velocity curve, used to calculate the rotational velocity at 5 kpc (V5).
To estimate the effects of radiative transfer and the instrumental and observational limitations on the derived rotational support, we compare V/σ for the different realizations (total, radiative transfer only, and instrumentals only) across all inclinations simulated. We fit the rotation curves derived from pPXF with an arctangent model using an MCMC procedure and measure the line-of-sight rotational velocity at 5 kpc, V5, as the value of the best-fitting model at this distance from the centre of the slit, as defined in Bezanson et al. (2018). Uncertainties for these values correspond to the 16th and 84th percentiles in the posterior distribution. We also measure the central velocity dispersion, σ0, as the mean value of the velocity dispersion profile of the two pixels at the centre of the slit. As for the SAMI mocks, we provide ‘intrinsic’ values for these estimates by repeating this procedure on the unattenuated synthetic observations at an edge-on inclination.
Similarly to the Local Universe case, the rotation support recovered as V/σ is lower than that estimated for the ‘ground-truth’ case across all inclinations for our fiducial run, as illustrated in Fig. 10 by the magenta squares. The trend with inclination is less robust than the one observed at z = 0, as the uncertainty of the measured V/σ is larger for these mock observations. In contrast with the low-z sample, the offsets observed are a result principally of the spatial convolution. The dust attenuation only produces underestimations of the measured V/σ of the order of 0.09 dex at its highest, while instrumental effects, mainly the seeing convolution, lead to values 0.5 dex lower than intrinsic. On average these offsets produce an underestimation of V5/σ0 by a factor ∼3.
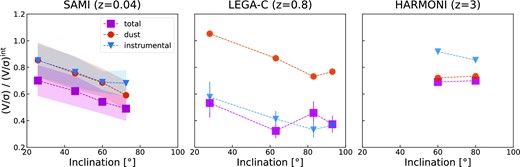
Effect of post-processing on the measured rotational support of the galaxies in the Auriga sample. Left: data points correspond to the median offsets in the computed V/σ within 1Re for our subsample of mock SAMI-like IFS cubes at each inclination used. The different symbols and colours represent the processes included in the generation of the data cubes, i.e. radiative transfer (orange circles), PSF convolution and noise addition (blue triangles), and both (magenta squares). The shaded areas correspond to 1σ of the distribution of offset values at each inclination. At this redshift, instrumental and dust effects produce similar offsets, with the effects becoming more prominent at higher inclinations. Centre: offsets in the computation of v5/σ0 for halo Au-6 at z= 0.8. Rotational velocities and velocity dispersion were calculated from synthetic long-slit observations emulating the LEGA-C survey data. Error bars correspond to the 1σ uncertainties in the measurements of the properties. In contrast to the SAMI mocks at a lower z, LEGA-C has a lower spatial resolution, resulting in instrumental effects being more prominent. Right: V/σ within 1Re for the synthetic IFS data generated for halo Au-29 at z = 3. The data cubes were generated using the specs of future ELT instrument HARMONI. In this case the effects of dust become more prominent than the seeing effects, due to the high resolution of HARMONI and the high amounts of dust of the source selected. At all redshifts, the instrinsic values used for the comparison were computed using unattenuated and unperturbed versions of the synthetic observations. Rotation velocities were calculated from an edge-on (i = 90°) orientation, while velocity dispersions used face-on (i = 0°) views.
5.2 Simulating HARMONI IFS spectroscopy at z = 3
5.2.1 ELT–HARMONI
As a final application of our methodology, we produced synthetic spectroscopy emulating one of the setups of the HARMONI instrument at the ELT. This integral field spectrograph will be one of the first-generation instruments for the ELT and is expected to provide observations at a variety of spatial and spectral resolutions in the range 0.47–245 μm.
Our experiment’s goal is to test the capabilities of HARMONI in observing the rest-frame optical stellar continuum and its absorption features, for a galaxy at z ∼ 3. The most appropriate setup then is to use the H-band coverage at a spectral resolution of R = 3500. The field of view chosen is the 3.04 × 4.08 arcmin setup, which comes with a pixel resolution of 20 mas on a side. At z = 3 this configuration spans a 31.62 × 23.56 kpc area, enough to cover at least 1Re for the haloes in the Auriga sample.
Since the z ∼ 3 galaxies in the Auriga simulations are not sufficiently massive for our purpose, we use a z ∼ 2 snapshot of Au-29, which has a stellar mass of M⋆ = 1.65 × 10¹⁰ M⊙ at that redshift and a dust mass fraction of 0.0175. Although the snapshot used for the extraction corresponds to a lower redshift, we run the radiative transfer procedure at a distance corresponding to z = 3, to obtain the correct rest-frame wavelength coverage of the optical spectral features needed for the kinematic analysis.
5.2.2 Generation of the HARMONI-like data cubes
Since HARMONI is an IFS instrument, we use a configuration for our skirt simulations analogous to the z = 0 case. We chose a pixel scale of 0.155 kpc on a side and a wavelength range at the observed frame (at z = 3) from 1.4–2.2 |$\mu$|m, which covers the rest-frame range 3500–5500 Å, as can be seen in Fig. 3. We generated cubes at inclinations i = 0°, 60°, 80°, and 90°, also allowing for the separate recording of the components to obtain the unattenuated data cubes.
The further manipulation of the data cubes to resemble observations with HARMONI is analogous to the procedure described in Section 4.3 for the SAMI galaxy survey mocks. We start by convolving the slices at each wavelength with a Moffat profile, using parameters β = 4.765 and FWHM = 10 mas. The value of the PSF FWHM was chosen to be the driffaction limit of the ELT at this wavelength, as we simulate observations assuming a perfect adaptive optics (AO) correction. To add noise, we assume a constant noise across the wavelength range, for simplicity, and set the signal-to-noise ratio of our observations to S/N =5 at 1Re. Using these parameters, we perturb the resulting fluxes in our data cubes.
5.2.3 Spectral fitting and analysis
As with the rest of our mocks, we perform kinematic and equivalent-width fitting following a procedure analogous to that for our synthetic SAMI observations, as outlined in Section 4.4. The resulting maps for the intrinsic, stellar only (top), attenuated (middle), and seeing-convolved (bottom) mocks are displayed in Fig. 11. The integrated flux image illustrates the effect of attenuation on our simulated spectra, and we see an evident change to the light distribution. The bright centre of the galaxy, shown in the first row, is obscured by dust in the line of sight.
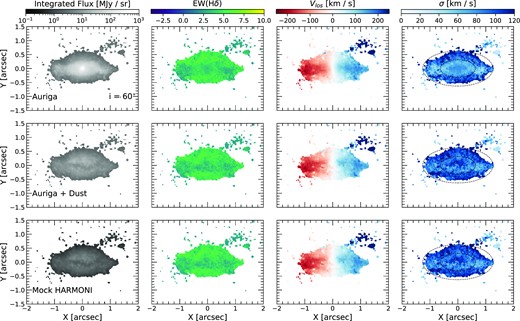
(a) Resulting flux, (b) |$\rm {H\delta }$|equivalent width, (c) line-of-sight velocity, and (d) velocity dispersion distributions for our synthetic HARMONI mock observations of halo Au-29 of the Auriga sample at z = 3. The inclination of the observation shown is set to i = 60°. The top row shows the resulting distributions from unattenuated unconvolved IFS-like data cubes. In the middle, radiative transfer with skirt is added and on the bottom row the maps are the result of our skirt run and further processing, i.e. PSF convolution and noise addition. Ellipses in the last column (d) denote 1Re and 2Re.
The HARMONI mock observation, despite strong attenuation, recovers the overall kinematic structure accurately, demonstrating that a dynamical model based on a strongly attenuated spectrum will still produce an accurate description of the mass distribution and the dynamical structure. Stellar population gradients are also recovered with good precision thanks to the superior spatial resolution, but this has a downside: if the stellar population M/L estimate is insensitive to attenuation, then the true M/L will be difficult to measure. While beyond the scope of this work, our methodology allows for quantitative tests to address this issue.
Finally, we recover global kinematics for the synthetic cubes at inclinations i = 60° and i = 80°. We use the same definitions for Vrot and σe from equations (2) and (3), respectively, and compare these with ‘ground-truth’ values measured from the unattenuated, unconvolved data cubes. In our fiducial run, using the full procedure including radiative transfer and instrumental effects, we see an underestimation of rotational support at both inclinations simulated, as presented in Fig. 10. The amplitude of the offset, however, is much smaller compared with both lower z experiments, and at its maximum produces an underestimation of 0.15 dex in the V/σ measured within 1Re. This difference might be due to the better spatial resolution of HARMONI. We see that the run that only implements observational effects produces only very small offsets, lower than 0.1 dex, while most of the underestimation is caused by the presence of dust, in contrast to what we observe in our LEGA-C exercise at z = 0.8. Due to the reduced dynamical range of the inclinations covered, we cannot establish any trends between the amplitude of the offsets and the inclination.
6 SUMMARY AND OUTLOOK
We present a framework for producing synthetic spatially resolved galaxy spectra from cosmological hydrodynamical simulations. With the 3D radiative transfer code skirt (Baes et al. 2020), we propagate high-resolution synthetic spectra from Conroy et al. (2009) through the dusty interstellar medium of the high-resolution hydrodynamical simulation Auriga (Grand et al. 2017). The RT simulation is converted into mock integral field or slit spectroscopic observations, including instrument specifications, noise, and the point-spread function. As an application of our method, we show mock observations of Milky Way mass Auriga simulations that match the instrumental specifications of the SAMI galaxy survey of present-day galaxies, the VLT/VIMOS LEGA-C survey at z ∼ 0.8, and, looking ahead, E-ELT/HARMONI observations at z = 3. Stellar kinematic measurements (velocities and velocity dispersions) are performed in the same manner as real observational data.
A comparison between 10 galaxies in the Auriga sample and the SAMI galaxy survey galaxies shows that the kinematic signatures of these simulated galaxies show good agreement with the observed scaling relations after introducing the dust treatment and instrumental effects. The intrinsic velocity dispersion for the simulated Auriga galaxies is offset systematically from the observed Faber–Jackson relation, with our velocity dispersion measurements falling below all galaxies in the SAMI galaxy survey at a similar mass range. From our analysis, we conclude that the discrepancy in simulated and observed kinematics is due to both the effects of dust attenuation and the limited spatial resolution in the observed sample.
Comparisons with unattenuated and unperturbed spectra show that in general our mocks produce lower line-of-sight velocities and higher velocity dispersions than the intrinsic ground-truth values. These offsets are larger for highly inclined discs, an effect that can be attributed to the spatial convolution of the individual spaxels but is also dependent on the optical depth of the interstellar medium. Which of these effects is most prominent depends on the amounts of dust in the system and the quality of the data, specifically the spatial resolution. This is highlighted in Fig. 10, where the varying spatial resolutions of the surveys/instruments emulated lead to different levels of underestimation. The combination of these offsets can cause an underestimation of V/σ by a factor ∼2–3 in our local and high-z mocks.
In summary, our work serves three broad purposes.
The ability to produce data cubes of synthetic spectra that can be treated as observations provides an opportunity to test the techniques and assumptions used to derive physical quantities from observed data. Comparison with the intrinsic values from the input simulations allows for study of the biases introduced by the underlying assumptions and inherent imperfections due to finite S/N and spatial resolution.
Our method offers a robust way to compare simulations and observations that take into account the effects of dust, seeing, noise, and the biases introduced by the models used to infer properties from observations. These ultimately inform the physical models and recipes used to calibrate the subgrid recipes the simulations rely on.
With our framework that combines simulated galaxies and radiative transfer, we can provide more realistic and physically motivated input models to test the capabilities of future instrumentation.
This work focused on the stellar kinematics derived from spatially resolved data, but our methodology can be used to asses the impact of instrumental effects and dust attenuation on other physical properties derived from spectra, such as stellar population parameters (e.g. ages, metallicities, etc.). We plan to build on this work by including a physical treatment of the radiative transfer of line emission (Kapoor et al., in preparation). This will enable similar studies of the gas kinematics and the inferred properties of the ISM derived from emission-line strengths and shapes and their biases, and will also provide a robust method of comparison of simulated galaxies with the rich available data sets of spatially resolved Hα kinematic maps from SINFONI (Tacchella et al. 2015) and KMOS (Tiley et al. 2021).
ACKNOWLEDGEMENTS
We thank Luca Cortese and Eric Emsellem for useful comments and suggestions. We also thank Sree Oh, for providing the SAMI kinematic measurements. This project received funding from the European Research Council (ERC) under the European Union’s Horizon 2020 Framework Programme, grant agreement no. 683184 (Consolidator Grant LEGA-C). DB, MB, and AUK acknowledge the financial support of the Flemish Fund for Scientific Research (FWO-Vlaanderen), research projects G039216N and G030319N.
RG acknowledges financial support from the Spanish Ministry of Science and Innovation (MICINN) through the Spanish State Research Agency, under the Severo Ochoa Program 2020–2023 (CEX2019-000920-S) and an STFC Ernest Rutherford Fellowship (ST/W003643/1).
DATA AVAILABILITY
The resulting IFS-like data cubes produced with skirt for the 10 galaxies at z=0 and the two galaxies at z=0.8 and z=3 respectively will be publicly available at www.auriga.ugent.be. The scripts used to manipulate and add the instrumentals to the original skirt output data cubes can be found at https://github.com/dbarrientosa/synth-spec.
Footnotes
Available at https://skirt.ugent.be.
Available at https://www-astro.physics.ox.ac.uk/~cappellari/software/.
Available at https://www-astro.physics.ox.ac.uk/~cappellari/software/.
