


ABSTRACT
We present second epoch optical spectra for 30 changing-look (CL) candidates found by searching for Type-1 optical variability in a sample of active galactic nuclei (AGNs) spectroscopically classified as Type 2. We use a random-forest-based light-curve classifier and spectroscopic follow-up, confirming 50 per cent of candidates as turning-on CLs. In order to improve this selection method and to better understand the nature of the not-confirmed CL candidates, we perform a multiwavelength variability analysis including optical, mid-infrared (MIR), and X-ray data, and compare the results from the confirmed and not-confirmed CLs identified in this work. We find that most of the not-confirmed CLs are consistent with weak Type 1s dominated by host-galaxy contributions, showing weaker optical and MIR variability. On the contrary, the confirmed CLs present stronger optical fluctuations and experience a long (from five to ten years) increase in their MIR fluxes and the colour W1–W2 over time. In the 0.2–2.3 keV band, at least four out of 11 CLs with available SRG/eROSITA detections have increased their flux in comparison with archival upper limits. These common features allow us to select the most promising CLs from our list of candidates, leading to nine sources with similar multiwavelength photometric properties to our CL sample. The use of machine learning algorithms with optical and MIR light curves will be very useful to identify CLs in future large-scale surveys.
1 INTRODUCTION
For the past few years, a growing (>200) population of active galactic nuclei (AGNs) with emerging or disappearing optical broad emission lines (BELs) has been found, arousing great interest among the astrophysics community (see review by Ricci & Trakhtenbrot 2022). Most studies favour an accretion rate change as the origin of such dramatic changes in unobscured AGNs, so these sources are often called changing-state (CS) AGNs. Other mechanisms such as variable absorption and tidal disruption events (TDEs) are also expected to produce variations in the BELs, so the term changing-look (CL) is generally used to refer to all AGNs that show such spectral transitions, regardless of the physical mechanisms driving these changes. This term is borrowed from the X-ray community, where a CL event is led by extreme variable X-ray absorption, causing a switch between Compton-thin (NH < 1024 cm−2) and Compton-thick (NH ≳ 1024 cm−2) states in AGNs (e.g. Matt, Guainazzi & Maiolino 2003).
The CL phenomenon is characterized by drastic changes in the optical BELs. The BELs consist of permitted and semiforbidden emission lines with typical line widths FWHM ≥ 1000 km s−1, formed by high density gas clouds called the broad line region (BLR) located close to the central engine (e.g. Netzer 2015). Therefore, most of the effort to find CL AGNs has focused on systematic searches of broad Balmer line variations (generally >3σ flux change in broad H β) in sources with multi-epoch spectroscopy (although other lines such as Mg ii are also possible, see MacLeod et al. 2016; Ross et al. 2018; Guo et al. 2019). In particular, some sizable samples have been found comparing repeated spectra from different surveys such as the Sloan Digital Sky Survey (SDSS) and the Large Sky Area Multi-Object Fiber Spectroscopic Telescope (LAMOST) (Yang et al. 2018; Green et al. 2022). CL events are often accompanied by large photometric changes in the optical and ultraviolet (UV) bands, and this has been used as a selection criteria to find new CL AGNs (i.e. |Δg| > 1 mag, |Δr| > 0.5 mag in MacLeod et al. 2016, 2019). However, the link between extreme spectroscopic and photometric changes is uncertain, since just 10–15 per cent of photometrically variable AGNs have been found to display CL behaviour (MacLeod et al. 2019). This uncertainty can be affected by the time-scales involved in CL events, which have been constrained just in a few sources (Trakhtenbrot et al. 2019), and the fact that the CL behaviour has been found to occur repeatedly in some sources (e.g. depending on the Eddington ratio, Guolo et al. 2021). More recently, some studies have concentrated on the search for CL events based on the physical expectations for an accretion-state change. In this scenario, it is expected to see gradual changes in the optical and mid-infrared (MIR) flux and colours associated with monotonically varying BEL strengths and/or continuum changes, as the AGN goes to bright (AGN dominated) or dim (host dominated) states (e.g. Sheng et al. 2017; Yang et al. 2018; Lyu et al. 2022). In the optical, CS AGN candidates have been selected by searching for anomalous variability (Sánchez-Sáez et al. 2021b) and bluer optical colours in turning-on AGNs (Hon et al. 2022), where the latter method shows a higher success rate for confirmed CL compared to other selection techniques. In the MIR band, individual CL AGNs have been found by identifying highly MIR-variable quasars in the Wide-field Infrared Survey Explorer (WISE) and Near-Earth Object WISE Reactivation (NEOWISE) data stream (Assef et al. 2018; Stern et al. 2018). In Graham et al. (2020), 111 CS quasars were found by applying two different criteria: strongly enhanced optical variability over some time-scales and a large absolute difference between the initial and final state in the WISE light curve (i.e. |ΔW1| > 0.2 or |ΔW2| > 0.2). That work led to a CS sample at higher luminosity than previous CL AGNs in the literature.
Moreover, individual CL events have been associated with changes in soft-X-ray/UV emission, responsible for photoionizing the BLR gas, as in the case of Mrk 1018 (Cohen et al. 1986; McElroy et al. 2016; Noda & Done 2018). More extreme X-ray spectral and flux variability was found in the CL source 1ES 1927+654, which has been suggested to be caused by a TDE in an AGN (Trakhtenbrot et al. 2019; Ricci et al. 2020, 2021) or a magnetic flux inversion event (Laha et al. 2022). Recently, in a CL search of sources with multi-epoch optical spectroscopy within the Swift-BAT AGN Spectroscopic Survey (BASS), it was reported that five out of nine events with Swift-BAT data available could be associated with significant flux changes in the 14–195 keV hard X-ray band (Temple et al. 2023).
With the advent of deep, large sky-coverage monitoring surveys such as the Zwicky Transient Facility (ZTF; Bellm et al. 2019) and the upcoming Legacy Survey of Space and Time (LSST; Ivezić et al. 2019), the identification of CL AGNs will be possible using machine-learning techniques. In López-Navas et al. (2022, hereafter LN22), we present a method specifically looking for turn-on events using a balanced random forest algorithm with the ZTF alert stream (Sánchez-Sáez et al. 2021a), confirming CL behaviour in four out of six sources that we re-observed based on follow-up spectroscopy. Extending this work further, we obtained a second epoch spectra of 30 additional CL candidates, confirming ∼50 per cent as CLs. In this paper, we present the new observations and perform a multiwavelength (optical, MIR, and X-ray) variability analysis of the CL sources. This effort enables us to improve the selection technique and reinforces the common features of these CL events. Throughout this work, we assume a standard cosmological model with H0 = 70 km s−1 Mpc−1, Ωm = 0.3, and ΩΛ = 0.7.
2 SELECTION OF THE SAMPLE
According to the classic view of AGNs, the optical variability in Type 2 sources is highly suppressed due to obscuration of the continuum coming from the central source by the dusty torus (Antonucci 1993). Based on this consideration, looking for Type 1-like optical flux variability (coming from the accretion disc) in spectrally classified Type 2 AGNs (whose accretion disc should be hidden) has led to the finding of turning-on CL sources. We note that in these cases, the previous Type 2 classification is due to the absence of significant BELs in their spectra, and not due to the identification of the viewing angle of the system. This is the selection strategy we followed in LN22 to find potential CL candidates. Here, we update the candidate list reported in LN22 and clean it further.
Our initial sample consists of all the spectrally classified Type 2 AGNs included in the Million Quasars Catalog (MILLIQUAS, Version 7.7, N and K types, Flesch 2021). We removed sources classified as Seyfert 1, Low Ionization Nuclear Emission Region (LINER) or blazar in any other study according to the SIMBAD Astronomical Database, and those included in the Type 1 AGN catalogues from Oh et al. (2015) and Liu et al. (2019). We also required the sources to have a public ‘GALAXY AGN’ or ‘QSO AGN’ spectrum in SDSS DR17, and discarded objects with a BROADLINE classification. This led to 20 834 Type 2 AGNs. We also checked that none of these sources were included in the Roma-BZCAT Multifrequency Catalogue of Blazars (Massaro et al. 2015). To select potential CL candidates, we searched for current Type 1 optical flux variability in our Type 2 sample. In particular, we used the host- and core-dominated AGN classifications given by the Automatic Learning for the Rapid Classification of Events (ALeRCE; Förster et al. 2021) broker light-curve classifier (LCC; Sánchez-Sáez et al. 2021a). The ALeRCE broker is currently processing the alert stream from the Zwicky Transient Facility (ZTF; Bellm 2014; Bellm et al. 2019) to provide a fast classification of variable objects by applying a balanced random forest algorithm. In particular, the LCC computes a total of 174 features, including colours obtained from AllWISE and ZTF photometry and variability features, for all objects that had generated at least six alerts in either g or r band in the ZTF alert stream. Since each alert is produced when a 5σ variation in the template-subtracted image occurs, only sufficiently variable objects are detected and classified by the LCC. In the case of AGNs, only 10 per cent of known Type 1s with r < 20.5 mag exhibit variations reaching this threshold and produce alerts in ZTF. Therefore, using this method we expect to select the 10 per cent most variable CLs in the parent sample.
We performed a sky cross-match within 1 arcsec between our Type 2 parent sample and the sources classified primarily as AGN or QSO by the LCC (updated on 2022 November 30), which led to 71 matches. Ten sources had two different identification names in ZTF, resulting in 61 CL candidates. Of these, ∼30 objects were identified as bad candidates from a visual examination of the optical light curves and the SDSS spectra. In the first place, some sources show BELs in their optical spectra and were apparently misclassified in the catalogues. This generally occurs in the lower luminosity and lower black hole-mass regimes, where the BELs fail to meet the FWHM ≥ 1000 km s−1 criterion (Liu et al. 2019), and also in intermediate Type 1.8/1.9 AGNs, which show weak broad Balmer lines (e.g. Hernández-García et al. 2017). Secondly, other sources appear misclassified by the ALeRCE LCC due to a small number of data points or transient events in the reference image used to construct the difference images (mostly supernovae, Sánchez-Sáez et al. 2023).
We note that the ZTF alert light curves only contain alerts generated since the ZTF started its operations in 2018, but the actual length of the alert light curves depend on how variable the object is. We stress that the first ZTF alert does not necessarily mark the time of the change of state, considering that most known Type 1 AGNs have not triggered alerts or have taken years after the start of ZTF to show their first alert. This method does not give information about time the CL transition occurred other than that it happened some time between the SDSS spectrum was taken 10–20 yr ago and the ALeRCE LCC classification as Type 1 AGN. In order to confirm the selected candidates as CLs, we need to perform optical follow-up spectroscopy that quantifies the changes in the BELs with respect to the SDSS spectrum.
In this work, we further investigate the variability and spectral properties of the most promising CL candidates to improve the selection method and shed light on the origin of these phenomena.
3 SPECTROSCOPIC FOLLOW-UP
3.1 Data
We obtained second epoch spectra for 36 of our 61 CL candidates, allowing us to confirm CL objects by quantifying BEL changes with respect to archival SDSS spectra. These sources were selected via visual examination of the optical light curves and archival spectra of the CL candidates. Six out of the 36 sources were reported in LN22. In this paper, we present spectral analysis for the remaining 30 objects. The new optical spectra were taken during 2022 February and April using either the Double Spectrograph (DBSP) on the Palomar 200-inch Hale Telescope (P200) or the Low Resolution Imaging Spectrometer (LRIS) spectrograph on the Keck I telescope at the W. M. Keck Observatory, as specified in the Appendix, Table A1. The spectra were obtained using a blue and a red arm with the 600 and 316 lines per mm grating, respectively, 1.5 or 2 inch slit widths and 1×1 binning, and processed using standard procedures. All the observed sources fall within the redshift range 0.04≤z≤ 0.22, therefore covering the H α for all sources. In some of the cases, the H β and [O iii] emission lines were in the border between the blue (2500–5700 Å) and red (4800–10700 Å) useful regions, leading to uncertain fits. Thus, we compared the broad H α and the H α/[S ii] ratio between epochs, instead of the broad H β or the H α/[O iii] ratio as performed in other studies (e.g. in Graham et al. 2020).
3.2 Spectroscopic fitting
We fit the archival DR17 SDSS spectra and the second epoch spectra from the Keck I and P200 telescopes using the Penalized Pixel-Fitting (ppxf) software (Cappellari 2017). To account for the stellar continuum component we used the E-MILES library (Vazdekis et al. 2010), and to model the AGN emission we added the following components:
A power low template for the accretion disc contribution of the form |$(\frac{\lambda }{\lambda _N})^\alpha$| where λ is the wavelength, λN = 5000 Å is a normalization factor, and α goes from −3 to 0 in steps of 0.1.
One kinematic component with both permitted and forbidden emission lines, with free normalizations, to model the narrow lines.
One kinematic component with permitted emission lines, with free normalizations, to model the possible BELs.
One component for possible outflows with velocity dispersion values from 400 to 1000 km s−1.
To fit the second epoch spectra we used the same stellar population templates obtained from the SDSS fit and we left the normalization free during the fitting process. We obtained errors for each spectrum by performing Monte Carlo simulations using the best-fitting model and simulating random noise generated from the standard deviation of the best-fitting residuals. Then we fit the simulated spectra using the same procedure described for the SDSS and second epoch spectra, providing an error on the model parameters.
Table 1 shows the results of the spectral fitting for broad H α and the 1σ error from the simulations. We identify 13 confirmed CL AGNs with >3σ change in the EW of broad H α and >3σ change in the H α/[S ii] ratio. We also identify as CL two sources with a >3σ change in the H α/[S ii] ratio, whose change can be confirmed via visual inspection. In total, we find 15 CL sources (highlighted in bold, see Table 1). Their optical spectra are shown in the Appendix, Fig. A1. Some of the sources show bluer continuum emission and/or asymmetric and complex BEL profiles (e.g. ZTF18acbzrll, ZTF19aavyjdn, and ZTF20aaxwxgq) during the high state, as found in previous CL works (Oknyansky et al. 2021). In one case, ZTF19aafcyzr, the changes in the BELs according to the spectral fits are significant but they are not obvious when looking at the difference spectrum, so we speculate these changes could be driven by differences in the spectroscopy (that is, different instruments and set-up) and not to physical changes.
Sample of the CL candidates observed and results of the spectral fitting. z denotes redshift from the DR17 SDSS data base. MJD, fiberid and plate denote the date and observational information from the SDSS spectra. EW denotes the equivalent width of the BELs. Sources identified as CL are shown in bold. Asterisks denote CL sources showing a >3σ change in the H α/[S ii] ratio, but with no significant changes in EW H α. Some sources have two different ZTF IDs, which are separated by a slash. For completeness, we include the information for the six sources from LN22 at the end of the table.
| ZTF ID | RA | DEC | z | MJD | fiberid | plate | EW H α SDSS | EW H α new | H α/[S ii] SDSS | H α/[S ii] new |
|---|---|---|---|---|---|---|---|---|---|---|
| |$\deg$| | |$\deg$| | Å | Å | |||||||
| ZTF18aaiescp | 207.21292 | 57.646792 | 0.13 | 52 668 | 198 | 1158 | 30 ± 2 | 14 ± 1 | 1.75 ± 0.12 | 1.14 ± 0.07 |
| ZTF18aaiwdzt | 199.48361 | 49.258651 | 0.09 | 52 759 | 390 | 1282 | 22 ± 2 | 24 ± 2 | 0.7 ± 0.07 | 0.69 ± 0.04 |
| ZTF18aajywbu | 205.45327 | 37.013091 | 0.20 | 53 858 | 513 | 2101 | 23 ± 4 | 94 ± 2 | 2.4 ± 0.4 | 9.01 ± 0.23 |
| ZTF18aaqftos | 180.95505 | 60.888181 | 0.07 | 52 405 | 420 | 954 | 23 ± 3 | 116 ± 3 | 1.81 ± 0.21 | 25.09 ± 0.74 |
| ZTF18aaqjyon | 180.42264 | 38.47264 | 0.06 | 53 473 | 358 | 2108 | 6 ± 2 | 0 ± 0 | 0.56 ± 0.18 | 0.0 ± 0.25 |
| ZTF21aaqlazo/ZTF18aasudup | 170.03619 | 34.312731 | 0.04 | 53 713 | 346 | 2100 | 15 ± 1 | 43 ± 1 | 1.79 ± 0.11 | 6.43 ± 0.2 |
| ZTF18aavxbec* | 243.08151 | 46.495172 | 0.13 | 52 370 | 408 | 814 | 17 ± 2 | 16 ± 0 | 1.47 ± 0.18 | 3.14 ± 0.1 |
| ZTF18aawoghx | 156.10498 | 37.650863 | 0.10 | 52 998 | 254 | 1428 | 9 ± 2 | 34 ± 1 | 0.91 ± 0.2 | 3.95 ± 0.17 |
| ZTF18aawwcaa | 128.10120 | 35.859979 | 0.14 | 52 668 | 459 | 1197 | 26 ± 2 | 73 ± 2 | 5.49 ± 0.77 | 16.74 ± 1.06 |
| ZTF19aabyvtv/ZTF18aayyapb | 197.87773 | 31.866893 | 0.07 | 53 819 | 632 | 2029 | 17 ± 1 | 6 ± 3 | 17.57 ± 3.38 | 8.09 ± 9.03 |
| ZTF18acbzrll | 124.82294 | 30.32660 | 0.10 | 52 619 | 94 | 931 | 7 ± 2 | 90 ± 3 | 1.29 ± 0.43 | 20.13 ± 0.88 |
| ZTF18acgvmzb/ZTF18aclfugf | 148.96896 | 35.965616 | 0.04 | 52 998 | 251 | 1596 | 8 ± 1 | 8 ± 1 | 0.52 ± 0.03 | 0.73 ± 0.04 |
| ZTF18achdyst | 157.39925 | 24.777606 | 0.11 | 53 734 | 545 | 2349 | 26 ± 1 | 15 ± 1 | 5.72 ± 0.02 | 1.37 ± 0.1 |
| ZTF18acusqpt/ZTF18adppkkj | 177.91898 | 12.036714 | 0.07 | 53 142 | 116 | 1609 | 18 ± 1 | 17 ± 2 | 3.27 ± 0.32 | 6.07 ± 0.65 |
| ZTF19aafcyzr | 125.71008 | 15.673859 | 0.12 | 53 713 | 517 | 2272 | 11 ± 1 | 30 ± 1 | 1.2 ± 0.17 | 3.98 ± 0.24 |
| ZTF19aaixgoj | 146.80538 | 12.205624 | 0.12 | 53 053 | 575 | 1742 | 14 ± 1 | 13 ± 1 | 2.65 ± 0.29 | 2.61 ± 0.24 |
| ZTF19aaoyjoh | 180.18956 | 14.967685 | 0.11 | 53 463 | 158 | 1763 | 10 ± 5 | 59 ± 1 | 1.25 ± 0.37 | 10.44 ± 0.31 |
| ZTF19aapehvs | 199.74519 | 57.501847 | 0.10 | 52 759 | 338 | 1320 | 32 ± 2 | 18 ± 1 | 3.02 ± 0.27 | 2.34 ± 0.17 |
| ZTF19aavqrjg | 181.24583 | 15.58718 | 0.22 | 53 467 | 447 | 1764 | 51 ± 3 | 67 ± 9 | 35.65 ± 2.0 | 10.61 ± 10.55 |
| ZTF19aavyjdn | 202.39941 | −1.509453 | 0.08 | 52 377 | 524 | 910 | 14 ± 4 | 77 ± 18 | 2.94 ± 0.63 | 31.1 ± 6.41 |
| ZTF20aaeutuz | 164.81581 | 12.483378 | 0.15 | 55 956 | 726 | 5357 | 30 ± 1 | 34 ± 1 | 2.83 ± 0.11 | 5.31 ± 0.2 |
| ZTF20aagwxlk | 153.42829 | 55.432205 | 0.15 | 52 407 | 179 | 946 | 31 ± 2 | 27 ± 8 | 3.69 ± 0.29 | 1.14 ± 0.64 |
| ZTF20aagyaug | 172.41282 | 36.883602 | 0.20 | 55 673 | 426 | 4648 | 41 ± 3 | 96 ± 2 | 1.35 ± 0.09 | 4.17 ± 0.11 |
| ZTF20aakreaa | 181.52333 | 42.169888 | 0.10 | 53 120 | 149 | 1448 | 17 ± 1 | 20 ± 10 | 4.85 ± 0.92 | 1.03 ± 2.34 |
| ZTF20aaorxzv | 132.39052 | 3.68048 | 0.08 | 52 224 | 606 | 564 | 18 ± 1 | 16 ± 16 | 1.63 ± 0.16 | 1.04 ± 0.31 |
| ZTF21abwoxbv/ZTF20aaxwxgq | 234.63610 | 46.126392 | 0.20 | 52 781 | 559 | 1332 | 11 ± 3 | 68 ± 10 | 2.47 ± 0.74 | 56.73 ± 9.03 |
| ZTF20abcvgpb* | 238.24977 | 21.046358 | 0.17 | 53 557 | 220 | 2171 | 49 ± 4 | 44 ± 1 | 2.98 ± 2.3 | 11.77 ± 0.69 |
| ZTF20abgnlgv | 232.52715 | 7.172269 | 0.13 | 54 208 | 322 | 1820 | 41 ± 2 | 35 ± 1 | 3.98 ± 0.38 | 4.8 ± 0.17 |
| ZTF21aafkiyq | 174.93478 | −1.727439 | 0.11 | 52 294 | 614 | 327 | 18 ± 2 | 54 ± 1 | 1.79 ± 0.23 | 4.42 ± 0.17 |
| ZTF21abcsvbr | 184.64829 | 18.771713 | 0.22 | 54 477 | 299 | 2611 | 19 ± 4 | 44 ± 1 | 1.37 ± 0.25 | 5.35 ± 0.29 |
| ZTF19abixawb | 2.56204 | 0.13912 | 0.10 | 51 793 | 516 | 388 | 8|$^{+3}_{-1}$| | 47.0|$^{+10}_{-0.3}$| | – | – |
| ZTF20abshfkf | 18.29924 | 1.59516 | 0.24 | 57 282 | 83 | 7859 | 7|$^{+20}_{-4}$| | 133 ± 2 | – | – |
| ZTF18accdhxv | 118.93488 | 19.39342 | 0.11 | 53315 | 306 | 1922 | 21|$^{+9}_{-1}$| | 90|$^{+3}_{-20}$| | – | – |
| ZTF19aalxuyo | 123.16978 | 7.25791 | 0.08 | 53 083 | 294 | 1757 | 2.2|$^{+5}_{-0.4}$| | 54|$^{+1}_{-3}$| | – | – |
| ZTF19aaxdiui | 325.19182 | 9.27550 | 0.40 | 55 475 | 234 | 4093 | – | – | – | – |
| ZTF18abtizze | 327.73225 | −1.11506 | 0.09 | 53172 | 138 | 1031 | 3|$^{+21}_{-1}$| | 13|$^{+1}_{-4}$| | – | – |
For the 36 observed sources from our CL candidates, we distinguish the 19 confirmed CL AGNs as the CL sample (including the four CLs reported in LN22) and the 17 not confirmed CLs as the NOT CL sample (including two such sources reported in LN22).
4 RESULTS
4.1 Improvement of the selection method: ALeRCE features for the alert light curves
All the CL candidates considered in this work have generated at least six ZTF alerts in either g or r band and have been classified by the AleRCE LCC. An alert is generated when a 5σ variation in the template-subtracted image occurs. In this section, we analyse the variability of the sample to determine whether the CL phenomenon is related to any physical parameter or if we can make other improvements to the selection method and thereby to the CL candidate list.
The LCC uses a total of 174 features, most of them computed solely with the public ZTF g and r data. The complete set of features is described in the ALeRCE website1, and can be requested using the ALeRCE python client. In this work, we separate the features that dominate the classifier (both the ‘Top’ level and the ‘Stochastic’ level of the LCC) as reported in Sánchez-Sáez et al. (2021a) and the secondary, not-ranked features. For comparison, we obtained the features for the known AGNs that were used to train the LCC, which includes the Weak Type 1 sources from Oh et al. (2015) and the host-dominated AGNs (class ‘A’) from MILLIQUAS, totalling 4612 sources.
4.1.1 Top-ranked variability and colour features
Most of the features that dominate the LCC consist of ZTF and AllWISE colours and variability features related to the amplitude and time-scale of the variability and to a decrease/increase of the luminosity. In order to evaluate the difference in distribution of these features between the CL and NOT CL samples we applied the Kolmogorov–Smirnov (KS) test to all their ranked-features. In Table 2 we present the features that dominate the LCC and have a p-value <0.05, that is, where we can reject the null hypothesis that the two distributions (from the CL and the NOT CL samples) are identical.
Features that show different distributions for the CL and the NOT CL samples. Features recovered for both the alert light curves and the forced photometry light curves are highlighted in bold.
| Name | Filter | Description |
|---|---|---|
| Top ranked variability and colour features used in the LCC | ||
| SF|$\_$|ML|$\_$|amplitude | g | rms magnitude difference of the structure function computed over a one year time-scale |
| MHPS|$\_$|low | g | Variance associated with the 100 d time-scale (‘low’ frequency) |
| SPM|$\_$|tau|$\_$|rise | g | Initial rise time-scale from the supernova parametric model |
| GP|$\_$|DRW|$\_$|sigma | g | Amplitude of the variability at short time-scales, from the damp random walk (DRW) model |
| GP|$\_$|DRW|$\_$|tau | g | Relaxation time from the DRW model |
| IAR|$\_$|phi | g | Level of autocorrelation from an irregular autoregressive (IAR) model |
| positive|$\_$|fraction | g,r | Number of detections in the difference images that are brighter than the template |
| delta|$\_$|mag|$\_$|fid | g | Difference between the maximum and minimum observed magnitudes in a given band |
| r–W3 | colour computed using the ZTF mean r magnitude and the AllWISE W3 filter | |
| g|$\_$|r|$\_$|mean|$\_$|corr | ZTF g–r colour using the mean magnitudes of each band | |
| g|$\_$|r|$\_$|max | ZTF g–r colour using the brightest magnitudes of each band | |
| Other features used in the LCC | ||
| n|$\_$|pos | g,r | Number of positive detections in the alert light curve |
| n|$\_$|neg | g,r | Number of negative detections in the alert light curve |
| iqr | g | Difference between the 3rd and the 1st quartile of the light curve |
| MHPS|$\_$|ratio | g | Ratio between the variances at 100 d and 10 d time-scales for a given band, applying a Mexican hat filter |
| Variability features for the forced-photometry light curves | ||
| SPM|$\_$|A | r | Amplitude from the supernova parametric model |
| LinearTrend | g,r | Slope of a linear fit to the light curve |
| ExcessVar | g | Intrinsic variability amplitude |
| Meanvariance | g | Ratio of the standard deviation to the mean magnitude |
| Std | g | Standard deviation of the light curve |
| Amplitude | g | Half of the difference between the median of the maximum 5% and of the minimum 5% magnitudes |
| SPM|$\_$|tau|$\_$|rise | g, r | See above |
| MHPS|$\_$|low | r | See above |
| MHPS|$\_$|ratio | r | See above |
| GP|$\_$|DRW|$\_$|sigma | g,r | See above |
| SF|$\_$|ML|$\_$|amplitude | g,r | See above |
We note that the DRW parameters determination is generally biased for light-curve lengths shorter than 10 times the true τ value (Kozłowski 2017; Sánchez et al. 2017), which is the case of our ZTF data. Therefore, the DRW parameters obtained in this work should be considered just as variability features and not as physically correct estimations.
In Fig. 1 we show the distribution of some of the variability features computed in the g band that present different distributions between the CL and NOT CL sources. In particular, the DRW relaxation time for the NOT CL objects peaks at the minimum data sampling (∼ 1 d), and spreads up to >1000 d, larger than the maximum light-curve length. This indicates a DRW model is unable to properly model the optical variability for some NOT CLs, and thus it is unlike Type-1 AGN. For the CLs however, the DRW relaxation time peaks at 10–100 d as expected for Type 1 AGNs. In terms of the amplitude of the variability, from the GP|$\_$|DRW|$\_$|sigma distributions we see that some NOT CL objects reach much smaller values (log10(GP|$\_$|DRW|$\_$|sigma) <−6), which again indicates they have most likely been misclassified as Type 1 AGN by the LCC. Interestingly, the amplitude of the variations for all our objects peaks at a smaller value than the distribution for the AGN training set, suggesting their variability could be diluted by the host galaxy contribution. On the other hand, the autocorrelation of the light curves, given by the IAR|$\_$|phi parameter, reaches smaller values for the NOT CL sample than for the CL sample. These features could be used to further clean the CL candidate list.
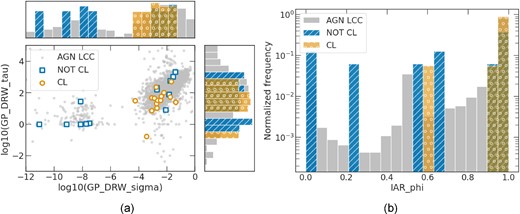
Distributions of the alert light curves top-ranked variability features for the CL and NOT CL samples and the AGN LCC training set: (a) relaxation time and amplitude of the variability on short time-scales, obtained from the damp random walk (DRW) model; and (b) level of autocorrelation from an irregular autoregressive (IAR) model. These features show distinct distributions between the CL and NOT CL samples and could be used to select the most promising CL candidates.
Apart from the variability features, the classifier is also dominated by ZTF and AllWISE colours and the morphological properties of the images. In general, the optical colours for both samples look similar to each other but show a redder tendency than the AGN training set distribution, as shown in Fig. 2(a). In Fig. 2(b) we present the 2010–2011 AllWISE W1–W2 versus the W2–W3 colours for the CL and NOT CL objects, in comparison to the Type 2 parent sample and the AGN training set. Most of our objects have fairly similar AllWISE colours, but the distribution of the W1–W2 colour peaks at a lower value than the AGN training set and closer to the Type 2 distribution, which implies that the MIR colours are generally dominated by the stellar populations. We note that the AllWISE observations were taken between 2010 and 2011, so these features are not indicative of their current MIR colour. We further investigate the behaviour of the MIR colours in Section 4.2.4, including contemporaneous WISE observations.

Alert light curves top-ranked colour features for the CL and NOT CL samples and the AGN LCC training set: (a) g–r colour obtained with ZTF data and (b) AllWISE MIR colours in comparison with the Type 2 parent sample. Both the CL and NOT CL samples show optical and MIR colours more host-galaxy dominated than the AGN LCC training set.
4.1.2 Not-ranked features
The top-ranked features are the most important features that the LCC uses for the classification of variable sources. However, there are secondary features that could potentially allow us to evaluate whether a source is a good CL candidate or not. In Table 2 we present other secondary features showing distinct distributions between the CL and NOT CL samples. A particular example is the number of positive detections in the alert light curves (n|$\_$|pos, see Fig. 3), which reaches higher values for the CL sample, meaning that CL objects tend to increase more their flux with respect to the template image (as expected for turning-on events).
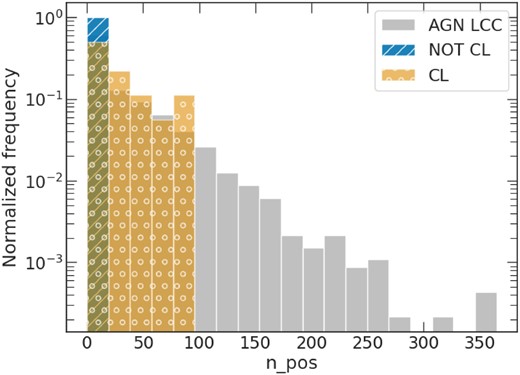
Number of positive detections in the alert light curves for the CL and NOT CL samples and the AGN LCC training set, where the CL sample tends to increase their optical flux.
4.2 Characteristics of the CL versus NOT CL AGNs
4.2.1 BPT diagnostics
To investigate the emission-line properties of the samples, we calculated the BPT (Baldwin, Phillips & Terlevich 1981) diagnostics from the archival SDSS spectra. We used the classification system defined by Kewley et al. (2006) for different ionization mechanisms utilizing the three BPT diagnostic criteria ([N ii], [S ii], and [O i]) and found all sources are consistent with a Seyfert classification. The KS-test leads to large p-values >0.4 for the three cases, showing that these samples are indistinguishable in terms of the emission lines properties from their old (pre-CL) optical spectra. Similar results were found by analysing second epoch spectra. As an example, the [S ii] BPT diagram for the CL and NOT CL samples is plotted in Fig. 4.

4.2.2 Eddington ratio estimates
We estimated the black hole masses (MBH) and continuum luminosity at 5100 Å (L5100) using the full-width at half-maximum (FWHM) and luminosity of broad H α as outlined in Reines, Greene & Geha (2013), using the values obtained from the new spectra. Then, we computed the Eddington ratios for the old and new spectra |$\lambda _{\rm \rm Edd}=L_{\rm bol}/L_{\rm Edd}$|, where LEdd = 1.5 × 1038(MBH/M⊙) erg s−1 is the Eddington luminosity and Lbol is the bolometric luminosity defined as Lbol = 40 × (L5100/1042)−0.2 erg s−1 according to Netzer (2019). In Fig. 5 we present |$\lambda _{\rm \rm Edd}$| for both samples computed for the old (|$\lambda _{\rm \rm Edd1}$|) and new spectra (|$\lambda _{\rm \rm Edd2}$|), and the difference of accretion rate (|$\Delta \lambda _{\rm \rm Edd}$|). We find that the old accretion rate is similar for both samples, but in the second epoch spectra the distribution shifts towards higher values for the CLs. These are the expected results for turning-on AGNs, since both the method to compute |$\lambda _{\rm \rm Edd}$| and the criteria to confirm the sources as CL (e.g. >3σ change in the EW of broad H α) use the properties of broad H α.
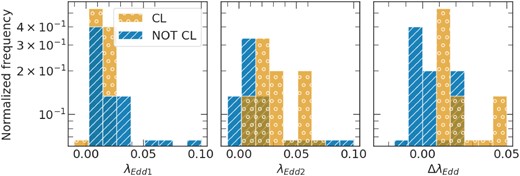
Eddington ratios for the CL and NOT CL samples obtained from the archival SDSS spectrum (left-hand panel) and current spectra (middle panel), and their difference (|$\Delta \lambda _{\rm \rm Edd}$| = |$\lambda _{\rm \rm Edd2}-\lambda _{\rm \rm Edd1}$|, right-hand panel). CL objects have increased their Eddington ratios and are now accreting at 1–5 per cent LEdd.
4.2.3 ALeRCE features for the forced-photometry light curves
To compare with the alert light curves, we also analysed variability in the full forced-photometry light curves, which are produced based on all ZTF difference images available. We requested the most updated forced photometry (up to 2022 September 26) of the entire sample from the ZTF forced-photometry service and generated the cleaned light curves according to the recommendations outlined in Masci et al. (2019). A python library to extract variability features in astronomical light curves is publicly available.2 The forced-photometry light curves have a mean of 376 (453) data points in the g (r) filter, in comparison with the 30 (27) detections from the alert light curves. As a result, the variability features can be better constrained and we find more top-ranked features that show different distributions according to the KS-test between the CL and NOT CL samples, as shown in Table 2. We recover many variability features related to the amplitude of the variations and the deviations from the mean (e.g. ExcessVar, Meanvariance or Std), which are missing in the comparison of features from the alert light curves. Fig. 6 shows the amplitude and the standard deviation in the g filter for the forced-photometry light curves for both samples. The CL objects present generally higher values for both features, indicating that their variability is more similar to the expected Type 1 behaviour than the NOT CL sample.
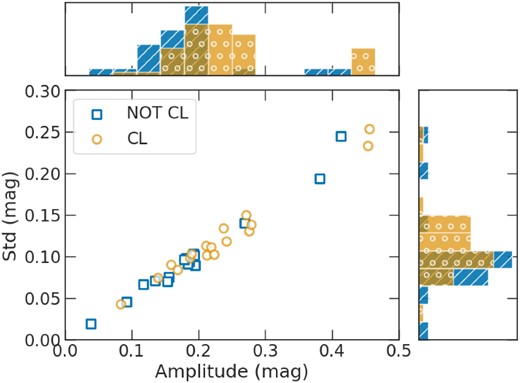
Amplitude and standard deviation in the g filter for the CL and NOT CL forced-photometry light curves. CL objects present higher values for both features, indicating a stronger optical variability.
4.2.4 Mid-infrared variability
Some of the features that the LCC uses to classify variable objects are computed with AllWISE data, which are indicative of the state of the sources ten years ago. To investigate whether the CL and NOT CL samples show distinct MIR behaviour we downloaded all the AllWISE multi-epoch and NEOWISE-R single exposure (L1b) photometric data spanning from 2010 to 2021 and averaged every six months. For each source, we obtained the following variability features for the W1 and W2 bands: the maximum magnitude and colour variations (ΔW1, ΔW2, ΔW1–W2), the colour from the last epoch (W1–W2f), the intrinsic variability (σm1 and σm2) computed as in Lyu et al. (2022) and the slopes of a linear trend fit to the MIR magnitude light curves (a1 and a2) and to the W1–W2 colour (a12). Table 3 shows the comparison between the median values with the 1σ errors for the CL and NOT CL samples. All the features except for the maximum colour variation ΔW1–W2 show distinct distributions according to the KS-test, with CL sources having a stronger variability. Moreover, the results from the linear fits indicate that the CLs have become brighter in both bands and have higher W1–W2 values (see Figs 7 and A1), whereas for the NOT CL the distributions peak closer to zero resulting in no net increase or decrease in brightness or colour.
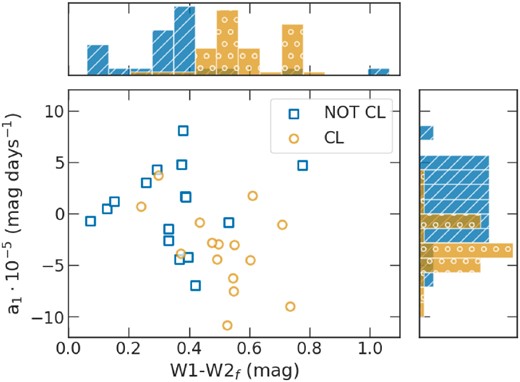
Distributions of the linear slope of the W1 10-yr-long light curve (a1) and the last epoch colour (W1–W2f) for the CL and NOT CL samples. The lower a1 values for the CL sample indicates the sources are getting brighter in the MIR waveband, while the slopes for the NOT CL distribute around zero, indicating that as a sample they are neither brightening nor dimming. The higher last epoch colour (W1–W2f) for the CLs is expected for AGN-dominated galaxies (W1–W2 >0.5).
Mid-infrared variability features. Asterisks indicate the features that show distinct distributions between the samples according to the KS-test (p-value<0.05). The errors correspond to the 1σ deviation from the median.
| Feature | CL | NOT CL |
|---|---|---|
| 〈ΔW1〉 (mag)* | 0.5|$^{+0.3}_{-0.1}$| | 0.4 ± 0.2 |
| 〈ΔW2〉 (mag)* | 0.7 ± 0.3 | 0.5|$^{+0.1}_{-0.3}$| |
| 〈ΔW1–W2 〉(mag) | 0.3|$^{+0.2}_{-0.1}$| | 0.3|$^{+0.2}_{-0.1}$| |
| 〈W1–W2f〉(mag)* | 0.5|$^{+0.2}_{-0.1}$| | 0.4|$^{+0.1}_{-0.2}$| |
| 〈σm1〉 * | 0.15 ± 0.05 | 0.09 ± 0.07 |
| 〈σm2〉* | 0.18|$^{+0.09}_{-0.05}$| | 0.14|$^{+0.04}_{-0.09}$| |
| 〈a1〉 × 10−5 (mag−1)* | |$-4^{+4}_{-9}$| | 0.5|$^{+4}_{-5}$| |
| 〈a2〉 × 10−5 (mag−1)* | |$^{+9}_{-13}$| | 2|$^{+4}_{-8}$| |
| 〈a12〉 × 10−5(mag−1)* | 2|$^{+3}_{-4}$| | 0|$^{+3}_{-2}$| |
4.2.5 X-ray variability
In order to obtain the X-ray fluxes of our sources, we have used the individual eROSITA (extended ROentgen Survey with an Imaging Telescope Array; Predehl et al. 2021) All-Sky Surveys (eRASS1 to eRASS5). The data were processed with the eROSITA Standard Analysis Software System (eSASS; Brunner et al. 2022). We used the newest available pipeline processing version c020 which is an updated version of the software used for the first eROSITA Data Release (Merloni et al., in preparation).
The counterparts are determined using the same procedure adopted in the eROSITA/eFEDS field (Salvato et al. 2022), but applied to Legacy Survey DR103 and Gaia DR3 separately. After the identification of the CL candidates with the counterparts, we obtained the 0.2–2.3 keV flux from the corresponding eROSITA catalogue (see Brunner et al. 2022 for a description of the eROSITA catalogue processing).
From our list of 61 CL candidates, there are 28 sources within the eROSITA-DE footprint (Galactic longitude 179.9442 < l < 359.9442 deg): 11 CLs, seven NOT CLs and ten CL candidates without a second epoch optical spectrum. From the CLs, ten sources have at least one detection within the five different eRASS, and one (ZTF18aawoghx) has only upper limits. The upper limits are calculated based on X-ray photometry on the eROSITA standard pipeline data products (science image, background image, and exposure time) following the Bayesian approach described by Kraft, Burrows & Nousek (1991). For details about eROSITA upper limits, see Tubín-Arenas et al. (in preparation). We consider a circular aperture with a radius given by a PSF encircled energy fraction of EEF = 0.75 (∼30 arcsec) and a single-sided 3σ confidence level. From the NOT CLs, four sources have been detected in at least one eRASS. The remaining three (ZTF18acgvmzb/ZTF18aclfugf, ZTF19aaixgoj, and ZTF20aaorxzv) have only upper limits. Interestingly, six CL sources show an X-ray flux increase between eROSITA scans by factors of 2 to 15 times. For two sources (ZTF19aavyjdn and ZTF21abcsvbr) the difference between the maximum and the minimum values is similar to the error of the minimum value. For the remaining four sources (ZTF18accdhxv, ZTF19aalxuyo, ZTF21aafkiyq, and ZTF21aaqlazo) the difference is at least eight times the error (see Fig. 8).
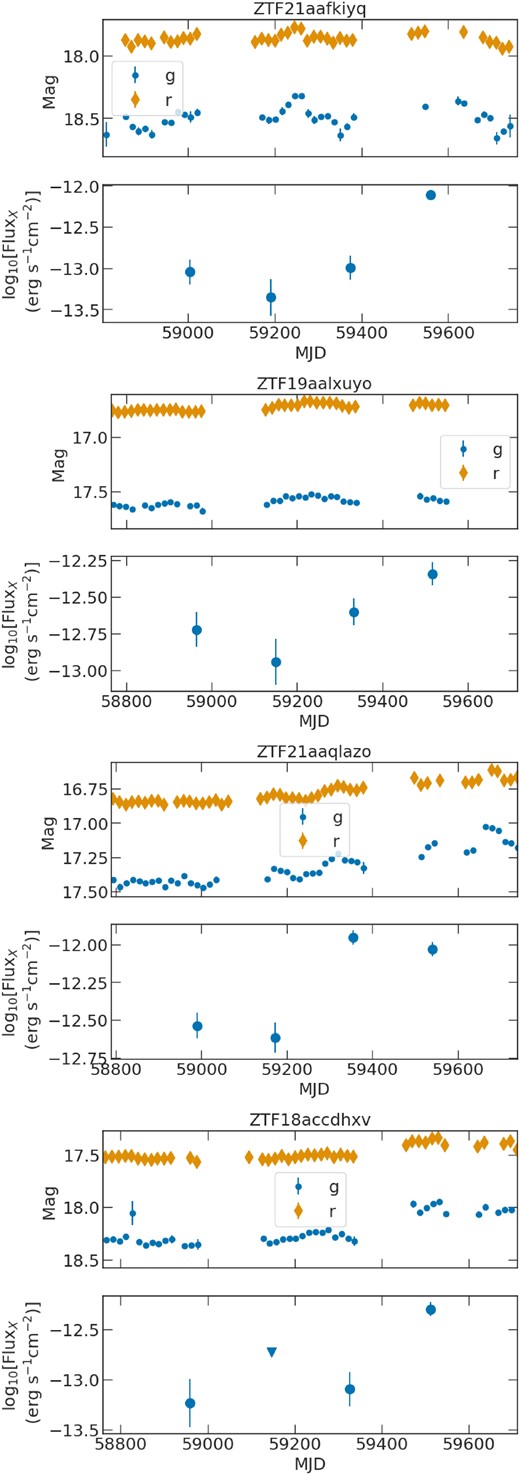
ZTF forced-photometry light curves and contemporaneous eROSITA fluxes in the 0.2–2.3 keV band. The triangle in the last plot indicates an upper limit. These sources experience an increase in their X-ray flux during the eROSITA monitoring.
We also checked archival X-ray fluxes from other missions to compare to the eROSITA fluxes. All the 11 CLs and 7 NOT CLs in the eROSITA-DE footprint have at least one X-ray upper limit from either the XMM–Newton Slew (Saxton et al. 2008) or ROSAT Survey (Boller et al. 2016). However, due to the low sensitivity of the data, most of the archival upper limits fall above the current eROSITA measurements. This hinders us from finding the possible changes, with the notable exception of four of the CLs that show a significant (⪆1.5σ) increase in the eROSITA 2021 flux with respect to the archival 1990–1993 ROSAT 1σ upper limits or fluxes, which are shown in Table 4. In the table, we converted the observed ROSAT fluxes to the 0.2–2.3 keV band for a direct comparison, using an absorbed power-law model with photon index Γ = 2 and column density NH = 3 × 1020 cm−2. These sources are also the CLs that experience a significant X-ray increase during the eROSITA monitoring as shown in Fig. 8.
0.2–2.3 keV X-ray fluxes for four CL sources that show an increase between the archival 1990–1993 ROSAT 1σ upper limits or fluxes and the 2021 eROSITA data.
| ZTF ID | ROSAT flux | eROSITA flux |
|---|---|---|
| · 10−13 erg s−1 cm−2 | · 10−13 erg s−1 cm−2 | |
| ZTF18accdhxv | <2.853 | 5.0 ± 0.8 |
| ZTF19aalxuyo | <3.279 | 4.6 ± 0.8 |
| ZTF21aafkiyq | <1.049 | 7.7 ± 0.9 |
| ZTF21aaqlazo | 0.51 ± 0.06 | 11.1 ± 0.1 |
| ZTF ID | ROSAT flux | eROSITA flux |
|---|---|---|
| · 10−13 erg s−1 cm−2 | · 10−13 erg s−1 cm−2 | |
| ZTF18accdhxv | <2.853 | 5.0 ± 0.8 |
| ZTF19aalxuyo | <3.279 | 4.6 ± 0.8 |
| ZTF21aafkiyq | <1.049 | 7.7 ± 0.9 |
| ZTF21aaqlazo | 0.51 ± 0.06 | 11.1 ± 0.1 |
To compare the eROSITA fluxes between the CL and NOT CL sources, we selected the last X-ray detection within the five eRASS, or the last eROSITA upper limit for the sources without detections. We also computed the ratio between the X-ray flux and the optical flux in the g band, obtained from the ZTF forced photometry light curves. To avoid spurious results coming from variability, we chose pairs of contemporaneous fluxes, i.e. that were taken within the same days or week in the X-ray and optical bands. The results are plotted in Fig. 9, which shows the CL sources are generally brighter in the X-ray band than the NOT CL sources, both in absolute terms and relative to their g band fluxes. The KS-test indicates the X-ray flux distribution is significantly distinct between the CL and NOT CL samples (p-value <0.05), both considering just detections (p-value = 0.01) and considering detections and upper limits (p-value = 0.01). However, the X-ray to optical ratio distributions are not significantly distinct according to the KS-test, either considering just detections (p-value = 0.08) or considering detections and upper limits (p-value = 0.10). Therefore, although the X-ray to optical ratios tend to be higher for the CLs than for the NOT CLs, the difference is not statistically significant for the sources considered in this work, and more extended samples are needed to improve the statistics in terms of the X-ray behaviour for CLs.
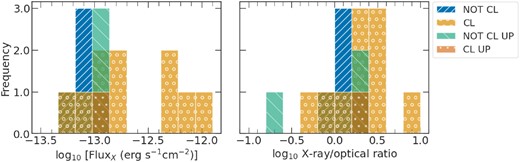
Distributions of the 0.2–2.3 keV eROSITA fluxes (left-hand panel) and ratios between the 0.2–2.3 keV flux and the g-band flux from the ZTF forced photometry light curves, taken within the same day or week (right-hand panel). UP indicates the eROSITA upper limits.
As a final step we also checked the harder, 2.3–5 keV eROSITA fluxes. Most of the sources have just upper limits in this band, thus we cannot draw further conclusions about the X-ray spectral shape.
5 THE ORIGIN OF THE NOT CL SOURCES
The previous section showed that the CL and NOT CL samples are significantly different in terms of their optical, MIR, and X-ray flux variability properties, with the CLs showing stronger optical and MIR variability with a tendency to increase their MIR flux and the colour W1–W2 over time. In order to understand the nature of the NOT CL sources we visually inspected the ZTF forced photometry and alert light curves and the reference images used by ZTF to compute the difference images. In Table 5 we present the characteristics of the variability in individual NOT CL objects, indicating the most probable cause of their variations. As a result, we find two sources that have been most likely misclassified by the LCC due to a small number of alerts (ZTF20aakreaa and ZTF20aaorxzv) and another two sources are possibly false detections due to a bad template image subtraction (ZTF18acgvmzb/ZTF18aclfugf and ZTF18acusqpt/ZTF18adppkkj). Three sources apparently show a transient event (that is, a flare-type variation in an otherwise flat curve) in the optical light curves: two of them resemble SN events (ZTF18aaiwdzt and ZTF18aaqjyon) and one shows a sharp rise in the optical, followed by an MIR echo, which we speculate could be due to a TDE. The occurrence of TDEs in turning-on AGNs is theorized to be more likely than in other galaxies, due to the possibility of ‘Starfall’ (McKernan et al. 2022). This TDE candidate in a Type 2 AGN (shown in Fig. 10) could potentially be happening in a turning-on AGN whose BELs are still too weak to be detected, and merits further study which is beyond the scope of this paper. This discovery highlights the possibility of finding TDE candidates in AGNs, in order to compare their rate of occurrence to TDEs in quiescent galaxies.
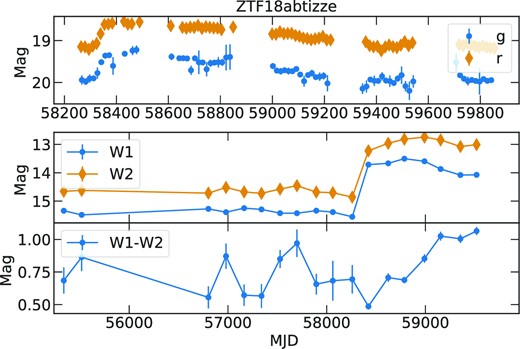
Optical ZTF forced-photometry light curves and evolution of the WISE MIR fluxes and W1–W2 colour for a TDE candidate belonging to the NOT CL sample. Note the different time-scales of the ZTF and WISE data: the optical monitoring starts at the end of the MIR light curves.
Characterization of the NOT CL sources analysed in this work. decr. denotes a decreasing trend in the optical forced-photometry or MIR light curve. var. denotes a variable trend. Dashes denote the light curve is fairly flat. Slashes denote no available eROSITA-DE data. Asterisks denote the two NOT CLs reported in LN22.
| ZTF ID | Optical flux | MIR flux | MIR colour | 0.2–2.3 keV flux | Most likely cause |
|---|---|---|---|---|---|
| variability | trend | W1–W2 | (· 10−14 erg s−1 cms−2) | ||
| ZTF18aaiescp | yes, decr. | decr. | 0.5–0.3 | / | Weak Type 1 |
| ZTF18aaiwdzt | transient | decr. | 1–0.7 | / | Transient event in the optical light curve |
| ZTF18aaqjyon | transient | – | < 0.3 | / | Transient event in the optical light curve |
| ZTF19aabyvtv/ZTF18aayyapb | yes, decr. | decr. | decr. <0.4 | / | Weak Type 1 |
| ZTF18acgvmzb/ZTF18aclfugf | no | decr. | decr. < 0.5 | < 9.9 | Bogus, bad image subtraction |
| ZTF18achdyst | yes, decr. | decr. | decr. < 0.5 | 8 ± 3 | Weak Type 1 |
| ZTF18acusqpt/ZTF18adppkkj | no | var. | < 0.3 | 8 ± 3 | Bogus, bad image subtraction |
| ZTF19aaixgoj | yes, decr. | decr. | decr. < 0.5 | <11 | Weak Type 1 |
| ZTF19aapehvs | yes, decr. | decr. | decr. < 0.5 | / | Weak Type 1 |
| ZTF19aavqrjg | yes | – | ∼0.45 | 6 ± 3 | Type 1 (BELs) |
| ZTF20aaeutuz | yes, decr. | decr. | decr. < 0.5 | 13 ± 5 | Weak Type 1 |
| ZTF20aagwxlk | yes, decr. | decr. | decr. 0.8–0.4 | / | Weak Type 1 |
| ZTF20aakreaa | no | var. | 0.2–0.6 | / | Misclassified, small number of alerts |
| ZTF20aaorxzv | no | – | ∼ 0.2 | < 9.5 | Misclassified, small number of alerts |
| ZTF20abgnlgv | yes | var. | 0.4–0.6 | / | Type 1 (BELs) |
| ZTF18abtizze * | yes | var. | 0.4–1 | / | Possible TDE |
| ZTF19aaxdiui * | yes, decr. | decr. | decr. 0.6–0.2 | / | Weak Type 1 |
Notably, the remaining ten sources show small-amplitude, stochastic optical variations, characteristic of Type 1 AGNs. This is also consistent with their optical spectra, which show weak broad H α emission lines, indicative of weak Type 1 AGNs. Interestingly, eight of these ten objects show a decrease in their optical flux along with a decrease in their MIR flux and the colour W1–W2, which suggests they are now transitioning to a dimmer state. Fig. 11 shows the optical and MIR light curves of two clear examples of this behaviour, ZTF19aapehvs and ZTF20aagwxlk. Generally, the MIR colours from these NOT CL weak Type 1s are galaxy dominated (i.e. W1–W2 < 0.5), which suggests their weaker variability and BELs are not due to an orientation effect, but to an intrinsically lower AGN luminosity diluted by the emission of the host galaxy. The remaining two sources, ZTF19aavqrjg and ZTF20abgnlgv, also show Type-1 like variability and stronger broad H α emission (EW H α SDSS > 40 Å), indicative of Type 1 AGNs.
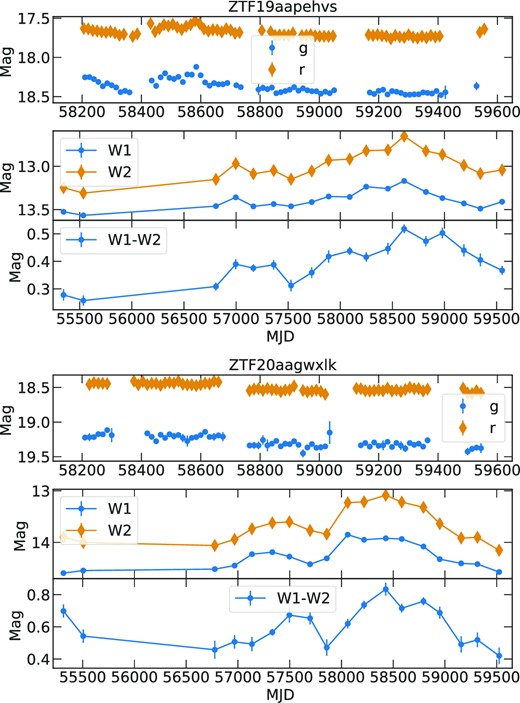
Optical ZTF forced photometry light curves and evolution of the WISE MIR fluxes and W1–W2 colour for two NOT CLs sources. Note the different time-scales of the ZTF and WISE data: the optical monitoring starts at the end of the MIR light curves, where there is a dimming in the MIR emission. This evolution suggests the sources are now transitioning to a dimmer state.
6 DISCUSSION
6.1 Improvement of the CL selection method through ALeRCE
One of the main aspects of the selection of CL candidates through ALeRCE relies on the correct classification of their alert light-curve variability by the LCC. As mentioned in Section 5, there are seven out of 17 NOT CLs that have been misclassified by the LCC due to a bad subtraction of the ZTF images used to compute the alerts, a small number of data points and/or transient events in the alert light curves. On the other hand, we also found that ten (∼60 per cent) NOT CLs have been correctly classified by the LCC as Type 1 AGN and are spectroscopically consistent with being weak Type 1 AGNs whose optical and MIR properties are dominated by the host galaxy contribution.
Therefore, the most straightforward way to select the most promising CL candidates consists of including other requirements for the sources to be varying as luminous Type 1 AGNs. This can be done by delimiting the variability features given by ALeRCE solely, in particular the features showing different distributions between the CL and NOT CL sources. The limiting values for cleaning the sample can be chosen according to different criteria. Here, we will take the 16th percentile of the variability features from the CL sample as a limiting lower value, as shown for the g band in Table 6. In the table we also show the percentage of NOT CL sources with the variability features having equal or lower values than the actual limiting value, which could be cleaned from the sample. It can be seen that most of the features by themselves are able to discard around 50–60 per cent of NOT CLs (with the exception of the colour features), at the expenses of the 16–20 per cent of CLs.
Variability and colour features in the g band that can be used to clean the CL candidate list. The limiting lower values correspond to the 16th percentile obtained for the CL sample. The third column indicates the percentage of NOT CL sources that can be discarded by limiting each feature to its limiting value.
| Feature | Limiting value | Per cent cleaning |
|---|---|---|
| positive|$\_$|fraction | 0 | 56 |
| SF|$\_$|ML|$\_$|amplitude | −0.2 | 56 |
| SPM|$\_$|tau|$\_$|rise | 44 | 50 |
| GP|$\_$|DRW|$\_$|sigma | 4×10⁻⁵ | 56 |
| GP|$\_$|DRW|$\_$|tau | 9 | 56 |
| IAR|$\_$|phi | 0.97 | 44 |
| MHPS|$\_$|low | 0.012 | 63 |
| delta|$\_$|mag|$\_$|fid | 0.17 | 56 |
| r–W3 | 6.7 | 6 |
| g|$\_$|r|$\_$|mean|$\_$|corr | 0.60 | 18 |
| g|$\_$|r|$\_$|max | −0.10 | 12 |
| n|$\_$|pos | 0 | 56 |
| iqr | 19.7 | 63 |
It is possible to increase the completeness of the CL candidate list as well as the purity by applying two additional criteria on the ALeRCE features simultaneously. The best combinations in the g band, with a loss of 0–5 per cent of CLs and removal of 50 per cent of NOT CLs, were found to be all the possible pairs between GP|$\_$|DRW|$\_$|sigma, GP|$\_$|DRW|$\_$|tau, and delta|$\_$|mag|$\_$|fid, and the combinations of iqr with MHPS|$\_$|low or delta|$\_$|mag|$\_$|fid. We note that our samples are too small to judge the universality of this additional cleaning with bootstrap methods. However, similar cleaning can be devised in the future for ZTF forced photometry and/or the classifications of the ZTF data release light curves (Sánchez-Sáez et al. 2023), which would help us to improve the selection of CL candidates.
6.2 Characterizing the turning-on CL properties
Apart from the ALeRCE LCC features, we have analysed other multiwavelength properties of the sample to investigate what can increase the likelihood of finding a turning-on transition.
6.2.1 BPT diagrams
While most of the reported CLs in the literature are Seyferts, some of them have been found to lie on the borderline between a LINER and Seyfert classification, with extreme order-of-magnitude changes in continuum and emission-line flux compared to less dramatic CLs occurring in Seyferts (Frederick et al. 2019).
Here, we tested whether the CL transitions could be related to the emission-line properties of the sources by computing the line-ratio diagnostic diagrams involving the line ratios [O iii]/H β, [N ii]/H α, [O i]/H α, and [S ii]/H α (Baldwin et al. 1981; Kewley et al. 2006). By selection, all our CL candidates are consistent with a Seyfert classification, and the BPT criteria indicate that the line ratios from both their archival and new optical spectra distribute similarly, regardless of whether they experience a CL transition or not.
6.2.2 Forced photometry variability
Due to a higher number of data points, analysing the complete light curves (instead of the alert curves) gives us a much more reliable determination of the variability of the sources. In general, we find a stronger variability typical of luminous Type 1 AGNs in the CL sample (during or post-transition), which indicates that most of the candidates with non-variable BELs (i.e. the NOT CL sample) belong to a different population. Recently, ZTF light-curve variability analysis has been found to be a powerful tool to seek new CL candidates. In López-Navas et al. (2023), by analysing ZTF forced photometry light curves of ∼ 15 000 Type 2 AGNs, we were able to distinguish between weak Type 1 and Type 2 sources and select CL candidates that have also been found through ALeRCE in the work presented here. Sánchez-Sáez et al. (2021b) used light curves from ZTF data release 5 (ZTF DR5) instead, and applied deep learning techniques to find anomalous behaviour in AGNs, leading to the identification of 75 promising CS candidates.
6.2.3 MIR variability
The study of the photometric variability in the MIR band can help us understand the physical mechanisms that may be involved in CL events. This emission is believed to come from dust thermally heated by the AGN, which emits relatively unimpeded by dust extinction. Indeed, simple W1–W2 (i.e. [3.4] − [4.6] μm) colour cuts with WISE data are able to reliably differentiate AGNs from stars and galaxies (e.g. W1–W2 ≥ 0.8; Stern et al. 2012). Along these lines, an important feature in our analysis is a12, which indicates the linear trend of the W1–W2 colour. Our CL sample shows a general upward trend during the last ∼11 yr, indicating a redder colour in the MIR band. This behaviour is consistent with a turning-on transition, where the sources change from galaxy-like (i.e. W1–W2 <0.5) to AGN-like (i.e. W1–W2 > 0.8) MIR colour, as it has been found in previous CL studies (Sheng et al. 2017; Yang et al. 2018; Sheng et al. 2020; Lyu et al. 2022). This phenomenon can be explained by an increase of the brightness of the AGN, which illuminates the torus and produces a stronger contribution of hot dust in the W1 and W2 bands, with a larger effect on the latter. This scenario is supported by the observed W1 and W2 fluxes in our CL sample, which also show an upward trend given by the slopes a1 and a2.
To estimate the variability of the CLs in comparison with the NOT CL sample, we computed the parameters 〈σm1〉 and 〈σm2〉 (indicative of the intrinsic variability) and the maximum variations of W1 and W2 (〈ΔW1〉 and 〈ΔW2 〉) as in Lyu et al. (2022). Those authors present a study of the variability of the W1 and W2 light curves of a population of CLs in comparison with low-luminosity AGN and QSO samples. They also use the AllWISE multi-epoch photometry and NEOWISE single exposure (L1b) source table data, though we average the data every six months. Our results, presented in Table 3, are consistent with their conclusions. On the one hand, we find that the CL population has a higher 〈σm1〉 and 〈σm2〉 variability than the NOT CL population. On the other hand, the CL sample exhibits maximum variations of W1 and W2 (〈ΔW1〉 and 〈ΔW2〉) greater than 0.3 mag. In the scenario of variable obscuration, Yang et al. (2018) estimate that a variation in the W1 band due to dust extinction would yield a factor of ∼21 change in the g-band magnitude, assuming the extinction curve in the optical and MIR and considering micrometre-sized grains (Wang, Li & Jiang 2015). A variation of 0.3 mag in the W1 band would lead to ∼6.3 mag difference in the g band, which is not consistent with the observed properties of CLs. Therefore, the variability and general increase in the MIR flux and the colour W1–W2 of the CL sample, over the last 11 yr, are most likely due to an intrinsic brightening of the AGN and cannot be solely explained by the motion of absorbing clouds within our line of sight.
6.2.4 X-rays
The CL sample shows higher X-ray fluxes and higher X-ray to g-band flux ratios than the NOT CL sample in the recent eROSITA scans. We note that the AGN continuum in the optical spectra of these sources is subdominant or undetectable under the starlight contribution, so a significant fraction of the g-band flux can be associated with the host galaxy. For a given host-galaxy flux, the CL sources are X-ray brighter, as expected if their AGNs are more dominant than in the NOT CL sample.
There is a relatively small number of CL sources with contemporaneous X-ray data in the literature, so it is still unclear whether these events are always accompanied by a clear change in the X-ray band. We note that we are talking about optical CLs, not X-ray CLs where the changes are due to obscuration. In the well-studied case of the CL Mrk 1018, a strong soft X-ray excess was found when the source was in the bright state, which dropped by much more than the hard X-rays when the source transitioned to the dimmest state (Husemann et al. 2016; McElroy et al. 2016). In this case, the changes in the BELs were associated with an increase/decrease of ionizing photons from the soft X-ray excess (Noda & Done 2018). Additionally, Temple et al. (2023) found that five out of nine CL events with Swift-BAT data available could be associated with significant X-ray changes in the hard 14–195 keV band. The hard band is less affected by obscuration and thus rules out a varying column density as the origin of the flux changes. In this work, we find further evidence that at least some of the CL transitions could be associated with significant X-ray flux changes. In particular, four out of the 11 CLs with eROSITA data have experienced an X-ray flux rise with respect to archival ROSAT data taken 30 yr earlier. These sources also show variable flux within the eROSITA 2019–2022 light curves, with the X-ray flux being four, eight, and up to 15 times higher than the minimum value (see Fig. 8). However, due to the small number of data points and the intrinsic X-ray variability in unobscured AGNs, we are unable to discard the possibility that these changes are purely stochastic and not related to the CL event. The CL AGN that has been most extensively observed in X-ray monitoring is 1ES 1927+654. This source was found to show dramatic changes in its X-ray spectral shape, showing the disappearance and re-appearance of the X-ray corona after the CL event (Trakhtenbrot et al. 2019; Ricci et al. 2020, 2021). The authors suggest that this particular phenomenon was caused by a TDE in an AGN. This strengthens the importance of multiwavelength campaigns studying CLs, which enable constraints on the evolution of the AGN components during the transitions.
6.3 Promising CL candidates selected through multiwavelength flux variability
The multiwavelength photometric analysis performed in this work provides a powerful tool to identify turning-on CL events, allowing us to select the most promising CL events from the candidate list we have not re-observed. In Table 7 we show the sources from our CL candidates that are currently varying in the optical according to the refined ZTF feature criteria (all the possible pairs of best combinations mentioned in Section 6.1), and that are experiencing a MIR flux and colour W1–W2 increase over time. For the sources with eROSITA-DE data, their X-ray fluxes were below the archival limits, so we did not use X-ray data as a selection criterion. In Fig. A2 we present the optical and MIR light curves for these sources. Some of them were not selected to be re-observed because they already showed obvious BELs in their archival optical spectra, such as ZTF18aaodaie and ZTF21abmjobi. However, according to their increase in the MIR fluxes and colour, it is likely that these sources now present stronger BELs and are therefore worth re-observing. We strongly encourage follow-up spectroscopy to confirm the CL behaviour in the promising candidates presented here, which will improve the statistics and refine further the selection criteria of CL candidates. We note that the cleaning criteria in the optical and the evolution of the MIR flux and colour used to select the most promising candidates are fairly independent for the redshifts considered in this work, from z = 0 to z = 0.4.
Potential CL sources from our list of CL candidates identified through their current optical variability and the criteria mentioned in the comments.
| Name | Ra | Dec | z | MJD | fiberid | plate | Comments |
|---|---|---|---|---|---|---|---|
| ZTF18aalmtum | 136.365522 | 17.928647 | 0.40 | 56 246 | 330 | 5769 | Increasing MIR fluxes and W1–W2. |
| ZTF18aaodaie/ZTF21ackxdiy | 191.572165 | 28.342741 | 0.10 | 54 205 | 442 | 2238 | Increasing MIR fluxes and W1–W2. |
| ZTF18aaoudgg | 221.975974 | 28.556697 | 0.16 | 53 764 | 134 | 2141 | Increasing MIR fluxes and W1–W2. |
| ZTF18acakoya/ZTF18abtndvk | 43.709715 | −2.797898 | 0.12 | 56 978 | 181 | 7823 | Increasing MIR fluxes and W1–W2. |
| ZTF19adcfhxp | 143.823381 | 34.320597 | 0.45 | 56 336 | 727 | 5805 | Increasing MIR fluxes and W1–W2. |
| ZTF20acpcfgt | 339.995984 | 0.860685 | 0.38 | 52 201 | 620 | 674 | Increasing MIR and optical fluxes and W1–W2. |
| ZTF21abjprnu | 230.292534 | 20.544009 | 0.14 | 54 328 | 421 | 2159 | Increasing MIR and optical fluxes. Decreasing W1–W2, but still W1–W2 > 0.7 |
| ZTF21abdvcpz | 335.843667 | 0.771973 | 0.22 | 52 140 | 454 | 375 | Increasing MIR fluxes and W1–W2. |
| ZTF21abmjobi | 358.363382 | 0.123463 | 0.17 | 52 523 | 520 | 684 | Increasing MIR and optical fluxes and W1–W2. |
6.4 Key questions about the CL phenomena
6.4.1 Frequency and time-scales
CL events have been found to occur on time-scales as short as one or two months (Trakhtenbrot et al. 2019; Zeltyn et al. 2022). However, most research to date uses archival spectral and/or photometric data to look for CL transitions, making it difficult to obtain a proper estimate of the typical CL time-scales and thus understand the drivers of such extreme variations (Stern et al. 2018). The time difference between the first and last spectral epochs for our CL sample lies between 10 and 20 yr (in the observed frame), which must be taken as an upper limit on the time-scale for these transitions. Given their low incidence rate (discussed below) it is difficult to find a large amount of CL events as they take place. However, much larger and/or intensively sampled spectroscopic campaigns, such as SDSS-V (Kollmeier et al. 2017) and 4MOST (de Jong et al. 2019) will provide better constraints on the typical CL time-scales, potentially finding shorter (weeks and even days) CL events.
Another key question we can address with our results is the occurrence rate of turning-on transitions, following the discussion in LN22. There are 30 333 AGNs classified as Type 2 (N and K types in MILLIQUAS, cleaned for weak Type 1s and LINERS) that can be detected by ZTF (Dec >−28· and r < 21 mag). From them, 178 have alerts and are classified as AGN or QSO by the LCC. The 50 per cent confirmation rate found in this work implies that 0.3 per cent of transitions can be detected by this method over an average time-span of 15 yr. Taking into account that just 10 per cent of Type 1 AGNs are variable enough to generate alerts in ZTF, we estimate a lower limit of 3 per cent of turning-on events every 15 yr (i.e. 0.2 per cent per year). These values are consistent with the results from Hon et al. (2022), who finds a minimum turn-on CL AGN rate of 3 per cent every 15 yr, and from Temple et al. (2023), who reports a CL rate of 0.7–6.2 per cent on 10–25 yr time-scales (including both turning-on and turning-off events). As a difference with respect to this work, LN22 selected the most promising candidates via visual inspection of the light curves and archival spectra, reducing the number of candidates and therefore the ratio between CL candidates to the number of objects in the parent sample. Therefore, even though the confirmation rate was higher than in this paper, they obtained a lower estimate of the total rate of change (0.12 per cent per year). In this work we did not further restrict the candidate list to the most promising candidates so the fraction of the parent sample that was considered as a candidate is larger. Even if our success rate is slightly smaller, the product of both factors leads to a somewhat larger total rate of change. We note that in both cases we are estimating lower limits to the rate of change.
6.4.2 Physical origin
In principle, several mechanisms could lead to variations in the BELs, including variable obscuration and changes in the accretion rate. Here, we find that the MIR emission, which is dominated by the dust response (i.e. from the torus) to the UV–optical variations of the central engine, tends to increase in the CL sources. Since the MIR emitting region is too large to be obscured/unobscured on time-scales of <20 yr, and the emission is much less affected by dust obscuration, we infer that the changes in the MIR waveband and by extension the CL transitions are due to changes in the accretion rate.
To explain the changes in the accretion flow at these time-scales, the proposed scenarios include instabilities in the accretion disc and major disc perturbations such as those caused by TDEs. In general, the light curves of our CL sources do not follow the power law decay t−5/3 from the peak brightness as traditionally expected for TDEs (Rees 1990). On the other hand, the values of |$\lambda _{\rm \rm Edd}$| obtained for the CL sample in their bright state are similar to the results for CL AGNs and QSOs reported in recent works (−2⪅ log|$\lambda _{\rm \rm Edd} \lessapprox -1$|; Frederick et al. 2019; MacLeod et al. 2019; Graham et al. 2020; Temple et al. 2023), and is consistent with attributing the changes in accretion rate occurring preferentially in lower activity systems. Interestingly, our sources have an Eddington ratio (post-CL) in the range 1–5 per cent LEdd, which is in agreement with the expectations from a hydrogen ionization disc instability (Noda & Done 2018; Ruan et al. 2019; Śniegowska et al. 2023). In this scenario, by analogy to the spectral transitions in black hole X-ray binaries, the changes in the structure of the inner accretion disc occur around a critical value of |$\lambda _{\rm \rm Edd} \sim$| 0.02, which is in agreement with the most recent CL studies (Graham et al. 2020; Guolo et al. 2021; Temple et al. 2023). Furthermore, our CL sources show a redder-when-brighter tendency in the MIR, with AGN-like MIR colours (i.e. W1–W2 > 0.5) when they enter the bright state, which also has been found in other CL sources (Yang et al. 2018; Lyu et al. 2022) and supports the accretion state transition.
In this scenario, either the BELs appear due to the increase of ionizing photons that excite the BLR (LaMassa et al. 2015), or the BLR itself re-appears according to the expectations in disc-wind BLR models (Nicastro 2000; Elitzur & Ho 2009). These models predict an evolutionary sequence for the BLR depending on the accretion rate, leading to different intermediate type spectral transitions and the BLR disappearance at very low luminosities (Lbol |$\lessapprox 5 \times 10^{39}M^{2/3}_{7}$| erg s−1, where M7 = M/107M⊙; Elitzur & Ho 2009; Elitzur, Ho & Trump 2014). According to the Eddington ratio estimates, none of our sources fell close to these limits, which suggests the BLR already existed in these sources but was too weakly ionized to produce detectable broad lines. On the other hand, the residual spectra in Fig. A1 show that the continuum of the CLs currently looks either flat or blue. This ‘bluer when brighter’ effect, although clearly real in quasars, could at least partially be due to differences in the relative contribution of the host galaxy as these lower luminosity AGNs change their intrinsic flux.
7 SUMMARY AND CONCLUSIONS
This paper is the continuation of work introduced in LN22, where we present a method to search for turning-on CL candidates. The selection method consists of searching for current Type-1 AGN variability in a sample of spectrally classified Type 2 AGNs, using classifications given by a random-forest based light-curve classifier, the ALeRCE LCC (Sánchez-Sáez et al. 2021a). In order to refine the selection method, we obtained second epoch spectra for 36 of our 61 CL candidates, six of which were reported in LN22, which allows the confirmation of the CL objects by quantifying the change of the BELs in comparison with the archival SDSS spectra taken 15–20 yr earlier. As a result, we find 19 (∼ 50 per cent) turning-on CL confirmations (the CL sample), and 17 sources without significant changes in their BELs (the NOT CL sample).
We have analysed the multiwavelength properties of the CL sample in comparison with the NOT CL sample to investigate what would increase the likelihood of finding a turning-on transition and understand its origin. First, we performed a variability analysis of the alert light curves from ZTF, finding several variability features that are distinct between the samples and that can be applied to select the most promising CL sources. We also find that the turning-on transitions are characterized by an increase in the WISE-MIR brightness and the MIR (W1–W2) colour, where the stronger H α emission corresponds to an AGN-dominated MIR colour (W1–W2 > 0.5 mag). The current Eddington ratio estimations for the CLs are lower than the overall Type 1 population, falling between one and five per cent LEdd. In the X-ray band, we find that the CLs tend to be flux brighter than the candidates that have not transitioned, and for four CLs we observe a significant flux increase during the 2019–2022 X-ray monitoring. These results are in agreement with previous CL/CS works, and with the expectations from an accretion-state transition as the origin of these phenomena.
We also analyse the nature of the NOT CL sources according to their optical and MIR variability. For seven out of the 17 objects, the Type 2 sources were misclassified by the LCC due to a bad subtraction of the images, a small number of data points and/or transient events in the light curves such as SNe and one case of a likely TDE. Interestingly, we also find that ten sources are consistent with a Type 1 classification, where the optical and MIR emission is dominated by the host galaxy. This translates into lower amplitude variations in the optical and MIR wavebands, weaker BELs and galaxy-dominated MIR colours (i.e. W1–W2 <0.5). Incidentally, we also find that seven of the NOT CL sources are currently decreasing their optical and MIR fluxes, suggesting they are currently transitioning to a dimmer state. The multiwavelength differences between the CL and NOT CL sources allow us to select the most promising CL candidates from our list without spectroscopic follow-up, leading to nine sources that are worth re-observing.
The use of machine learning algorithms on complete optical light curves from the ZTF or the upcoming LSST can be combined with MIR data to unequivocally identify CLs, improve the statistics, and ultimately understand the underlying physics of these phenomena.
ACKNOWLEDGEMENTS
ELN and SB acknowledge support from Agencia Nacional de Investigación y Desarrollo (ANID)/Programa de Becas/ Doctorado Nacional 21200718 and 21212344. ELN acknowledges the California Institute of Technology and the European Southern Observatory for their hospitality. PA, ELN, MLMA, and PL acknowledge financial support from Millenium Nucleus NCN 19_058 (TITANs). PA acknowledges financial support from the Max Planck Society through a Partner Group between MPA and the University of Valparaíso. LHG acknowledges funds by ANID – Millennium Science Initiative Program – ICN12_009 awarded to the Millennium Institute of Astrophysics (MAS). PL acknowledges partial support from FONDECYT through grant N° 1201748. PSS acknowledges funds by ANID grant FONDECYT Postdoctorado N° 3200250. MJG acknowledges partial support from the NSF grant AST-2108402. DT acknowledges support by DLR grant FKZ 50 OR 2203. DH acknowledges support from DLR grant FKZ 50 OR 2003. MK acknowledges support from DFG grant number KR3338/4-1. Based on observations collected at the Samuel Oschin Telescope 48-inch and the 60-inch Telescope at the Palomar Observatory as part of the Zwicky Transient Facility project. The ZTF forced-photometry service was funded under the Heising-Simons Foundation grant 12540303 (PI: Graham). This publication makes use of data products from the Wide-field Infrared Survey Explorer, which is a joint project of the University of California, Los Angeles, and the Jet Propulsion Laboratory/California Institute of Technology, funded by the National Aeronautics and Space Administration. This publication also makes use of data products from NEOWISE, which is a project of the Jet Propulsion Laboratory/California Institute of Technology, funded by the Planetary Science Division of the National Aeronautics and Space Administration. This work is based on data from eROSITA, the soft X-ray instrument aboard SRG, a joint Russian-German science mission supported by the Russian Space Agency (Roskosmos), in the interests of the Russian Academy of Sciences represented by its Space Research Institute (IKI), and the Deutsches Zentrum für Luft- und Raumfahrt (DLR). The SRG spacecraft was built by Lavochkin Association (NPOL) and its subcontractors, and is operated by NPOL with support from the Max Planck Institute for Extraterrestrial Physics (MPE). The development and construction of the eROSITA X-ray instrument was led by MPE, with contributions from the Dr Karl Remeis Observatory Bamberg & ECAP (FAU Erlangen-Nuernberg), the University of Hamburg Observatory, the Leibniz Institute for Astrophysics Potsdam (AIP), and the Institute for Astronomy and Astrophysics of the University of Tübingen, with the support of DLR and the Max Planck Society. The Argelander Institute for Astronomy of the University of Bonn and the Ludwig Maximilians Universität Munich also participated in the science preparation for eROSITA.
The eROSITA data shown here were processed using the eSASS/NRTA software system developed by the German eROSITA consortium.
DATA AVAILABILITY
The SDSS data underlying this article were accessed from SDSS DR17 (http://skyserver.sdss.org/dr17). The second epoch spectra data will be shared on reasonable request to the corresponding author. The MIR data are publicly available at https://irsa.ipac.caltech.edu/Missions/wise.html. The alert ZTF light curves, together with the LCC classifications, can be downloaded at https://alerce.online. The forced-photometry light curves can be requested via the ZTF photometry service. The eROSITA data underlying this article were provided by the eROSITA-DE collaboration by permission, and will be shared on request to the corresponding author with permission of the eROSITA-DE collaboration. eRASS-1 will be public from Fall 2023.
Footnotes
References
APPENDIX A: LIGHT CURVES AND SPECTRA FROM THE CL SAMPLE
Table A1 indicates the dates and instruments used for the second epoch spectra of all the CL candidates observed in this work. Fig. A1 shows the ZTF optical and WISE-MIR light curves (left-hand side) and optical spectra (right-hand side) for the 15 CL sources identified in this paper. The optical spectra are scaled to the flux of [S ii] in the earliest spectra and smoothed with a 10 Å box filter. The lower plots in the right-hand side show the difference between the new and the old spectra. In some cases, the new spectra were taken with a blue and a red arms, leading to very noisy regions that have been deleted. The other four CL sources considered in this work are reported in López-Navas et al. (2022). All the SDSS spectra analysed in this work were taken before the beginning of the WISE-MIR light curves, except for the case of ZTF20aagyaug (MJD SDSS = 55673). The second epoch spectra were taken between MJD 59600 and 59700, at the end of the optical and MID-IR light curves. Fig. A2 shows the ZTF optical and WISE-MIR light curves for the most promising CL candidates selected according to their optical and MIR photometric variability.


ZTF optical and WISE-MIR light curves (left-hand side) and optical spectra (right-hand side) for the CL sources.
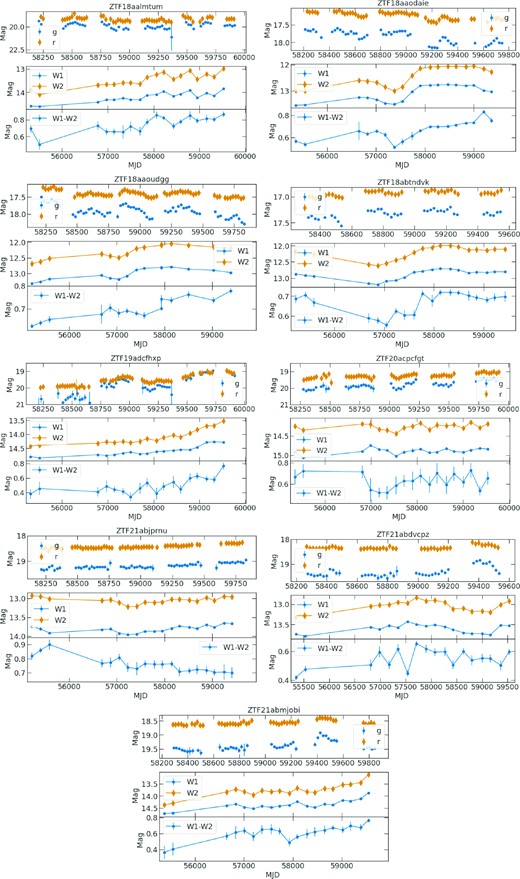
ZTF optical and WISE-MIR light curves from the most promising CL candidates.
Dates and instruments of the second epoch spectra for the CL candidates observed in this work. Sources identified as CL are shown in bold.
| ZTF ID | RA | DEC | MJD | Instrument |
|---|---|---|---|---|
| |$\deg$| | |$\deg$| | |||
| ZTF18aaiescp | 207.21292 | 57.646792 | 59603 | DBSP(P200) |
| ZTF18aaiwdzt | 199.48361 | 49.258651 | 59603 | DBSP(P200) |
| ZTF18aajywbu | 205.45327 | 37.013091 | 59604 | LRIS(Keck I) |
| ZTF18aaqftos | 180.95505 | 60.888181 | 59696 | DBSP(P200) |
| ZTF18aaqjyon | 180.42264 | 38.47264 | 59696 | DBSP(P200) |
| ZTF18aasudup | 170.03619 | 34.312731 | 59603 | DBSP(P200) |
| ZTF18aavxbec | 243.08151 | 46.495172 | 59696 | DBSP(P200) |
| ZTF18aawoghx | 156.10498 | 37.650863 | 59603 | DBSP(P200) |
| ZTF18aawwcaa | 128.10120 | 35.859979 | 59603 | DBSP(P200) |
| ZTF19aabyvtv | 197.87773 | 31.866893 | 59603 | DBSP(P200) |
| ZTF18acbzrll | 124.82294 | 30.32660 | 59696 | DBSP(P200) |
| ZTF18acgvmzb | 148.96896 | 35.965616 | 59616 | DBSP(P200) |
| ZTF18achdyst | 157.39925 | 24.777606 | 59616 | DBSP(P200) |
| ZTF18acusqpt | 177.91898 | 12.036714 | 59603 | DBSP(P200) |
| ZTF19aafcyzr | 125.71008 | 15.673859 | 59616 | DBSP(P200) |
| ZTF19aaixgoj | 146.80538 | 12.205624 | 59603 | DBSP(P200) |
| ZTF19aaoyjoh | 180.18956 | 14.967685 | 59603 | DBSP(P200) |
| ZTF19aapehvs | 199.74519 | 57.501847 | 59696 | DBSP(P200) |
| ZTF19aavqrjg | 181.24583 | 15.58718 | 59603 | DBSP(P200) |
| ZTF19aavyjdn | 202.39941 | −1.509453 | 59603 | DBSP(P200) |
| ZTF20aaeutuz | 164.81581 | 12.483378 | 59696 | DBSP(P200) |
| ZTF20aagwxlk | 153.42829 | 55.432205 | 59696 | DBSP(P200) |
| ZTF20aagyaug | 172.41282 | 36.883602 | 59603 | DBSP(P200) |
| ZTF20aakreaa | 181.52333 | 42.169888 | 59603 | DBSP(P200) |
| ZTF20aaorxzv | 132.39052 | 3.68048 | 59604 | LRIS(Keck I) |
| ZTF20aaxwxgq | 234.63610 | 46.126392 | 59696 | DBSP(P200) |
| ZTF20abcvgpb | 238.24977 | 21.046358 | 59696 | DBSP(P200) |
| ZTF20abgnlgv | 232.52715 | 7.172269 | 59696 | DBSP(P200) |
| ZTF21aafkiyq | 174.93478 | −1.727439 | 59603 | DBSP(P200) |
| ZTF21abcsvbr | 184.64829 | 18.771713 | 59603 | DBSP(P200) |
