


ABSTRACT
We present new results from INTEGRAL and Swift observations of the hitherto poorly studied and unidentified X-ray source XTE J1906+090. A bright hard X-ray outburst (luminosity of ∼1036 erg s−1 above 20 keV) has been discovered with INTEGRAL observations in 2010, this being the fourth outburst ever detected from the source. Such events are sporadic, the source duty cycle is in the range (0.8–1.6) per cent as inferred from extensive INTEGRAL and Swift monitoring in a similar hard X-ray band. Using five archival unpublished Swift/X-Ray Telescope (XRT) observations, we found that XTE J1906+090 has been consistently detected at a persistent low X-ray luminosity value of ∼1034 erg s−1, with limited variability (a factor as high as 4). Based on our findings, we propose that XTE J1906+090 belongs to the small and rare group of persistent low-luminosity Be X-ray binaries.
1 INTRODUCTION
XTE J1906+090 is an 89 s transient X-ray pulsar serendipitously discovered by the Rossi X-ray Timing Explorer (RXTE) in 1996 (Marsden et al. 1998). To date only two outbursts have been reported in the literature, detected in 1996 and 1998 with RXTE/Proportional Counter Array (PCA) during a regular monitoring campaign of the nearby magnetar SGR J1900+14 (Wilson et al. 2002). The two outbursts differed significantly in term of peak flux and duration. The 1996 outburst was particularly short (2–4 d duration) and not particularly bright since it reached a peak flux of ∼6 × 10⁻¹² erg cm−2 s−1 (2–10 keV). The 1998 outburst was longer (25 d duration) and brighter (2–10 keV peak flux of ∼1.1 × 10⁻¹⁰ erg cm−2 s−1). From spectral analysis, the measured high absorption column density suggested a source distance of at least 10 kpc. Chandra observations in 2003 (Göǧüş et al. 2005) caught the source at a flux level of ∼3 × 10⁻¹² erg cm−2 s−1 (2–10 keV). The arcsecond-sized Chandra position allowed pinpointing the optical/infrared counterpart whose colours are typical of an early type star (Göǧüş et al. 2005). Based on the above evidence, XTE J1906+090 has been considered a candidate transient Be X-ray binary (BeXRB). However, the firm confirmation of such nature can only be obtained through optical/infrared spectroscopy that is still lacking. Corbet, Coley & Krimm (2017) performed a Swift/Burst Alert Telescope (BAT) investigation of the long-term hard X-ray light curve of the source. They noted the presence of two bright outbursts in the 15–50 keV light curve (dated 2009 and 2016), although no information was provided about their duration and energetic. In addition, Corbet et al. (2017) found two periodicities at ∼81 and ∼173 d. Although their nature is still unclear, they might be the orbital and superorbital period, respectively.
Here we report new results on XTE J1906+090 obtained from unpublished Swift/X-Ray Telescope (XRT) and INTEGRAL archival data.
2 DATA ANALYSIS
2.1 INTEGRAL
The temporal and spectral behaviour of XTE J1906+090 has been investigated in detail above 20 keV with the INTEGRAL Soft Gamma-Ray Imager (ISGRI) detector (Lebrun et al. 2003), which is the lower energy layer of the Imager on Board the INTEGRAL Satellite (IBIS)-coded mask telescope (Ubertini et al. 2003) onboard INTEGRAL (Winkler et al. 2003).
INTEGRAL observations are divided into short pointings [Science Windows (ScWs)] whose typical duration is ∼2000 s. The IBIS/ISGRI public data archive (from revolution 30 to 2000, i.e. from approximately 2003 January to 2018 September) has been specifically searched for hard X-ray activity from XTE J1906+090. In particular, the data set consists of 8119 ScWs where XTE J1906+090 was within the instrument field of view (FoV) with an off-axis angle value less than 12°. We note that such a limit is generally applied because the response of IBIS/ISGRI is not well modelled at large off-axis values and this may introduce a systematic error in the measurement of the source fluxes.
To search for transient hard X-ray activity from XTE J1906+090 in a systematic way, we used the bursticity method as developed by Bird et al. (2010, 2016). Such method optimizes the source detection time-scale by scanning the IBIS/ISGRI light curve with a variable-sized time window to search for the best source significance value. Then the duration, time interval, and energy band over which the source significance is maximized are recorded. Once a newly discovered outburst activity from XTE J1906+090 was found, a specific spectrum and light curve were extracted. To this aim, the data reduction was carried out with the latest release 11.2 of the offline scientific analysis (osa) software (Courvoisier et al. 2003). The IBIS/ISGRI systematics, which are typically of the order of 1 |${{\rm per\, cent}}$|, were added to the extracted spectrum.
Images from the X-ray monitor Joint European X-Ray Monitor (JEM–X; Lund et al. 2003) onboard INTEGRAL were created in two energy bands (3–10 and 10–20 keV) for the outburst reported later in this work.
2.2 The Neil Gehrels Swift Observatory
The Neil Gehrels Swift Observatory (hereafter Swift; Gehrels et al. 2004) has covered the source sky position with the X-Ray Telescope (XRT; Burrows et al. 2005) six times (Table 1). The first three observations were nominally pointed at XTE J1906+090, while the other three imaged the source position serendipitously, at very large off-axis angle.
Summary of the Swift observations.
| Obs ID | Start time | Exp | Off-axis angle |
|---|---|---|---|
| (utc) | (ks) | (arcmin) | |
| 00010740001 | 2018-07-04 17:36:00 | 0.67 | 4.6 |
| 00010740002 | 2018-07-08 08:46:00 | 1.16 | 1.9 |
| 00010740003 | 2018-07-10 11:56:00 | 1.60 | 1.8 |
| 00014213001 | 2021-03-31 01:53:35 | 1.30 | 12.1 |
| 00014213002 | 2021-04-14 13:09:34 | 0.16 | 12.0 |
| 00014213004 | 2021-04-28 16:24:34 | 1.80 | 11.9 |
We have reprocessed these XRT data [operated in photon counting (PC) mode] with HEASoft v6.29 and the most updated calibration files, using the xrtpipeline tool with standard procedures. Source detection and estimate of the source net count rates have been obtained using ximage (v4.5.1) in HEASoft and the sosta and uplimit tools, when an upper limit to the source count rate was needed.
Once all the single XRT snapshots have been reprocessed (and the ancillary response files, arf, built with xrtpipeline), we merged together the three observations performed in 2018, showing the lowest off-axis angle (Table 1), for a meaningful spectroscopy (see Section 3.2). A single XRT spectrum has been extracted from the merged event file, using a circular region with a radius of 20 pixels (i.e. ∼47 arcsec) centred at the source position. The background spectrum was extracted from an annular region around the source centroid, adopting radii of 30 and 50 pixels for the inner and outer radii, respectively. The appropriate, weighted average arf has been produced merging together the three single arf files, using the addarf tool. The source spectrum has been grouped to have at least one count per bin and then fitted using xspec v12.12.0 (Arnaud 1996), adopting Cash statistics (Cash 1979).
The uncertainties on the count rates are computed at 1σ confidence level, while the uncertainties on spectral parameters and fluxes calculated in xspec are at 90 per cent confidence level. All upper limits are calculated at 3σ level. X-ray fluxes have been estimated in the 0.3–10 keV range, with uncertainties calculated using cflux in xspec. The model TBabs has been adopted to account for the absorbing column density along the line of sight, assuming the interstellar abundances of Wilms, Allen & McCray (2000) and photoelectric absorption cross-sections of Verner et al. (1996).
3 RESULTS
3.1 INTEGRAL
XTE J1906+090 has been best detected with the bursticity method in the energy band 18–60 keV during outburst activity in 2010 September. Here we report, for the first time, on a detailed temporal and spectral analysis of this hard X-ray outburst. This is the first activity from the source reported since RXTE detections during the late nineties.
As we can note from Table 2, XTE J1906+090 was not detected in the single revolutions 965 (2010 September 9) and 966 (2010 September 11), nor in their summed significance map for a total on source exposure of ∼10 ks. We inferred a 2σ upper limit of ∼3 mCrab (18–60 keV). Conversely, the source was detected with a significance of 6.5σ and 6.0σ (18–60 keV) during revolution 972 (2010 September 29) and 973 (2010 October 2), respectively. We stacked the data for both revolutions with the aim of increasing the statistics. XTE J1906+090 was detected with a significance of 8.5σ (18–60 keV) for a total on-source exposure of ∼10.5 ks (see Fig. 1). No detection was obtained in the higher energy band 60–100 keV. The average 18–60 keV flux is 12.9 ± 1.5 mCrab (or ∼1.7 × 10⁻¹⁰ erg cm−2 s−1). The source was never significantly detected at ScW level (i.e. ≥5σ) at any point of the observation. Finally, XTE J1906+090 was not detected in any single revolution after 973, i.e. 974 (2010 October 7) and 976 (2010 October 10), nor in their summed mosaic for a total on source exposure of ∼9 ks. We inferred a 2σ upper limit of ∼3.3 mCrab (18–60 keV).
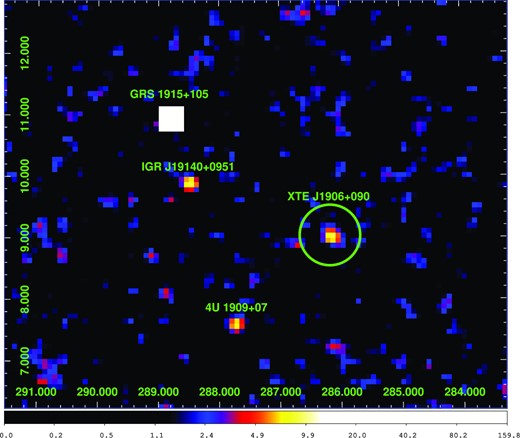
IBIS/ISGRI 18–60 keV significance map (revolutions 972 + 973), XTE J1906+090 (green circle) is detected at 8.5σ level.
List of INTEGRAL orbits and their start date, significance of source detection, average flux (18–60 keV), and effective exposure time on-source.
| Orbit | Start time | Significance | Flux | Exposure |
|---|---|---|---|---|
| (no.) | (MJD) | (σ) | (mCrab) | (ks) |
| 965 + 966 | 55450.088 | <2σ | ≤3.1 | 10.0 |
| 972 + 973 | 55468.587 | 8.5σ | 12.9 ± 1.5 | 10.5 |
| 974 + 976 | 55476.263 | <2σ | ≤3.3 | 8.8 |
| Orbit | Start time | Significance | Flux | Exposure |
|---|---|---|---|---|
| (no.) | (MJD) | (σ) | (mCrab) | (ks) |
| 965 + 966 | 55450.088 | <2σ | ≤3.1 | 10.0 |
| 972 + 973 | 55468.587 | 8.5σ | 12.9 ± 1.5 | 10.5 |
| 974 + 976 | 55476.263 | <2σ | ≤3.3 | 8.8 |
The IBIS/ISGRI light curve at ScW level (Fig. 2) clearly shows the outburst activity detected during revolutions 972 and 973. It was characterized by a duration of ∼4 d during which the measured peak flux (at MJD 55471.7) is 21 ± 5 mCrab or ∼2.7 × 10⁻¹⁰ erg cm−2 s−1 (18–60 keV), Unfortunately, there is a gap in the light curve between revolutions 966 and 972 that does not allow us to fully constrain the proper duration of the total outburst activity. Based on the INTEGRAL data coverage, the duration can be loosely constrained in the range 3–25 d. In this context, Swift/BAT data can be particularly helpful since the BAT instrument provides a continuous time coverage of the source activity with no temporal gaps. From the Swift/BAT archive, we downloaded the 15–50 keV source light curve on daily time-scale, and we checked if the source was active or not during the temporal range corresponding to the gaps of the IBIS/ISGRI light curve. No significant hard X-ray activity was evident, suggesting that the duration of the outburst detected by INTEGRAL was very likely of the order of ∼4 d. Such a duration is similar to that estimated with RXTE during the outburst occurred in 1996.
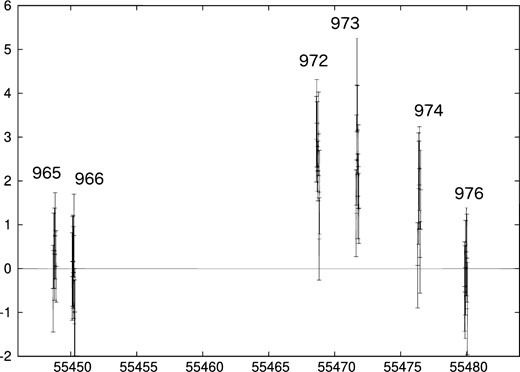
IBIS/ISGRI light curve of XTE J1906+090 (18–60 keV) at ScW level (2000 s) covering the INTEGRAL observations listed in Table 2. Time and flux axis are in MJD and count s−1, respectively.
We extracted the average IBIS/ISGRI spectrum of the outburst during revolutions 972 + 973. The best fit is achieved with a power-law model (|$\chi ^{2}_{\nu }$| = 0.92, 4 degrees of freedom) characterized by a steep photon index (Γ = 4.7 ± 0.7). The average 18–60 keV (20–40 keV) flux is 1.2 × 10⁻¹⁰ erg cm−2 s−1 (8.3 × 10⁻¹¹ erg cm−2 s−1). Alternatively, a thermal bremsstrahlung model provides a reasonable fit (|$\chi ^{2}_{\nu }$| = 0.6, 4 degrees of freedom) with kT = 7.7|$^{+2.7}_{-1.8}$| keV. Fig. 3 shows the power-law data-to-model fit with the corresponding residuals.
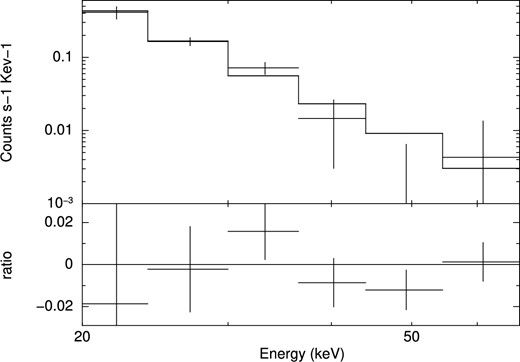
IBIS/ISGRI spectrum of XTE J1906+090, showing the power-law data-to-model fit with the corresponding residuals.
The source was also in the JEM–X2 FoV during INTEGRAL observations from revolution 972–973, for a total on-source exposure of ∼15 ks. No detection was achieved in the X-ray band 3–10 keV, the inferred 3σ upper limit is of the order of ∼6 mCrab or 9 × 10⁻¹¹ erg cm−2 s−1. In the higher energy band 10–20 keV there is a hint of weak detection at ∼4σ level. The statistics are insufficient to perform any meaningful analysis. Eventually we do not consider it as a reliable detection.
XTE J1906+090 is not detected as a persistent source in the latest INTEGRAL/IBIS catalogue of Bird et al. (2016), despite an extensive coverage of its sky region for a total on-source exposure of ∼6 Ms. This information can be used to infer a 3σ upper limit on its persistent hard X-ray emission, which is of the order of 0.3 mCrab or 2.3 × 10⁻¹² erg cm−2 s−1 (20–40 keV). When assuming the source flux in the same energy band as measured by IBIS/ISGRI during the reported outburst, we can derive a dynamic range ≥36.
3.1.1 Search for periodicities
We performed a timing analysis of the long-term IBIS/ISGRI light curves, using the epoch folding method, in order to search for periodicities that could eventually be ascribed to the orbital or superorbital period as previously found by Corbet et al. (2017). The IBIS/ISGRI ScW light curve (18–60 keV) covers the observational period from 2003 January to 2018 September. We applied standard optimum filtering in order to exclude poor-quality data points that could eventually disrupt the periodic signal (see Sguera et al. 2007; Goossens et al. 2013 for details). Periodicities were searched for in the range 0.1–1000 d, but none were found.
3.2 Swift
A source positionally coincident with XTE J1906+090 has been detected in each single XRT pointing, except in Obs ID 00014213002, where the very short exposure time allowed us to obtain only an upper limit to the source intensity. The source count rates [corrected for point spread function (PSF), sampling dead time, and vignetting] obtained using sosta and uplimit tool in ximage on the single images and exposure maps are reported in Table 3. We have converted these XRT/Photon Counting (PC) rates into unabsorbed fluxes (0.3–10 keV), adopting an average factor of 1 × 10⁻¹⁰ erg cm−2 count−1 (assuming a power-law model with a photon index Γ = 2 and NH = 1 × 1022 cm−2).
XTE J1906+090 intensity during the Swift/XRT observations.
| Obs ID | Start date | Count rate |
|---|---|---|
| (MJD) | (10−2 count s−1) | |
| 00010740001 | 58303.7333 | 4.4 ± 1.2 |
| 00010740002 | 58307.3652 | 1.97 ± 0.55 |
| 00010740003 | 58309.4972 | 3.4 ± 0.62 |
| 00014213001 | 59304.0789 | 2.34 ± 0.75 |
| 00014213002 | 59318.5483 | <4.1 |
| 00014213004 | 59332.6837 | 1.36 ± 0.44 |
In Fig. 4, we show the long-term light curve built from these fluxes, together with several upper limits derived from XMM–Newton slew observations (see Section 3.3).
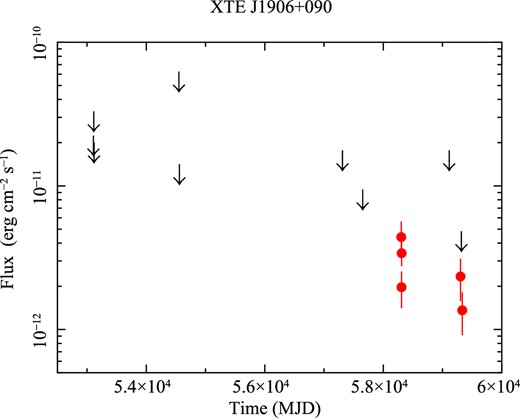
Long-term light curve of XTE J1906+090 (Swift/XRT and XMM–Newton data). The unabsorbed Swift/XRT fluxes are derived from Table 3 (see text), while the 3σ upper limits on fluxes obtained from the XMM–Newton slew observations are taken from Table 4. A power-law model with a photon index Γ = 2 and NH = 1022 cm−2 has been assumed.
We focussed our attention on the three contiguous XRT observations that span the time range 2018 July 4–10 (see Table 1). Since the XRT spectra extracted from each single observation have a very similar spectral shape, we considered the spectrum extracted from their sum. This spectrum resulted in a net count rate of 0.022 ± 0.003 count s−1 (0.3–10 keV), for an exposure time of 3.4 ks. A good fit has been obtained with an absorbed power-law model (Cash statistics 57.93 using 74 bins; null hypothesis probability of 0.981 with 71 degrees of freedom), with the following spectral parameters: absorbing column density NH = 2.0(|$^{+2.0} _{-1.5}$|) × 1022 cm−2, power-law photon index Γ = 1.38|$^{+0.95}_{-0.83}$|, and a flux corrected for the absorption UF = 3.2(|$^{+3.4} _{-0.9}$|) × 10−12 erg cm−2 s−1. The spectrum is shown in Fig. 5. We note that these spectral shape and flux values are very similar to those measured during the 2003 Chandra observation reported by Göǧüş et al. (2005).
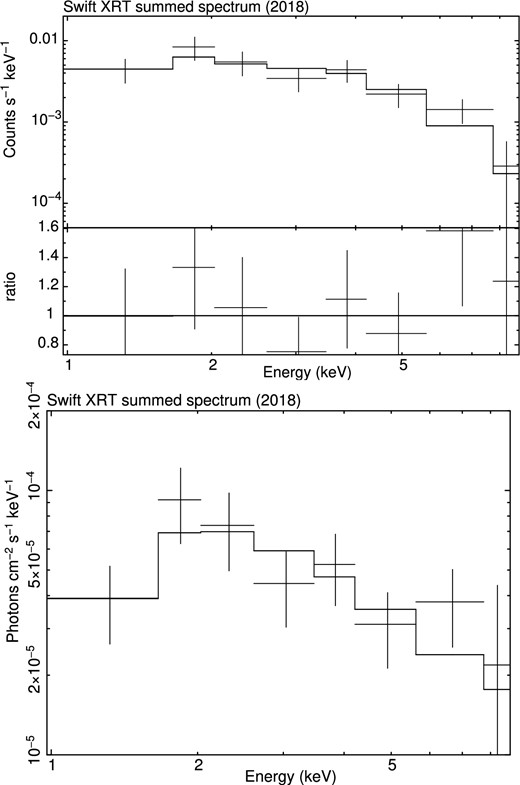
Swift/XRT spectrum obtained from the merging of the three observations performed in 2018. An absorbed power-law model is shown (see text for the parameters): the counts spectrum together with the ratio with respect to the best-fitting model is shown in the top panel, while the photon spectrum is displayed in the bottom panel. Spectra have been rebinned for presentation purposes only.
3.3 XMM–Newton slew observations
The source sky position has never been covered by any XMM–Newton (Jansen et al. 2001) pointing. However, a few slew manoeuvres (which reoriented the spacecraft between targets) serendipitously covered XTE J1906+090 position with very short exposure times. We decided to use these XMM–Newton slew observations to constrain the long-term source light curve. To this aim, we have used the ESA upper limit server (HIgh energy LIght-curve GeneraTor, HILIGT;1 König et al. 2022; Saxton et al. 2022), which calculates the 3σ upper limits on the X-ray fluxes from the XMM–Newton slew observations. The results are reported in Table 4.
3σ upper limits on the X-ray fluxes obtained through HIgh energy LIght-curve GeneraTor (HILIGT) with XMM–Newton slew observations.
| Date | MJD | Exp. | Abs. fluxa | Unabs. fluxb |
|---|---|---|---|---|
| (s) | (0.2–12 keV) | (0.3–10 keV) | ||
| 2004-04-13 | 53108.8729 | 9.3 | <6.0 × 10⁻¹² | <1.9 × 10⁻¹¹ |
| 2004-04-19 | 53114.8875 | 4.5 | <8.9 × 10⁻¹² | <2.8 × 10⁻¹¹ |
| 2004-04-23 | 53118.7965 | 6.0 | <5.4 × 10⁻¹² | <1.7 × 10⁻¹¹ |
| 2008-03-25 | 54550.9285 | 1.4 | <16.7 × 10⁻¹² | <5.3 × 10⁻¹¹ |
| 2008-04-03 | 54559.2683 | 9.5 | <3.8 × 10⁻¹² | <1.2 × 10⁻¹¹ |
| 2015-10-16 | 57311.5233 | 6.2 | <4.7 × 10⁻¹² | <1.5 × 10⁻¹¹ |
| 2016-09-21 | 57652.5307 | 9.8 | <2.6 × 10⁻¹² | <0.8 × 10⁻¹¹ |
| 2020-09-20 | 59112.6833 | 8.7 | <4.6 × 10⁻¹² | <1.5 × 10⁻¹¹ |
aAbsorbed flux, for an assumed power-law model (Γ = 2) and absorption NH = 1 × 1021 cm−2, in the energy band 0.2–12 keV.
bUnabsorbed flux, calculated assuming a power-law model (Γ = 2) and absorption NH = 1 × 1022 cm−2, in the energy band 0.3–10 keV.
We note that by default, HILIGT returns 3σ upper limits on absorbed fluxes (0.2–12 keV) assuming a power-law model with a photon index Γ of 2 and a low absorbing column density NH = 1 × 1021 cm−2 (forth column in Table 4). Therefore, we have converted these values to the 0.3–10 keV energy band (for a more direct comparison with Swift results), assuming a more appropriate column density of NH = 1 × 1022 cm−2 and a power-law model with Γ = 2. The 3σ upper limits on the fluxes corrected for the absorption (0.3–10 keV) are listed in the last column of Table 4, and reported in the long-term light curve (Fig. 4).
All the XMM–Newton unabsorbed flux values reported in Table 4 imply 3σ upper limits on the X-ray luminosity in the range from 8.1 × 1034 to 5.6 × 1035 erg s−1 (see next section for the assumed distance value).
4 SOURCE DISTANCE AND X-RAY LUMINOSITIES
Precise information on the source distance is necessary to calculate the correct associated luminosities. To date, the distance of XTE J1906+090 has been assumed to be of the order of 10 kpc, as merely suggested from the measured high-absorption column density obtained through RXTE spectral analysis (Marsden et al. 1998). Nowadays accurate and reliable distance estimates are available from the Gaia astrometric mission. We relied on the last release available Early Data Release 3 (EDR3; Gaia Collaboration et al. 2021), and on source distances computed by Bailer-Jones et al. (2021) who used the parallaxes along with parameters that affect the parallax measurement such as the magnitude and the colour of the star, and a distance prior based on the density of stars in the galaxy.
Two distance estimates are available for XTE J1906+090 obtained with two different methods: geometric dg = 6.37|$^{+3.47}_{-1.97}$| kpc (based only on the parallax) and photogeometric dpg = 9.38|$^{+2.90}_{-1.77}$| kpc (which uses also the colour and the apparent magnitude of the star). On the one side, the nominal values of the distance from the two methods differ by a factor of ∼1.5, accordingly the relative luminosity values would differ by a factor ∼2.2. On the other side, in both cases the formal errors are relatively large and the corresponding uncertainty ranges are partially compatible. As for the choice of whether to use geometric or photogeometric distance, we note that for stars with negative parallaxes and large parallax uncertainties (which is the case of our specific source) photogeometric distances will generally be more precise and reliable than geometric ones (Bailer-Jones 2021). Therefore, according to the Gaia results, we will adopt a distance of 9.4 kpc to calculate the luminosities of XTE J1906+090. This is also compatible with a previous estimate from X-ray spectral analysis (Marsden et al. 1998).
In Table 5, we report the X-ray luminosities corresponding to the INTEGRAL and Swift/XRT detections reported for the first time in this work. In addition, we also report the Chandra, RXTE, and Swift/BAT X-ray luminosities corresponding to the five detections previously reported in the literature.
Summary of average (unless specified otherwise) X-ray luminosity values of all X-ray detections from XTE J1906+090 reported to date, along with information on date of beginning activity, X-ray band, and reference of the detection.
| Satellite | Date | Lum | Energy | Ref |
|---|---|---|---|---|
| (MJD) | (erg s−1) | (keV) | ||
| RXTE | 50343.000 | 6.3 × 1034 a | 2–10 | (1), (2) |
| RXTE | 51056.000 | 1.1 × 1036 a | 2–10 | (2) |
| Chandra | 52785.000 | 3.1 × 1034 | 2–10 | (3) |
| Swift/BAT | ∼55000 | 3.6 × 1036 a | 18–60 | (4) |
| INTEGRAL | 55468.587 | 3.0 × 1036 a | 18–60 | This work |
| Swift/BAT | ∼57450 | 3.1 × 1036 a | 18–60 | (4) |
| Swift/XRT | 58303.733 | 4.6 × 1034 | 0.3–10 | This work |
| Swift/XRT | 58307.365 | 2.1 × 1034 | 0.3–10 | This work |
| Swift/XRT | 58309.497 | 3.6 × 1034 | 0.3–10 | This work |
| Swift/XRT | 59304.907 | 2.5 × 1034 | 0.3–10 | This work |
| Swift/XRT | 59332.683 | 1.5 × 1034 | 0.3–10 | This work |
5 DISCUSSION
XTE J1906+090 is an unidentified transient X-ray pulsar whose optical/infrared counterpart has colours typical of an early type star. Hence it is considered a candidate BeXRB, although spectroscopy is still lacking.
Table 5 lists a summary of characteristics of all X-ray detections of XTE J1906+090 obtained to date, the majority of them are reported in this work for the first time. We note that four X-ray outbursts have been detected, thanks to an extensive source monitoring spanning over three decades with X-ray missions like RXTE, INTEGRAL, and Swift. Moreover, we note that the RXTE 1996 detection (MJD 50343) has been previously reported in the literature as an X-ray outburst by Wilson et al. (2002), however we argue that its peak luminosity (6 × 1034 erg s−1) is more than one order of magnitude lower than typical Type I outbursts from BeXRBs. We are more inclined to consider it as enhanced X-ray activity due to accretion of material from the stellar wind of the Be star and not from its decretion disc.
The four outbursts are characterized by a similar X-ray luminosity of ∼1036 erg s−1. The first outburst was detected in 1998 by RXTE (2–10 keV) with a duration of ∼25 d (Wilson et al. 2002). The outburst detected by INTEGRAL (18–60 keV) is newly discovered and reported in this work for the first time; it was detected in 2010 with a duration of ∼4 d. According to Corbet et al. (2017), we considered ϕ = 0 at MJD 55 000 and the periodicity of 81.4 d (173.1 d) to measure the phase of the INTEGRAL outburst. We found that its peak took place at ϕ ∼ 0.8 (ϕ ∼ 0.7). For a comparison, we refer the reader to figs 20 and 21 in Corbet et al. (2017) where the light curve folded on 81.4 d (173.1 d) clearly shows a smooth (sharp) peak at ϕ ∼ 0.9–1 (ϕ ∼ 1). Two outbursts have been detected by Swift/BAT (15–50 keV) in 2009 and 2016 as reported by Corbet et al. (2017), although no information was provided about their duration and energetics. To this aim, we derived the Swift/BAT count rates at the peak of both events following Corbet et al. (2017). Then we used them with WebPIMMS in order to estimate the fluxes and corresponding luminosities in the energy band 18–60 keV to allow a proper comparison with the outburst detected by INTEGRAL (see Table 5). We assumed the same spectral model and parameter values (i.e. power law) of the INTEGRAL outburst detection reported in this work. As for the outburst duration, from the Swift/BAT daily light curve we inferred values of ∼18 and ∼20 d, respectively. We note that the X-ray characteristics of all outbursts could be indicative of classical Type I outbursts from BeXRB, hence reinforcing the proposed nature. We calculated a source duty cycle of ∼1.6 per cent from INTEGRAL observations (18–60 keV) covering the period 2003 January–2018 September. In a similar energy band (15–50 keV), we obtained a value of ∼0.8 per cent from Swift/BAT observations covering a significantly longer period from 2005 February to 2023 April.
Outside X-ray outburst activity, to date XTE J1906+090 was observed six times with sensitive X-ray satellites below 10 keV (five out of six observations are reported for the first time in this work). Notably, over those six X-ray observations spanning about 18 yr, XTE J1906+090 was always detected with a very similar low X-ray luminosity value in the range (1–4) × 1034 erg s−1. Clearly, when XTE J1906+090 has been observed with sufficient exposure (i.e. ≥0.5 ks) with sensitive X-ray satellites below 10 keV, it has been always detected as a persistent low X-ray luminosity source with limited variability (a factor as high as 4). Above 20 keV, the X-ray luminosity upper limit is <3 × 1034 erg s−1, as we inferred from deep INTEGRAL observations (16 Ms). At energies >20 keV the level of the source persistent low luminosity is below the sensitivity threshold of current hard X-ray missions like INTEGRAL or Swift/BAT.
We note that the above newly reported X-ray characteristics of XTE J1906+090 strongly resemble those of persistent low-luminosity BeXRBs, which are a small and rare subgroup of peculiar BeXRBs (Pfahl et al. 2002). To date, only a handful of such objects have been reported in the literature, amongst the ∼100 known classical transient BeXRBs. Persistent low-luminosity BeXRBs are mainly characterized by (i) long spin period (greater than several tens of seconds), (ii) persistent low X-ray luminosity in the range 1034–1035 erg s−1, and (iii) limited X-ray variability (rare and unpredictable increases in flux by a factor of ≤10). Such properties suggest that the compact object orbits the donor Be star in a wide (orbital periods longer than ∼30 d) and nearly circular (e < 0.2) orbit, rarely or never crossing the decretion disc star and continuously accreting material from the lower density outer regions of the stellar wind.
Our proposed classification of persistent low-luminosity BeXRB for XTE J1906+090 is not at odds with the four X-ray outbursts observed to date. In fact, we note that a similar sporadic variability was already observed in all the BeXRBs that are traditionally considered as persistent sources, such as RX J0146.9+6121 (La Palombara & Mereghetti 2006), X Persei (La Palombara & Mereghetti 2007), and RX J1037.5−5647 (La Palombara et al. 2009). Although these sources are usually observed at a X-ray luminosity level of about 1034 erg s−1, occasionally all of them have revealed a luminosity increase up to a few 1035 erg s−1, thus with a variability higher than one order of magnitude.
Even more interesting is the case of the BeXRB RX J0440.9+4431, which is the fourth member of the class of persistent BeXRBs originally identified by Reig & Roche (1999). Between 2010 and 2011 three outbursts were observed for this source, which reached a peak luminosity of about 1036 erg s−1 (La Palombara et al. 2012). These were the only flux increases larger than one order of magnitude observed for this source over a time span of about 25 yr. But, very surprisingly, at the end of 2022 this source has shown a new outstanding outburst, reaching a peak X-ray luminosity of about 1037 erg s−1 (Coley et al. 2023). The origin of these rare and unpredictable events is not clear. Very likely, these large outbursts could be explained by particularly rare episodes of structural changes in the decretion disc of the Be star that could result in a significant enlargement of the disc itself, allowing its crossing with the neutron star compact object. We note that the flux variability of RX J0440.9+4431 is remarkably similar to that observed in XTE J1906+090. In fact, also for this source four different outbursts were detected in over 20 yr of observations; for all of them the peak luminosity was about 1036 erg s−1. Apart from these outbursts, similarly to the previous cited sources, XTE J1906+090 was always detected at a X-ray luminosity level of a few 1034 erg s−1, never going to quiescence. The occurrence of these sporadic outbursts in these otherwise steady sources suggests that the variability requirement Lmax/Lmin < 10, originally proposed by Reig & Roche (1999), is no longer valid in order to identify persistent BeXRBs.
The similarity between XTE J1906+090 and the other persistent BeXRBs is shown in Fig. 6, where we report the source variability (Lmax/Lmin) as a function of the maximum observed luminosity (Lmax) for various classes of BeXRBs. There RX J0440.9+4431 is represented as a filled star, while the four filled circles represent the other three persistent and low-luminosity BeXRBs, plus CXOU J225355.1+624336, which is a candidate member of this group (La Palombara et al. 2021). On the other hand, open circles and crosses represent, respectively, the transient Milky Way (MW) sources (Tsygankov et al. 2017) and the Small Magellanic Cloud (SMC) sources reported by Haberl & Sturm (2016). For completeness, we report also the two peculiar sources SAX J0635.2+0533 (filled square; La Palombara & Mereghetti 2017) and LMC 0538−66 (open star; Skinner et al. 1982; Kretschmar et al. 2004). In this figure, XTE J1906+090 is reported as a filled triangle. The Lmax/Lmin ratio of this source is fully consistent with that observed in most of the persistent BeXRBs, thus supporting its classification as an additional member of this class of sources.
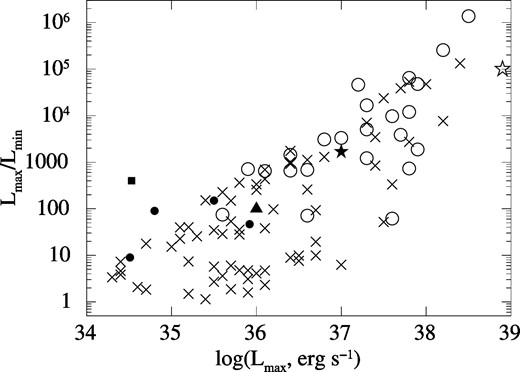
Source X-ray variability as a function of the maximum luminosity, for XTE J1906+090 (filled triangle), RX J0440.9+4431 (filled star), SAX J0635.2+0533 (filled square), A0538−66 (open star), and various classes of BeXRBs: persistent (filled circles), the Milky Way (MW) transients (open circles), and the Small Magellanic Cloud (SMC) transients (crosses).
Corbet et al. (2017) reported the discovery of two periodicities from XTE J1906+090 particularly long (81 and 173 d) that could be interpreted in terms of orbital and superorbital period, respectively. This finding supports the possibility of a significantly wide orbit for the source, similarly to the case of persistent low-luminosity BeXRBs.
From the spectral point of view, it is interesting to note that the Chandra spectrum of XTE J1906+090 (Göǧüş et al. 2005) has been described by a hot blackbody model (kT ∼ 1.5 keV). In fact, this type of thermal component has been observed in several low-luminosity and long-period high-mass X-ray binaries (HMXBs) and, in particular, in the four confirmed persistent BeXRBs (La Palombara et al. 2012). In all cases the blackbody radius is remarkably consistent with the estimated size of the neutron star polar cap (assuming standard values for the neutron star parameters). This finding supports the hypothesis that the observed thermal component originates at the surface of the neutron star.
It would be very interesting to investigate the presence and the properties of this component also in XTE J1906+090, but the available exposure time and statistics of the current soft X-ray data (below 10 keV) prevent us from a more detailed spectral investigation. Longer soft X-ray observations (e.g. with XMM–Newton) would be particularly useful to perform a much deeper X-ray spectral investigation of the additional thermal spectral component, in order to support our proposed scenario of a persistent low-luminosity BeXRB. Still, the final word on the real nature of XTE J1906+090 is up to near-infrared or optical spectroscopy of the putative counterpart, which is still lacking.
ACKNOWLEDGEMENTS
We warmly thank the referee for the prompt and constructive report. This research has made use of data and software provided by the High Energy Astrophysics Science Archive Research Center (HEASARC), which is a service of the Astrophysics Science Division at NASA/GSFC. This work has made use of the Swift/BAT transient monitor results provided by the Swift/BAT team: http://swift.gsfc.nasa.gov/docs/swift/results/transients/. This work has made use of data from the ESA mission Gaia (https://www.cosmos.esa.int/gaia), processed by the Gaia Data Processing and Analysis Consortium (DPAC, https://www.cosmos.esa.int/web/gaia/dpac/consortium).
DATA AVAILABILITY
This research has made use of data and software provided by the High Energy Astrophysics Science Archive Research Center (HEASARC), which is a service of the Astrophysics Science Division at NASA/GSFC. We used archival data of INTEGRAL, Swift, and XMM–Newton observatories. INTEGRAL data can be retrieved from the INTEGRAL Science Data Centre at http://isdc.unige.ch/integral/archive#Browse. XMM–Newton data are publicly accessible by means of the ESA archive at the link http://nxsa.esac.esa.int/nxsa-web/#search. Swift/XRT data are publicly available from the UK Swift Science Data Centre at https://www.swift.ac.uk/swift_portal/. This work has made use of the Swift/BAT transient monitor results provided by the Swift/BAT team: http://swift.gsfc.nasa.gov/docs/swift/results/transients/.
