


ABSTRACT
To establish the spectroscopy of the solids α- and β-oxygen, we measured the thermal ramping spectra of the solid O2 in visible and near-infrared (near-IR) wavelength range 450–1020 nm and mid-infrared (mid-IR) range 500–5000 cm−1 (2–20 μm) at temperature 9–30 K. Besides the solids α- and β-oxygen, the imperfect structure of O2 ice might co-exist at low temperature. In mid-IR spectra, a triplet was observed at 1545.7, 1548.1, and 1549.6 cm−1 associated to the imperfect crystallinity of solid O2; the triplet existed below 27 K, but not at 30 K and on re-cooling to 9 K. The spectra measured at re-cooled 9 and 30 K are evidently responsible only for the solids α- and β-O2, respectively; overall, the spectra of the solids α- and β-O2 appear similar in the visible region, but those differ significantly from the spectrum of the solid O2 contaminated with imperfect structure. For solid α-O2, IR lines were recorded at 1591 and 1617 cm−1, which exhibited a reversible behaviour through the α-β phase transition temperature at 24 K. The visible spectrum of the separate solid α-O2 was obtained for the first time.
1. INTRODUCTION
Molecular O2 plays a key role on our terrestrial life; for example, its chemical reactions and biological functions sustain the activities of living beings on Earth. Such that O2 is an essential molecule supporting life on our planet. O2 is the second most abundant gas in the terrestrial atmosphere; it comprises approximately one fifth of the total content. In the stratosphere, photodissociation of O2 by solar radiation leads to formation of O3 (Chapman 1930; Anderson 2015; Kozakis, Mendonça & Buchhave 2022); which provides protection from solar UV injury for human beings (Orphal et al. 2016). In this photochemical process, the initial step is associated with photoabsorption of O2; it is hence attractive to investigate this absorption spectrum of molecular oxygen to understand its vital role in life (Krupenie 1972; Gleenblatt et al. 1990; Cooper et al. 2003).
In addition, molecular oxygen has been observed in molecular clouds ρ Ophiuchi (Larsson et al. 2007), in the interstellar medium (ISM) in Orion (Goldsmith et al. 2011), in the protostar IRAS 16293–2422 B (Taquet et. al. 2018) and in the coma of comet 67P/Churyumov–Gerasimenko (Bieler et al. 2015). In cold space, O2 might exist in an icy state (Tielens & Hagen 1982; Johnson & Jesser 1997; Vandenbussche et al. 1999, Cooper et al. 2003); the photochemistry of molecular oxygen in a solid phase hence warrants attention for an understanding of its radiation effects in cold astro-environments (Raulin et al. 2012; Bennett et al. 2013; Henning & Semenov 2013; Öberg 2016; Arumainayagam et al. 2019). For this reason, the spectral information of absorption of solid O2 must be established in the laboratory.
O2 ice conducts six crystal structures in solid phases by itself (Freiman & Jodl 2004); among these phases, solid oxygen of two types, α- and β-oxygen, exists at low pressure below 44 K. Solid α-oxygen occurs below 23.87 K with a monoclinic crystal structure, whereas β-O2 possesses rhombohedra in temperature range 23.87–43.8 K. Besides these α- and β-oxygen solids, icy O2 might form imperfect structures on condensation of gas on a cold substrate in the laboratory. The photoabsorption profiles of these three structures of solid O2 might diverge (Landau et al. 1962; St. Louis & Crawford 1962; Cairns & Pimentel 1965; Minenko et al. 2000; Lo et al. 2022) and thus require to be established in detail.
In principle, the spectra of various phases may be dissimilar corresponding to their specific structures. Investigation of the thermal spectra of solid O2 through the temperature of phase change at low temperatures is of interest. To explore the spectra of solid oxygen, we previously measured the visible, partial near-infrared (near-IR) and mid-infrared (mid-IR) spectra of O2 ices in the temperature range 6–33 K (Lo et al. 2022, 2023); accordingly, we found that the spectra of solid O2 depended strongly on temperature in the wavelength <5 μm. However, the previous observations were derived from various solids O2 deposited at different temperatures but not from the same icy sample annealed at various temperatures. The phase transition temperature of solids α- and β-O2 is at 24 K; subsequently, the previous report might hint that the visible spectrum of solid α-O2 was as the one deposited at 6 or 9 K. However, considering that the solid O2 deposited at 6–9 K might mix up the α-O2 with the imperfect solid O2; then, we wonder that the visible spectra might not be resolved out for the separate solid α-oxygen in our previous work and need to be further investigated. For this purpose, we undertook new experiments to record the thermal spectra of O2 ices, and certified the spectral data of solids α- and β-O2 in this work.
1.1 Experiments
For measurements of the spectra, a gaseous oxygen was deposited on a KBr window cooled by a closed-cycle cryostat (Janis RDK-415); which was evacuated to less than 1.3 × 10⁻⁶ Pa with a turbomolecular pump backed with a scroll pump. The experimental apparatus and procedures employed in this work have been reported (Chou et al. 2014; Lo et al. 2014, 2021). This cryostat was situated on the plate of a differential rotary-seal stage with rotatable angle about 200o; the KBr window can thus be rotated freely to face a port for deposition, or a port for IR detection, or a port for visible detection. For deposition, the gaseous O2 was directed through a coil cold trap immersed in a liquid-nitrogen bath to the KBr substrate cooled at the selected temperature; the rate of deposition was regulated at flow rate 4.5 µmol s−1 (6.0 sccm) monitored with a flow transducer. The duration of deposition was typically 10 min.
IR transmission spectra were recorded at various stages of experiments with an interferometric IR spectrometer (Bomem DA8; globar source; KBr beamsplitter; HgCdTe detector) to cover the spectral range 500–5000 cm−1; generally, 100 scans were recorded at resolution 0.5 cm−1. After deposition of the gaseous sample at a designed temperature, we recorded the spectrum of the O2 ice at that temperature; we then raised the temperature of the sample and measured the thermal spectra at selected temperatures sequentially. The temperature of the sample was regulated by a temperature controller (LakeShore 340) with rate 1 K min-1 of raising or cooling.
After each IR spectrum recorded at the specific temperature, we turned the sample to face the port for detection in the visible and near-IR range; the spectrum of the same sample in that range was measured at the unchanged temperature. Spectra in the visible and near-IR range were monitored with a spectrometer consisting of a light source using a tungsten-halogen lamp, a monochromator (iHR320) to disperse the light and an image-type detector with a charge-coupled device for detection. The entire spectrum to cover the wavelength range 350–1155 nm resulted from a combined series of sub-spectra; due to the problems of the scattering and second-order light, the wavelength range of confidence of accuracy was only 450–1020 nm however.
Gaseous O2 (Matheson) had nominal purity 99.999 per cent.
2. RESULTS AND DISCUSSION
An isolated O2 molecule possesses no electric dipolar moment in the gaseous phase so that the gaseous O2 has no IR line according to the selection rule for an electric-dipole transition. The electric dipolar moment of O2 in icy state might be strongly perturbed by neighbouring molecules; as a result, the O2 molecules might show IR lines in a solid state. The IR spectrum of solid O2 might contain information associated with its crystal structure; it is hence constructive to measure the IR spectrum of O2 ice to explore the structure of its lattice (Smith et al. 1950; St. Louis & Crawford 1962; Cairns & Pimentel 1965; Minenko et al. 2000). For this purpose, Fig. 1 shows the IR transmission spectra of O2 ices in the wavenumber region 500–4000 cm−1; the thermal ramping spectra were recorded through the α-β phase transition temperature 24 K, (a) after initial deposition at 12 K, (b) then on warming to 27 K, and (c) finally on re-cooling to 12 K. As there is almost no change of the thermal IR transmission for these O2 ices in wavenumber region 500–3000 cm−1, for clear presentation we applied offsets for spectra in Fig. 1. Noticeably, fringe patterns occur because of interference due to the thickness of the icy samples (Tarezay et al. 2016). The separation of the fringes (Fs) depends on two factors, the refractive index and the thickness of the icy samples; in this work, we couldn't simultaneously derive these two factors from the Fs obtained only at one fixed angle near 90°. Considering that the refractive indexes of the solid simple molecules (likes N2, O2, CO, CO2, H2O, etc.) are in the range 1.22–1.35 (Rocha & Pilling 2014), whose differences are within about 10 per cent; to estimate the thickness of the solid oxygen, we thus assume the refractive index of the solid O2 is 1.30 and possibly derive the reasonable thickness of the icy O2. In Fig. 1, all thermal spectra have similar separations, 301–305 cm−1, of fringes; accordingly, we derived the thickness of solid O2 to be 12.2 ± 0.2 μm for all ices.
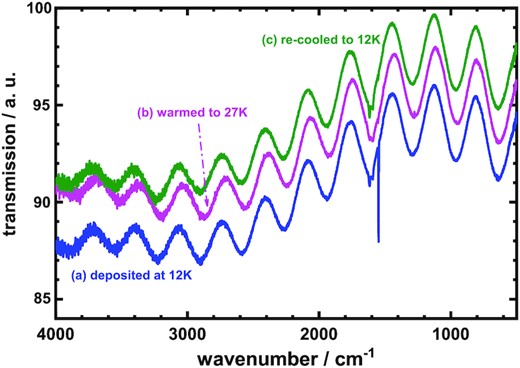
Thermal ramping IR transmission spectra of O2 ices in wavenumber region 500–4000 cm−1, (a) after initial deposition at 12 K, (b) afterward warmed to 27 K, and (c) finally re-cooled to 12 K.
In Fig. 1, no absorption line was observed in wavenumber region 3400–3900 cm−1; which encompasses the region for the symmetric (ν1) and antisymmetric stretching (ν3) vibrational modes of gaseous H2O at 3656.65 and 3755.79 cm−1 (Shimanouchi 1972), respectively. In addition, no absorption line was recorded in wavenumber region 2400–2500 cm−1; which locates the asymmetric stretching vibrational (ν3) mode of CO2. These results indicate that no detectable H2O and CO2 existed in the icy O2 samples so that samples with implemented special precautions removed the contaminants of gaseous O2. The features in these spectra are consequently associated only with molecular oxygen.
As the fundamental vibrational transition of free molecular oxygen in its electronic ground state occurs at 1556.2 cm−1 (Shimanouchi 1972), the spectral features observed in the wavenumber region 1500–1650 cm−1 might be associated only with molecular oxygen. For examination in detail, expansion of the IR transmission spectra of Fig. 1 in the wavenumber region 1450–1850 cm−1 is displayed in Fig. 2; the IR profiles clearly alter much for the spectra in this IR region. Thus, the IR features of solid oxygen reward particular attention at low temperatures.
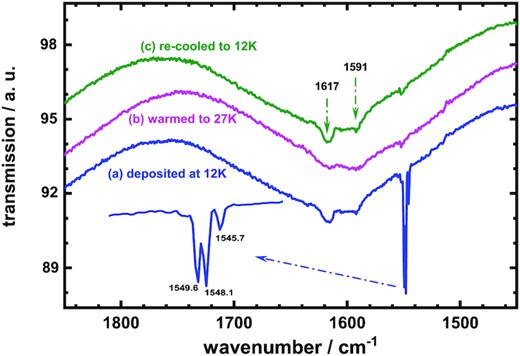
Thermal ramping IR transmission spectra of O2 ices in wavenumber region 1450–1850 cm−1, (a) after initial deposition at 12 K, (b) afterward warmed to 27 K, and (c) finally re-cooled to 12 K.
After deposition at 12 K, a distinct triplet of IR features for the O2 ice was observed at 1545.7, 1548.1, and 1549.6 cm−1 as shown in Fig. 2 (a); two weak lines were also recorded at 1591.0 and 1617.0 cm−1. Based on previous work, the former lines, the sharp triplet, are contributed from imperfections of O2 lattices, whereas the latter two weak lines are associated with combinations involving translational lattice modes of solid α-O2 (St. Louis & Crawford 1962; Cairns & Pimentel 1965; Lo et al. 2022). Accordingly, the sample of intact O2 ice deposited at 12 K contained not only the solid α-oxygen, but also imperfect lattices of O2. On warming to 27 K, the characteristic IR features of solid α-O2 were strongly reduced because of transformation to solid β-O2 mostly, as shown in Fig. 2(b). The intensity of the triplet feature for the imperfect lattice became faint; this phenomenon implies that most imperfect structure of O2 ices was also converted to β-O2 at 27 K. Cooling the sample from 27 to 12 K, the IR features of solid α-O2 emerged again as displayed in Fig. 2(c); this result indicates the reversible change of the α-β-α O2 solids through the phase transition temperature. The intensity of the IR triplet of imperfect O2 lattice in the re-cooled sample at 12 K remained as weak as at 27 K; this phenomenon might hint that a switch of the imperfect O2 lattice to the α-or β-O2 solid occurs only on warming but not cooling step. Here, a question might arise as to the upper temperature for the imperfect O2 solid existing upon thermal ramping; to answer this question, further experiments are required.
Similarly, Fig. 3 displays new thermal IR transmission spectra of solid O2 of thickness about 12 μm in wavenumber region 1400–1700 cm−1 at conditions of low pressure and temperature. Fig. 3(a) introduces the curve for the icy O2 sample just deposited from the gaseous O2 on a KBr window maintained at 9 K, (b) to (e) presents spectra for the same sample at 12, 18, 23, and 30 K, respectively, and (f) plots the spectrum of this icy O2 sample re-cooled to 9 K.
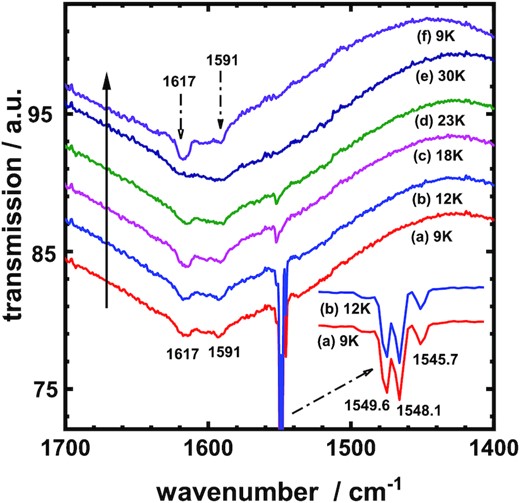
Transmission spectra of O2 ices (a) initially deposited at 9 K, raised to (b) 12 K, (c) 18 K, (d) 23 K, and (e) 30 K, then re-cooled to (f) 9 K. The changing direction of temperature is indicated by the arrow in the solid line.
The interpretation of the IR features in Fig. 3 can refer to Fig. 2. Specifically, a triplet feature at 1549.6, 1548.1, and 1545.7 cm−1 appeared prominently for O2 ices at temperatures 9 and 12 K. As mentioned above, these lines are associated with structural imperfection of O2 in the lattice, not with the solid α- or β-oxygen (Cairns & Pimentel 1965; Lo et al. 2022). From Fig. 3, this triplet of the imperfect O2 lattice occurs strongly at temperatures 9 and 12 K, but those lines become weak in temperature range 18–23 K; this fact means that the imperfect O2 lattice disappeared and transferred to α-O2 at those temperatures in the thermal process. Ultimately, those triple lines became absent at 30 K; that is the upper temperature for transformation of the imperfect lattice to solid α- or β-O2. In other words, the icy O2 lattice behaves only as solid β-oxygen at 30 K as shown in Fig. 3(e).
Re-cooling icy O2 from 30 to 9 K, we observed the IR lines of α-oxygen at 1617 and 1591 cm−1 without the triplet pattern shown in Fig. 3(f); which is significantly different from the spectrum of intact O2 ice just deposited at the same 9 K, as displayed in Fig. 3(a). The icy sample of the intact O2 ice obviously containing solid α-oxygen mixed with the imperfect O2 lattice as displayed in Fig. 3(a); in the thermal ramping, the latter can transform to α-oxygen solid below 24 K. Unlike the reversible phase transformation between α- and β-oxygen solids, the structural transformation for the imperfect O2 lattice is irreversible in the thermal ramping; once the transformation develops successfully, the imperfect O2 lattice disappears forever in the solid crystal. Consequently, the crystal structure for re-cooled sample at 9 K exists only as solid α-oxygen, which features IR lines at 1617 and 1591 cm−1 as shown in Fig. 3(f), without contamination of any crystal imperfections. As a result, Fig. 3(f) and (e) represent the IR spectra of solid α- and β-oxygen, respectively.
After each IR spectrum of the O2 ice recorded, we could subsequently measure the visible spectrum extended to near-IR region for the same icy sample at the same temperature. By this means, Fig. 4(a) depicts the transmission spectra of O2 ices in wavelength range 450–1020 nm for the intact O2 ice just deposited at 9 K, for the same samples thermally warmed to 12, 18, 23, and 30 K, and for the ice re-cooled to 9 K; in this series of spectra, the samples of O2 ices were the same as those at the identical temperatures in Fig. 3. As mentioned above, because there is almost no change of transmission for all O2 ices in wavenumber region 500–3000 cm−1 at various temperatures, we applied offsets to spectra for clear presentation in Figs 1–3. In contrast, the transmission of O2 ices in wavelength region 450–1020 nm varied strikingly to temperature; to emphasize this disparity, we thus plot the spectra without offset in Fig. 4(a). Based on the transmission spectra in Fig. 4(a), we transformed them to the absorption spectra in absorbance, as depicted in Fig. 4(b); absorbance = –log (transmission) = –log (I/Io), where I0 and I are the intensities of the incident light and the transmitted light, respectively.
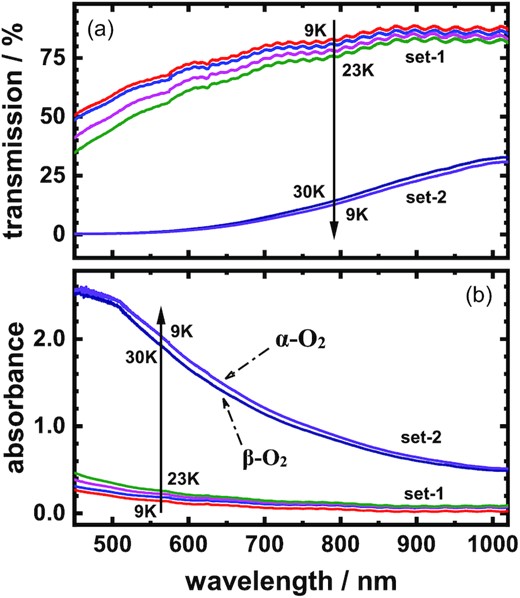
Spectra in wavelength range 450–1020 nm of O2 ice of thickness 12 μm, (a) transmission curves just deposited at 9 K, warmed to 12, 18, 23, and 30 K, and re-cooled to 9 K; (b) absorbance curves just deposited at 9 K, warmed to 12, 18, 23, and 30 K, and re-cooled to 9 K. The direction of changing temperature for the icy sample is indicated by the arrow.
The thermal spectra of O2 ice varied markedly in wavelength range 450–1020 nm as shown in Fig. 4; those spectra can be roughly classified into two distinct sets, set-1 and set-2. Set-1 includes the curves for the icy samples at temperature 9, 12, 18, and 23 K; set-2 comprises those at 30 K and re-cooled to 9 K again. As a result, the absorptions in the set-2 are much greater than those in the set-1; this phenomenon is remarkable, as displayed in Fig. 4(b). Regarding Fig. 3, set-1 of solid oxygen contains lines of solid α-oxygen mixed with the imperfect O2 lattice; set-2 of solid oxygen excludes the contamination of the imperfect O2 crystal. In addition, the two spectra in set-2 are associated only with pure α-O2 at 9 K and β-O2 at 30 K, respectively. Remarkably, the spectra of α- and β-oxygen solids, as marked in Fig. 4, are similar in the wavelength region 450–1020 nm.
The spectral information for solid oxygen is fundamental for chemistry and physics; it is essential in basic science and must comprehensively established in the data bank. For this purpose, we summarize our measurements of spectra for the solid O2 in this work; combing the visible and IR absorption spectra, the results are shown in Fig. 5. The absorption spectra of solid α-O2 of thickness 12 μm at 9 K and solid β-O2 at 30 K in wavelength ranges 450–1020 nm and 2000–25 000 nm (5000–400 cm−1) are summarized in Fig. 5; for comparison, the intact solid O2 deposited at 9 K is included. Fig. 5 can provide semiquantitative information of absorptions for oxygen solids in this wavelength region; for example, the absorptions of oxygen solids in the visible region are at least one order of magnitude greater than those in the IR region. We believe that this spectral information is valuable and should be recognized as such.
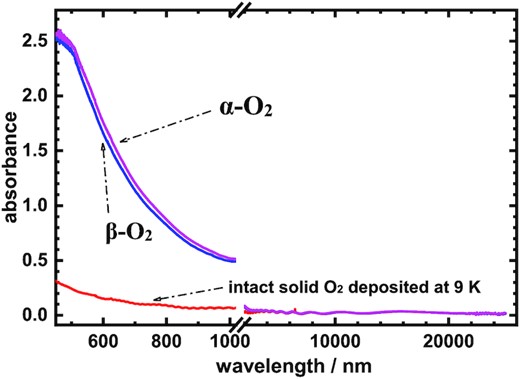
Absorption spectra of the solid α-O2 at 9 K, the solid β-O2 at 30 K, and the intact solid O2 deposited at 9 K with thickness 12 μm in wavelength ranges 450–1020 nm and 2000–25 000 nm (5000–400 cm−1). Note: there is no data between 1020 and 2000 nm.
Astronomical objects may contain various gases in composition, If the temperature descends slowly enough in the astronomical environments, the fractionation effect may occur for solids in thermal cycling process. For example, if the object contains some simple molecules O2, N2, CO, and CH4 in gaseous composition, considering that the melting points of these molecules are 54.36, 63.23, 68.13, and 90.69 K, respectively, separate pure molecular solids might then form layer by layer in sequence O2, N2, CO, and CH4 from top to bottom in slow cooling process. Whereas, if the temperature drops suddenly from 95 to 50 K, the imperfect solid might then form in a mixture of these molecules. An example of where such freeze out of species following a temperature gradient (after a protostellar outburst) occurred in low-mass protostar HOPS-68 (Poteet et al. 2013).
The temperature of the ISM might be in a range 10–55 K (Ferriere 2001; Kalvāns & Kalnin 2022); in such environments, a thermal variation of icy analogues might be engaged in warming and cooling cycles between 10 and 55 K periodically. Our results for the thermal spectral variation of O2 ice thus offer a clue to understand the thermal astrophysics in cold space. In addition, irradiation of icy analogues of simple molecules, such as O2 ice, upon light or bombardment of energetic particles (atom, cosmic ray or electron) might conduct chemical reactions to form the complicated astronomical molecules and ultimately generate the origin of life in space (Ward et al. 2019). Among these developing procedures, a photon-induced chemical reaction contributes a potential route of activity for evolution; measurement of photoabsorption for icy analogue in laboratory is hence an essential task to understand the role of photochemistry inside cold space. In this work, we carefully determined the photoabsorptions of various O2 solids at temperatures 9–30 K; as a result, we found dissimilarities of photoabsorption for α-, β-, and imperfect O2 solids in the visible wavelength range. The discrepancies of photoabsorption for various O2 solids might extend to the entire ultraviolet, vacuum-ultraviolet, and X-ray region; we suggest that scientists continuously investigate these data of O2 solids at low temperatures in future. Additionally, considering that differences of thermal absorptions of various O2 solids appear at low temperatures their irradiated chemistries might display thermal effects also. We also suggest that the previous work on the chemistry of irradiated solid O2 (Ennis & Kaiser 2012; Bennett et al. 2014; Sivaraman et al. 2014; Zhen & Linnartz 2014; Chou et al. 2018; Lo et al. 2018a, b; Leroux & Krim 2021) be further studied to understand the thermal property of solid O2 in detail; for this perspective view, our present work might open a new research target for icy analogues.
3. CONCLUSION
We measured spectra of solid molecular oxygen in the visible and near-IR wavelength range 450–1020 nm and the mid-IR in wavenumber range 500–5000 cm−1 (2–20 μm) at temperatures 9–30 K. From the thermal mid-IR spectra, we found that solids α-, β-, and imperfect O2 might be present at temperatures 9–30 K. Solid α-O2 features IR lines at 1591 and 1617 cm−1; at low pressure, α-O2 exists below phase transition temperature 24 K. In contrast, solid β-O2 appears featureless above 24 K. Noticeably, the imperfect O2 crystalline characterizes a triplet of IR lines at 1545.7, 1548.1, and 1549.6 cm−1; from thermal IR spectra, we conclude that the upper temperature of existence of this imperfect solid is 27 K. In this work, we obtained the spectra of solids α- and β-O2, for solid O2 re-cooled from 30 to 9 K and at 30 K, respectively. Overall, the spectra of solids α- and β-O2 appear similar in the visible region, but differ substantially from the spectrum of solid O2 contaminated with imperfect crystallinity. Our present findings might open new research directions for icy analogues in space.
NOTES
The authors declare no competing financial interest and no conflict of interest.
ACKNOWLEDGEMENTS
National Science and Technology Council of Taiwan (grant 111–2113-M-303–001) provided support for this research. We thank National Synchrotron Radiation Research Center in Taiwan for providing instruments for the measurements.
DATA AVAILABILITY
All data discussed in the paper will be made available to readers on request to the corresponding author.
