


ABSTRACT
The intrinsic intensity (band strength) of the fundamental vibrational band of crystalline carbon monoxide (CO) was first determined 50 yr ago, but those pioneering measurements have seldom been revisited despite CO's importance in interstellar and Solar System chemistry and CO's abundance and distribution in extraterrestrial environments. On the semicentennial of those first measurements, which remain in wide use among observational and laboratory astrochemists, we have reexamined those infrared (IR) band-strength determinations, including the density and refractive index data on which they rest, and find that the published results rest on a mere two data points. Here we use new laboratory data to identify and address errors and concerns in that original work from a half-century ago, plus a result from nearly 100 yr ago. We report new IR intensities for crystalline CO's fundamental IR band over a range of temperatures and resolutions for the first time, finding that there is not a single unique band strength that applies to all conditions. Optical constants have been calculated, including a set at a higher resolution than in the literature. We also present the first direct IR intensity measurements of the fundamentals of solid 13C16O, 12C17O, and 12C18O. Finally, the first IR transmission spectrum of amorphous CO is presented along with a band-strength estimate. All results are for temperatures below 30 K, and so are relevant to studies of solid CO in the outer Solar System and the interstellar medium.
1 INTRODUCTION
Carbon monoxide (CO) is one of the more common extraterrestrial molecules, being found both within and beyond the Solar System. Carbon monoxide ice has been identified on Triton (Cruikshank et al. 1993) and Pluto (Owen et al. 1993), and solid CO is in the nuclei of comets, as deduced from its gas-phase coma presence and the CO+ ion. Carbon monoxide is the third most abundant ice molecule in the interstellar medium (ISM), found there as a component of the ice mantles of interstellar grains (Lacy et al. 1984; Boogert, Gerakines & Whittet 2015). Ionizing radiation readily decomposes organic molecules containing C, H, and O, such as CH3OH, to give CO. This implies that solid CO can be formed and trapped in CH3OH-containing ices, such as those of the Centaur object Pholus (Cruikshank et al. 1998; Merlin et al. 2012) and ultra-red TNOs (Dalle Ore et al. 2015). Both radiolysis and photolysis of CO2 ice produces solid CO, with relevance to that molecule's presence on Galilean satellites (Carlson et al. 1996).
Nearly all remote identifications of extraterrestrial solid CO rely on infrared (IR) observations, extending from the earliest detections of interstellar (Lacy et al. 1984) and planetary (Cruikshank et al. 1993) solid CO to more recent work involving, for example, observations of CO with the Infrared Space Observatory, the Spitzer Space Telescope, and the NASA Infrared Telescope Facility SpeX spectrometer (e.g. Dartois 2005; Zasowski et al. 2009; Boogert et al. 2022). For such investigations, laboratory reference spectra are required with which to compare observational results. Going further, determinations of solid-CO abundances in extraterrestrial environments require not just spectra, but also spectral intensities, such as IR band strengths, which we denote as A'. For interstellar molecular abundances, or for those in laboratory analogs, equation (1) gives the column density N of a molecular ice component from the integrated optical depth (τ) over a wavenumber (|$\tilde{\nu }$|) range of an IR band of that same molecule. The quantity A' in (1) is the IR intensity (i.e. band strength) of the molecule's observed solid-phase infrared feature, and is the focus of much of this paper.
Over the past decade, we have measured and published IR intensities (A' values) of about forty solid compounds, covering a variety of reasonably stable inorganics and organics (Materese, Gerakines & Hudson 2021). We now turn our attention to solid CO, for which an IR band strength was first measured by Jiang (1972) for his PhD research and subsequently included in Jiang, Person & Brown (1975). As of this writing, that paper's A' value and other results for crystalline CO have been cited nearly 200 times and used in what are no doubt thousands of laboratory measurements and analyses of astronomical observations. From the past year alone, there have been multiple studies using Jiang's work, either directly or indirectly, such as Ahrens, Meraviglia & Bennett (2022), Boogert et al. (2022), Chuang et al. (2022), Kim et al. (2022), Müller et al. (2022), and Onaka, Sakon & Shimonishi (2022) among others. Perhaps most recent of all is an early report of interstellar ices observed with the James Webb Space Telescope (McClure et al. 2023). Gerakines et al. (1995) is the source given for the CO band-strength adopted, but those authors took their reference value from Jiang et al. (1975).
On the 50th anniversary of Jiang's study of solid CO, we have reexamined his measurements and in the process have found errors and concerns that seem to have gone uncorrected for a half century. Here we address those concerns with new measurements to redetermine intensities of the fundamental and first overtone IR bands of crystalline 12C16O, quantities relevant to both Solar System and interstellar astronomy. We also report IR band strengths of the fundamental vibrations of crystalline 13C16O, 12C17O, and 12C18O. Accompanying this effort, we have prepared and recorded conventional IR transmission spectra of amorphous CO near 10 K, apparently for the first time. The intensity of the amorphous solid's fundamental vibrational band has been estimated from these same spectra. Our new results have immediate applications to measurements of CO abundances in extraterrestrial ices.
2 BACKGROUND TO IR INTENSITY MEASUREMENTS
The literature covering IR spectroscopic studies of solid CO can be described as large, even voluminous, and it is neither our aim nor desire to review it. However, before presenting our new work it is necessary to briefly describe the methods that we and others use to determine IR band strengths and also to examine some of the earlier studies, which we do in the next two sections.
The methods and procedures used in most contemporary cryogenic IR measurements of solids can be traced to the 1950s when Wagner & Hornig (1950) first described a low-temperature cell and rock salt substrate suitable for IR studies of condensed vapours. A variation on their design involved the replacement of the substrate with a closed cell into which a liquid could be added and then cooled to its freezing point for measurements, this arrangement being used by Person & Swenson (1960) to record IR spectra of solid benzene (C6H6). However, the IR intensities reported by those two authors disagreed with later measurements on benzene condensed onto a silver chloride (AgCl) substrate near 77 K (Hollenberg & Dows 1961). The controversy soon was settled (Yamada & Person 1963) in favour of the gas-phase condensation method as opposed to cooling a liquid in a closed cell, the key observation being the ease and accuracy with which optical interference methods could be used to directly determine the thickness of a solid made by vapour-phase deposition. All of the work described in this paper is based on CO-ices formed by vapour-phase condensation.
The equation used for laboratory determinations of band strengths (A') is a modification of (1) above. Laboratory spectrometers typically record absorbance (𝒜) spectra on a common-log scale according to equation (2), where I0 and I are the intensities of an IR beam passing through a bare substrate and the same substrate with an ice sample condensed on it, respectively.
The relationship between optical depth (τ) in equation (1) and absorbance is τ = 𝒜 × ln(10). The column density N in (1) is a product of a sample's number density ρN, usually in molecules cm−3, and its thickness (h), N = ρNh. Combining these expressions with (1) gives equation (3) after only a slight rearrangement (Hollenberg & Dows 1961).
In practice, one prepares a sample of known thickness, records its IR spectrum over the band of interest, and then integrates that same IR feature over a wavenumber (|$\tilde{\nu }$|) interval, in cm−1, to give the value of the integral in equation (3). The process is then repeated with one or more samples of a different thickness. Finally, the integrated absorbances on the left in (3) are plotted as a function of ice thickness (h) to give a line with a slope from which the apparent band strength A' is calculated. Examples are given in our Results section.
To use (3), the sample's number density and thickness must be known. Number density ρN, usually in molecules cm−3, is calculated from ρN = ρ (NA/M) where ρ is the sample's mass density, typically in g cm−3, NA is Avogadro's constant, and M is the molar mass of the compound being studied. Mass density can be obtained from, for example, a diffraction method, flotation, or a microbalance. The innovation of Hollenberg & Dows (1961) was to determine a solid's thickness by measuring interference fringes made by light of a wavelength λ either passing through or reflected from the ice sample during its growth by vapour- or gas-phase condensation. The sample's thickness is then calculated from equation (4) below, where Nfr is the number of interference fringes recorded during an ice sample's formation, n is the ice's refractive index at λ, and θ is the angle between the incident light of wavelength λ and a line drawn perpendicular to the substrate (Heavens 2011).
For the work in this paper, θ ≈ 0° so that equation (4) reduces to equation (5).
See Hollenberg & Dows (1961) for an early use of (5) for thickness measurements. To calculate h from equations (4) or (5), a value of n is assumed, estimated, or taken from the literature, if available. Our preference, however, is to measure n with interferometry (e.g. Tempelmeyer & Mills, 1968; Hudson et al. 2017, 2020).
3 SOME EARLIER WORK ON SOLID CO-PROBLEMS AND CONCERNS
With the previous section in mind, we now consider the earlier, original work related to the intensity of the IR fundamental band of CO, the feature most often used to determine abundances of CO in interstellar ices. The three areas covered are the density of solid CO, the refractive index of solid CO, and the IR spectrum of solid CO.
Laboratory measurements of solid carbon monoxide's density began with the work of Vegard (1930), who made crystalline CO by condensing gas-phase CO onto a metal surface near 20 K. Vegard reported a cubic unit cell for solid CO with Z = 4 molecules and a cell parameter of a = 5.63 Å. Using the then current 6.062 × 10²³ for Avogadro's number (Millikan 1917), Vegard reported ρ = 1.0288 g cm−3 for the density of crystalline CO, a value that has been used both directly and indirectly by the laboratory astrochemistry community for decades. For this reason, it is somewhat disturbing to note that Vegard reported ρ to five significant figures from a cell constant with only three significant figures. Also, his density either was misprinted or calculated incorrectly. The data in his 1930 paper lead to ρ = 1.04 g cm−3, not ρ = 1.0288 g cm−3, a difference of about 1 per cent that has propagated through subsequent measurements of solid-CO abundances in the ISM for about 40 yr.
Measurements of the refractive index (n) of solid CO extend back a half-century to the work of Jiang (1972) in his PhD dissertation and later in Jiang et al. (1975). The method used was only briefly described in the 1975 paper, but Jiang's dissertation gives details of the procedure. The technique used to determine n relied on the observation and comparison of relative amplitudes of interference fringes observed when CO was frozen onto three pre-cooled substrates of known refractive index. The solid with the lowest index was LiF, for which it was assumed that n = 1.37 at 1000 cm−1 (λ = 10 μm). However, this value of n is for LiF near the sodium-D lines (λ ≈ 590 nm), the actual value needed being the much lower n(1000 cm−1) ≈ 1.1 (Li 1976). The use of n = 1.37 in Jiang (1972) and Jiang et al. (1975), as opposed to n = 1.1, introduces an error into the refractive index reported, n = 1.365, and into the ice thicknesses for solid CO. Moreover, the precision in measuring the amplitudes of interference fringes was not specified by the authors, and no uncertainty in the final result was provided.
The third part of an IR band-strength determination with equation (3) is, of course, the preparation of ice samples, the recording of their IR spectra, and the integration of the features of interest. Jiang et al. (1975) reported measurements on two CO ices at 30 K, followed by integrations of the compound's fundamental IR band. The two integrated absorbances that resulted are plotted with triangular symbols in Fig. 1(a). Panels (b)–(d) show three ways to extract a slope from these two points. Panel (b) shows a line drawn through the two data points, with a slope that can be used to calculate a band strength as described in our Section 2. The resulting slope yields A'(CO) = 9.10 × 10⁻¹⁸ cm per molecule, about 13 per cent lower than the two band strengths of Jiang et al. (1975). The approach in Fig. 1(c) is to draw a least-squares line through the same two data points, but with the line constrained to pass through the plot's origin. We do not recommend this approach, as the origin (0,0) is not a data point. Fig. 1(d) shows the approach used by Jiang and colleagues. Our equation (3) and the ρ value for solid CO of Jiang et al. (1975) were applied to each point, giving a band strength from each, namely A'(CO) = 1.04 × 10⁻¹⁷ and 1.05 × 10⁻¹⁷ cm per molecule. Again, the origin (0,0) of the graph is not itself a data point, and so we do not recommend calculating A'(CO) in this way. What is needed to decide among these various approaches and A' values of Fig. 1 is, of course, additional data. (Note that several of the entries in table 2 of Jiang et al. (1975) have small numerical errors, including the band strength given in that paper's abstract. Also, the concentrations or concentration units in that same table are off by a factor of 1000.)
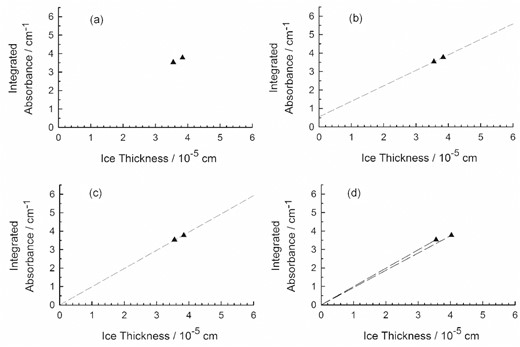
The two integrated absorbances of Jiang et al. (1975) for crystalline CO at 30 K along with three ways of calculating a slope for determining a band strength. The position of the upper point in (d) has been shifted to the right by 5 per cent to better show the two lines drawn to the origin.
We emphasize that essentially all abundances of interstellar solid CO reported over the past 40 yr rest directly or indirectly on the two points of in Fig. 1(a), from which Jiang (1972) and Jiang et al. (1975) derived solid-CO band strengths by a method we cannot recommend. Those values and variations of them have been adopted, modified, and used as a reference to reach other band strengths by a generation of observational and laboratory astronomers and astrochemists. For example, one finds A' = 1.06 × 10⁻¹⁷ cm per molecule in the discovery paper for solid-phase interstellar CO (Lacy et al. 1984), then later a value of 1.0 × 10⁻¹⁷ cm per molecule (Sandford et al. 1988), followed by a 10 per cent rise to 1.1 × 10⁻¹⁷ cm per molecule (Gerakines et al. 1995), and then another increase to 1.12 × 10⁻¹⁷ cm per molecule (Bouilloud et al. 2015). Going further, as of this writing (early 2023), the Web of Science database reports nearly 200 citations for Jiang et al. (1975), and several times that number for two influential papers that built on it (i.e. Sandford & Allamandola 1988; Gerakines et al. 1995) in studies of neat CO or CO mixed with other ice components (e.g. H2O).
To summarize, the IR band strength of solid CO most widely used by astronomers and laboratory scientists since 1984 is based on (i) a density with an arithmetical mistake from 1930, (ii) an erroneous refractive index from 1975, (iii) IR spectroscopic measurements with only two ices, and (iv) a questionable treatment of the resulting data in a Beer's Law plot.
Two other studies of solid CO's IR band strength can be found in the laboratory astronomy literature. Bouilloud et al. (2015) and Diaz et al. (2022) suggested A' values somewhat higher and lower, respectively, than the ∼1.0 × 10⁻¹⁷ cm per molecule of Jiang. In Table 1 we have summarized many of the key conditions of those two papers along with those of Jiang et al. (1975) and of our new work presented here. The table shows that the number of CO-ice samples examined in the three earlier studies varied from two to four, each measured at a single temperature and one resolution. Integration limits were not reported and in some cases the range of ice thicknesses examined is unknown. The spectral resolution in the most-recent study (Diaz et al. 2022) is less than that used 50 yr ago, and in none of the earlier work was a limiting resolution suggested. Only Jiang et al. (1975) calculated a band strength for crystalline CO using a density from a diffraction study of crystalline CO. Other conditions covered by Table 1 will be addressed in subsequent sections.
Simplified summary of four studies of α-crystalline CO’s IR intensities.
| Jiang (1972) a | Bouilloud et al. (2015) b | Diaz et al. (2022) c | This work (2023) d | |
|---|---|---|---|---|
| Number of ices | 2 | 4 | 3 | 31 |
| Deposition T/K | 30 | 25 | 20 | 10, 20, 25 |
| Deposition rate/μm h−1 | ∼60 | ∼4 | ∼2 | ∼2 |
| Ice thickness/μm | ∼0.4 | < 0.74 | 0.24 | ∼0.1–0.5 |
| Measurement of interference fringes | Transmission | Reflection | Reflection | Transmission |
| Fringes’ λ/nm | 10 000 | 632.8 | 632.8 | 670 |
| IR resolution/cm−1 | 1 | 1 | 2 | 0.125–2 |
| Refractive index, n | 1.36 | 1.25 | 1.30 | 1.292 |
| Density, ρ/g cm−3 | 1.0288 | 0.80 | 0.876 | 1.029 |
| Density agrees with diffraction literature | Yes | No | No | Yes |
| Beer's Law plot shown | Yes | No | No | Yes |
| Integration range(s) given | No | No | No | Yes |
| Limiting resolution given | No | No | No | Yes |
| Allowance made for 2-side deposition | Unknown | Unknown | Unknown | Yes |
| Allowance made for C & O abundances | Unknown | Unknown | Unknown | Yes |
All of these observations suggest that a reexamination is needed of the IR band strength of solid CO over a larger number of samples, temperatures, and spectral resolutions. To that end, we have remeasured ρ and n for solid CO, evaluating the older work and presenting new data. We have recorded new IR spectra of CO and combined them with our ρ and n results to recalculate the IR intensity of CO's fundamental band. The influences of both temperature and IR resolution have been examined for the fundamental vibration's intensity. We also have measured band strengths of a few other crystalline CO features directly for the first time, taking into consideration the natural abundances of C and O. Optical constants have been calculated for the fundamental band of crystalline CO at two resolutions. Finally, we present the first conventional IR transmission spectrum of amorphous CO along with an estimate of the intensity of its fundamental vibrational feature.
We remind readers that many of the older IR band-strength measurements in the literature, including some still in use, come from a time of dispersive IR spectrometers, vacuum-tube power supplies, and band integrations with mechanical planimeters, slide rules, and analog calculators. Tasks such as baseline corrections, offsets, and spectral subtractions were done manually, in contrast to today's adoption of software with graphical user interfaces. The scanning speed stated by Jiang (1972) of 3 cm−1 min−1 for a 1-cm−1 resolution spectrum meant that about 24 h were needed to record a single spectrum of CO over the 5000–500 cm−1 region we typically study, in contrast to about 7 min for most of our own work with modern software, Fourier-transform spectrometers, integrated circuits, and solid-state power supplies. Given these changes of the past 50 yr, it would be rather remarkable if differences were not found in IR band strengths when new methods are applied to the spectra of solid CO.
4 EXPERIMENTAL METHODS
Our methods have been described in numerous publications from our group, including several papers in this journal (e.g. Hudson & Gerakines 2019a, b; Hudson & Ferrante 2020; Yarnall, Gerakines & Hudson 2020; Gerakines et al. 2022), and so only a summary is given here. The techniques for making ices, recording spectra, and calculating thicknesses were similar to those of Hudgins et al. (1993).
Infrared spectra were recorded with a Thermo iS50 IR spectrometer from 5000 to 500 cm−1, usually with a resolution of 1 cm−1 and 200 accumulations per spectrum. The IR beam was aligned perpendicular to the plane of solid-CO samples. A few IR measurements were made of samples deposited onto a polished metal substrate at 25 K, with spectra recorded by reflection, but the great majority of our spectra were recorded in a conventional transmission arrangement. Variations in resolution, accumulations, ice temperature, and other parameters were made to examine their influence on CO spectra.
Ices were grown by condensation of research-grade CO gas (Matheson, 99.999 per cent) onto a pre-cooled CsI substrate in a vacuum chamber (∼10−8 Torr), with each sample's thickness being determined by interference fringes from a laser's beam (λ = 670 nm) passing through the ice during its growth. Deposition rates typically were such that an ice's thickness increased at ∼0.02–2 μm h−1, with final thicknesses being less than ∼0.6 μm for measuring the intensity of the fundamental band of 12C16O and up to ∼5 μm for weaker features. The cooling system for making and studying CO ices by IR spectroscopy was a closed-cycle ARS cryostat (DE202SE, minimum T ∼ 10 K). A few measurements were carried out with 13CO (Matheson, 99.99 per cent), C18O (Isotec, 90.83 per cent), N2 (Air Products research grade. 99.9995 per cent), and argon (Air Products research grade. 99.9995 per cent).
Our method for gas condensation to make an ice for IR analysis was not particularly different from anything we have used in the past or that has been used by others. The CsI substrate at the end of our cryostat's second stage was surrounded by a polished nickel-plated copper thermal shroud, sometimes called a radiation shield, that reached ∼30 K and served as a ‘cold finger’ to trap condensable gases and reduce heating of the sample by the room-temperature walls of the vacuum system. In our current arrangement, a gas (e.g. CO) first entered a small pre-mixing chamber and then diffused into the vacuum system housing the ice through an opening about the same in area (∼5 cm2) as the substrate. We found that the resulting ice's IR spectrum was comparable to that from depositions using a ‘shower-head’ (capillary array) disperser to spread the condensing gas over the substrate. Well-defined interference fringes attest to the optical quality of the ice.
We were unable to use the experimental arrangement of Jiang (1972) to record interference fringes. His method was to record fringes generated by his dispersive spectrometer set at λ = 10 µm, something we could not easily do with our Fourier-transform instrument. In our arrangement, fringes were recorded by transmission of a laser's beam aligned 90° away from the IR beam. After the desired number of fringes was observed, the deposition was halted and the substrate and ice were rotated 90° to face the IR beam and record spectra. This is the same setup we used to measure optical constants in Moore et al. (2010), with a diagram being included in that paper.
Other researchers have arranged the relevant equipment in different ways. For example, Bouilloud et al. (2015) measured transmission IR spectra but recorded interference fringes reflected at an angle of 45° to the substrate and ice, necessitating the use of equation (4) to correct for the angle as opposed to the simpler equation (5). Something of an opposite arrangement was used by Diaz et al. (2022), who positioned the substrate and ice at an angle of 45° with respect to the IR beam, but measured fringes by reflection almost perpendicular to the ice, necessitating an angular correction to the IR intensity. We will return to these differences in our Discussion.
We measured ice density (ρ) and refractive index at 670 nm, denoted n670, by making ices by condensation in an ultrahigh vacuum (UHV, ∼10−10 Torr) system. Two-laser interferometry was used to determine n670 and a quartz-crystal microbalance (INFICON) was used to measure ρ. See Hudson et al. (2017) for more details.
5 RESULTS
5.1 Solid CO
Two different forms of crystalline CO exist at low pressures or under vacuum. The lower-temperature form is designated α and the higher-temperature form is designated β, the transition temperature being 61.6 K (e.g. Clayton & Giauque 1932; Vegard 1934). In addition to these two crystalline solids, Kouchi (1990) reported that an amorphous form of CO could be made by slow condensation of CO gas. Specifically, condensations giving an increase in the ice sample's thickness above 0.1 µm h−1 at 10 K resulted in α-CO, not an amorphous solid. Warming amorphous CO from 10 to about 23 K gave α-CO, the crystallization being followed by electron diffraction. Mizuno, Kofu & Yamamuro (2016) used an even lower condensation rate and temperature for a thickness increase of just 0.020 µm h−1 at 3 K to make amorphous CO. A higher condensation rate at 3 K gave α-CO, as did warming the original sample from 3 to 15 K.
Infrared spectra of solid CO have been published many times since the 1950s and essentially all such IR spectra were of ices condensed at growth rates that exceed the values of Kouchi (1990) and Mizuno et al. (2016), sometimes by several orders of magnitude. The result is that such solids were crystalline CO, usually the low-temperature (α) form. Despite the importance of amorphous solids in interstellar chemistry, it is difficult to find any firm claim of amorphous CO supported by IR spectra recorded under a variety of conditions and with comparisons to the literature on other amorphous ices. Therefore, in the following we address this deficiency by presenting the preparation and IR spectrum of amorphous CO, along with a band-strength estimate. We first, however, describe our results for crystalline CO, including new density and refractive index values, and comment on two complications.
5.2 Density and refractive index results
As stated in Section 3, there are problems and uncertainties surrounding the IR intensity of CO's fundamental band near 2140 cm−1 due to questions about the ice's density (ρ) and refractive index (n). Therefore, we decided early on to remeasure both properties. We selected 25 K for growing crystalline CO to be safely in the region of the α phase, avoiding possible complications from non-crystalline material at lower temperatures or from sublimation at higher ones. This temperature also is the average of the three values used in earlier IR studies of Table 1.
Our results are easily stated. We measured the refractive index at 670 nm and density (ρ) of CO ice four times at 25 K with our two-laser interferometry and quartz-crystal microbalance equipment, finding n670 = 1.292 ± 0.003 and ρ = 1.029 ± 0.005 g cm−3. As part of our work, we also measured n670 and ρ for argon at 30 K, finding n670 = 1.297 ± 0.003 and ρ = 1.747 ± 0.002 g cm−3 from three ices, well within 1 per cent of the literature values of 1.288 (644 nm) and 1.752 g cm−3 at 30 K (Sinnock & Smith 1969). Our argon measurements were used to test our suspicion that the n = 1.36 for CO and n = 1.41 for argon measured and reported by Jiang et al. (1975) were too large.
5.3 Making and measuring crystalline CO ices – two complications
With n670 and ρ in hand for solid CO at 25 K, the remaining task was to prepare CO ices of known thickness, record their IR spectra, and construct Beer's Law plots, as in Fig. 1 but with more than just two data points and over a larger range of ice thicknesses, temperatures, and spectral resolutions. However, before presenting our results we need to describe two complications involving the interference fringes.
Fig. 2(a) shows the interference fringes we observed as CO condensed onto our CsI substrate at 25 K, and immediately obvious is a two-period pattern. As a check, we carried out a CO deposition in a different laboratory system, again involving transmission through a CsI window. An interference pattern similar to that of (a) in Fig. 2 was observed. Measurements next were made with N2 in each laboratory system, N2 being isoelectronic to CO, and once more two-period fringe patterns were seen. These four sets of measurements were followed by four additional ones, but with CO and N2 deposited on metal discs (Au and Al) at 25 K inside two additional laboratory vacuum chambers, interference fringes being recorded by reflection from the metal surfaces. In all four cases, only a one-period pattern of fringes was observed in the reflection arrangement, an example of which is shown in Fig. 2(b). A few supporting measurements of interference fringes were made with argon deposited at 30 K, and the results were the same as seen with CO and N2.
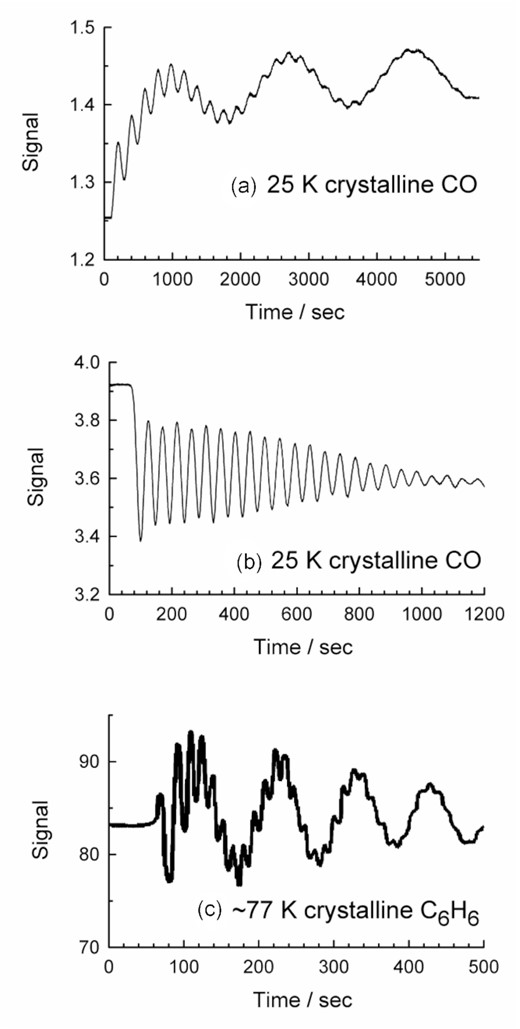
Interference fringes from depositions of (a) CO at 25 K, recorded in transmission, (b) CO at 25 K, recorded in reflection, and (c) C6H6 at 85 K, recorded in transmission (digitized from Hollenberg & Dows, 1962).
We have sought two-period fringe patterns for the gas- and vapour-phase deposition of a variety of compounds in the past, but have not found such patterns until now. The only example of a similar two-period fringe pattern that we have seen in the refereed literature is for the condensation of benzene (C6H6) near 85 K by Hollenberg & Dows (1962), which is shown as Fig. 2(c). Those authors interpreted the two-period pattern as the result of condensation on two sides of their cold substrate (AgCl). The short-period fringes were attributed to condensation on the side of the substrate closest to the gas or vapour source, the long-period fringes being from the slower condensation on the opposite side of the substrate. Hollenberg & Dows (1962) tested this interpretation by blocking one side of their substrate during benzene deposition, the result being that only a one-period set of fringes was observed. The corresponding result in our case is that depositions of CO or N2 with fringes measured in transmission always produced a two-period interference pattern, but measurements in reflection from a metal surface gave only a one-period pattern. The only molecular ices in which we have observed this behavior are CO and N2, which are the smallest molecules and the only diatomics for which we have recorded interference fringes and IR spectra.
The relevance of these comments and observations is that calculations of IR pathlength through a CO ice must include the solid sample on both sides of the substrate. In our case, repeated measurements of transmission fringes gave the ratio of fringes on the substrate's two sides as about 9.3 at 25 K, with the ratio hardly changing over the range of deposition rates, deposition temperatures, and ice thicknesses we used. As additional checks on our results, we also recorded IR spectra of CO ices that were sufficiently thick to show pronounced channel fringes in their baseline. Again, a ratio of periods near 9.3 was found.
A second complication discovered during CO condensation was that there was a brief initial delay in interference-fringe formation as relatively smooth, flat layers of CO were formed, all while the intense CO fundamental band rapidly grew into the IR spectrum. We speculate that the radiation shield (thermal shroud) in our system produced an uneven distribution of CO ice on our substrate. A few preliminary simulations (see appendix) showed that a shroud near 30 K, on which CO will not condense efficiently, focuses CO away from the substrate's central region, leaving less ice there. With an IR beam slightly larger in area than the laser beam used to create fringes from CO in the substrate's central region, IR absorbance will start before and rise faster than the growth of the CO ice needed to create interference fringes. Regardless of the cause, the initial delay in fringe formation resulted in a small offset for thickness measurements of about 0.1–0.2 fringe, or ∼0.03 μm, at 25 K. Put another way, the ice thickness corresponding to any particular absorbance value was actually about 0.03 μm higher than indicated by interference fringes. This was not a problem for calculating the band strengths of this paper as band strengths (A') depend on slopes (see Section 2) and not absolute thicknesses. Moreover, if absolute thicknesses of CO-ice are needed, our band strengths and CO density can be used to calculate them from equations (1) and (6).
Before leaving these complications, we mention two small literature problems. Fig. 1 of Hollenberg & Dows (1962) shows the result of blocking one side of those authors' AgCl substrate while recording fringes during deposition. However, what is shown appears to contradict what is found in those authors' text and what has been described here. The explanation is that the fringe pattern shown by Hollenberg & Dows (1962) with one side of the substrate blocked was recorded with a chart speed about four times higher than that for the pattern with neither side blocked, so that only the short-period fringes were observed. See the PhD dissertation of Hollenberg (1962) for more information.
We also have found interference fringe patterns for CO deposited at 30 K. See page 55 (fig. 12) of the dissertation of Jiang (1972). His patterns resemble those in our Fig. 2, but surprisingly there is no evidence that the solid CO forming on both sides of Jiang's substrate was included in any estimate of CO's IR band strength. These issues also were not mentioned in the subsequent paper of Jiang et al. (1975).
5.4 Infrared spectra – crystalline CO
Studies of the infrared spectra of solid CO can be traced to the work of Ewing & Pimentel (1961) and Ewing (1962) who studied the crystalline solid. Since then, CO-ice has been studied by many researchers using a variety of techniques. As IR spectra of crystalline CO have been presented many times, only a few spectra are included here. Fig. 3 shows an example of spectra that we recorded of the fundamental (1 ← 0) absorbance feature of solid CO grown at 25 K, with insets showing the first overtone (2 ← 0) of 12C16O and the fundamental bands of 12C17O, 13C16O, and 12C18O. In general terms, our spectra agree with those in the literature recorded at a similar resolution (1 cm−1) and temperature (e.g. Ewing & Pimentel 1961; Maki 1961; Jiang et al. 1975; Palumbo et al. 2006; Bouilloud et al. 2015). Peak positions agree with those of Ewing & Pimentel (1961), Ewing (1962), and Maki (1961) to within about 0.1 cm−1. The full width at half-maximum values in our spectra are ∼1.5 cm−1 for the fundamental band and ∼2.5 cm−1 for the overtone, in agreement with the work of Legay, Legay-Sommaaire & Zumofen (1982). Our data give ωexe = 12.4 cm−1 for the first anharmonicity term of 12C16O, essentially the same as from the data of Bouilloud et al. (2015). We also observed, but did not study, a broad phonon side band near 2204 cm−1 and a two-CO-molecule peak near 4277 cm−1 (Legay & Legay-Sommaire 1982). Neither warming nor cooling CO made at 25 K changed the spectra of Fig. 3 significantly except when sublimation was effected, starting rapidly near 28 K. No sublimation was found to have taken place during the ∼7 min needed to record the spectra of Fig. 3. Peak positions scarcely changed with temperature, in agreement with earlier work (e.g. Lasne et al. 2015; Muñoz Caro et al. 2016; Urso et al. 2016).
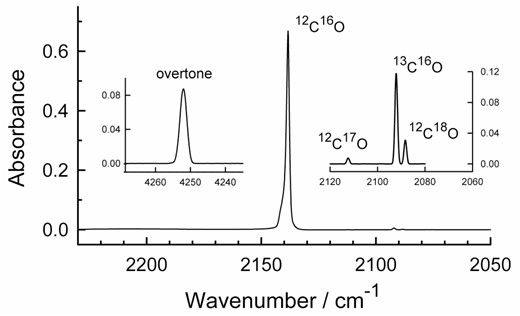
Infrared spectra of α-crystalline CO at 25 K. The large band near 2138 cm−1 is for an ice with a thickness of 0.17 μm. The two insets are for an ice with a thickness of 3.1 μm. See Table 2 for peak positions and band strengths. The spectral resolution for each part of this figure is 1 cm−1.
The 25 K temperature at which the sample of Fig. 3 was made, and its spectrum recorded, suggests that the ice was in the α-crystalline phase of CO, but we sought independent confirmation by comparing to reference spectra of the α and β forms. Fig. 4 shows a spectrum of one of our CO ices at 25 K superimposed on IR spectra of α and β crystalline CO, made without ambiguity by cooling from liquid CO (Ewing 1962). The agreement between our spectrum and that of α-CO is obvious, further confirming that we indeed prepared the lower-temperature (α) polymorph. We have not found a literature figure like Fig. 4, a direct spectral comparison of ices made by cooling liquid CO and by condensation of CO gas.
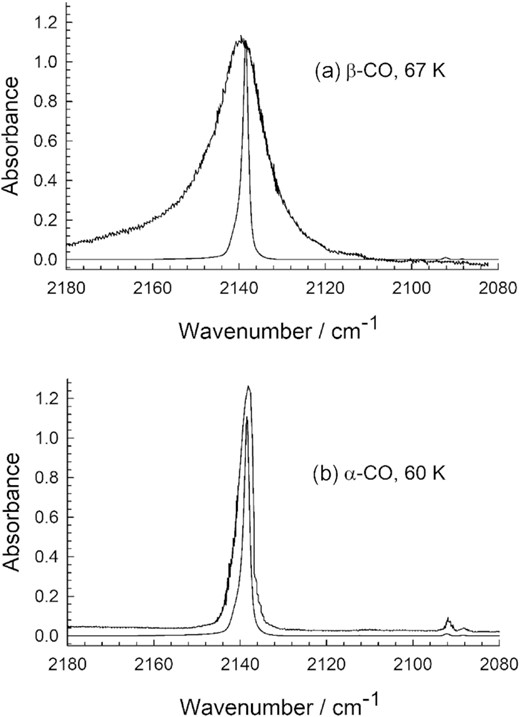
Infrared spectrum of solid CO at 25 K and 1-cm−1 resolution (this work, lower trace in each figure) compared to spectra of α- and β-crystalline CO digitized from Ewing (1962). Heights have been normalized to about 1.2 in each panel.
5.5 Infrared band strengths – crystalline CO
Having prepared crystalline CO ices, remeasured n670 and ρ at 25 K, and addressed complications with determining ice thickness, we were prepared to determine CO infrared band strengths. Thirty-one CO ices were grown by gas-phase condensation at 25 K and the thickness of each was calculated using our newly measured index of refraction and allowing for deposition on both sides of the CsI substrate. The thicknesses for our ices corresponded to roughly 0.5, 1.0, and 1.5 of the short-period interference fringes (λ = 670 nm), always recorded in transmission. Each ice’s 12C16O fundamental IR band was integrated, and a graph following equation (2) of band area against ice thickness was prepared and found to be linear (correlation coefficient ≈ 0.996). A band strength A'(12C16O) was calculated from its slope using our newly measured density at 25 K. The results are shown in Fig. 5, where the precision of the measurements is indicated by some points being so close that they hide others. Plots similar to those of Fig. 5, but with thicker ices, enabled us to determine A' for the first overtone of 12C16O and the fundamentals of 12C17O, 13C16O, and 12C18O.
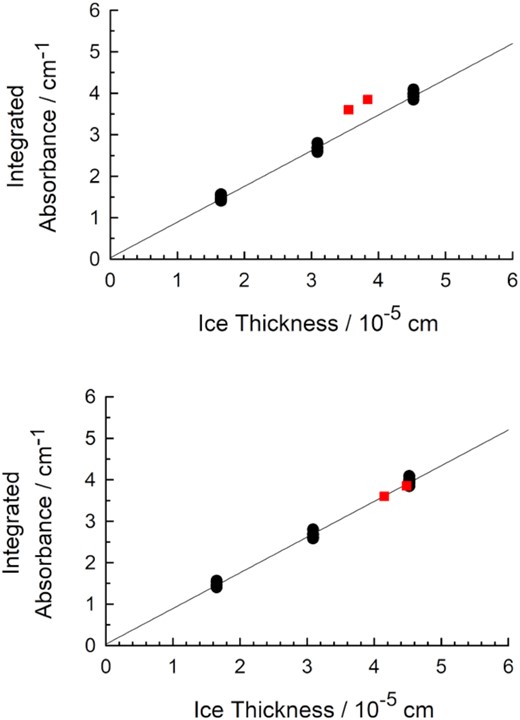
Beer's Law plots from measurements of IR spectra (resolution = 1 cm−1) of thirty-one α-crystalline CO ices. The ices were grown and the spectra recorded at 25 K. The upper graph also includes the two data points of Jiang et al. (1975) as red squares. The lower graph includes the same two points, but after they were corrected for ice thickness as described in the text (Section 5.5).
In both panels of Fig. 5 we also have plotted the two data points of Jiang et al. (1975). The original published values are in the upper panel. The lower panel shows the same two points, but after each ice's thickness was recalculated with our measured refractive index, after allowance for the natural abundance of 12C16O, and after correction for CO-ice being formed on both sides of those authors' substrate, with Jiang's data showing a thickness ratio of ∼9.5:1 for CO on the two sides (Jiang 1972). As can be seen, the agreement with our results is quite good.
The CO band strengths at 25 K that we calculated from the slopes of our Beer's Law plots, such as in Fig. 5, are summarized in Table 2. The table includes the fractional abundance of each of the four isotopic variants (i.e. isotopologues) measured in our CO sample, calculated with the elemental abundances in the IUPAC report of Berglund & Wieser (2011). Integration ranges also are listed.
IR Band Strengths of α-Crystalline CO at 25 K.a
| Isotopologue | Abundanceb | |$\tilde{\nu }$|/ cm−1 | λ/µm | Integration range/cm−1 | Resolution/cm−1 | A'/10−18 cm per molecule |
|---|---|---|---|---|---|---|
| 12C16O | 0.98 690 | 4252.0 | 2.352 | 4256.0–4248.0 | 1 | 0.074 |
| 12C16O | 0.98 690 | 2138.4 | 4.676 | 2170.0–2130.0 | 1 | 9.07 |
| 12C17O | 0.00 038 | 2112.4 | 4.734 | 2114.5–2110.5 | 1 | 9.55 |
| 13C16O | 0.01 067 | 2092.1 | 4.780 | 2095.0–2090.0 | 1 | 5.10 |
| 12C18O | 0.00 203 | 2088.3 | 4.789 | 2090.0–2086.0 | 1 | 7.00 |
Uncertainties in A' are about 5 per cent. See the text.
bThe abundances of the four isotopic variants (i.e. each isotopologue) in our CO sample were calculated with these elemental abundances from the IUPAC report of Berglund & Wieser (2011): 12C (0.9893), 13C (0.0107), 16O (0.99757), 17O (0.00038), and 18O (0.00205). An extra figure has been included for CO abundances in several entries in the table.
Most of our IR spectra were recorded at 1-cm−1 resolution and 25 K, but measurements were also made at other temperatures and resolutions and Beer's Law plots generated for the 12C16O fundamental band in each case. Results are summarized in Table 3, where all A' values are rounded to two significant figures. We found that A' at 25 K and 1-cm−1 resolution increased ∼10 per cent on going to 0.5-cm−1 resolution and fell ∼15 per cent on going to 2-cm−1 resolution. Band strengths rose with decreasing temperature at the lower resolutions. Each value in Table 3 is based on at least six ices. The limiting resolution can be taken as 0.5 cm−1 since higher values give little or no change.
Band Strengths (A') of α-Crystalline 12C16O at Five Resolutions and Three Temperatures.a
| T/K | 2 cm−1 | 1 cm−1 | 0.5 cm−1 | 0.25 cm−1 | 0.125 cm−1 |
|---|---|---|---|---|---|
| 25 | 7.7 × 10⁻¹⁸ | 9.1 × 10⁻¹⁸ | 10 × 10−18 | 11 × 10−18 | 11 × 10−18 |
| 20 | 7.8 × 10⁻¹⁸ | 9.4 × 10⁻¹⁸ | 10 × 10−18 | 11 × 10−18 | 11 × 10−18 |
| 10 | 8.8 × 10⁻¹⁸ | 9.8 × 10⁻¹⁸ | 10 × 10−18 | 11 × 10−18 | 11 × 10−18 |
Units are cm per molecule. Uncertainties in A' are about 5 per cent. See the text. All A' values rounded to two significant figures.
As an example of the combined influence of temperature and resolution, the upper panel of Fig. 6 shows a Beer's Law plot based on six ices, two at each of three thicknesses, at 20 K and 2-cm−1 resolution. The slope of this graph yielded a band strength of A' = 7.8 × 10⁻¹⁸ cm per molecule, slightly lower than our A' = 9.1 × 10⁻¹⁸ cm per molecule at 25 K and 1-cm−1 resolution. The lower panel of Fig. 6 shows something different, a Beer's Law graph for the first overtone of 12C16O, recorded at 25 K with 1 cm−1 resolution and based on 18 ices. The slope of this graph yields the overtone's apparent absorption coefficient (α‘) in the expression τ = α’ h. For solid CO at this wavenumber, we found that α' = 651 cm−1. We return to the two graphs of Fig. 6 in our Discussion.
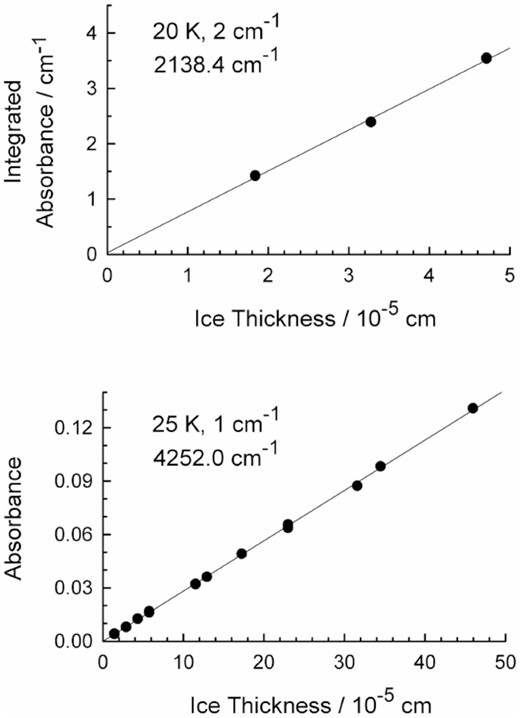
Upper: Beer's Law plot for the fundamental band of 12C16O from six α-crystalline CO ices made at 20 K, recorded with 2-cm−1 resolution. Lower: Beer's Law plot for the first overtone band of 12C16O from 18 α-crystalline CO ices made at 25 K, recorded with 1-cm−1 resolution. Note that the lower graph is for absorbance, not integrated absorbance.
Before leaving this section, we briefly mention two other observations. First, we found that we could deposit CO at 25 K and below with our substrate oriented in the scanning position facing the IR beam so that the radiation shield (thermal shroud) obstructed the incoming gas. The resulting IR spectrum was the same as in Fig. 3. Secondly, our substrate was a binary ionic compound, cesium iodide (CsI). We also deposited CO at 25 K on a layer (h ∼ 0.1 μm) of argon, a monatomic solid. The resulting Beer's Law plot matched that of Fig. 5.
5.6 Infrared spectra and band strengths – amorphous CO
We previously have prepared and studied several molecular solids at such low temperatures that they might have been presumed to be amorphous ices, but in fact were crystalline. We characterized each such ice with an IR spectrum, usually finding our spectrum to be the first such recorded and published for the amorphous solid examined. For examples, see our papers on amorphous acetylene (C2H2), methane (CH4), carbon dioxide (CO2), and nitrous oxide (N2O) in Hudson, Ferrante & Moore (2014), Gerakines & Hudson (2015a, b), and Hudson et al. (2017), respectively. In those studies, we noted several characteristics and trends, summarized in Table 4, related to the preparation and identification of amorphous ices by IR spectroscopy.
Some observations related to amorphous ices and their IR spectra
| 1 | The IR spectrum shows one or more bands with an asymmetric shape, with the slope of the high-wavenumber side less than the slope of the low-wavenumber side. |
| 2 | Formation of the amorphous ice is favoured by gas-phase condensation at low temperatures. |
| 3 | Formation of the amorphous ice is favoured by short deposition times for gas-phase condensation. |
| 4 | Formation of the amorphous ice is favoured by low rates of gas-phase condensation. |
| 5 | An irreversible crystallization is initiated by warming the ice sample. |
| 6 | Crystallization occurs as the thickness of the sample increases on continued deposition. |
| 7 | The spectrum resulting from crystallization by warming is close, but not necessarily identical, to that found on condensation at higher temperatures. |
| 8 | An isosbestic point accompanies the amorphous-to-crystalline change. |
| 9 | The spectrum's appearance resembles that of the corresponding liquid in the sense of broader bands than in IR spectra of crystalline solids and the presence of nominally forbidden features. |
| 10 | The IR spectrum agrees with theoretical expectations for amorphous solids. See, for example, the work of Ovchinnikov & Wight (1993; 1995) or that of Firanescu & Signorell (2009). |
With Table 4 and our earlier work in mind, we began our search for amorphous carbon monoxide by slowly (∼1 μm h−1) condensing CO onto our CsI substrate at temperatures from 10 to 25 K for ∼5 min, the substrate being held under vacuum. The result, as expected, was the well-known IR spectrum of solid CO in the α-crystalline form (Ewing & Pimentel 1961), which we showed in Fig. 3. It was only when we reduced the deposition time to about 5 s at 10 K and lowered the condensation rate that the spectrum took on a different appearance, which is shown in Fig. 7. The upper spectrum of the figure shows the fundamental band of 12C16O, with the middle and lower traces showing the spectra when the gas condensed was 13C16O and 12C18O. The peak positions are 2136.4 cm−1 for 12C16O, 2089.6 cm−1 for 13C16O, and 2085.9 cm−1 for 12C18O, with a hint of a shoulder 4–5 cm−1 higher in each case. No new features were brought out by either higher spectral resolutions (i.e. 0.5, 0.25, and 0.125 cm−1) or small changes (∼25°) in the angle at which the incident IR beam reached the ice sample. No changes were seen on holding these samples overnight at 10 K, but when each CO ice was warmed from 10 K the bands became more symmetrical, narrowed, and sharpened irreversibly, eventually attaining the shape expected for α-crystalline CO. Rates were not measured, but we did find that crystallization was complete in a few minutes at 18 K and in a few seconds at 25 K. An isosbestic point was observed near 2138.2 cm−1, suggesting a smooth conversion to the α phase of solid CO.
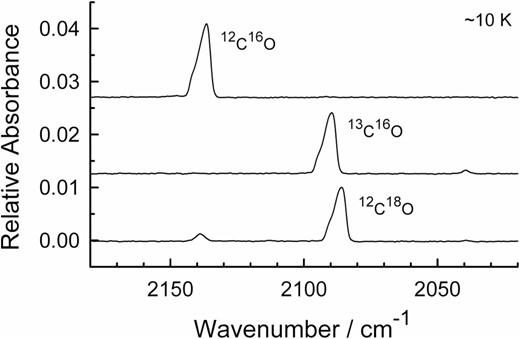
Infrared spectra of the fundamental vibrational band of three amorphous carbon monoxide ices at ∼10 K. Spectra are offset vertically for clarity. The small peak near 2040 cm−1 is from 13C18O. The resolution is 1 cm−1 for the spectra shown.
In reference to the first item of Table 4, we particularly note the pronounced asymmetric shapes of the three large CO bands in Fig. 7 and that the shapes resemble that of the ν5 band of the isoelectronic C2H2 (acetylene) molecule (Hudson et al. 2014). This asymmetric shape, coupled with the low temperature, the brief deposition time, and the low deposition rate needed for the ice's preparation, led us to assign the three large peaks in Fig. 7 to amorphous carbon monoxide. Supporting this assignment was the difficulty of making thicker CO ices that gave such spectra (maximum absorbance to date is ∼0.03), our failure to observe these same spectra either with faster deposition rates or with deposition temperatures above ∼15 K, and the fact that our asymmetric band shapes agree with expectations based on studies of amorphous solids by Ovchinnikov & Wight (1993, 1995) and Firanescu & Signorell (2009).
The thicknesses of our amorphous CO ices were too small either for interference fringes to be recorded during an ice's growth or for multiple channel fringes to be recorded in an ice's IR spectrum. Since these are our usual methods for determining ice thickness, which is needed to determine a band strength according to equation (3), we adopted an alternative method to estimate A' for amorphous CO. After an amorphous CO ice was grown near 10 K, its spectrum was recorded, and then the ice was warmed to 25 K to crystallize it. We found that the area of the fundamental band was nearly the same, within a few per cent, before and after warming. This means that the crystalline-CO band strength for 12C16O of Table 3, A'(CO, 2136 cm−1) = 9.8 × 10⁻¹⁸ cm per molecule near 10 K, is a reasonable estimate for the strength of the fundamental band in the IR spectrum of amorphous 12C16O.
5.7 Optical constants
Band strengths are used to determine molecular abundances, but a complex refractive index, n(|$\tilde{\nu }$|) − ik(|$\tilde{\nu }$|) with optical constants is often needed for theoretical models of IR spectra of extraterrestrial surfaces, such as those of icy worlds. To that end, we calculated n(|$\tilde{\nu }$|) and k(|$\tilde{\nu }$|) for solid CO at 25 K from 2500 to 1500 cm−1. Six CO ices were prepared at 25 K with thicknesses of about 0.14, 0.29, and 0.43 μm (two ices at each thickness). Optical constants were calculated for each spectrum using a Kramers–Kronig routine and the results were averaged to give a final set of n(|$\tilde{\nu }$|) and k(|$\tilde{\nu }$|) values. Fig. 8 shows the results for resolution of 1 and 0.5 cm−1. The computational method is described in Gerakines & Hudson (2020) where various tests are presented along with a link to the software. Our program is, to our knowledge, the only free, open-source, fast, robust, and accurate code for calculating optical constants of ices. python and Windows executable versions are available.
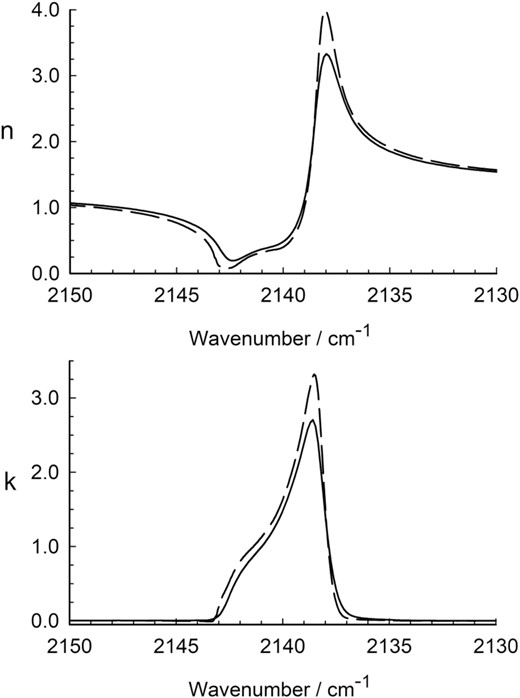
Optical constants of α-crystalline CO at 25 K in the region of the molecule's fundamental IR band. The solid lines are for a spectral resolution of 1 cm−1. The dashed lines are for a spectral resolution of 0.5 cm−1.
6 DISCUSSION
6.1 Comparisons to earlier work – density and refractive index
The data of Vegard (1930) for α-crystalline CO at 20 K give a density of 1.04 g cm−3. (This number is based on the value of Avogadro's constant used in 1930, but it does not change if the current value is used.) The density at 25 K from a more recent X-ray diffraction study is 1.026 g cm−3, from interpolation between the authors’ results at 24 and 26 K (Krupskii et al. 1973). A neutron diffraction study gave 1.033 g cm−3 at 25 K (Wang et al. 2020). Our value, 1.029 ± 0.003 g cm−3, is consistent with these three literature results, and Fig. 9 shows that our density for solid CO fits snuggly on the least-squares line with data for 10 other inorganic compounds. Table 5 gives the values plotted in the figure. This good agreement strongly supports our conclusion that our crystalline CO ices were in the compound's α phase. Vegard (1934) and Krupskii et al. (1973) reported that the higher-temperature β-crystalline phase of CO has a lower density, 0.932 g cm−3, well outside our range of uncertainty.
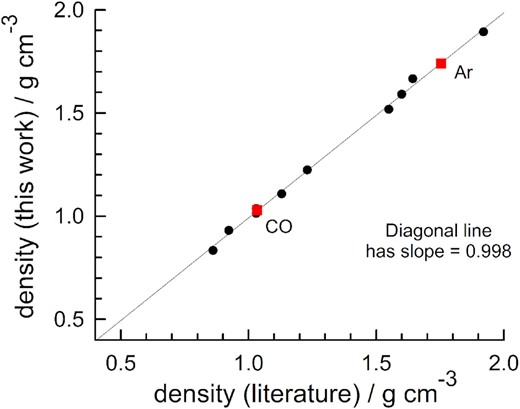
Literature densities for icy inorganic solids compared to values determined by the authors of the present work. The red squares are the densities reported here for α-crystalline CO at 25 K (lower square) and argon at 30 K (upper square). See Table 5 for references and the value of each point. The diagonal line is a linear least squares fit.
Densities of 12 crystalline inorganic ices.a
| Our laboratory | Literatureb | ||||
|---|---|---|---|---|---|
| No. | Formula, name | T | ρ | ρ | T |
| 1 | H2O, water | 150 | 0.931 | 0.935 | 143 |
| 2 | NH3, ammonia | 95 | 0.834 | 0.861 | 77 |
| 3 | HCN, hydrogen cyanide | 120 | 1.037 | 1.030 | 153 |
| 4 | CO2, carbon dioxide | 70 | 1.666 | 1.643 | 150 |
| 5 | N2O, nitrous oxide | 70 | 1.591 | 1.60 | 77 |
| 6 | N2, nitrogen | 19 | 1.013 | 1.03 | 19 |
| 7 | NH4CN, ammonium cyanide | 125 | 1.108 | 1.13 | 194 |
| 8 | H2S, hydrogen sulfide | 80 | 1.224 | 1.230 | 80 |
| 9 | OCS, carbonyl sulfide | 50 | 1.518 | 1.549 | 90 |
| 10 | SO2, sulfur dioxide | 85 | 1.893 | 1.92 | 143 |
| 11 | CO, carbon monoxide (α) | 25 | 1.029 | 1.033 | 25 |
| 12 | Ar, argon | 30 | 1.747 | 1.754 | 30 |
Temperatures are in kelvins and densities are in g cm−3. See also Yarnall & Hudson (2022b).
H2O: Blackman and Lisgarten (1957), NH3 Olovsson and Templeton (1959), HCN: Dulmage and Lipscomb (1951), CO2: Simon and Peters (1980), CO2, N2O: de Smedt and Keesom (1924), N2O: Hamilton and Petrie (1961), N2: Maynard-Casely, Hester & Brand (2020), NH4CN: Lely and Bijoet (1944), H2S: Calculated from Cockcroft and Fitch (1990), OCS: Overell, Pawley & Powell (1982), SO2: Post, Schwartz & Fankuchen (1952), CO: Wang et al. (2020). Interpolation of the densities at 24 and 26 K in Krupski et al. (1973) gives 1.026 g cm−3, Ar: Sinnock & Smith (1969).
In contrast to this agreement stands a lower density of 0.80 g cm−3 from an unrefereed technical report by Roux et al. (1980). Drawings on pages 28 and 29 of that document show that solid CO's density was measured with a quartz-crystal microbalance (QCM) during gas-phase deposition of CO at 20 K. However, the QCM and the window containing the sample for IR and refractive index measurements were in different locations inside the authors' vacuum chamber, leading to a question about whether the same amounts of CO were deposited onto the IR window and the QCM's substrate. More specifically, the thickness of the CO condensed onto the QCM's substrate was not measured, and the authors’ reported CO density contradicts three literature diffraction results (Vegard 1932; Krupskii et al. 1973; Wang et al. 2020). We also find that the stated CO ice thicknesses of Roux et al. (1980) seem unreasonably large. For example, the only IR spectrum shown was said to be for an ice of thickness 4 μm, about 16 times larger than what we measured for the same absorbance near 2140 cm−1. These omissions and concerns lead us to doubt the accuracy of the CO-ice results reported in Roux et al. (1980).
The only subsequent densities and refractive indices for CO that we have found are from Luna et al. (2022). Their fig. 3 shows a CO deposition rate at 14 K that gave an increase in the resulting ice's thickness of about 4 μm h−1, sufficiently fast to crystallize the sample. Their n at 632.8 nm varies from about 1.28 to 1.31 from 13 to 28 K, results into which our n670 ≈ 1.29 fits well for α-crystalline CO at 25 K. However, the densities of Luna et al. (2022) vary from about 0.85 to 0.89 g cm−3, again considerably smaller than both our 25-K result and the densities from three diffraction studies of α-crystalline CO (Vegard 1930; Krupskii et al. 1973; Wang et al. 2020).
A different way to check our n and ρ values is to use them to estimate the polarizability (αCO) of the CO molecule with equation (7) below:
The measurements and formula of Ron and Schnepp (1967) for α-crystalline CO give a polarizability at 670 nm of αCO = 1.98 Å3, compared to our αCO = 1.99 Å3 from (7) and a similar value from Christiansen, Hättig & Gauss (1998). In contrast, the results of Jiang et al. (1975), Roux et al. (1980), and Luna et al. (2022) lead to αCO ≈ 2.35 Å3 in each case.
6.2 Comparisons to earlier work – infrared spectra and band strengths
Our IR spectra of α-crystalline CO agree with the literature in terms of band positions, widths, profiles (shapes), and the relatively small changes seen with temperature. However, quantitative agreement with literature IR intensities is harder to establish. The present paper reports new IR band strengths and two types of supporting measurements. Our spectra are of CO ices that have thicknesses determined with a refractive index measured by two-laser interferometry. The ice density needed to calculate a band strength using equation (3) was measured with a quartz-crystal microbalance, each sample's thickness also being determined by interferometry. Our CO ices were not simply assumed to be of the α-crystalline form, but instead this phase was verified by (i) comparing the measured density to diffraction results, (ii) showing that the combination of the measured n and ρ values gave the expected molecular polarizability, and (iii) by comparing our IR spectra to reference spectra of two phases of crystalline CO. We are not aware of previous work that used any of these three lines of support for published IR band strengths. Therefore, we are confident in our results and can recommend their use by others.
Section 6.1 raised questions about the densities of Roux et al. (1980) and Luna et al. (2022), both papers reporting results that disagree with densities obtained by diffraction measurements, which then leads to polarizabilities about 20 per cent higher than expected. The use of the CO density of Roux et al. (1980) by Bouilloud et al. (2015) introduced a source of error into those authors' calculated IR band strengths for crystalline CO at 25 K. The earlier band strength for α-CO, from Jiang et al. (1975), did use a density from a diffraction measurement (Vegard 1930), but with the arithmetic error already described as well as an inaccurate reference refractive index. Fortunately, there is a serendipitous agreement between Vegard's incorrect density for CO and that from our own measurements and from diffraction studies.
A comparison of our work and that of Jiang et al. (1975) was presented in Fig. 5 and Section 5.5, aided by the ice thicknesses and other details published by those authors. Unfortunately, we were hindered in making a similar comparison to the work of Bouilloud et al. (2015) by what appears to be a contradiction involving the authors' CO band strength and that paper's fig. 6. From measurements of about twenty CO-ice spectra, we found that the ratio of band area to peak height for the 12C16O fundamental band is about 2.2 cm−1 (1-cm−1 resolution, CO ice made at 25 K). Since the peak height in fig. 6 of Bouilloud et al. (2015) is about τ = 2.2, then the expected band area, as an integrated optical depth, is 2.2 × 2.2 cm−1 = 4.84 cm−1. In contrast, multiplying the ice's column density of N = 1.3 × 10¹⁸ molecules cm−2, from the same figure's caption, by the authors' band strength of 1.12 × 10⁻¹⁷ cm molecule −1 gives the integrated optical depth of the 12C16O band in the figure, according to equation (8) below:
This result of 14.6 cm−1 is about 200 per cent larger than the expected 4.84 cm−1. The source of this discrepancy is unknown, but a typographical or arithmetic error is possible. We also note that the ice thickness of 0.74 μm given in the caption of that same figure is about 100 per cent larger than the thickness reported by Jiang (1972) for a similar peak height. In short, the CO band strength listed in Bouilloud et al. (2015) is reasonable, but a lack of additional information makes a close quantitative comparison impossible.
The nearest we have found to a recent update of Jiang's CO work from the 1970s is a study by Diaz et al. (2022) of three ices. In Table 1 we listed some of the key assumptions and results of their work and ours, along with columns for Jiang (1972) and Bouilloud et al. (2015). The lab-to-lab variations are readily seen, such as fewer ice samples, a lower spectral resolution, and a slightly lower temperature for the study of Diaz et al. (2022) compared to that of Bouilloud et al. (2015). Both papers measured spectra by IR transmission and interference fringes by reflection, in contrast to the arrangement of Jiang (1972) and the present work.
In Fig. 5 we compared Jiang's work to ours by rescaling with our n and ρ values, finding good agreement. We also wanted to compare our results to those of Diaz et al. (2022), but some details of those authors’ study are unknown, such as the range of CO-ice thicknesses used and the limits chosen for IR-band integrations. It also is not known whether or not the band areas in the authors' figs 2, 8, and 9 have been corrected for the 45° angle at which their IR spectra were recorded. Just as important, our Fig. 1 and the accompanying text describe three ways that a band strength can be obtained from IR spectra and ice thicknesses. It is not clear which, if any, of these three methods was used in the paper of Diaz et al. (2022) as a conventional Beer's Law plot was not shown. Given these ambiguities, we simply take those authors' published band strength of A’ = 8.7 × 10⁻¹⁸ cm per molecule at 2-cm−1 resolution and 20 K and rescale it with our density at 25 K. The rescaled result is A' = 7.4 × 10⁻¹⁸ cm per molecule compared to our value of A' = 7.8 × 10⁻¹⁸ cm per molecule (see Table 3). Whether this agreement is excellent or simply fortuitous is unknown. Krupskii et al. (1973) and Wang et al. (2020) showed that the density of CO-ice varies little from 20 to 25 K, so the error introduced by our use of n and ρ values at 25 K for an ice at 20 K will be small.
Before leaving the paper of Diaz et al. (2022) we wish to comment on those authors' proposed method for determining an ice's density by measuring pressure changes on gas-phase condensation. Key to the method is a comparison to a known ice density. In the upper panel of Fig. 10 we show the results of Diaz et al. for crystalline CO from 11 to 23 K using those authors' reference density of ρ(20 K) = 0.876 g cm−3 from Luna et al. (2022). Also shown are the densities measured in the diffraction studies of Krupskii et al. (1973) and Wang et al. (2020) and the value we determined at 25 K. In the lower panel of our Fig. 10 we show the same comparison, but using our ρ(25 K) = 1.029 g cm−3 as the reference value. The substantial improvement in agreement among all of the results is obvious. We encourage tests of the accuracy of the density method of Diaz et al. (2022) using other compounds, particularly those that show a greater variation of density with temperature. Any technique to determine density that relies neither on diffraction work nor a microbalance would be a welcome addition to the tools of the laboratory astrochemist.
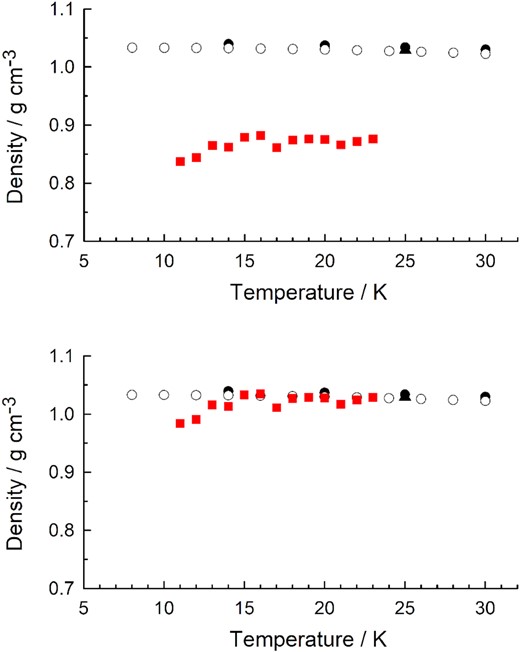
Literature densities for α-crystalline CO. Black (filled) circles are from Wang et al. (2020), white (open) circles are from Krupskii et al. (1973), and a triangular symbol is the 25-K density from the present work. The upper panel's red squares are densities reported and plotted by Diaz et al. (2022) based on a reference density from Luna et al. (2022). The lower panel's red squares are the same densities reported by Diaz et al. (2022), but after recalculating with our 25-K value as the reference.
6.3 Amorphous carbon monoxide
Nearly all, and perhaps all, previous IR work on solid CO in the laboratory-astrochemistry community involves crystalline ice samples. We know of no earlier study that resulted in the spectra shown in Fig. 7, with accompanying observations of the amorphous-ice characteristics in Table 4. In most previous studies, the condensation rates used were much higher than the 0.1 and 0.02 μm h−1 of Kouchi (1990) and Mizuno et al. (2016), respectively, used to make amorphous CO. Examples from the older literature include a deposition rate at 20 K of 62.4 μm h−1 (Pipes et al. 1978) and one at 10 K of ∼5 μm h−1 (Sandford & Allamandola 1988). A recent study by Luna et al. (2022) involved an increase in a CO ice's thickness on the order of 4 μm h−1, a rate certain to give α-crystalline CO even at the 14 K of the authors' substrate. In all such cases, we attribute crystallization to the energy released by the condensation near 10 K of room-temperature CO. As before (e.g. Gerakines & Hudson 2015a, b), we stress the importance of deposition rate, and not just a substrate's temperature or a vacuum system's pressure, when preparing amorphous ices.
We could not directly measure the small thicknesses of our amorphous CO ices, but we did estimate A’(CO, 2136 cm−1) = 9.8 × 10⁻¹⁸ cm per molecule near 10 K. Using equation (1), this leads to N ∼ 1.3 × 10¹⁶ molecules cm−2 for the amorphous CO ice that gave the spectrum of Fig. 7 (uppermost trace). Taking a molecular monolayer as on the order of 1 × 10¹⁵ molecules cm−2 implies that our sample corresponded to about 13 monolayers of amorphous CO ice. Coupled with an ice density one can calculate an ice thickness from a column density, but we have not found an accurate, reliable ρ for amorphous CO supported by an IR spectrum and other observations to characterize the sample. As an alternative, we adopt liquid CO's density of ρ(68 K) = 0.8558 g cm−3 from Baly & Donnan (1902), amorphous solids being considered as frozen liquids in terms of their structure at the molecular level. For, again, the amorphous CO ice that gave the spectrum of Fig. 7 (uppermost trace), this leads to a thickness of about 0.0072 μm from equation (6). This sample was produced by opening the deposition valve for only a few seconds, and then letting the sample sit at ∼10 K for 30 min to allow for slow condensation onto the substrate to be complete. The overall deposition rate is then 0.0072 μm/0.5 h or ∼0.01 μm h−1.
To improve our IR band strength for amorphous CO, methods that can measure thicknesses at the nanometer level might be adopted so that a conventional Beer's Law plot could be prepared. Alternatively, it might be possible to prepare thicker samples of amorphous CO to determine the intensities of its IR bands using the methods described in this paper. To date we have not succeeded in making such samples, but ‘Optimization can be expected to result from dedicated studies’ (Rochkind 1971).
6.4 Optical constants
Accurate comparisons of our optical constants to previous reports of n(|$\tilde{\nu }$|) and k(|$\tilde{\nu }$|) are prevented primarily by the lower resolution of some of the published results and a lack of access to the computer routines used for the calculations. For example, the number of published n(|$\tilde{\nu }$|) and k(|$\tilde{\nu }$|) values used to cover the 2147–2133 cm−1 region of the CO fundamental region is about 55 in Palumbo et al. (2006), about 30 in both Hudgins et al. (1993) and Rocha & Pilling (2014), and a mere 8 for the 4-cm−1 resolution spectra of Roux et al. (1980), contrasted with the 110 we used to better define the largest CO absorbance feature. Only with Rocha & Pilling (2014) has the software used been shared, but in that work the authors calculated n(|$\tilde{\nu }$|) and k(|$\tilde{\nu }$|) from just a single spectrum of Ehrenfreund et al. (1997) and an estimate, not a measurement, of the ice's thickness. Not surprisingly, the reported value of k(|$\tilde{\nu }$|) near the peak of the CO fundamental band also varies among the papers already cited, ranging from about 0.34 in Roux et al. (1980) to about 2.3 in Palumbo et al. (2006), in contrast to our ∼2.7 at 25 K. In terms of integrated k(|$\tilde{\nu }$|) values, the best agreement we have found is to the results of Palumbo et al. (2006), which differs from our integrated k(|$\tilde{\nu }$|) results by less than 1 per cent. The papers cited used a resolution of 1 cm−1 or coarser, but for the present work we have calculated optical constants for spectra recorded at both 1 cm−1 and 0.5 cm−1 resolutions. Those at 0.5-cm−1 resolution differ little from those at 1-cm−1 resolution, as expected.
A more detailed comparison of CO spectra is planned for the future, along with an extension into the near-IR region. The optical constants for crystalline CO at 25 K we have calculated are shown in Fig. 8 and also are posted at our website (https://science.gsfc.nasa.gov/691/cosmicice/constants.html). As the IR spectrum of crystalline CO hardly changes from 10 to 25 K, we expect that these constants should be reasonably accurate over that range.
6.5 Concerns and sources of error
Several sources of error accompany our band-strength determinations. We are confident that our density (ρ) is good to a standard error near ± 0.005 g cm−3 due to the multiple measurements we carried out, the excellent agreement with the two diffraction studies already cited, and the identification of our spectrum at 25 K with that of α-crystalline CO. Our refractive index (n670) is good to about the same precision, and when coupled with our density it gives excellent agreement with the expected polarizability of CO (i.e. αCO).
An important source of error involves the conversion of the interference fringes recorded during ice growth to the resulting ice's thickness, done with equation (5). Jiang (1972) used a wavelength of λ = 10 000 nm for his work, which meant that a single interference fringe corresponded to an ice thickness of 3.8 μm. Our choice of λ = 670 nm gave an interference fringe for every 0.26 μm of solid CO. The uncertainty in our fringe counts is about a tenth of a fringe, corresponding to an ice-thickness uncertainty of 0.026 μm = 2.6 × 10⁻⁶ cm for each point in our Beer's Law plots (i.e. Fig. 5), the precision of our value of n670 contributing little to this value. We used this 2.6 × 10⁻⁶ cm uncertainty in ice thickness h in a least-squares routine and calculated an uncertainty in our Beer's Law slopes of about 5 per cent, which corresponds to the uncertainty in our band strengths.
The integration of absorbance bands needed for equation (2) was both aided and hindered by characteristics of crystalline CO's IR spectrum. The aid came from the fact that the IR fundamentals of all isotopic variants of CO studied and the overtone of 12C16O are well separated, which made band integrations easier, reducing ambiguities introduced by curve fits and baseline corrections. However, the sharpness of the fundamental band of crystalline 12C16O meant that spectra from only a narrow range of ice thicknesses could be integrated accurately for a band strength due to concerns about band saturation. The greatest thickness in which we had confidence for accurate integration of the 12C16O fundamental was just under 0.6 μm, a value that would have been difficult to use with the technology available 50 yr ago to Jiang (1972), but is accessible today due to the sensitivity and stability of modern instrumentation.
As a final concern, we return to the arrangement of equipment used by the four laboratory groups represented in Table 1. In two cases, CO-ice thicknesses were measured by reflection from the sample and substrate (Bouilloud et al. 2015; Diaz et al. 2022). However, Jiang (1972) and we observed two-period fringe patterns indicative of ice condensing on both sides of our substrates. Since measurements of fringes by reflection will record data from only one side, ice thicknesses calculated from reflection fringes could be significantly smaller those encountered by an IR beam passing through both sides of the substrate, artificially raising the resulting apparent A' values of the ice. It is not known if two-period fringe patterns were recorded for CO at 25 K in the work of Bouilloud et al. (2015) as no fringe pattern was shown. The interference fringe pattern in fig. 2 of Diaz et al. (2022) for CO at 11 K hints at two periods, but since only about three fringes are shown no firm conclusion is possible.
6.6 Some applications, implications, and future work
Applications of our results include both observational and laboratory astronomy. Observational studies of solid CO in interstellar clouds typically derive CO abundances by using equation (1) and dividing an observed integrated optical depth τ (in cm−1) of the fundamental band of 12C16O by the band's strength A' (in cm per molecule). The present paper has determined that the long-used value of A' ∼ 1.0 × 10⁻¹⁷ cm per molecule from Jiang (1975) is about 10 per cent larger than what we measured at 25 K and a resolution of 1 cm−1. However, Table 3 shows that in the 10–25 K range a CO band strength near 1.0 × 10⁻¹⁷ cm per molecule is actually the limit of A’ as spectral resolution increases. Put another way, the A' value appropriate for an astronomical application, such as determining a CO abundance in an interstellar cloud, depends somewhat on the cloud's temperature and the resolution of the observational data. Our slightly lower value of A' will have the effect of slightly increasing the published abundances of solid CO in interstellar clouds. We emphasize that we are not just proposing alternative A' values based on new lab data, but that we have analysed, critiqued, and expanded on previous work to show why our newer values are to be preferred.
Band strengths used to calculate abundances of extraterrestrial crystalline CO should be from laboratory measurements made at the same resolution as that of the space- or observatory-based instrument making the astronomical observation. For CO, appropriate band strengths are in Table 3 or can be found by interpolating between the values listed there. For example, the JWST NIRSpec instrument used to measure IR spectra of ices (e.g. by McClure et al. 2023) has a resolution of R = 2600, or 0.8 cm−1 at the position of the CO absorption feature. Therefore, A′ ≈ 9.6 × 10⁻¹⁸ cm per molecule should be used for an ice at 25 K. Values at the appropriate spectral resolution and temperature should be adopted for other instruments, observed environments, and interstellar and planetary ice components. It is unfortunate that most published band strengths are for one resolution only, and it is not always clear if that value is a limiting one.
Among the results in Table 2, aside from A'(12C16O, 2138.4 cm−1) the band strength for solid 13C16O is perhaps the most useful. Twenty years ago, Boogert et al. (2002) noted the lack of band-strength results for 13C16O, the only value then available being the estimate of Gerakines et al. (1995) based on the work of Jiang et al. (1975) and a scaling with the natural abundances of 12C and 13C. Our work appears to be the first direct measurement of A'(13C16O) and it shows that the value used in a recent study of ices with the James Webb Space Telescope is about 100 per cent too large (McClure et al. 2023). Bouilloud et al. (2015) give a value of A'(13C16O) in their Table 5, but their result also seems much too large. The accompanying CO-ice spectrum in their fig. 6 shows that the 13C16O fundamental was not resolved from that of 12C18O, which might account for the high A'(13C16O) reported. The use of the suspiciously low density of Roux et al. (1980) also boosted the A'(13C16O) reported by Bouilloud et al. (2015). It is not clear if those same authors constructed a Beer's Law plot to calculate A'(13C16O) or simply rescaled data from IR spectra of 12C16O.
We have not located literature results for the IR band strengths of solid 12C17O and 12C18O, so we suggest that our A'(12C17O) and A'(12C18O) values in Table 2 are the first of their type. In calculating 12C17O and 12C18O band strengths, we assumed that our CO gas sample had elemental isotopic abundances matching those of terrestrial carbon and oxygen. Better accuracy might be achieved by repeating the measurements with a gas sample having a composition verified by mass spectrometry.
The band strength of the first overtone of 12C16O at 25 K was measured in our work, the result being A' = 7.4 × 10⁻²⁰ cm per molecule. This is considerably lower than an indirect measurement that gave 1.6 × 10⁻¹⁹ cm per molecule based on a scaling from the fundamental band of 13C16O which itself was based on a comparison to the fundamental band of 12C16O (Gerakines et al. 2005). Our value is lower by about the same amount from that listed by Bouilloud et al. (2015). Again, it is not known if those authors measured the overtone's band strength directly with a Beer's Law plot or if they used some type of scaling to another IR feature.
The lower plot in our Fig. 6 shows IR absorbance data for the first overtone of 12C16O at 25 K, from which we obtained an absorption coefficient α‘ = 651 cm−1 from measurements with 18 ices with thicknesses of ∼0.1–5 μm. Comparisons are difficult to find. Quirico and Schmitt (1997) reported α’ = 672 cm−1 at 21 K from measurements made by cooling liquid CO in a closed cell, but the number of ice samples and the number of pathlengths (ice thicknesses) used is not known. The agreement to within a few per cent for these two α' values is reasonable, the small difference perhaps being due to the small difference in temperatures of the ices.
The position of the peak in our amorphous CO-ice spectrum of Fig. 7 is 2136.4 cm−1 for the 12C16O isotopologue, close to the so-called red component or low-frequency wing of interstellar CO-ice spectra. The interstellar feature is also referred to as the polar-CO contributor, and commonly assigned to a solid H2O + CO mixture. However, we suggest that our amorphous CO-ice should also be considered as a component of the interstellar solid-CO band near 2136 cm−1. We also note that our spectra of amorphous CO-ice do not show the 2152 cm−1 feature that has been the subject of previous laboratory and observational studies (e.g. Sandford et al. 1988; Cuppen et al. 2011). For more information on the interstellar spectrum, see Lacy et al. (1984), Tielens et al. (1991), Whittet & Duley (1991), or Boogert et al. (2015), and references therein.
Applications of our CO work to laboratory data cover hundreds, perhaps thousands, of experimental results over the past 40 yr. In some cases, the reductions in A' that we have found will not alter published conclusions. However, in comparative studies, such as examinations by IR spectroscopy of different reaction yields or radiolytic destruction rates, even small changes in A' can be important. Comparisons involving IR spectra and ratios of CO abundances, such as among 12C and 13C isotopologues, also can be very sensitive to the abundance of each molecule or ion, as in the interesting paper of Smith et al. (2021).
The present work suggests many areas for further investigation, some of which have already been mentioned: (1) A better determination of the band strength of amorphous CO certainly is needed. (2) Measurements of the rate of crystallization of amorphous CO as a function of temperature would be welcome. Our few observations lead us to qualitative agreement with Kouchi, Tsuge & Hama (2022) that amorphous CO will have a relatively limited lifetime in interstellar space, but more IR lab data are needed to support this idea. (3) A reevaluation of the IR band strength of solid CO in ice mixtures can now be carried out with the same method we used recently with H2S (Yarnall & Hudson 2022a), a technique that measures abundances in ices without assumptions concerning gas-phase mixing ratios and without the use of gas-phase band strengths.
7 SUMMARY AND CONCLUSIONS
In this paper we have examined laboratory work that can be traced back almost a century and that has been used extensively by the observational and laboratory astronomy communities. We have found that the original IR intensity measurements for solid CO are based on just two data points and problems that have gone uncorrected since 1972. To improve on the original work and some subsequent studies, we have significantly increased the number of ices examined and the range of thicknesses studied. The influences of spectral resolution and ice temperature on band strength have been documented. All interference fringes and IR spectra were measured in transmission at incident angles near 90°, reducing the uncertainty involved in combining reflection and transmission data. The deposition of solid CO on two sides of a substrate at 10–25 K was demonstrated using transparent and non-transparent materials in multiple vacuum systems and accounted for in ice-thickness calculations. Checks were performed on CO results with an isoelectronic diatomic molecule (N2) and by measuring both deposition and channel fringes. Work from 1972 involving argon also was reexamined with new measurements. A density of CO measured by the authors has been compared to, and found to agree with, results from three independent diffraction studies. Optical constants have been calculated at a higher resolution than in the literature.
Our main conclusions are (1) that there is not a single, unique IR band strength for CO that applies to all extraterrestrial ices and spectra and (2) the band strength long used for solid CO's fundamental IR transition is about 10 per cent higher than the actual value at 25 K, with the precise value of A' depending on both ice temperature and spectral resolution. As IR abundances of solid CO in dark molecular clouds are inversely related to CO's band strength, some of the published interstellar solid-CO abundances might need reassessment.
ACKNOWLEDGEMENTS
We acknowledge the support of NASA's Planetary Science Division Internal Scientist Funding Program through the Fundamental Laboratory Research (FLaRe) work package at the NASA Goddard Space Flight Center. Support also was received for parts of this work from the NASA Astrobiology Institute. Dr. Yukiko Y. Yarnall assisted with some of the measurements and data analyses.
DATA AVAILABILITY
The data underlying this article will be shared on reasonable request to the corresponding author. Spectra and optical constants will be posted on the authors' website on acceptance of this manuscript for publication.
References
APPENDIX
Condensation of room-temperature CO gas was numerically simulated in two dimensions by following the trajectories of 106 massless, non-interacting particles entering the chamber from randomly chosen positions at the exit of a deposition line with randomly chosen velocity angles. The simulated vacuum chamber enclosed a cold substrate surrounded by a thermal shroud (radiation shield). The dimensions of the simulated chamber, substrate, and shroud were chosen to match those of the laboratory experiment. Sticking coefficients were assumed for all surfaces, and then the trajectories and fates of the molecules were followed. The sticking coefficient on the cold substrate was taken as 1, but smaller values were used for the shroud to represent the fact that it was warmer than the shroud. Two observations relevant to our experiments were made. First, molecules were found to condense on both sides of the substrate when the sticking coefficient for the shroud was less than 1, as described in our text. The ratio of CO on the two sides of the substrate was about 9:1 for a shroud sticking coefficient of about 0.12. Secondly, the condensation of molecules was slightly smaller at the centre of the substrate than immediately surrounding it, due to the geometry of the walls and shroud. Using larger sticking coefficients for the shroud, to simulate lower temperatures, gave rise to a more uniform distribution of molecules across the substrate. These simulations continue and we envision publishing a fuller account in the future.
