


ABSTRACT
We present the VST ATLAS Quasar Survey, consisting of ∼1229 000 quasar (QSO) candidates with 16 < g < 22.5 over ∼4700 deg2. The catalogue is based on VST ATLAS+NEOWISE imaging surveys and aims to reach a QSO sky density of 130 deg−2 for |$z$| < 2.2 and ∼30 deg−2 for |$z$| > 2.2. To guide our selection, we use X-ray/UV/optical/MIR data in the extended William Herschel Deep Field (WHDF) where we find a g < 22.5 broad-line QSO density of 269 ± 67 deg−2, roughly consistent with the expected ∼196 deg−2. We find that ∼25 per cent of our QSOs are morphologically classed as optically extended. Overall, we find that in these deep data, MIR, UV, and X-ray selections are ∼70–90 per cent complete while X-ray suffers less contamination than MIR and UV. MIR is however more sensitive than X-ray or UV to |$z$| > 2.2 QSOs at g < 22.5 and the |$S_X(0.5-10\, {\rm keV})\gt 1\times 10^{-14}$| ergs cm−2 s−1 limit of eROSITA. We adjust the selection criteria from our previous 2QDES pilot survey and prioritize VST ATLAS candidates that show both UV and MIR excess, also selecting candidates initially classified as extended. We test our selections using data from DESI (which will be released in DR1) and 2dF to estimate the efficiency and completeness, and we use ANNz2 to determine photometric redshifts. Applying over the ∼4700 deg2 ATLAS area gives us |$\sim 917\,000\, z\lt 2.2$| QSO candidates of which 472 000 are likely to be |$z$| < 2.2 QSOs, implying a sky density of ∼100 deg−2, which our WHDF analysis suggests will rise to at least 130 deg−2 when eROSITA X-ray candidates are included. At |$z$| > 2.2, we find ∼310() 000 candidates, of which 169 000 are likely to be QSOs for a sky density of ∼36 deg−2.
1 INTRODUCTION
QSOs are the most luminous subset of Active Galactic Nuclei (AGNs), which are powered by accretion onto a blackhole. Here, following e.g. Croom et al. (2001) and Richards et al. (2004), we develop selection criteria for a photometrically selected QSO catalogue based on VST ATLAS (Shanks et al. 2015) +unWISE neo6 (Schlafly, Meisner & Green 2019). We aim to achieve a sky density at g < 22.5 of 130 deg−2 at |$z$| < 2.2 and 30 deg−2 at |$z$| > 2.2 over ≈4700 deg2, comparable to the sky densities projected by the Dark Energy Spectroscopic Instrument experiment (DESI) (DESI Collaboration 2016) and observationally confirmed by Chaussidon et al. (2022b). We utilize methods outlined in Chehade et al. (2016) and develop further selection techniques by comparing our results to X-ray QSOs from Bielby et al. (2012) in the William Herschel Deep Field (WHDF; Metcalfe et al. 2001), and preliminary DESI data from DESI DR1.
This catalogue aims to be part of the spectroscopic fibre targeting of the upcoming 4MOST Cosmology Redshift Surveys (Richard et al. 2019), where it will be combined with 2800 deg2 from the Dark Energy Survey (DES) (Dark Energy Survey Collaboration 2016) to give 7500 at 130 deg−2 for QSO cosmology projects. It could also be used to target eROSITA AGN surveys (Merloni et al. 2012). The eROSITA X-ray AGN survey has average resolution of only ≈20 arcsec so our optical/MIR catalogue will also help target fibres for spectroscopic follow-up with 4MOST in our overlap areas. The long-term aim of this QSO survey is to probe the nature of dark energy and dark matter by primarily comparing gravitational lensing and redshift space distortion analyses (e.g. Kaiser 1987) but also via BAO using QSOs as tracers at |$z$| < 2.2 and the Lyman-α forest at |$z$| > 2.2 from the final 4MOST redshift surveys. The dark energy equation of state will thus be measured and tests of modified gravity models as an alternative explanation of the accelerating Universe will also be made. In the VST ATLAS QSO Survey paper II we shall report on the lensing of VST ATLAS QSOs by foreground galaxies and galaxy clusters. We also detect lensing of the cosmic microwave background (CMB) by the QSOs.
The outline of this paper is as follows. In Section 2 we describe the imaging and spectroscopic surveys we use to create and test our QSO catalogue. We describe QSO selection methods based on the 2QDESp and WHDF surveys, which we utilize to start, test, and adapt our QSO selections in Section 3. Section 4 details the final VST-ATLAS QSO catalogue selections. Section 5 contains a spectroscopic completeness analysis of our VST-ATLAS QSO catalogue, using preliminary DESI data as well as our own preliminary data from AAT 2dF. We present the final VST-ATLAS QSO candidate catalogue in Section 6. Finally, we finish our analysis in Section 7 where we utilize the ANNz2 photometric redshift code to determine a |$z$| < 2.2 and |$z$| > 2.2 redshift sample. We discuss our results in Section 8.
2 DATA
2.1 Imaging surveys
2.1.1 VST-ATLAS
The ESO VST ATLAS data we utilize in this work is from the DR4 ATLAS catalogue released in 2019. ATLAS is a photometric survey which images ∼4700 deg2 of the Southern sky (≈2000 deg2 in the Northern Galactic Cap, NGC, and ≈2700 deg2 in the Southern Galactic Cap, SGC, in the ugriz bands, designed to probe similar depths as the Sloan Digital Sky Survey (SDSS) (e.g. York et al. 2000). The imaging was performed with the VLT Survey Telescope (VST), which is a 2.6-m widefield survey telescope with a 1° × 1° field of view. It is equipped with the OmegaCAM camera (Kuijken et al. 2002), which is an arrangement of 32 CCDs with 2k × 4k pixels, resulting in a 16k × 16k image with a pixel scale of 0|${^{\prime\prime}_{.}}$|21. The two sub-exposures taken per 1 degree field are processed and stacked by the Cambridge Astronomy Survey Unit (CASU). This pipeline provides catalogues with approximately 5σ source detection that include fixed aperture fluxes and morphological classifications. The processing pipeline and resulting data products are described in detail by Shanks et al. (2015). We create band-merged catalogues using topcat (Taylor 2005). For our quasar catalogue, we utilize a 1|${^{\prime\prime}_{.}}$|0 radius aperture (aper3 in the CASU nomenclature) as well as the Kron magnitude in the g-band, and the morphological star-galaxy classification supplied as a default in the CASU catalogues in the g-band. This classification is discussed in detail by González-Solares et al. (2008). The u-band data in DR4 consist of 2 × 120s exposures in the ≈700 deg−2 area at Dec<−20 deg in the NGC and 2 × 60s exposures elsewhere. We utilize the 2 × 60s u-band exposures of the complementary ATLAS Chilean Survey (ACE; Barrientos et al, in preparation) to increase the u-band exposure time to 240s exposure throughout the entire DR4 area. We combine the ATLAS and Chilean u-band data by averaging their magnitude values weighted by the relative seeing on the two exposures. Approximately 1000 deg2 of the DR4 SGC area and NGC area at Dec>-20 deg did not have Chile u-band data at the time of this work. In these areas we simply use the shallower ATLAS DR4 data. To ensure as many objects as possible have u-band measurements, we do not detect objects independently on the u images but instead we ‘force’ photometry at the positions of all the g-band detections. To avoid problems with detector saturation at brighter magnitudes, in what follows we restrict the ATLAS data to objects with g > 16. The area covered by VST ATLAS, as well as the surveys we are utilizing in the analyses of this paper can be seen in Fig. 1.
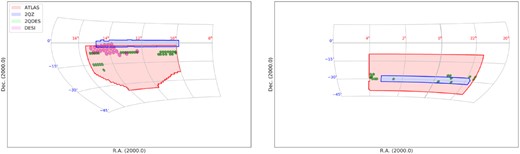
The sky coverage of VST ATLAS NGC is shown in red, including 2000 deg2 in the NGC in the left-hand panel and 2700 deg2 in the SGC in the right-hand panel. The map also shows areas where other surveys used in this work overlap VST ATLAS. The 2dF Quasar Survey (2QZ; Croom et al. 2005) area is shown in blue, the 2dF QSO Dark Energy Survey pilot (2QDESp; Chehade et al. 2016) area in green and the area covered by DESI by the time of the internal release used here, in magenta.
2.1.2 NEOWISE
The NASA satellite Wide-field Infrared Survey Explorer (WISE) (Wright et al. 2010), mapped the entire sky in four pass-bands W1, W2, W3, and W4 at 3.4, 4.6, 12, and 22 |$\mu$|m respectively, with 5σ point source limits at W1 = 16.83 and W2 = 15.60 mag in the Vega system. The unWISE catalogue (Schlafly et al. 2019) presents ∼2 billion objects observed by WISE, with deeper imaging and improved modelling over AllWISE, detecting sources approximately 0.7 magnitudes fainter than AllWISE in W1 and W2, i.e. 5σ limits of W1 = 17.5 and W2 = 16.3 in the Vega system. This deeper imaging is made possible through the coaddition of all available 3–5 |$\mu$|m WISE imaging, including that from the ongoing NEOWISE-Reactivation mission, increasing the total exposure time by a factor of ∼5 relative to AllWISE (Schlafly et al. 2019). We use the pre-release version of DR3 of the unWISE catalogue (neo6), provided by E. Schlafly, in this work.
To allow checks of unWISE quasar selection, we also download data from the DECaLS Legacy Survey DR9 release (Dey et al. 2019) as this is the data which has been used by DESI Collaboration (2016) in their science, targeting, and survey design. This includes the W1 and W2 WISE fluxes using ‘forced’ photometry at the locations of Legacy Surveys optical sources in the unWISE maps. Being ‘forced’, these data go somewhat deeper than the unWISE neo6 catalogue, but, of course, only exist for objects with optical photometry.
2.1.3 William Herschel deep field (WHDF)
To perform an analysis of X-ray selected quasars, we use the WHDF data provided by Metcalfe et al. (2001). These data cover a 16 arcmin × 16 arcmin area of sky with data in the UBRIZHK bands and goes several magnitudes deeper than our VST ATLAS data. Unfortunately, particularly for U and B, the passbands are very different from those used in the VST ATLAS survey. To overcome this we matched to the SDSS Stripe 82 photometry (described in Pier et al. 2003), whose passbands are very similar to VST ATLAS. Although this is less deep than the WHDF photometry, for B < 23.5, ≈95 per cent of our WHDF objects have Stripe 82 photometry. We retain the star/galaxy separation information from the deeper, original, WHDF data.
This is then combined with a 75 ks Chandra ACIS-I X-ray exposure (Vallbé Mumbrú 2004; Bielby et al. 2012) and the mid-infrared (MIR) 3.6 and 4.5 |$\mu$|m Spitzer SpIES data (Timlin et al. 2016) to provide 0.5–10 keV X-ray fluxes and the equivalent of W1 and W2 band magnitudes.
2.2 Spectroscopic surveys
2.2.1 2QZ
The 2dF QSO Redshift Survey (2QZ; Boyle et al. 2002; Croom et al. 2005), covers approximately 750 deg2 of the sky, with ≈480 deg2 overlap with VST-ATLAS. It used the 2-degree Field (2dF) multi-object spectrograph at the Anglo Australian Telescope (AAT) to target sources, and discovered ≈23 000 QSOs at |$z$| < 3. The areas targeted for 2QZ are contained within the 2dF Galaxy Redshift Survey sky coverage (Colless et al. 2001; 2dFGRS). The 2QZ catalogue utilizes photometric colour cuts to select QSO targets. Therefore, we can use the 2QZ quasar catalogue to test for completeness of our new catalogue as it spans a redshift range of 0.3 < |$z$| < 2.2, which includes our target redshift range. At higher redshifts, the completeness of the 2QZ survey rapidly drops as the Lyman alpha forest enters the u-band. Additional incompleteness may be due to AGN dust absorption. See Croom et al. (2005) for further description of the 2QZ QSO survey.
2.2.2 2QDESp
The 2QDES Pilot Survey (2QDESp) (Chehade et al. 2016) was the first survey to use VST ATLAS photometry to target QSOs. They attempted to target QSOs up to g < 22.5, with high completeness up to g ≈ 20.5 with an average QSO sky density of ≈70 deg−2 in the redshift range of 0.8 < |$z$| < 2.5. The target depth of g ≤ 22.5 was to probe the clustering properties of intrinsically faint quasars as this was a relatively unexplored depth for the targeted redshift range at that time.
As 2QDESp used VST ATLAS data, albeit an earlier release, we will base our selection methods on the 2QDESp selection criteria as we aim to find sources at these faint magnitudes with a higher sky density. We are able to select fainter targets as we use the unWISE catalogue in conjunction with VST ATLAS photometry, instead of the AllWISE all-sky source catalogue used by 2QDESp. We also have deeper u-band data and the DR4 release encompasses the full ATLAS area, which was not completed at the time of 2QDESp.
2.2.3 DESI
The Dark Energy Spectroscopic Instrument (DESI) (DESI Collaboration 2016) is a Stage IV dark energy measurement using baryon acoustic oscillations and other techniques that rely on spectroscopic measurements. The main spectroscopic survey is conducted on the Mayall 4-m telescope at Kitt Peak National Observatory. Based on DECaLS DR9 photometry, DESI has a target depth of r < 23. We utilize main survey data in the seventh internal data release of DESI spectra, Guadalupe (which will be released in DR1), to check our VST-ATLAS photometry as well as our QSO candidate selection via DESI spectroscopy. These data have an ≈144 deg2 overlap with ATLAS. We shall also use DESI Guadalupe spectroscopy covering the WHDF to increase the numbers of known quasars with redshifts in the WHDF area, beyond those previously reported by Vallbé Mumbrú (2004) and Bielby et al. (2012).
2.2.4 2dF
We are able to test our final QSO selection using the 2-degree Field (2dF) fibre coupler feeding 392 fibres over 3 deg2 into the AAOmega spectrograph (Sharp et al. 2006) at the Anglo Australian Telescope (AAT). The spectrograph uses a dichroic beam-splitter at 5700 Å and the fibres have a 2|${^{\prime\prime}_{.}}$|1 diameter. We utilize the multi-object mode and the 580V and 385R gratings, giving a wavelength range from 3700 to 8800 Å with a spectral resolution of ≈1300. We observed two trial VST ATLAS fields, NGC-F1 and NGC-F2, with observational details given in Section 5.2.
3 OPTIMIZING QSO SELECTION VIA 2QDES+WHDF
To create the VST ATLAS QSO catalogue, we start from photometric selection methods in multiple colour spaces based on previous work using VST ATLAS+AllWISE catalogues. We utilize both the ultraviolet excess (UVX) and the mid-infrared excess (MIRX) properties of QSOs to create photometric colour cuts for our target selection, following Chehade et al. (2016). We test the completeness of these selections using QSO idendified in the deeper WHDF data at X-ray, optical, and MIR wavelengths. We then adjust these improved selections to allow for the brighter flux limits that apply to VST ATLAS and unWISE relative to the WHDF, always aiming to minimize stellar and galaxy contamination while maximizing completeness of the quasar sample. We perform these colour cuts in the regions covered by VST-ATLAS and unWISE in both the NGC and SGC survey areas in the Southern hemisphere. UVX colour cuts were previously used by 2QZ and SDSS (Ross et al. 2012) to select quasars in the redshift range of |$z$| < 2.2. We then follow Chehade et al. (2016) in combining UV and MIR photometry to make our QSO selections. The continued inclusion of UV criteria differentiates this work from e.g. the extended Baryon Oscillation Spectroscopic Survey (eBOSS) (Dawson et al. 2016) and DESI who use only MIRX selection (Yèche et al. 2020). We shall use spectroscopic surveys such as 2QZ, 2QDESp, eBOSS, DESI, and new 2dF observations to optimize the ATLAS selection and compare selection efficiencies with results from these other spectroscopic surveys.
3.1 2QDESp QSO selection
Our initial ATLAS selections are based on the UVX and MIRX QSO selections made by Chehade et al. (2016) for 2QDESp, with the deeper NEOWISE (neo6) replacing AllWISE as the MIR survey. Their UVX/optical selections were made in the u − g: g − r and g − r: r − i colour spaces and their MIRX-optical selections are made in the g − i: i − W1 and g: W1 − W2 colour spaces. Chehade et al. (2016) utilize a combination of VST-ATLAS and WISE photometry in ≈150 deg2 of the Southern hemisphere for their analysis, complementing their selection with the XDQSO code for quasar classification. We expand and improve this photometric selection by using VST-ATLAS over ≈4700 deg2 of the Southern hemisphere. This paper does not include an XDQSO selection as it would require some recalibration for the deeper photometry in the u-, W1-, and W2-bands we are utilizing.
The original colour selections from Chehade et al. (2016) are as follows. The VST ATLAS photometry is in AB magnitudes and the unWISE photometry is in Vega magnitudes. The UVX/optical selection is given in equation (1):
The selections exploiting mid-IR excess are given in equation (2):
These selections are graphically displayed in fig. 1 of Chehade et al. (2016). Following the colour selections outlined above, we note that the maximum confirmed quasar sky density achieved by Chehade et al. (2016) was ∼90 deg−2 for |$z$| < 2.2 QSOs. This leaves us below our target density of 130 deg−2 at |$z$| < 2.2 (plus 30 deg−2 at |$z$| > 2.2), motivating us to further improve these selections and use them in conjunction with better data.
3.2 William Herschel deep field (WHDF) QSO selection
Our first attempt to refine our QSO selection is based on objects in the extended William Herschel Deep Field (Metcalfe et al. 2001, 2006). Although a small, ∼16 arcmin × 16 arcmin area, here we have high signal-to-noise optical data which is several magnitudes fainter than the VST-ATLAS data that benefits star/galaxy separation accuracy and is still ≈1 mag deeper when using SDSS Stripe 82 data for ugri photometry (see Section 2.1.3). Since WHDF also has deeper MIR and X-ray imaging, it presents an ideal opportunity to try to optimize our selection methods in this well-observed field. To do this, we start from the R-selected star and galaxy image lists provided on the WHDF webpage1 and match this catalogue to the MIR 3.6 and 4.5 |$\mu$|m Spitzer SpIES data (Timlin et al. 2016) to get an equivalent to W1 and W2 band photometry. Unless otherwise stated, all magnitudes and colours are corrected for galactic extinction. We next match the Stripe 82 ugriz data to the R image lists of Metcalfe et al. (2001). We are then able to develop our selection cuts in the WHDF field starting from those described by Chehade et al. (2016) and given in equations (1) and (2) above.
3.2.1 WHDF X-ray and DESI QSO population
First, we need to establish the number of known quasars on the WHDF. We consider the X-ray selected sample of WHDF quasars given in table 2 of Bielby et al. (2012) (see also Vallbé Mumbrú 2004), which lists 15 spectroscopically confirmed quasars, their Chandra X-ray fluxes and spectroscopic redshifts. Together with the WHDF morphological and SDSS Stripe 82 photometric properties of these objects, these parameters are all included in Table A1 in the Appendix. Of these Chandra X-ray QSOs, 12 are detected at brighter than our target limit of g < 22.5. These include 10 that are morphologically classified as stellar sources in the WHDF photometric catalogue, and 2 which are classified as extended sources. Additionally, 11 of these 12 quasars are in our ‘QSO tracer’ target redshift range of 0.3 < |$z$| < 2.2. These 12 confirmed quasars occupy an X-ray-optical overlap area of 214 arcmin2 or 0.0594 deg2, implying a 16 < g < 22.5 quasar sky density of 202 ± 58 deg−2 from the list of Bielby et al. (2012). Finally, we note that 10 of these 12 X-ray quasars2 are detectable to the nominal eROSITA 0.5–10 keV X-ray flux limit of 1 × 10⁻¹⁴ ergs cm−2 s−1, corresponding to a sky density of 168 ± 53 deg−2.
In addition to the Chandra X-ray population of quasars, we also have preliminary DESI Guadalupe internal release data in the WHDF. Here we selected objects that were targeted as QSOs and confirmed spectroscopically as QSOs in these DESI data. These 13 quasars are listed in Table A2. Note that these data are only preliminary and so future DESI public releases may identify more quasars. But in DESI, there are 11 QSOs to a depth of g < 22.5, which gives a density of 185 ± 56 deg−2, close to the above X-ray sample of Bielby et al. (2012). Of these 11 QSOs, 9 are morphologically classified as stellar and 2 as extended.
There are seven g < 22.5 QSOs in common between the DESI and the X-ray QSO catalogues. Of the stellar QSOs with g < 22.5, the DESI and X-ray selected samples find respectively 2 and 3 QSOs that are undetected by the other technique. Hence we identify a total of 12 stellar QSOs on the WHDF, leading to a stellar QSO density of 202 ± 58 deg−2. None of the morphologically extended QSOs with g < 22.5 are in common, meaning there are 4 extended QSOs spectroscopically identified, with 2 in X-ray and 2 in DESI for a total extended QSO sky density of 67 deg−2. The total number of g < 22.5 stellar+extended QSOs on the WHDF is thus 16, corresponding to an overall X-ray + DESI quasar sky density of 269 ± 67 deg−2.
We note that three out of the four g < 22.5 DESI quasars missing from Table A1 are detected in the X-ray at fainter X-ray fluxes. This increases the overall X-ray completeness from 11/16 = 69 per cent at the ‘eROSITA’ |$S_X(0.5-10\, {\rm keV})\gt 1\times 10^{-14}$| ergs cm−2 s−1 limit to 15/16 = 94 per cent at the fainter |$S_X(0.5-10\, {\rm keV})\gt 1\times 10^{-15}$| ergs cm−2 s−1 ‘Chandra’ limit. These X-ray completenesses can be compared to the overall DESI completeness of 11/16 = 69 per cent. Table 1 provides a full summary of cut completenesses and contaminations, subdivided by stellar and extended source morphology.
WHDF completeness and contamination statistics for various QSO cut selections to the ATLAS g < 22.5 mag limit in all cases. Class ‘All’ means ‘Stellar’ plus ‘Extended’. All rows refer to the full redshift range.
| Class | Cut | X-ray limit (0.5–10 keV) | Completeness | Contamination | QSO density | Notes |
|---|---|---|---|---|---|---|
| (ergs cm−2 s−1) | (deg−2) | |||||
| Stellar | X-ray | |$\gtrsim 1\times 10^{-15}$| | 11/12→92 per cent | 0/11→0 per cent | 185 | >3σ X-ray, 16<g<22.5 stellar, <3 arcsec |
| Stellar | X-ray | >1 × 10⁻¹⁴ | 8/12→67 per cent | 0/8→0 per cent | 135 | – |
| Stellar | DESI | – | 9/12→75 per cent | – | 152 | – |
| Stellar | grW | – | 11/12→92 per cent | 8/19→42 per cent | 185 | – |
| Stellar | ugr/UVX | – | 8/12→67 per cent | 8/16→50 per cent | 135 | – |
| Extended | X-ray | |$\gtrsim 1\times 10^{-15}$| | 4/4→100 per cent | 6/10→60 per cent | 67 | >3σ X-ray, 16<g<22.5 extended, <3 arcsec |
| Extended | X-ray | >1 × 10⁻¹⁴ | 3/4→75 per cent | 4/7→57 per cent | 51 | – |
| Extended | DESI | – | 2/4→50 per cent | – | 34 | – |
| Extended | grW | – | 3/4→75 per cent | 7/10→70 per cent | 51 | – |
| Extended | ugr/UVX | – | 3/4→75 per cent | 27/30→90 per cent | 51 | – |
| All | X-ray | |$\gtrsim 1\times 10^{-15}$| | 15/16→94 per cent | 6/21→29 per cent | 253 | >3σ X-ray, 16<g<22.5, <3 arcsec |
| All | X-ray | >1 × 10⁻¹⁴ | 11/16→69 per cent | 4/15→27 per cent | 185 | – |
| All | DESI | – | 11/16→69 per cent | – | 185 | – |
| All | grW | – | 14/16→88 per cent | 15/29→52 per cent | 236 | – |
| All | ugr/UVX | – | 11/16→69 per cent | 35/46→76 per cent | 185 | – |
Based on this analysis and subject to the preliminary nature of the DESI internal release, our provisional conclusion is that a joint optical/MIR and ‘eROSITA’ X-ray selection will give an estimated quasar candidate density which is ≈45 per cent higher than simply using the X-ray or DESI optical/MIR selections alone. In particular, we can expect an ≈45 per cent increase in sky density by adding eROSITA X-ray selection to an optical/MIR survey such as DESI to g < 22.5. Of course, this estimate does not account for any QSOs which may be missed by both techniques.
3.2.2 WHDF motivated QSO cuts
We now turn our attention to how many of these QSOs are picked up by our photometric selection technique, and whether we can optimize this. To test this, we start from the initial ugri + giW1W2 photometric cuts, as derived from previous work done by Chehade et al. (2016) and described in Section 3.1, on the 16 confirmed QSOs.
3.2.3 Stellar cuts
We show the 16 WHDF quasars first in the context of the WHDF stellar sources in the same magnitude range in the u − g: g − r plane (see Fig. 2). As the WHDF/Stripe 82/SpiES photometry is deeper and less noisy than VST ATLAS/neo 6, we change the g − r > −1.25 colour cut of Chehade et al. (2016) to g − r > −0.4 to reflect the reduced contamination in this area.
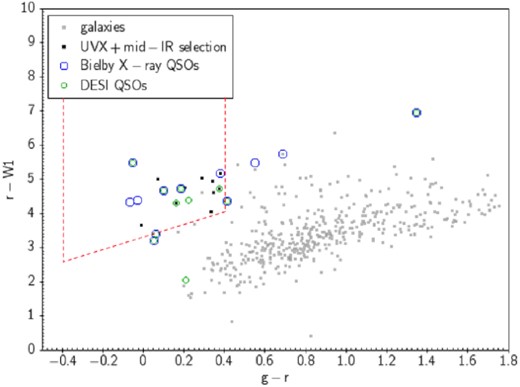
We then similarly show the 16 WHDF QSOs in the g − r: r − W1 plane3 in Fig. 3 where our mid-IR, grW1 selections are:
In both figures, the UVX and MIRX (grW1) selections are shown as dashed green lines and objects classified as stellar sources are shown in light grey. The stellar locus can be clearly seen in both colour spaces. The X-ray sources are shown as blue circles and the DESI sources are shown as green circles. Note that none of the eight extra UVX + grW1 candidates (black points) are detected to the SX(0.5–10 keV) > 1 × 10⁻¹⁵ ergs cm−2s−1 3σ limit of the Chandra X-ray data. The two X-ray sources and two additional DESI sources that do not overlap with a grey point are morphologically classified as galaxies.
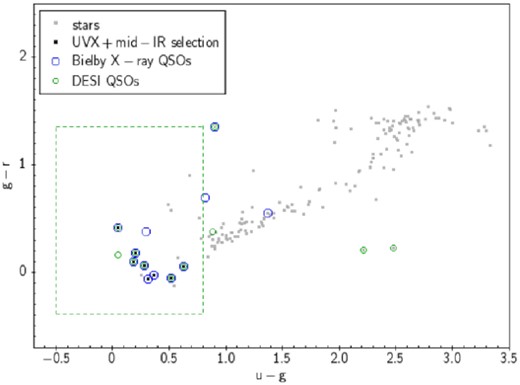
Colour selections performed on stellar sources in the extended WHDF in the ugr colour space. WHDF objects with a stellar morphology are shown in grey. X-ray QSOs from Bielby et al. (2012) are shown as blue circles and QSOs found by DESI are shown as green circles. The ugr + grW1 ATLAS QSO selections are shown as black points. The green dotted lines denote the ATLAS selection in this colour space. All selections are magnitude limited to g < 22.5.
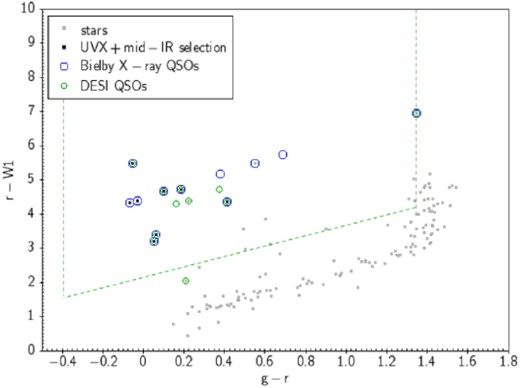
Colour selections performed on stellar sources in the extended WHDF in the grW1 colour space. WHDF objects with a stellar morphology are shown in grey. X-ray QSOs from Bielby et al. (2012) are shown as blue circles and QSOs found by DESI are shown as green circles. The ugr + grW1 ATLAS QSO selections are shown as black points. The green dotted lines denote the ATLAS selections in this colour space. All selections are magnitude limited to g < 22.5.
We show the results of these stellar cuts in Table 1. We see that the grW is highly successful, selecting 11/12 stellar quasars implying a completeness of 92 per cent with only 42 per cent contamination, i.e. an efficiency of 58 per cent. This compares favourably to the other stellar selections e.g. UVX and X-ray at the brighter ‘eROSITA’ limit both at 67 per cent completeness. This lower completeness is partly due to both UVX and X-ray being biased against selecting |$z$| > 2.2 quasars, e.g. 2 out of the 4 stellar WHDF quasars missed by UVX have |$z$| > 2.2. One of the other two missing in UVX is the X-ray absorbed, |$z$| = 0.79 quasar, WHDFCH0044, which may explain its red u − g = 0.89 colour. The other is WHDFCH055 at |$z$| = 0.74 which is much redder at u − g = 1.37 but shows little evidence of X-ray absorption. However, UVX still has a competitively low contamination rate for stellar quasars at 50 per cent compared to 42 per cent for grW and we shall see that UVX still has a role to play when the imaging data is less deep and the star–galaxy separation is less accurate.
3.2.4 Extended source cuts
As 5 of the 15 confirmed QSOs from Bielby et al. (2012) and a further 3 DESI QSOs (or 7 in total accounting for one overlap) are morphologically classified as extended sources (galaxies) in the WHDF catalogue, we perform our colour selections on extended sources as well. Down to g < 22.5, even the star/galaxy separation in the WHDF data is not entirely reliable, so our decision to include this selection will be further justified when looking at images with lower S/N as in the VST ATLAS survey. At this g < 22.5 limit, 2 extended QSOs are found by Bielby et al. (2012) and 2 by DESI.
The suggested cuts, shown in Figs 4 and 5, are aimed at minimizing galaxy contamination while retaining possible QSOs that have been classified as galaxies.4 In these figures, the X-ray sources and DESI sources which are not overlapping with grey points are morphologically classified as stellar.
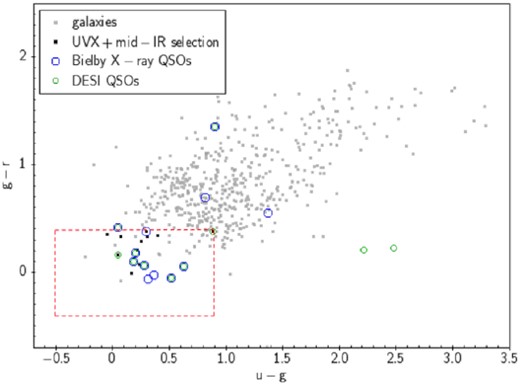
Colour selections performed on extended sources in the WHDF in the ugr colour space. WHDF extended sources (galaxies) are shown in grey. X-ray QSOs from Bielby et al. (2012) are shown in blue and QSOs found by DESI are shown in green. There are two extended QSOs from Bielby et al. (2012) and two extended QSOs from DESI which can be seen to have extended counterparts. The ugr + grW1 ATLAS QSO selections for extended sources are shown as black points. The red dotted lines denote the ATLAS selection in this colour space. All selections are magnitude limited to g < 22.5. Note that, although difficult to see on the plot, the QSO at u – g = 1.37 does not have an extended counterpart.
Colour selections performed on extended sources in the WHDF in the grW1 colour space. WHDF extended sources (galaxies) are shown in grey. X-ray QSOs from Bielby et al. (2012) are shown in blue and QSOs found by DESI are shown in green. There are therefore two extended QSOs from Bielby et al. (2012) and two extended QSOs from DESI. The ugr + grW1 ATLAS QSO selections for extended sources are shown as black points. The red dotted lines denote the ATLAS selection in this colour space. All selections are magnitude limited to g < 22.5.
These restricted ugr cuts for extended sources are as follows:
The restricted mid-IR grW cuts are:
The two X-ray QSOs with g < 22.5 from Bielby et al. (2012) that are morphologically classified as extended sources (WHDFCH20 and WHDFCH110) have redshifts of |$z$| = 0.95 and |$z$| = 0.82. Visual inspection suggests that WHDFCH110 might be slightly elongated and that WHDFCH020 might overlap a faint galaxy in the r-band. The two DESI QSOs classified as galaxies with g < 22.5 are WHDF 8222 at |$z$| = 2.68 and WHDF 3081 at |$z$| = 1.31. WHDF 3081 is also found to be a relatively bright X-ray source, WHDFCH052, listed by Vallbé Mumbrú (2004) but not by Bielby et al. (2012). WHDF 8222 is similarly listed as a fainter X-ray source by Vallbé Mumbrú (2004) – see Table A2. We have already noted that the |$z$| = 2.68 QSO is a double object (in H-band) and probably lensed. The |$z$| = 1.31 QSO appears to be interacting with a pair of very red compact sources at ≈3 arcsec distance. We conclude on the basis of these four extended QSOs that they are mostly not misclassifications and should be included in our QSO sample. This is supported by other, fainter, g > 22.5 QSOs, WHDFCH007, WHDFCH008 that are also classed as galaxies on an WHDF HST i image (Shanks et al. 2021). Finally, WHDFCH048 that also has g > 22.5 and is classed as a galaxy, although outside the HST i frame, appears to be interacting with two other objects within ≈3 arcsec, again justifying its extended classification.
3.3 WHDF selection summary and conclusions
To summarize, we have tested our photometric selections in the extended WHDF Chandra X-ray overlap area of 214 arcmin2 or 0.0594 deg2. The main results from the WHDF analysis as tabulated in Table 1 are:
(1) A complete census of the broad-lined QSO population in the WHDF to g < 22.5 using X-ray, ugr, grW, and also DESI results reveals a total confirmed QSO sky density of 269 ± 67 deg−2 at 16 < g < 22.5. From their Luminosity Function (LF) model, Palanque-Delabrouille et al. (2016) estimate 196 deg−2 at this limit, again in good statistical agreement with the 269 ± 67 deg−2 found in the WHDF. These authors also predict 143 deg−2 at |$z$| < 2.2, within ≈1σ of the 202 ± 58 deg−2 found on the WHDF. They also predict 53 deg−2 at |$z$| > 2.2, again in good agreement with the 67 ± 17 deg−2 found in the WHDF. We also note that 25 per cent of all WHDF QSOs to g < 22.5 were morphologically classed as galaxies/extended in the R-band, a sky density of 67 ± 34 deg−2.
(2) The X-ray QSOs have a sky density of 253 ± 65 deg−2 with g < 22.5 to the faint Chandra limit and 185 ± 56 deg−2 with g < 22.5 to |$S_X(0.5-10\, {\rm keV})\gt 1\times 10^{-14}$| erg s cm−2 s−1, approximately the ‘eROSITA’ limit. Of these g < 22.5 X-ray QSOs, ≈20 per cent were classed as extended.
(3) From the DESI optical-MIR selection a total sky density of 185 ± 56 deg|$^{-2}\, g\lt 22.5$| QSOs were found, of which 101 ± 41 deg−2 were detected as X-ray QSOs at the eROSITA X-ray limit and 84 ± 38 deg−2 were undetected at this limit. Again 20 per cent were classed as extended and 80 per cent were stellar.
(4) We conclude that neither X-ray (at the brighter ‘eROSITA’ limit) nor the preliminary DESI data produce complete stellar QSO samples, both missing ≈30 per cent of stellar QSOs to g < 22.5. Similarly X-ray and DESI miss ≈50–60 per cent of extended QSOs. So, they give a stellar QSO sky density of 135–152 deg−2 and extended QSO sky densities of 34–51 deg−2, leading to a sky density for both of 185 deg−2. Given the total WHDF QSO sky density of 269 ± 67 deg−2 this means that both have a similar overall completeness of ≈70 per cent, implying that an eROSITA X-ray survey will add ≈40–45 per cent to a g < 22.5 optical/MIR QSO sky density. We also note that X-ray selected, stellar subsamples have essentially zero contamination, much less than any other selection method.
(5) For DESI QSOs with g < 22.5, 4/11 have |$z$| > 2.2, implying a sky density of ≈67 deg−2 and 7/11 having |$z$| < 2.2 for a sky density of ≈118 deg−2. X-ray selection is always more skewed towards lower redshifts (e.g. Boyle et al. 1994), with none here at the brighter ‘eROSITA’ limit having |$z$| > 2.2. But note that at the fainter |$S_X(0.5-10\, {\rm keV})\gt 1\times 10^{-15}$| ergs cm−2s−1 limit, three of these four |$z$| > 2.2 QSOs are ultimately also detected in X-rays.
(6) In principle, a stellar grW cut should select ≈90 per cent of the QSOs for a sky density of ≈185 deg−2 while suffering ≈38 per cent contamination. The stellar X-ray selection to the ‘eROSITA’ limit produces 67 per cent completeness, for a sky density of ≈135 deg−2 with zero contamination, at least when matched to a g < 22.5 star sample. The UVX technique produces similar ≈67 per cent completeness with only slightly lower ≈33 per cent contamination. For extended sources, the grW, UVX, and ‘eROSITA’ X-ray selections all achieve 75 per cent completeness which is only bettered by the 100 per cent completeness of the faint ‘Chandra’ X-ray selection. The X-ray selections have the lowest contamination and the UVX selection the highest.
(7) Thus focusing first on optimizing QSO selection in the stellar samples, and assuming no X-ray data are available, grW seems the most promising base for selection giving higher completeness and lower contamination than ugr. For the 20–25 per cent of QSOs classed as extended, although the grW and ugr completenesses are the same, the contamination is lower for grW1 than ugr.
So the MIRX cuts generally perform better than UVX when the optical photometry is as deep as in the WHDF and when the MIR photometry is as deep as in the SpIES survey. But we again emphasize that these results apply only in the best-quality data as is available in the WHDF. In particular, we shall see below that at SDSS or ATLAS depths with no X-ray data yet available, the ugr selection still has an important role to play alongside grW in selecting |$z$| < 2.2 and |$z$| > 2.2 QSO samples at g < 22.5.
4 VST-ATLAS QSO SELECTION
Based on previous experience with VST ATLAS and the WHDF analysis above we now describe our QSO selection using the current VST ATLAS data. As stated in Section 2.1.1, our VST-ATLAS data set was updated from previous work. Therefore, we begin by noting that we have improved the star–galaxy separation by adding to the standard separation in g an additional selection in the gKron − gA3: g plane5 to account for seeing variation in interchip gaps covered by only one of the two stacked images (Shanks et al. 2015). Here we used the relations gKron − gA3 > (0.5gA3 − 0.864) for g < 19.78 and gKron − gA3 > 0.125 for g > 19.78 to select extra stars from amongst the objects initially classified as galaxies. To increase the depth of our survey, we also introduce a seeing weighted combination of the ATLAS u-band magnitude and the Chilean u-band extension programme.
As the ATLAS data is noisier than the data available in the WHDF, we have to adjust slightly the selections used there to decrease contamination. This can be seen in the ATLAS u − g: g − r selection in equation (8) which more closely follows the wider ATLAS stellar locus. We shall see that basic grW cuts in ATLAS give a high contamination, leading to candidate densities of up to ≈400 deg−2 caused by galaxy contamination. As we do not yet have full X-ray coverage of VST-ATLAS, we therefore pursue joint MIRX and UVX selections which seemed to reduce contamination by ≈10 per cent even in the high quality WHDF data (see Section 3.3). Therefore, instead of selecting either only the grW MIRX candidates OR the ugr UVX candidates, we shall combine these with the aim of providing a high priority (called Priority 1 for the rest of this paper) 16 < g < 22.5 QSO candidate catalogue, dominated by |$z$| < 2.2 QSOs because of the inclusion of the UVX cuts.
But first, following Croom et al. (2009) and further motivated by experience with deeper KiDS ugri data in the GAMA G09 field (see Eltvedt et al., in preparation), we apply a cut to remove White Dwarf stars that would otherwise contaminate our UVX selection.
Base selection with White Dwarf cut:
The selections using our UVX and our mid-IR colour cuts are then defined as follows:
ATLAS UVX selections:
Mid-IR, known hereafter as grW, selections:
The last W1 − W2 cut is only performed on objects which are found using the mid-IR selections with a detection in W2. If they have no detection in W2, only the mid-IR selections featuring W1 are applied.
The main grW and UVX selections can be seen in Figs 6 and 7. Here we show the ATLAS stellar objects in grey, with the stellar loci clearly visible. The candidates selected through our Priority 1 sample are shown in green. The resulting tile density of QSO candidates targeted through the Priority 1 selections can be seen in Fig. 8 for the NGC and SGC.
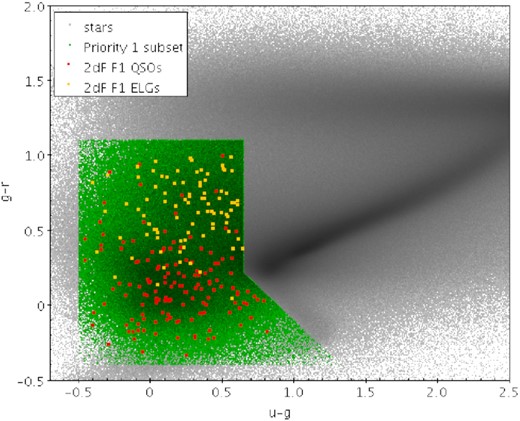
The final u − g: g − r selection for VST-ATLAS Priority 1 QSO candidates. We also show the placement of the 2dF F1 objects which were observed in this ugr colour space. Objects which have been identified as QSOs are shown in red, NELGs are shown in yellow. ATLAS stars are shown in grey and the Priority 1 sample is shown in green.
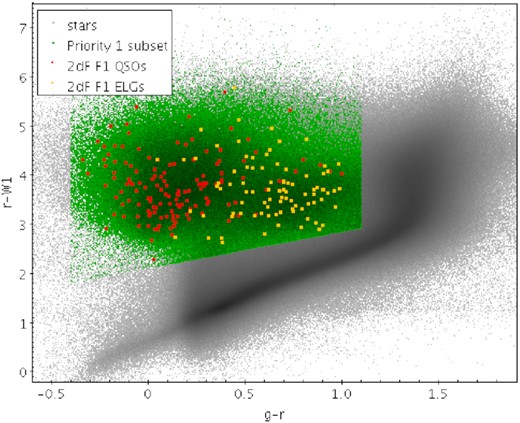
The final g − r: r − W1 selection for VST-ATLAS priority 1 QSO candidates. We also show the placement of the 2dF F1 objects which were observed in this grW1 colour space. Objects which have been identified as QSOs are shown in red, NELGs are shown in yellow. ATLAS stars are shown in grey and the Priority 1 sample is shown in green.
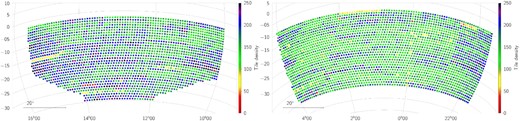
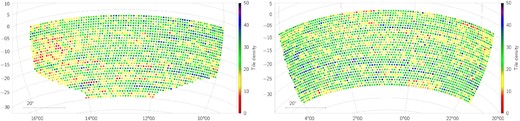
VST-ATLAS NGC and SGC tile density (deg−2) of ugr & grW Priority 1 QSO candidates.
After the first star–galaxy separation step of QSO selection, we noticed significant gradients in the sky density of stars, particularly in the NGC and, to a lesser extent, in the SGC and these persisted into the final QSO samples such as the Priority 1 selection shown in Fig. 8. The fluctuations within field concatenations are of the order of |$\sim \pm 18~{{\ \rm per\ cent}}$| (full range) in the NGC and |$\sim \pm 9~{{\ \rm per\ cent}}$| in the SGC, bigger than expected from Poisson fluctuations. The extra contributions mainly come from increased galaxy contamination in fields with poorer g-band seeing, residual |$\sim 20~{{\ \rm per\ cent}}$| tile incompleteness in Chilean u-band data where only ATLAS u-band data are available and stellar features like the Sagittarius stream which covers the NW corner of the ATLAS SGC area. This feature also caused a similar gradient in the DESI target catalogue and this had to be removed prior to the QSO angular clustering analysis of Chaussidon et al. (2022b).
After a first round of observing on the 2dF instrument at AAT (see Section 5.2), we found that the main contaminants of the Priority 1 selection are compact Narrow Emission Line Galaxies (NELGs), with these source accounting for about 25 per cent of the contamination. Figs 6 and 7 show spectroscopically confirmed QSOs in red and NELGs in yellow. The latter seem to cluster in a cloud centred at g − r ≈ 0.7 and r − W1 ≈ 3.5. Therefore, we define a further cut to be optionally excluded from this Priority 1 subset in order to reduce this galaxy contamination. This NELG ‘exclusion zone’ is defined as:
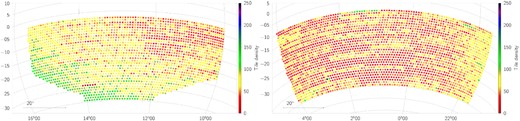
This cuts down the QSO candidate sky densities by 41 and 31 deg−2 in the NGC and SGC. The resulting QSO tile density across the sky from this selection which reduces the NELG contamination can be seen in Fig. 9 for the NGC and SGC.
VST-ATLAS NGC and SGC tile density (deg−2) of ugr & grW1W2 QSO candidates with an additional selection to remove NELGs.
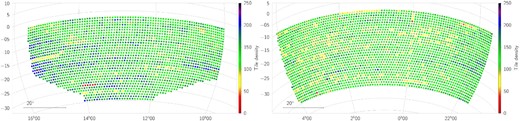
We also define a selection to target higher redshift, |$z$| > 2.2 objects. For this selection, we target objects found in the MIRX selections that are not detected through our UVX selection, also requiring a detection in W2. The tile density of candidates for this selection are seen in Fig. 10. This selection, defined below in equation (11), is referred to as ‘grW non-UVX’ throughout the rest of the paper.
VST-ATLAS NGC and SGC tile density (deg−2) of MIRX & non-UVX candidates to target higher redshift objects. Note the significant gradient to higher sky densities towards lower Galactic latitudes (i.e. RA≈15 h, Dec = −20 deg).
Finally, we define a selection for QSOs that we believe have been (mis-)classified as galaxies. For this selection, we start with the previously defined extended source cuts (as outlined in Section 3.2.4). We adjust the u − g cut in the same way as the stellar selection. We also introduce the W1 − W2 requirement to decrease contamination. The final extended source selection is shown below in equation (12). The tile density of QSO candidates targeted with this selection is seen in Fig. 11.
VST-ATLAS NGC and SGC tile density (deg−2) of QSO candidates that are classified as galaxies in the g-band.
The overall sky densities of these selections are shown in Table 2. The NGC has an ≈24 per cent higher candidate density than the SGC in the Priority 1, grW non-UVX, and total cases, the only exception being the galaxy cut. Since the NGC is at lower galactic latitudes than the SGC it is likely that this is caused by higher stellar contamination. However, since the main contaminants are expected to be NELGs a more complicated explanation might be needed such as the higher stellar density causing more galaxy–star overlaps that disrupt the grW stellar rejection via colour contamination. Otherwise the candidate densities are reasonably homogeneous in Figs 8–11 with the main exception being the NGC high redshift selection where an increasing candidate density towards lower galactic latitudes is seen in Fig. 10. We shall see that similar results apply once we split into |$z$| > 2.2 and |$z$| < 2.2 samples using photometric redshifts in Section 7.
Number counts and sky densities for the colour selections applied to the full VST-ATLAS footprint. Totals in column 8 are sum of columns 4, 6, and 7.
| Sky Area | UVX | grW | UVX & grW | UVX & grW | grW & | Extended | Total |
|---|---|---|---|---|---|---|---|
| selection | selection | ‘Priority 1’ | with NELG cut | non-UVX | cuts | candidates | |
| NGC (2034 deg2) | 1128 470 | 985 294 | 395 459 | 312 296 | 154 723 | 49 556 | 599 738 |
| NGC (deg−2) | 554.8 | 484.4 | 194.4 | 153.5 | 76 | 24.4 | 294.9 deg−2 |
| SGC (2706 deg2) | 910 719 | 834 994 | 422 731 | 339 194 | 142 204 | 64 315 | 629 250 |
| SGC (deg−2) | 336.6 | 308.6 | 156.2 | 125.3 | 52.6 | 23.77 | 232.5 deg−2 |
| Total (4740 deg2) | 2039 189 | 1820 288 | 818 190 | 651 490 | 296 927 | 113 871 | 1228 988 |
| Total (deg−2) | 430.2 | 384.0 | 172.6 | 137.4 | 62.6 | 24.0 | 259.3 deg−2 |
5 SPECTROSCOPIC COMPLETENESS AND EFFICIENCY OF THE VST-ATLAS QSO SELECTION
We utilize photometric DESI QSO candidate target catalogues along with spectroscopic results which will be released in DESI DR1 (see Chaussidon et al. (2022a), Alexander et al. (2022), Myers et al. (2023) for information on DESI target selection and data quality validation), as well as our own spectroscopic results from 2dF in order to test the completeness and efficiency of our ATLAS QSO candidate selection to our faint g < 22.5 limit. We also similarly utilize 2QZ, 2QDES, and eBOSS, which are completed spectroscopic surveys and also have large areas of overlap with VST ATLAS to test our final ATLAS QSO catalogue down to their respective g < 20.8, g < 22, and g < 21.9 magnitude limits. Taken together, these analyses provide a reasonably complete picture of the completenes and efficiency of our full ATLAS QSO catalogue.
5.1 DESI Comparison
The latest DESI internal data release, Guadalupe, covers a large area of the DESI footprint which includes some ≈144 deg2 overlap with VST ATLAS (see Fig. 1). In addition to the Guadalupe release, we also utilize the DESI quasar candidate catalogue/quasar targets in this area, which were chosen using DECaLS Legacy Survey DR9 data (Yèche et al. 2020), to form a more complete comparison of our quasar candidate selections. In order to test first the accuracy of the ATLAS photometry down to g < 22.5, we look initially at an ≈8.5 deg2 sub-area of the larger ≈144 deg2 overlap with DESI targets in the NGC centred around RA = 14h08m00|${^{\rm s}_{.}}$|0, Dec=−4°. This area encompasses approximately one DESI rosette, which has 5000 fibre positions, including sky fibres.
5.1.1 DESI-ATLAS photometric comparison
We first check the photometric quality of our VST ATLAS data by matching the raw g-band, r-band, and W1-band data to the DESI targets in the 8.5 deg2 sub-area of Fig. 1. The results can be seen in Fig. 12. Generally we see good agreement between the depth of the ATLAS aperture 3 g and r stellar photometry compared to DECaLS, as well as the WISE neo6 data versus DECaLS. However, we see that the QSO candidates show a larger scatter than the general stars, especially in g and r, and particularly at brighter magnitudes.
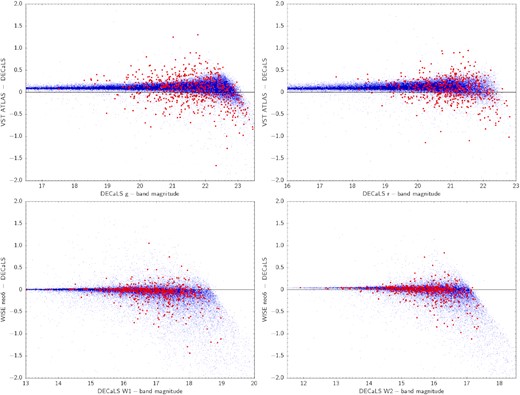
DESI DECaLS DR9 versus VST ATLAS in the g-, r-bands and DESI DECaLS DR9 v WISE (neo6) in the W1- and W2-bands, in a sample ∼8.5 deg2 area. The red points represent known QSOs and the blue points represent objects classified as stars.
Comparisons between both SDSS and ATLAS data and SDSS and DESI data show a similarly large scatter for quasar candidates. This suggests that this excess scatter, particularly at bright magnitudes, is dominated by quasar variability caused by the significant epoch difference between these three data sets. Indeed, even at 21.5 < g < 22.5, the scatter in stars remains at only the ±0.05 mag level implying that our ATLAS photometry remains accurate at and perhaps even beyond our g = 22.5 limit. The result in r is similar with a scatter of only ±0.05 mag measured in the range 22 < r < 23 mag.6
5.1.2 DESI – ATLAS target overlap
Now we have determined that our data quality is comparable down to our limit of g < 22.5, we check target overlap in the ≈144 deg2 area of overlap between DESI observations and the NGC of VST-ATLAS, seen in Fig. 1. There are 37 306 ATLAS quasar candidates in this area, giving a 259 deg−2 sky density. In the same area there are 50 016 DESI QSO candidates. These were selected through a combination of photometric colour cuts and a Random Forest code (see e.g. Yèche et al. 2020), and are limited to r < 23. Of these, 34 106 lie within our 16 < g < 22.5 range, giving a 237 deg−2 target density. When we match these DESI targets to our full VST ATLAS catalogue (prior to making any QSO selections), we get a match of 29 897 objects, with 4209 (= 34 106–29 897 or 12 per cent) being unmatched in ATLAS. If we now perform a match between the DESI targets and our total ATLAS QSO candidate selection, using a 1 arcsec matching radius, we find 17 673 overlapping objects. This includes our full ugr + grW selection, the grW non-UVX selection, as well as our ‘galaxy’ selection. Therefore, our ATLAS quasar selections are missing 12 224 (=29 897–17 673 = 41 per cent) of the 29 897 QSO candidates selected by DESI and that are available in ATLAS, giving an ATLAS ‘target completeness’ relative to DESI of 59 per cent. Of these 12 224 objects, 58 per cent are morphologically classified as stars, 41 per cent are classified as galaxies, 48 per cent do not have a detection in W1, and 41 per cent were removed due to the base gri White Dwarf cut. Comparing our VST ATLAS selections individually, the ugr + grW, Priority 1, cut gives us 24 676 candidates in this area, of which 12 765 are in common with DESI QSO candidates. The non-UVX selection has 9296 candidates, with 3703 in common. Finally, the extended source selection has 3334 candidates, with 1652 in common.
5.1.3 DESI-ATLAS spectroscopic comparison
The DESI collaboration started commissioning their main spectroscopic survey at the start of 2021. We shall be using spectra from the Guadalupe internal data release and we emphasize that all results reported here must be regarded as preliminary because they were taken from a snapshot of the DESI spectroscopic catalogue that may be incomplete in terms of exposure time, area coverage, etc. We use the QSO catalogues described by Chaussidon et al. (2022a) and Alexander et al. (2022), constraining our sample to ‘dark’ and ‘bright’ main programs, and again focusing on the ≈144 deg2 overlap with VST ATLAS as indicated in Fig. 1. This provides at least an initial estimate of DESI completeness and efficiency for the purpose of evaluating the same parameters for VST ATLAS. We emphasize that at this stage not all the DESI candidates have been spectroscopically targeted, and the DESI results may change when their full coverage and exposure times are achieved.
There are a total of 17 716 spectroscopically confirmed DESI QSOs in the 144 deg2 area, although only 14 302 lie in the range 16 < g < 22.5, and not all of these were originally targeted as QSO candidates. Overall, only 17 553 of the 34 106 DESI g < 22.5 QSO candidates have so far been observed, with 13 128 of these confirmed to be QSOs, so 14 302–13 128 = 1174 were presumably selected through other targeting programs, such as ELGs (Raichoor et al. 2022), LRGs (Zhou et al. 2023), or bright galaxies (Hahn et al. 2022). The 13 128/17 553 = 74.7 per cent DESI QSO fraction is higher than the 70–71 per cent success rate suggested by Chaussidon et al. (2022a) and Alexander et al. (2022), probably due our application of a g < 22.5 limit rather than the full r < 23 DESI limit.
The full VST-ATLAS data overlaps with 13 374 of the 17 716 quasars. Out of these 13 374 possible quasars that were available to gATLAS < 22.5, our QSO selections picked up 9327 objects, composed of 7594 out of the 10 331 DESI QSOs at |$z$| < 2.2 and 1733 out of the 3043 DESI QSOs at |$z$| > 2.2 (see Table 3). Thus the overall ATLAS completeness at g < 22.5 relative to DESI is 70 per cent in this field, with 74 per cent at |$z$| < 2.2 and 57 per cent at |$z$| > 2.2.
NGC ATLAS-DESI overlap test of the various ATLAS QSO selections. The selections in column 1 are described in Section 4. ‘Priority 1’ is comprised of objects found in both ‘star grW’ and ‘star UVX’. ‘Star total’ includes the ‘priority 1’ objects in addition to the ‘star grW non-UVX’ candidates. Column 2 shows the sky density of QSO candidates based on each selection. Column 3 shows the completeness of the ATLAS selections with regards to the DESI spectroscopically confirmed QSOs across the full redshift range. This is then split between the |$z$| < 2.2 and |$z$| > 2.2 completeness in columns 4 and 5.
| ATLAS Subset | Sky density | Completeness | |$z$| < 2.2 | |$z$| > 2.2 |
|---|---|---|---|---|
| (deg−2) | (per cent) | (per cent) | (per cent) | |
| Stars 16 < g < 22.5 | ||||
| star grW | 56656/144 = 393 | 8735/10107 = 86.4 | 6803/7656 = 88.9 | 1932/2451 = 78.8 |
| star grW (W2 required) | 23534/144 = 163 | 7870/10107 = 77.9 | 6373/7656 = 83.2 | 1497/2451 = 51.1 |
| star UVX | 71844/144 = 499 | 7071/10107 = 70.0 | 6051/7656 = 79.0 | 1020/2451 = 41.6 |
| Priority 1 | 24676/144 = 171 | 6708/10107 = 66.4 | 5818/7656 = 76.0 | 890/2451 = 36.3 |
| star grW non-UVX | 9296/144 = 65 | 1707/10107 = 16.9 | 918/7656 = 12.0 | 789/2451 = 32.2 |
| star total | 33972/144 = 236 | 8415/10107 = 83.3 | 6736/7656 = 88.0 | 1679/2451 = 68.5 |
| Galaxies 16 < g < 21.9 | ||||
| extended cuts | 3334/144 = 23 | 912/3267 = 27.9 | 858/2675 = 32.1 | 54/592 = 9.12 |
| Total | ||||
| 37306/144 = 259 | 9327/13374 = 69.7 | 7594/10331 = 73.5 | 1733/3043 = 57.0 |
We note that there remains advantage to be gained from including the ATLAS u-band in our selection as well as grW. Using the stellar grW selection in equation (9) would result in an overall sky density of 393 deg−2 and this reduces to 171 deg−2 by combining with stellar UVX selection to give Priority 1 in Table 3. Although including grW non-UVX increases this by 65 to 236 deg−2, this represents an ≈40 per cent reduction in candidate density. However, if we use grW (which already requires W1 − W2 > 0.4 for those objects with W2) with the added demand that only objects with a measured W2 are included then the density reduces to 163 deg−2. But the total stellar selection with the u band still achieves a completeness with respect to DESI of 83 per cent compared to 78 per cent with grW (W2 required). The completeness advantage is slightly bigger for the |$z$| > 2.2 sample than for the |$z$| < 2.2 sample (see Table 3). There remains 393–236 ≈157 deg|$^{-2}\, grW$| candidates that are not included in either the UVX or non-UVX samples. These could still be treated as lower priority candidates in a spectroscopic survey.
We finally recall from Chehade et al. (2016) that at the depth of the AllWISE W1 and W2 data used by these authors, the MIRX candidates only reached g ≈ 20.5 mag whereas with neo6 the depth reached is g ≈ 22 mag in W1 and g ≈ 21.5 mag in W2. With further NEOWISE exposure time the W1, W2 depth reached will be highly competitive with UVX so that in the cases at least where deep, high resolution griz photometry is available then the u data may not be required. The griz photometry that is available in the DES area satisfies these conditions and so the 4CRS survey may not require the availability of u data to reach the same depths as in VST ATLAS.
5.1.4 DESI comparison conclusions
To summarize, the DESI QSO candidate sky density at g < 22.5, over the full redshift range is 237 deg−2. Using a success rate of 74.7 per cent, based on the 13128/17553 spectroscopically confirmed objects, and assuming the observed objects are a random selection from the candidate list, we can estimate that the DESI Guadalupe release currently has a g < 22.5 quasar sky density of 178 deg−2. We again emphasize that this result may ultimately change due to the preliminary nature of the DESI internal data release used here. The DESI QSO density over their full magnitude and redshift range is quoted in Chaussidon et al. (2022a) as >200 deg−2 with an efficiency of |$\sim 71~{{\ \rm per\ cent}}$| based on their main selection.
If we extrapolate these results to r < 23 using a canonical N ∝ 100.3m we find that the sky density rises from 237 to 335 deg−2 compared to 310 deg−2 quoted by Chaussidon et al. (2022a) (see also Alexander et al. 2022). Similarly, the 178 deg−2 QSO sky density we find at g < 22.5 increases to 251 deg−2 compared to the >200 deg−2 indicated by Chaussidon et al. (2022a). Given that the DESI numbers are restricted to |$z$| > 0.9 whereas ours apply to |$z$| > 0.5, we regard these numbers as being in reasonable agreement. Our VST ATLAS QSO candidate sky density in the DESI overlap area at g < 22.5 is 259 deg−2. Based on the spectroscopic completeness relative to DESI (see above), we can extrapolate that the ATLAS confirmed g < 22.5 quasar sky density is 0.7 × 178 = 125 deg−2. Therefore, the ATLAS efficiency at g < 22.5 and all |$z$| is 125/259 = 48.2 per cent. However, when we look at the efficiency of our targets that were observed by DESI, 10 595 of the ATLAS targets in the overlap area were observed, of which 9327 were confirmed to be QSOs. Therefore, we have a |$9327/10595=88~{{\ \rm per\ cent}}$| efficiency of observed targets. This higher efficiency than the 75 per cent and 48 per cent DESI and ATLAS efficiencies noted above, is likely due to jointly selected targets naturally having lower contamination rates than either individual selection.
Finally, we can determine that if we assume DESI Guadalupe is already complete in the area we have used and that Guadalupe samples |$z$| < 2.2 and |$z$| > 2.2 targets fairly, then the DESI sky density at |$z$| < 2.2 will be 178 × 10331/13374 = 137 deg−2 and at |$z$| > 2.2 it will be 178 × 3043/13374 = 41 deg−2. The ATLAS sky density at |$z$| < 2.2 will then be 0.74 × 137 = 102 deg−2 and 0.57 × 41 = 24 deg−2 for |$z$| > 2.2.
At g < 22.5, for all redshifts, our ATLAS selection is missing confirmed DESI QSOs. The ATLAS grW1 bands all seem comparatively deep enough. In the specific case of W1, we tested this by swapping the DECaLS DR9 W1 for the neo6 W1 band and finding that this resulted in little change to the selected candidates. Additionally, the missing QSOs are located in same place in the gri, grW1, and ugr colour spaces as the confirmed quasars. The main problem seems to be in W2 with 2058/13374 = 15 per cent of DESI-ATLAS confirmed quasars missing in neo6 W2. Improved ATLAS morphological star–galaxy separation might reduce our galaxy contamination but, as we have seen, quasars can be correctly classed as extended and NELGs exist that are compact and stellar like. Thus until deeper W2 data becomes available we require to use the joint MIRX and UVX selection to limit galaxy contamination while maintaining a high completeness.
We also note that the VST ATLAS 125 deg−2 quasar sky density at g < 22.5 is a lower limit because there are likely to be extra quasars in the ATLAS candidate list that did not appear in the DESI list. These extra ATLAS quasars could be those that had varied to be brighter than g < 22.5 at the ATLAS epoch while being dimmer than the DESI limit (r < 23) at the DESI epoch. We shall see there is some evidence for this effect in the 2dF tests of ATLAS cuts in Section 5.2 below.
5.2 2dF Comparison
We were further able to test our selection through observing runs using the 2dF instrument with the AAOmega spectrograph (Sharp et al. 2006) at the Anglo-Australian Telescope (AAT) in 2021 February–April (see Table 4). Two fields were observed, NGC-F1 and NGC-F2/NGC-F2A. The 580V and 385R gratings were used with the 5700 Å dichroic. Both fields were run first with targets from our standard ATLAS quasar UVX + grW selection. The NGC-F2A observation then prioritized the grW non-UVX and the extended source selections. Most data was obtained for NGC-F1 with 4.75 h of observations and it is clear that such an exposure time is needed to get as high as ≈67 per cent spectroscopic identifications, given the average observing conditions that were experienced. The exposure time for the NGC-F2 observation was less than half that of NGC-F1 resulting in only 54 per cent spectral identifications achieved.
ATLAS Fields observed by 2dF. For the NGC-F2A data in the bottom row, the blue and red arm of the spectra were reduced and analysed separately. Here we show what fields were observed, for how long, the seeing on each field, and what percentage of the data we were able to make spectroscopic QSO IDs on.
| Field | RA (deg) | Dec (deg) | Date | Exposure | Seeing | IDs | Total Exp. | Comments |
|---|---|---|---|---|---|---|---|---|
| NGC-F1 | 196.9 | −16.0 | 18/2/2021 | 1 × 30 min + 4 × 20 min | 2|${^{\prime\prime}_{.}}$|1 | – | – | – |
| NGC-F1 | 196.9 | −16.0 | 09/3/2021 | 1 × 25 min + 2 × 30 min | 1|${^{\prime\prime}_{.}}$|4 | – | – | – |
| NGC-F1 | 196.9 | −16.0 | 15/3/2021 | 3 × 30 min | 4|${^{\prime\prime}_{.}}$|0 | 66.8 per cent | 4.75 h | – |
| NGC-F2 | 211.6 | −16.0 | 09/3/2021 | 18.3 + 25 + 15.3 min | 1|${^{\prime\prime}_{.}}$|5 | 60.2 per cent | – | – |
| NGC-F2 | 211.6 | −16.0 | 15/3/2021 | 3 × 25 min | 4|${^{\prime\prime}_{.}}$|0 | 35 (54) per cent | 2.25 h | – |
| NGC-F2A | 211.6 | −16.0 | 07/4/2021 | 4 × 20 min | 2|${^{\prime\prime}_{.}}$|5 | 43 per cent | 1.33 h | Moon |
After the first 2dF run on NGC-F1 we noted that there was significant contamination by Narrow Emission Line Galaxies (NELGs) with a sky density of ≈50 deg−2. So for the F2 observation we applied a further gri stellar cut to reduce this contamination (see Section 4, equation 10). This did reduce the NELG contamination but also contributed to the lower F2 quasar sky densities (see Table 4) and so this further NELG cut is not advised when trying to maximize quasar sky densities.
In what follows, we therefore focus on the combination of the NGC-F1 UVX + grW, priority 1, selection and the F2A non-UVX and extended source selection. In NGC-F1, we have 561 priority 1 QSO candidates. Of these 561 candidates, 352 were fibred. After analysing the resulting spectra in MARZ (Hinton et al. 2016), we find that 231 of these are identified as having QOP = 3 or 4 redshifts (where QOP is the MARZ spectral quality parameter with QOP = 3, 4 implying redshift qualities ‘good’ and ‘excellent’). This is 65.6 per cent of our target list, which gives us 122.7 deg−2 QSOs when normalized to the full number of targets at the same priority level in the field. We find 88 NELGs, giving us a galaxy contamination of 25 per cent, or 46.8 deg−2. There are four stars, which results in an 8.2 per cent stellar contamination, or 15.4 deg−2. Finally, there are 29 objects which have no clear ID, a rate of 8.2 per cent, or the equivalent of 15.4 deg−2 in our priority candidate subset. Furthermore, of the 231 spectroscopically identified QSOs, we find 203 at |$z$| < 2.2, giving a sky density of 107.8 deg−2 in our target redshift range, and 28 QSOs at |$z$| > 2.2 giving a sky density of 14.9 deg−2.
In NGC-F2 lower QSO (QOP = 3 or 4) sky densities were found with only 71.9 deg−2 at |$z$| < 2.2 and 11.2 deg−2 at |$z$| > 2.2 identified in the ugr + grW selection, compared to 107.8 and 14.9 deg−2 with the the same selection in the NGC-F1 field.
So, as summarized in Table 5, the AAT 2dF observations of NGC-F1 and NGC-F2A suggest that by combining the F1 priority 1 and the F2A non-UVX and extended source selections, achieves a |$z$| < 2.2 QSO sky density of 110 deg−2 and a |$z$| > 2.2 sky density of 30 deg−2 for a total sky density of 140 deg−2. With a combined candidate density of 283 deg−2, this implies an ATLAS efficiency of 140/283 = 50 per cent. These and the other ATLAS efficiencies are summarized in Tables 5 and 6. We see there is reasonable agreement between the results found in the DESI area and the 2dF field. These two tests complement each other with the DESI area giving lower limits on confirmed quasar sky densities from ATLAS because DESI itself may not be complete. The 2dF efficiencies will be upper limits especially at |$z$| < 2.2 because of the g < 21.1 limit that had to be used due to a lack of 2dF fibres for the NGC-F2A grW and non-UVX sample (termed ‘NGC F2A non-UVX’ in Table 5).
2dF NGC-F1 and NGC-F2/F2A 2dF + AAOmega spectroscopic identifications. The |$z$| < 2.2 and |$z$| > 2.2 columns describe spectroscopically confirmed QSOs. The percentages in columns 4 and 6 show the efficiency of our selection at both redshift ranges. †implies that an extra NELG cut was used.
| Field | Candidates | Fibred | |$z$| < 2.2 | |$z$| < 2.2 | |$z$| > 2.2 | |$z$| > 2.2 | NELGs | Stars | No ID |
|---|---|---|---|---|---|---|---|---|---|
| QSOs | QSOs | QSOs | QSOs | ||||||
| (#) | (#) | (N/per cent) | (deg−2) | (N/per cent) | (deg−2) | (deg−2) | (deg−2) | (deg−2) | |
| NGC-F1 UVX | 561 | 352 | 203/57.7 per cent | 107.8 | 28/8.0 per cent | 14.9 | 52.5 | 2.4 | 17.3 |
| NGC-F2 UVX† | 486 | 347 | 154/44.4 per cent | 71.9 | 24/4.9 per cent | 11.2 | 19.6 | 4.7 | 54.6 |
| NGC-F2A non-UVX | 187(g<21.1) | 182 | 5/2.7 per cent | 1.7 | 36/19.8 per cent | 12.0 | 4.8 | 5.1 | 33.3 |
| NGC-F2A galaxies | 102 | 65 | 2/0.0 per cent | 0.7 | 9/11.2 per cent | 3.0 | 4.9 | 1.2 | 15.2 |
| NGC-F2A NELG cut | 127 | 102 | 0/0.0 per cent | 0.0 | 19/11.2 per cent | 7.9 | 5.8 | 0.8 | 16.2 |
| Total | 187 + 62 + 34 = 283 deg−2 | 599 | 208 | >110.2 | 64 | >29.9 | >62.2 | >8.7 | 50.6 |
| Survey | ATLAS | ATLAS | ATLAS | ATLAS | Pri 1 | Pri 1 | Non-UVX | Non-UVX | Ext. | Ext. |
|---|---|---|---|---|---|---|---|---|---|---|
| candidates | QSOs | Comp. | Eff. | Comp. | Eff. | Comp. | Eff. | Comp. | Eff. | |
| DESI | 259 deg−2 | 125 deg−2 | 70 per cent | 48.3 per cent | 66 per cent | 52 per cent | 17 per cent | 35 per cent | 28 per cent | 53 per cent |
| 2dF | 283 deg−2 | 140 deg−2 | N/A | 50 per cent | N/A | 66 per cent | N/A | 22 per cent | N/A | 11 per cent |
5.3 2QZ, 2QDES, eBOSS comparison
We also utilize previously completed spectroscopic surveys to assess further the completeness and efficiency of our VST-ATLAS quasar selections. The completeness for each selection, compared to spectroscopically confirmed QSOs from 2QZ, 2QDES, and eBOSS, can be seen in Table 7 for the SGC and Table 8 for the NGC through the individual ‘Overlap’ columns as well as the final ‘star total’ and ‘stellar + extended’ completeness columns. The confirmed QSOs-stellar column refers to the total number of confirmed QSOs in each respective survey that, when matched to the full VST ATLAS survey, are classified as stars through our star/galaxy classifications. The confirmed QSOs-exten. column is the number of confirmed QSOs that are classified as a galaxy in our classifications.
VST-ATLAS completeness in the SGC based on spectroscopically confirmed QSOs from 2QZ, 2QDES, and eBOSS. Confirmed QSOs-stellar and Confirmed QSOs-exten. refer to the number of confirmed QSOs that are picked up as stars and galaxies, respectively, in the VST-ATLAS catalogue prior to making any QSO selection.
| Survey | Confirmed | Overlap | Overlap grW | Completeness | Confirmed | Overlap | Completeness |
|---|---|---|---|---|---|---|---|
| QSOs-stellar | Priority 1 | non-UVX | (Star total) | QSOs-exten. | gal cut | (Stellar + Extended) | |
| 2QZ (g < 20.8) | 10 179 | 9372 | 544 | 97.4 per cent | 1672 | 939 | 91.6 per cent |
| 2QDES (|$g\lesssim 22$|) | 2258 | 1962 | 130 | 92.6 per cent | 232 | 105 | 88.2 per cent |
| eBOSS(g < 21.8) | 1495 | 1148 | 270 | 94.8 per cent | 221 | 78 | 87.2 per cent |
VST-ATLAS completeness in the NGC based on spectroscopically confirmed QSOs from 2QZ, 2QDES, and eBOSS. Confirmed QSOs-stellar and Confirmed QSOs-exten. refer to the number of confirmed QSOs that are picked up as stars and galaxies, respectively, in the VST-ATLAS catalogue prior to making any QSO selection.
| Survey | Confirmed | Overlap | Overlap grW | Completeness | Confirmed | Overlap | Completeness |
|---|---|---|---|---|---|---|---|
| QSOs-stellar | Priority 1 | non-UVX | (Star total) | QSOs-exten. | gal cut | (Stellar + Extended) | |
| 2QZ (g < 20.8) | 1337 | 1216 | 88 | 97.5 per cent | 188 | 106 | 92.5 per cent |
| 2QDES (|$g\lesssim 22$|) | 4175 | 3417 | 204 | 86.7 per cent | 134 | 64 | 85.5 per cent |
| eBOSS(g < 21.8) | 1855 | 1230 | 399 | 87.8 per cent | 282 | 86 | 80.3 per cent |
The main result here is that in the brightest 2QZ sample the ATLAS stellar (star total) selections are producing ≈97 per cent completeness. These completenesses reduce for objects classed as extended but only to ≈92 per cent. It is not clear why this is the case but the poorer completeness for extended objects might be explained if they contained more lensed double quasars that were prone to higher variability, for example. We note that 1672/11851 = 14 per cent of 2QZ SGC quasars are classed as extended, with a similar fraction in the NGC, further justifies our inclusion of extended sources in our selections. The lower completenesses in 2QDES and eBOSS are mainly due to their fainter magnitude limits, possibly allied to higher variability if they are gravitationally lensed. The eBOSS sample is mainly a subsample of the DESI quasars in areas near the Dec≈0 deg Equatorial regions.
5.4 Spectroscopic analysis conclusions
Through our comparisons of DESI and ATLAS, our own observations from 2dF, and comparisons with 2QZ, 2QDESp, and eBOSS, we are able to estimate the completeness and efficiency of our VST ATLAS QSO candidates. The main results of these analyses, as shown in Tables 5, 6, 7, and 8 are:
From DESI comparisons, we estimate the overall VST ATLAS QSO completeness at 70 per cent. At brighter magnitudes we see higher completenesses in the range 88–97 per cent from comparisons with 2QZ, 2QDESp, and eBOSS.
From DESI and 2dF comparisons, we estimate the VST ATLAS QSO efficiency in the range 48–50 per cent. We thus estimate the ATLAS true QSO sky density to be in the range of 125–140 deg−2 for our full redshift range, with 102–110 deg−2 at |$z$| < 2.2 and 24–30 deg−2 at |$z$| > 2.2.
6 FINAL ATLAS QSO CATALOGUE
As summarized in Table 2, our final Priority 1 quasar candidate counts in the NGC give us a sky density of 194 deg−2, and a sky density of 156 deg−2 in the SGC. The colour selections performed on galaxies give an additional candidate sky density of 24 deg−2 in both the NGC and SGC. The mid-IR, grW non-UVX candidates give us a sky density of 76 deg−2, and a sky density of 53 deg−2 in the SGC.
Combining the NGC and SGC gives a sky density of 173 deg−2 Priority 1 candidates, plus 63 deg−2 non-UVX candidates, plus 24 deg−2 with the additional extended source selections. The 65 per cent higher candidate sky densities seen in the NGC for the UVX selection is probably due to the lower Galactic latitudes covered by the NGC, causing higher amounts of star contamination. In the Priority 1 sample the NGC is only 24 per cent higher because of the intrinsically low stellar contamination in combining the UVX and grW selections, which allows the more isotropic quasar distribution to dominate. As can be seen in Fig. 13, the quasar candidate sky density across the NGC and SGC is relatively uniform, barring some striping most likely due to sky conditions such as seeing and sky brightness. The catalogue of QSO candidates is described in Table 9 and can be accessed at: https://astro.dur.ac.uk/cea/vstatlas/qso_catalogue/.
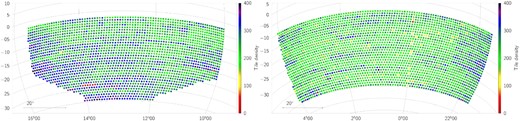
VST-ATLAS tile density (deg−2) of the total number of QSO candidates in the NGC and SGC using our full Priority 1 + grW&non-UVX + extended selections.
The columns of the VST ATLAS QSO Catalogue, which can be found at: https://astro.dur.ac.uk/cea/vstatlas/qso_catalogue/.
| Column | Units | Description |
|---|---|---|
| RA | Degrees J2000 | Right ascension of the object |
| DEC | Degrees J2000 | Declination of the object |
| selection | – | the selection, i.e. Priority 1, non-UVX, or extended that the object belongs in |
| u-mag | AB | VST ATLAS g-band Aperture 3 magnitude in the AB system |
| u-err | – | error on the VST ATLAS u-band Aperture 3 magnitude |
| g-mag | AB | VST ATLAS g-band Aperture 3 magnitude in the AB system |
| g-err | – | error on the VST ATLAS g-band Aperture 3 magnitude |
| r-mag | AB | VST ATLAS r-band Aperture 3 magnitude in the AB system |
| r-err | – | error on the VST ATLAS r-band Aperture 3 magnitude |
| i-mag | AB | VST ATLAS i-band Aperture 3 magnitude in the AB system |
| i-err | – | error on the VST ATLAS i-band Aperture 3 magnitude |
| z-mag | AB | VST ATLAS z-band Aperture 3 magnitude in the AB system |
| z-err | – | error on the VST ATLAS z-band Aperture 3 magnitude |
| W1-mag | Vega | neo6 W1-band magnitude in the Vega system |
| W1-err | – | error on the neo6 W1-band magnitude |
| W2-mag | Vega | neo6 W2-band magnitude in the Vega system |
| W2-err | – | error on the neo6 W2-band magnitude |
| photo-z | – | photometric redshift calculated using the ANNz2 algorithm |
6.1 n(g)
In Fig. 14, we now compare our candidate QSO number counts to the pure luminosity-function plus luminosity and density evolution (PLE + LEDE) model Palanque-Delabrouille et al. (2016), based on the quasar luminosity function (QLF) measured in eBOSS in the redshift range 0.68 < |$z$| < 4.0. This QLF data is fit by a double power-law model, with a linear pure luminosity-function for redshifts of |$z$| < 2.2 combined with a luminosity and density evolution model at |$z$| > 2.2. This new QLF is then used to predict the expected quasar number counts in order to optimize the fibre targeting for DESI to their limit of r ≈ 23. They updated their selection algorithm based on the time variability of quasar fluxes in SDSS Stripe 82. From table 6 of Palanque-Delabrouille et al. (2016), we take the expected quasar number counts, which are presented in bins of Δg = 0.5 mag and Δ|$z$| = 1 for the magnitude range of 16 < g < 22.5 and the redshift range of 0 < |$z$| < 3.
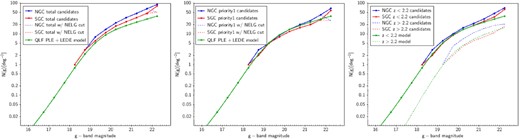
The observed VST ATLAS QSO candidate NGC and SGC number-magnitude counts compared to the PLE+LEDE QLF model predictions of Palanque-Delabrouille et al. (2016). (a) The full NGC + SGC VST-ATLAS QSO candidate sky densities as a function of g-band magnitude are shown in blue and red. The predicted QSO number counts from the QLF PLE+LEDE model in the 0 < |$z$| < 4 redshift range are shown in green. (b) Same as (a) for the Priority 1 counts compared to the 0 < |$z$| < 2.2 model. (c) Same as (a) for |$z$|photo < 2.2 (blue and red solid lines) and |$z$|photo > 2.2 (blue and red dashed lines).
These expected number counts are shown in Fig. 14, first for their full 0 < |$z$| < 3 redshift range. They predict a quasar candidate sky density of 196 deg−2 over this redshift range at g < 22.5, consistent with the 269 ± 67 deg−2 we estimated from the deep WHDF data in Section 3.2.1. This predicted sky density can be compared to our full Priority 1 + ‘grW+non-UVX’ + extended quasar selection which gives a candidate sky density of 259 deg−2 at g < 22.5, 32 per cent higher than the Palanque-Delabrouille et al. (2016) QLF PLE+LEDE 0 < |$z$| < 3 model, due mostly to contamination which is highest in the non-UVX and extended source cuts. Using their table 6, we also estimate a rough quasar candidate sky density in the 0 < |$z$| < 2.2 range, more appropriate for comparison with our Priority 1 sample. Therefore, compared to the 195 deg−2 candidates at 0 < |$z$| < 3, we find ≈143 deg−2 in the redshift range of 0 < |$z$| < 2.2 compared to 173 deg−2 in our Priority 1 sample and 137 deg−2 if the NELG cut is also made (see Table 2). This agreement to within ≈4 per cent of model (143 deg−2) versus Priority 1 with NELG cut (137 deg−2) is reasonably consistent with the low contamination rate for the Priority 1 sample found in the NGC-F1 2dF data when the NELG cut is applied (see Table 5).
As in Section 4, we note that the NGC sky density at 295 deg−2 is significantly (≈26.7 per cent) higher than the SGC at 232.8 deg−2. Now it is likely that this is simply due to higher contamination in the NGC, especially with the known NELG contamination of the raw Priority 1 sample and the increased contamination of the non-UVX and extended source cuts. However, the NGC count remaining high relative to the SGC over the large 18 < g < 22 range seen in Fig. 14(a) is somewhat surprising given the high efficiency/low contamination of QSO selection at bright, g < 21, magnitudes.
To investigate this effect further, we again restrict ourselves to just the Priority 1 candidates, that in the main have |$z$| < 2.2 due to the inclusion of the UVX criterion. They are therefore also more comparable to counts to brighter limits selected only by UVX, such as 2QZ, 2SLAQ and SDSS. For example, at the 2QZ limit of g < 20.8 the sky density at |$z$| < 2.2 is known to be ≈35 deg−2, rising to ≈40 deg−2 after 2QZ completeness correction (e.g. Croom et al. 2009). But the main reason we focus on the Priority 1 candidates is their high efficiency/low contamination which facilitates model and NGC versus SGC count comparison. So in Fig. 14(b) the Priority 1 NGC and SGC n(g) counts are compared to the QLF PLE+LEDE model, now over the redshift range of 0.5 < |$z$| < 2.2. Here, again we see that the NGC sky density at g < 22.5 remains higher than the SGC count, now by 24.4 per cent (194.4 versus 156.2 deg−2 – see Table 2). We also note that the NGC count remains consistently higher than the SGC count over the 18 < g < 22 range. So we now limit the Priority 1 sample at g < 20.8 where we expect a true QSO sky density of ≈40 deg−2. We find that the NGC sky density is 46.8 deg−2 whereas the SGC sky density is 40.2 deg−2, so the NGC Priority 1 count is 16.3 per cent higher than the SGC. To find what is causing this excess contamination in the NGC, we can look back at the NGC-F1 2dF observations at this same limit. In this field the Priority 1 candidate density to g < 20.8 was 44.1 deg−2, so similar to the NGC average of 46.8 deg−2, within error. At g < 20.8, NGC F1 sky densities were QSO 39.3 deg−2, NELG 1.6 deg−2, Stars/WD 0.5 deg−2, and non-IDs 2.6 deg−2. So assuming that the non-IDs are not QSOs this implies only ≈11 per cent contamination in this typical NGC field. So this contamination barely takes us to the level of the SGC which would require ≈16 per cent contamination in the Priority 1 NGC sample. Since it is likely that an SGC field observed for as long as NGC-F1 would also have similar contamination, it is not clear that increased contamination in the NGC does explain its increased sky density relative to the SGC. Deeper 2dF data in an SGC field to determine the amount of contamination there is required to resolve this question of this apparent NGC-SGC anisotropy. We return to these issues at the end of Section 7.
7 ANNZ2 PHOTOMETRIC REDSHIFT ESTIMATION
Finally, we wish to split our three candidate selections into two catalogues, a |$z$| < 2.2 ‘tracer sample’ and a |$z$| > 2.2 LyA sample using photometric redshifts for use by the 4MOST Cosmology Redshift Survey. These photometric redshifts will also be useful for projects to be discussed in Paper II. To determine the photometric redshifts we utilize the annz2 software (Sadeh, Abdalla & Lahav 2016). This code uses artificial neural networks and boosted decision/regression trees to optimize the photo-z estimation and has already been implemented as part of the analysis in DES (Sánchez et al. 2014). annz2 utilizes training based machine learning methods to derive the relationship between photometric observables and redshift.
7.1 annz2 training
To use annz2, we must train the algorithm with existing data which has similar properties to our candidates. We generate a training catalogue with the DESI Guadalupe data over the ≈144 deg2 overlap area discussed in Section 5.1. From this, we use the 13 374 QSOs in the overlapping area with the ATLAS NGC area, matched to the full VST-ATLAS data in order to train on photometry which we will be using for our data set. The spectroscopic redshift distribution of the sample is shown in Fig. 15. We use the ATLAS + ‘unWISE (neo6)’ ugrizW1W2 magnitudes, errors, and the DESI spectroscopic redshifts to train the algorithm as these spectroscopically confirmed quasars were targeted through similar colour selections and cover the required redshift range.
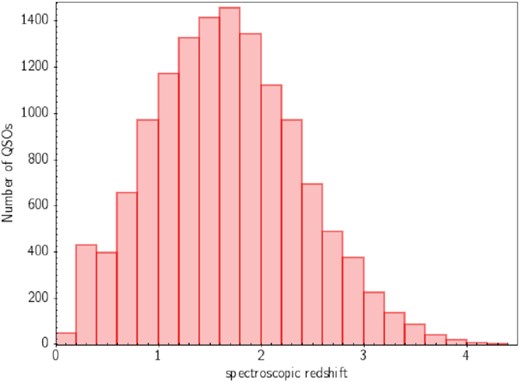
Spectroscopic redshift distribution of the full annz2 training and evaluation sample, using the DESI Guadalupe QSO Catalogue which will be released in DR1.
To test the efficiency of the algorithm as well as our training sample, we divide the sample randomly in half, training on one-half and testing the code on the other half. The result of that testing is seen in Fig. 16. Here we plot the photometric redshift estimated by annz2 versus the spectroscopic redshift of the testing half of the training sample. We can compare our results with Fig. 4 of Yang et al. (2017), which shows their photo-z versus spec-z results using optical only as well as optical + mid-infrared photometry. The top right-hand panel of their fig. 4 uses SDSS ugriz and AllWISE W1, W2 to generate photometric redshifts, similar to our ugriz and neo6 W1 and W2 data. Comparing our Fig. 16 to this top right-hand panel in fig. 4 of Yang et al. (2017), we see a similar relative degeneracy in the 0.8 < |$z$| < 3 range. However, our version, which has the benefit of deeper W1 and W2 data, seems to represent an improvement due to the removal of the outlying clumps of photo-z degeneracies.
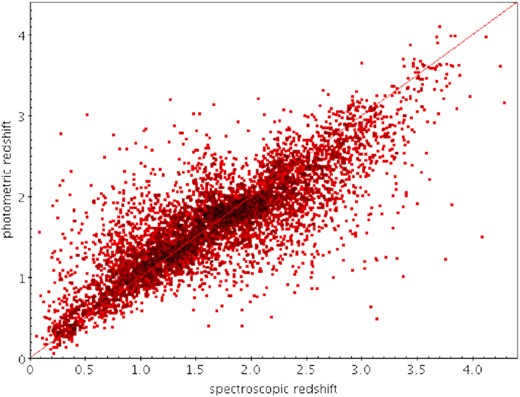
Photometric redshift compared to spectroscopic redshift for a random half of our DESI DR1 QSO sample used to test the training of the annz2 algorithm.
We estimate the photometric redshift error by measuring the standard deviation of Δ|$z$| = (|$z$|photo − |$z$|spec) to be σ|$z$| = 0.4. We also find the standard deviation on the quantity |$\frac{\Delta z}{1+z_{\rm spec}}$| to be ±0.16. At 0.5 < |$z$|photo < 2.2 this error is minimized and is reasonably constant at σ|$z$| ≈ 0.33.
7.2 Photometric redshift samples
Fig. 17 shows the resulting annz2 photometric redshift distributions of all ATLAS quasar candidates in the NGC and SGC. Withannz2, we are also able to create |$z$|photo < 2.2 and |$z$|photo > 2.2 quasar candidate targets. The candidate sky densities for both samples are shown in Table 10, where they are further split into NGC and SGC sky densities. We see that the overall |$z$|photo < 2.2 sky density is 193.5 deg−2 with the NGC now being 18 per cent larger than the SGC (212.2 versus 179.5 deg−2), similar to the Priority 1 case. The |$z$|photo > 2.2 sky density is 65.8 deg−2 with the NGC now being 55 per cent higher than the SGC (82.3 versus 53.1 deg−2). In Fig. 14(c) we show the number-magnitude relations for these two redshift ranges with the NGC-SGC-model comparison for |$z$|photo < 2.2 being similar to the results previously found in Figs 14(a) and (b). The 55 per cent higher NGC sky density for |$z$|photo > 2.2 is due to artefacts in the non-UVX selection (as we can see in Table 2) and is seen over a wide magnitude range (19 < g < 22.5).
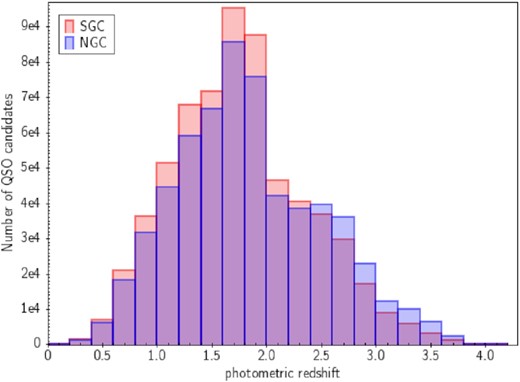
Photo-z distribution of our total QSO candidate catalogue over the full VST-ATLAS footprint, split into NGC and SGC subsamples.
QSO number counts and sky densities from our three selections (Priority 1, star grW non-UVX, extended) applied to the full VST-ATLAS footprint, divided into |$z$|photo < 2.2 and |$z$|photo > 2.2 candidates based on ANNz2.
| Sky area | Total candidates | Total candidates |
|---|---|---|
| |$z$|photo < 2.2 | |$z$|photo > 2.2 | |
| NGC (2034 deg2) | 431 587 | 168 151 |
| NGC (deg−2) | 212.2 deg−2 | 82.3 deg−2 |
| SGC (2706 deg2) | 485 670 | 143 580 |
| SGC (deg−2) | 179.5 deg−2 | 53.1 deg−2 |
| total sky (4740 deg2) | 917 257 | 311731 |
| total sky (deg−2) | 193.5 deg−2 | 65.8 deg−2 |
From the candidate sky densities for these |$z$|photo < 2.2 and |$z$|photo > 2.2 catalogues, we can estimate their true QSO sky densities. From Table 5, our ATLAS efficiency decreases to 53 per cent at |$z$| < 2.2 and 59 per cent at |$z$| > 2.2 when we correct for ATLAS completeness using DESI, and our AAT 2dF observations suggest an efficiency of ≈50 per cent. Then, since DESI completeness-corrected ATLAS contaminations are 47 per cent at |$z$| < 2.2 and 41 per cent at |$z$| < 2.2, averaging gives efficiencies of 51.5 per cent at |$z$| < 2.2 and 54.5 per cent at |$z$| > 2.2, implying true sky densities of 100 deg−2 at |$z$| < 2.2 and 36 deg−2 at |$z$| > 2.2. So assuming at |$z$| < 2.2 a 51.5 per cent efficiency and a candidate density from Table 9 of 193.5 deg−2 also gives a QSO density of ≈100 deg−2 (coincidentally).
Adding eROSITA X-ray data then will give an increased stellar + extended sky density of ≈45 per cent over DESI and ≈23 per cent over a nominal grW cut. Assuming an average increase of ≈33 per cent will then raise our |$z$| < 2.2 sky density to ≈130 deg−2. Our |$z$| > 2.2 sky density is unaffected by the X-ray data and so will remain at ≈36 deg−2.
Now it should be noted that these estimates are approximate because they do not take into account inaccuracies in the photometric redshifts. This is particularly true for the |$z$| > 2.2 sample as can be seen in Fig. 18 where the fractional completeness with respect to the 1733 DESI QSOs detected by ATLAS (see Table 3) and candidate sky density are shown as a function of the |$z$|photo cut. We find that the best trade-off between these two is with a cut at |$z$|photo > 1.9 where the |$z$| > 2.2 fractional completeness is 90 per cent and the sky density is ≈100 deg−2. We find that this adjustment of the |$z$|photo cut is less of a consideration when the aim is to target a |$z$| < 2.2 sample. Otherwise, we note that the highest overall completeness allied to the lowest overall candidate sky density at |$z$| > 2.2 will always be achieved by making a combined redshift survey of the two photo-z samples simultaneously, because this avoids target duplication in the 1.9 < |$z$|photo < 2.2 range.
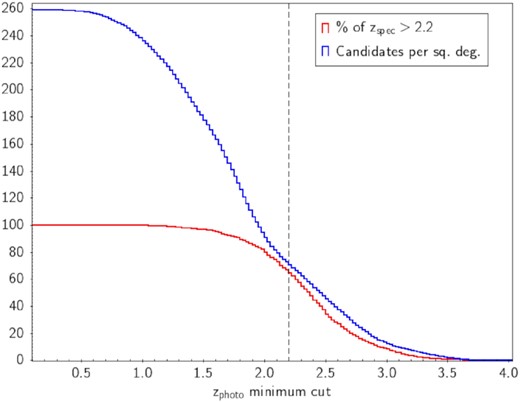
Dependence of QSO fractional completeness (as a percentage) with respect to the 1733 |$z$| > 2.2 QSOs detected by ATLAS (red line) and sky density of candidates per deg−2 (blue line) on |$z$|photo minimum cut. The dashed line marks the nominal |$z$|photo > 2.2 cut.
Finally, in Figs 19(a) and (b) we show the tile density maps for the |$z$| < 2.2 sample in the NGC and SGC and in Figs 20(a) and (b) we similarly show the tile density maps for the |$z$| > 2.2 sample. While the |$z$| < 2.2 maps look reasonably uniform across the sky as does the |$z$| > 2.2 map in the SGC, the |$z$| > 2.2 NGC map shows evidence of a gradient indicating that the high sky densities seen in Table 2 and Fig. 14(c) are coming from the NGC at lower galactic latitudes. This could be due to extra star contamination, despite the fact that the main QSO contaminant is expected to be compact galaxies. Otherwise, the gradient might be due to some inaccuracy in our dust extinction correction.

(a) VST-ATLAS tile density (deg−2) for |$z$|photo < 2.2 QSO candidates in the NGC. (b) VST-ATLAS tile density (deg−2) for |$z$|photo < 2.2 QSO candidates in the SGC.
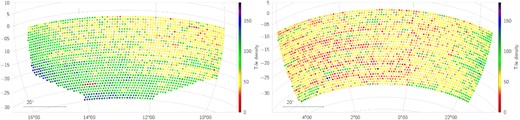
(a) VST-ATLAS tile density (deg−2) for |$z$|photo > 2.2 QSO candidates in the NGC. (b) VST-ATLAS tile density (deg−2) for |$z$|photo > 2.2 QSO candidates in the SGC.
8 CONCLUSIONS
The main aim of this paper was to present the VST-ATLAS QSO catalogue. We initially followed the photometric QSO selection work of Chehade et al. (2016) who used early VST ATLAS ugriz data, combining it with AllWISE W1 and W2 survey data. These data sets differ from those of Chehade et al. (2016) in that the sky coverage of ATLAS is now complete over its ≈4700 deg2 and also in the depth of the u-band which generally has 240s exposure, 2 × more than Chehade et al. (2016) mainly by virtue of the ATLAS Chilean Survey (ACE, Barrientos et al, in preparation). In addition to the VST ATLAS ugriz photometry we have also replaced AllWISE with the WISE 6 yr neo6 W1 and W2 MIR data (Meisner et al. 2021) that has 6 × the 1 yr exposure time of AllWISE. The neo6 W1 and W2 bands thus reach ≈1 mag fainter than the AllWISE survey data used by Chehade et al. (2016). We have also almost completed the DES u Chile Extension (DEUCE) which provides u-band coverage to similar depth over a further 2800 deg2 of the DES survey, which will allow full ugrizW1W2 photometry over the full ≈7500 deg2 of the 4MOST Cosmology Redshift Survey (4CRS).
Here, we first used higher signal-noise WHDF ugri and SpiES W1, W2 data (Timlin et al. 2016) to establish the potential QSO sky density available to g = 22.5. WHDF has the benefit of a 75 ks Chandra exposure to help us assess what the eROSITA X-ray data might add to the 4CRS survey, in terms of further increasing the QSO sky density. We also determined that the inclusion of objects that have been morphologically classed as extended sources and with QSO ugriW1W2 colours, provided the most complete QSO catalogue. Some of these sources are confirmed as extended sources even at HST 0|${^{\prime\prime}_{.}}$|1 resolution due to host galaxy contributions and gravitational lensing. Overall, WHDF data suggested that to g < 22.5 a QSO sky density of ≈269 ± 67 deg−2 was in principle available when X-ray and optically extended sources are included.
8.1 QSO statistics in the full ATLAS catalogue
Armed with the lessons learned from these analyses, we applied our selections to VST ATLAS ugri data, complemented by the W1 and W2 bands from the unWISE neo6 data release. We then suitably adjusted the cuts for ATLAS’s less accurate photometry. This resulted in the full VST ATLAS QSO catalogue containing ≈1.2 million QSO candidates with a sky density of ≈259 deg−2.
Despite the WHDF results suggesting that grW selections were the most complete, for VST ATLAS we still found improved efficiency and completeness when u band selections were included. The reason is that at VST ATLAS depth, despite ATLAS’s excellent sub-arcsecond seeing in g and r, star–galaxy separation gets increasingly unreliable as we approach our g = 22.5 limit. Although the grW selection removes the main Galactic star populations with high efficiency, QSOs occupy the same grW1 locus as late-type galaxies and the more compact of these (NELGs) comprise our main contamination. We note that a W1 − W2 > 0.4 criterion can also reduce galaxy contamination but the neo6 W2 data runs out ≈0.7 mag before our g = 22.5 limit. DESI take advantage of their deeper ‘forced’ W1 and W2 data to eliminate more galaxies. Here, we instead exploit our relatively deep ‘forced’ u data. We demand our candidates pass our joint UVX +grW cuts and similarly our joint grW + non-UVX cuts. This reduces our selected stellar QSO candidate density by ≈60 per cent. If, instead of including the u data, we apply the strict W1 − W2 > 0.4 cut to the grW selection, effectively now demanding a W2 detection for all candidates, the sky density shows a bigger reduction to 147 deg−2. However, in the latter case the completeness compared to DESI also drops from 83 per cent to 78 per cent including a 17 per cent drop in the |$z$| > 2.2 range. So u data appears to most advantage the |$z$| > 2.2 sample in the VST ATLAS survey.
We then used spectroscopically confirmed 2QZ, 2QDESp, SDSS eBOSS, DESI QSOs, and also new, specially commissioned, 2dF observations of ATLAS QSO candidates to test our selections. The latter 2dF results suggest that we shall reach at least >110 deg−2 at |$z$| < 2.2 and >30 deg−2 at |$z$| > 2.2. But note these results assume we apply UVX + grW and non-UVX cuts simultaneously; if only the non-UVX cut was made a significantly lower |$z$| > 2.2 density would be found.
We find a completeness of 70 per cent with respect to confirmed DESI QSOs for our total candidate sample, with an efficiency of 48 per cent. Through comparing with 2QZ, 2QDESp, and eBOSS, we are able to see good completeness of |$\approx 88~{{\ \rm per\ cent}}$|, with the brightest, stellar, ATLAS selections giving |$\approx 97~{{\ \rm per\ cent}}$| completeness.
We performed a g-band number count comparison with the work done by Palanque-Delabrouille et al. (2016). These models are also used by DESI to determine their expected QSO number counts. We find that our observed number counts of 259 deg−2 at g < 22.5 are somewhat higher than the QSO sky density of 195 deg−2 predicted by their PLE+LEDE QSO luminosity function model. However, when the estimated efficiency and incompleteness of our sample is taken into account, the ATLAS QSO counts are expected to be in reasonable agreement with the model, although still lower than the WHDF QSO sky density of ≈269 ± 67 deg−2, given the WHDF’s advantage of having much deeper Chandra X-ray, Spitzer SpiES W1 and W2 and optical data available.
8.2 QSO statistics in ATLAS catalogues split at zphoto = 2.2
Applying the annz2 algorithm of Sadeh et al. (2016) to our final QSO candidate catalogue provided photometric redshift estimates for all catalogue members. The resulting QSO candidate sky density over our full ≈4740 deg2 is 194 deg−2 for the |$z$| < 2.2 ‘tracer’ QSO candidate catalogue and 66 deg−2 for the |$z$| > 2.2 LyA QSO candidate catalogue.
We then estimated the true QSO sky densities for the ATLAS catalogues split at |$z$|photo < 2.2 and |$z$|photo > 2.2, finding true sky densities of 100 deg−2 at |$z$| < 2.2 and 36 deg−2 at |$z$| > 2.2. Adding eROSITA X-ray data will then increase our |$z$| < 2.2 sky density to ≈130 deg−2 with our |$z$|photo > 2.2 sky density remaining at ≈36 deg−2. These estimates ignore the ±0.4 photo-|$z$| error and from Fig. 18 we found that the best trade-off between completeness and efficiency in our high redshift sample is with a cut at |$z$|photo > 1.9. Otherwise, we note that the highest overall completeness coupled with the lowest overall candidate sky density at |$z$| > 2.2 is best achieved via a combined redshift survey of the two photo-|$z$| samples simultaneously where there is no need to incur duplication of targets e.g. in the 1.9 < |$z$|photo < 2.2 range.
8.3 Future applications of the VST ATLAS QSO catalogues
Further improvements to VST ATLAS QSO selection including deeper NEOWISE data and also upcoming eROSITA X-ray data, mean that we are well positioned to exceed our target QSO sky densities of 130 deg−2 at |$z$| < 2.2 and 30 deg−2 at |$z$| > 2.2. Although the ATLAS QSO catalogues already include photometric redshifts that are accurate to σ|$z$| = 0.4, more accurate spectroscopic redshifts will be needed to measure Redshift Space Distortions (RSD) and Baryon Acoustic Oscillation (BAO) scales from QSO and Lyman α forest clustering to make the most accurate measurements of cosmological parameters.
This ATLAS QSO catalogue will therefore ultimately be used as a basis for the QSO component of the 4MOST Cosmology Redshift Survey. With the addition of the DES area, this 4CRS QSO redshift survey will cover 7500 deg2 of sky with a QSO target sky density of 240 deg−2. The 4MOST eROSITA AGN survey will also cover most of this area and contribute ≈55 deg−2 or ≈40 per cent of the target |$z$| < 2.2 ‘tracer’ QSO sky density of ≈130 deg−2. Thus by combining the ATLAS optical/MIR and eROSITA X-ray QSO surveys, we can produce a QSO redshift survey that is highly competitive for cosmology at a much reduced cost. As well as providing high-quality BAO and RSD measurements out to |$z$| ≈ 3.5, the 4MOST QSO redshift survey will also give vital support to DES and LSST galaxy weak lensing analyses at lower redshift (|$z\lesssim 1$|) by constraining the crucial redshift distribution of the lensed galaxies via QSO-galaxy cross-clustering.
Meanwhile, in advance of 4CRS, in Paper II (Eltvedt et al, in preparation) we shall exploit the current ATLAS QSO photo-z catalogue to measure QSO lensing magnification by foreground galaxies as well as galaxy clusters from the VST ATLAS Galaxy Cluster Catalogue I (Ansarinejad et al. 2023) using the cross-correlation technique. We shall also similarly report on measuring the magnification of Cosmic Microwave Background fluctuations lensed by the QSOs themselves and combine all of these results to make new estimates of cosmological parameters.
Acknowledgement
We acknowledge use of the European Southern Observatory (ESO) VLT Survey Telescope (VST) ATLAS. The ATLAS survey is based on data products from observations made with ESO Telescopes at the La Silla Paranal Observatory under program ID 177.A-3011(A,B,C,D,E.F,G,H,I,J,K,L,M,N) (see Shanks et al. 2015).
We acknowledge the use of data products from WISE, which is a joint project of the University of California, Los Angeles, and the Jet Propulsion Laboratory (JPL)/California Institute of Technology (Caltech), funded by the National Aeronautics and Space Administration (NASA), and from NEOWISE, which is a JPL/Caltech project funded by NASA.
We acknowledge the use of SPIES survey observations made with the Spitzer Space Telescope, which is operated by the Jet Propulsion Laboratory, California Institute of Technology under a contract with NASA.
We acknowledge use of SDSS imaging and spectroscopic data. Funding for SDSS-III has been provided by the Alfred P. Sloan Foundation, the Participating Institutions, the National Science Foundation and the U.S. Department of Energy Office of Science.
We further acknowledge use of the DESI Guadalupe spectroscopic data which will be released in DR1. DESI is supported by the Director, Office of Science, Office of High Energy Physics of the U.S. Department of Energy under Contract No. DE-AC02-05CH11231, and by the National Energy Research Scientific Computing Center, a DOE Office of Science User Facility under the same contract; additional support for DESI is provided by the U.S. National Science Foundation, Division of Astronomical Sciences under Contract No. AST-0950945 to the NSF’s National Optical-Infrared Astronomy Research Laboratory; the Science and Technologies Facilities Council of the United Kingdom; the Gordon and Betty Moore Foundation; the Heising-Simons Foundation; the French Alternative Energies and Atomic Energy Commission (CEA); the National Council of Science and Technology of Mexico; the Ministry of Economy of Spain, and by the DESI Member Institutions.
We thank all staff at the Anglo-Australian Telescope (AAT) for their assistance with observations using the 2dF+AAOmega instruments. We thank OPTICON and ATAC for their financial support of our AAT observations.
B. Ansarinejad acknowledges support from the Australian Research Council’s Discovery Projects scheme (DP200101068).
L. F. Barrientos acknowledges support from ANID BASAL project FB210003.
We finally acknowledge Science and Technology Facilities Council (STFC) Consolidated Grant ST/T000244/1 in supporting this research.
For the purpose of open access, the author has applied a Creative Commons Attribution (CC BY) licence to any Author Accepted Manuscript version arising.
DATA AVAILABILITY STATEMENT
The ESO VST ATLAS, WISE, and Spitzer SPIES data we have used are all publicly available. In the case of the DESI data used here, this will be made publicly available via the regular public data releases scheduled by the DESI collaboration. All other data relevant to this publication will be supplied on request to the authors. The VST ATLAS QSO Catalogue can be found at https://astro.dur.ac.uk/cea/vstatlas/qso_catalogue/.
Footnotes
WHDFCH099 and WHDFCH113 have |$S_X(0.5-10\, {\rm keV})\lt 1\times 10^{-14}$| ergs cm−2 s−1.
Note that the |$z$| = 2.68 DESI QSO (ID 8222 in Table A2) is found to be a double object in deep WHDF H-band imaging with 0|${^{\prime\prime}_{.}}$|9 seeing.
gA3 is the g magnitude measured within a 1 arcsec radius aperture.
We also note the presence of small offsets in both g and r – these are of the order of a few hundredths of a magnitude, and are due in part to small colour terms between the DECaLS and ATLAS passbands.
References
APPENDIX A: WHDF X-RAY AND DESI QSOS
Here we list the QSO contents of the WHDF from the Chandra X-ray source list of Bielby et al. (2012) in Table A1 and from preliminary DESI QSO redshift survey data in Table A2.
Full colour, morphology, and redshift information for the 15 X-ray QSOs from Bielby et al. (2012) found in the WHDF. X-ray absorbed QSOs are bolded. (D) in second column indicates also detected by DESI (see Table A2). The ugriz magnitudes come from the SDSS Stripe 82 data, the W1 and W2 fluxes are from Timlin et al. (2016), and the X-ray fluxes are from Vallbé Mumbrú (2004).
| ID | Morphology | u | g | r | i | z | W1 | W2 | SX(0.5 − 10) | Redshift |
|---|---|---|---|---|---|---|---|---|---|---|
| WHDFCH005 | star | 21.19 | 20.83 | 20.86 | 20.61 | 20.56 | 16.47 | 15.58 | 5.62 × 10⁻¹⁴ | 0.52 |
| WHDFCH007 | galaxy | 23.73 | 23.22 | 22.88 | 22.27 | 21.87 | 15.98 | 15.14 | 1.17 × 10⁻¹⁴ | 1.33 |
| WHDFCH008 | galaxy | 23.84 | 24.00 | 24.01 | 23.38 | 22.32 | 17.14 | 16.42 | 3.62 × 10⁻¹⁵ | 2.12 |
| WHDFCH016 | star (D) | 20.95 | 20.67 | 20.61 | 20.34 | 20.29 | 17.20 | 16.15 | 1.44 × 10⁻¹⁴ | 1.73 |
| WHDFCH017 | star (D) | 20.24 | 20.04 | 19.85 | 19.60 | 19.11 | 15.12 | 14.54 | 3.22 × 10⁻¹³ | 0.40 |
| WHDFCH020 | galaxy | 22.34 | 22.05 | 21.67 | 21.35 | 20.86 | 16.50 | 16.15 | 1.09 × 10⁻¹⁴ | 0.95 |
| WHDFCH036 | star (D) | 22.14 | 21.62 | 21.68 | 21.46 | 21.00 | 16.18 | 15.56 | 6.26 × 10⁻¹⁴ | 0.83 |
| WHDFCH044 | star (D) | 22.73 | 21.84 | 20.49 | 19.83 | 19.14 | 13.54 | 12.55 | 2.66 × 10⁻¹⁴ | 0.79 |
| WHDFCH048 | galaxy (D) | 23.16 | 22.57 | 22.13 | 21.67 | 21.76 | 16.30 | 15.42 | 2.15 × 10⁻¹⁴ | 1.52 |
| WHDFCH055 | star | 23.65 | 22.28 | 21.73 | 21.15 | 20.60 | 16.26 | 15.97 | 2.17 × 10⁻¹⁴ | 0.74 |
| WHDFCH090 | star (D) | 21.07 | 21.03 | 20.62 | 20.72 | 20.76 | 16.26 | 15.47 | 4.83 × 10⁻¹⁴ | 1.32 |
| WHDFCH099 | star (D) | 20.52 | 20.34 | 20.25 | 20.23 | 20.00 | 15.58 | 14.96 | 8.84 × 10⁻¹⁵ | 0.82 |
| WHDFCH109 | star | 18.39 | 18.07 | 18.14 | 18.00 | 18.13 | 13.80 | 12.95 | 6.69 × 10⁻¹⁴ | 0.57 |
| WHDFCH110 | galaxy | 22.73 | 21.91 | 21.22 | 20.59 | 19.95 | 15.50 | 15.42 | 2.20 × 10⁻¹⁴ | 0.82 |
| WHDFCH113 | star (D) | 22.19 | 21.56 | 21.51 | 21.59 | 21.44 | 18.30 | 17.47 | 5.99 × 10⁻¹⁵ | 2.54 |
Photometric, morphological, and redshift information for the 13 QSOs from DESI in the WHDF. In the first column, bracketed names are those for DESI sources detected in Chandra X-rays at >3σ by Vallbé Mumbrú (2004) but not listed by Bielby et al. (2012). In second column, (X) indicates also listed as an X-ray QSO by Bielby et al. (2012) (see Table A1); Column 10: (–) indicates no X-ray detection at 3σ. All other fluxes not listed by Bielby et al. (2012) are from Vallbé Mumbrú (2004). We note that the DESI data used here is preliminary and subject to change in final, public, DESI data releases.
| WHDF ID | Morphology | u | g | r | i | z | W1 | W2 | SX(0.5 − 10) | Redshift |
|---|---|---|---|---|---|---|---|---|---|---|
| 1109 | star | 24.94 | 22.45 | 22.23 | 22.06 | 22.14 | 17.84 | 17.27 | – | 3.087 |
| 3630 | star (X) | 21.07 | 21.03 | 20.62 | 20.72 | 20.76 | 16.26 | 15.47 | 4.83 × 10⁻¹⁴ | 1.334 |
| 2779 (WHDFCH038) | star | 23.47 | 21.26 | 21.05 | 21.11 | 21.24 | 19.00 | 17.68 | 6.30 × 10⁻¹⁵ | 3.138 |
| 8222 (WHDFCH014) | galaxy | 23.22 | 22.34 | 21.96 | 21.82 | 21.46 | 17.24 | 16.68 | 7.10 × 10⁻¹⁵ | 2.679 |
| 254 | star | 24.47 | 22.70 | 21.83 | 21.69 | 21.48 | 17.68 | 16.36 | – | 2.593 |
| 5964 | star (X) | 20.24 | 20.04 | 19.85 | 19.60 | 19.11 | 15.12 | 14.54 | 3.22 × 10⁻¹³ | 0.397 |
| 10665 | star (X) | 22.73 | 21.84 | 20.49 | 19.83 | 19.14 | 13.54 | 12.55 | 2.66 × 10⁻¹⁴ | 0.799 |
| 8779 | star (X) | 22.19 | 21.56 | 21.51 | 21.59 | 21.44 | 18.30 | 17.47 | 5.99 × 10⁻¹⁵ | 2.544 |
| 14697 | galaxy (X) | 23.16 | 22.57 | 22.13 | 21.67 | 21.76 | 16.30 | 15.42 | 2.15 × 10⁻¹⁴ | 1.539 |
| 14428 | star (X) | 22.14 | 21.62 | 21.68 | 21.46 | 21.00 | 16.18 | 15.56 | 6.26 × 10⁻¹⁴ | 0.833 |
| 11642 | star (X) | 20.52 | 20.34 | 20.25 | 20.23 | 20.00 | 15.58 | 14.96 | 8.84 × 10⁻¹⁵ | 0.820 |
| 5971 | star (X) | 20.95 | 20.67 | 20.61 | 20.34 | 20.29 | 17.20 | 16.15 | 1.44 × 10⁻¹⁴ | 1.753 |
| 3081 (WHDFCH052) | galaxy | 21.77 | 21.73 | 21.56 | 21.62 | 21.66 | 17.26 | 16.59 | 1.20 × 10⁻¹⁴ | 1.306 |
