


ABSTRACT
Synoptic maps of Ca II K-normalized intensity at ±40° latitude belt from Carrington rotations 827 (1915 August 10) to 1764 (1985 July 7) are utilized to investigate the long-term variation of the quiet chromospheric differential rotation within solar activity cycles through removing some large values of Ca II-normalized intensity. The equatorial rotation rate of the quiet chromosphere is found to be smaller than that of the chromosphere, and the absolute value of the parameter B is also found to be smaller for the quiet chromosphere than for the chromosphere on the whole, especially during periods of solar cycle maxima. Therefore, we induce that the differential of rotation rate in the quiet chromosphere seems to be enhanced by large-scale magnetic fields. The north–south asymmetry in the solar rotation is also investigated, and the asymmetry coefficients of the chromosphere and the quiet chromosphere are positively correlated in solar cycles 15–17, while they are negatively correlated in solar cycles 18–21.
1 INTRODUCTION
The interaction of the Sun’s differential rotation and magnetic field plays a fundamental role in the generation of all solar activities (Babcock 1961; Javaraiah, Bertello & Ulrich 2005). The solar chromosphere is a vital conduit for mass and energy transfer between the dense ∼6000 K photosphere and the rarefied million-degree corona, which has a complicated magnetic structure (Gary 2001; Louis et al. 2021). To investigate the rotation of the solar chromosphere, the Ca II K line, which forms in the lower chromosphere from 900 to 1700 km, is a good diagnostic tool. The intensity observed with the Ca II K line is related to magnetic field strength, and the location of the stronger magnetic field is associated with the brighter regions of Ca II K line intensity, so it is also a good proxy for Sun’s magnetic flux density (Schrijver et al. 1989; Foukal et al. 2006; Pevtsov et al. 2016; Bertello, Pevtsov & Ulrich 2020; Chowdhury et al. 2022). Information on the chromospheric rotation, and its variation with latitude and solar cycle, is valuable for constraining solar dynamo models.
Most previous studies of the chromospheric differential rotation have focused on determining the rotation rate of the chromosphere and comparing it with the rotation of other solar layers. A long time ago, Hale (1908) obtained the chromospheric rotation rate by studying the rotation of plages and faculae and found that the results are consistent with sunspots or surface magnetic fields. Livingston (1969) found that the rotation rate of the chromosphere obtained by Hα spectroscopic observation is about 3 per cent faster than that of the photosphere, and the differential degree of rotation rate in the chromosphere seems to be smaller than that of the photosphere. Schroeter & Woehl (1975) and Schroeter et al. (1978) found that the rotation rates obtained by the quiet background network emission pattern in the Ca II K line are in close agreement with those of small sunspots and 5 per cent higher than that of the photosphere. Belvedere et al. (1977) reported that large evolved chromospheric plages rotate more rigidly than the smaller ones. Antonucci et al. (1979) found that short-lived chromospheric features rotate at the same rate as the chromospheric plasma and rotate faster than the photospheric plasma. Sime, Fisher & Altrock (1989) reported that the Fe XIV green line corona rotates less differentially than the photospheric and chromospheric features. Pap, Tobiska & Bouwer (1990) suggested that the rotation period of the coronal X-rays is longer than that of the chromospheric Mg II lines and the photospheric layer. In recent years, Li et al. (2019, 2020) found that both the chromosphere and the quiet chromosphere rotate faster than the quiet photosphere.
However, few authors paid attention to studying the relationship between the chromospheric differential rotation and solar cycles. Singh & Prabhu (1985) used the data of daily calcium plage areas during the period of 1951–1981 (which includes solar cycles 19 and 20) to derive the rotation period of the chromosphere; they found that the rotation rate of the chromosphere varies not only with the solar activity cycle but also on shorter time scales, among which the most stable seems to be around 2 and 7 years. Ternullo (1986) found that the rotation rates of the chromospheric layer depend on the solar cycle phase. Worden, White & Woods (1998) used the intensity contrast technique to study the rotational modulation and solar cycle variations in the chromosphere, and found that the plage time series show a strong 27-day rotational modulation. In recent years, Li & Feng (2020) analysed synoptic maps of He I intensity in the quiet chromosphere, and found that it presents a slight negative correlation with the magnetic field on the whole. Xu, Gao & Shi (2020) found that the time-varying rotational period length of the chromosphere shows a declining trend during the last four solar cycles, presumably due to a decreasing strength of solar activity. This topic is not yet fully understood, thus more research is needed.
To further understand the differential rotation of the quiet chromosphere, as well as to investigate its dependence on the solar cycle, we utilized the database from the Mount Wilson Observatory, which contains 938 Carrington synoptic maps of the chromospheric Ca II K line intensity from Carrington rotation (CR) 827 (1915 August 10) to 1764 (1985 July 7), spanning nearly seven solar cycles (Bertello et al. 2020). In the next section, we briefly describe the data and methods. Then, we present the results of our investigation in Section 3, and in Section 4 we draw a brief discussion and conclusion.
2 DATA AND METHODS
2.1 Data
The data used in this study are the original synoptic maps of the chromospheric resonance line Ca II K (393.367 nm) normalized intensity from CR 827 (1915 August 10) to 1764 (1985 July 7), 938 synoptic maps in total observed at the Mount Wilson Observatory (Foukal & Milano 2001; Bertello, Ulrich & Boyden 2010; Pevtsov et al. 2016; Bertello et al. 2020). The intensity values were normalized over the entire data set by Bertello et al. (2020). They can be acquired from the website https://doi.org/10.7910/DVN/RQSEJ8. Each synoptic map consists of the latitude-versus-longitude grid of 180 × 360, where 180 corresponds to the equidistant values of sin (latitude) from −1 (the southern pole) to 1 (the northern pole), and 360 corresponds to equidistant longitudes from 1° to 360° (Bertello et al. 2014, 2020).
The top panel of Fig. 1 shows the original temporal-latitudinal distribution of Ca II K-normalized intensity, spanning seven solar cycles (from cycle 15 to cycle 21). In this panel, we can see that there are seven butterfly patterns at ±40° latitude belt, whose intensity values are distinctly greater than those of the background quiet chromosphere. To obtain the quiet chromosphere, it is very necessary to remove large intensity values from these synoptic maps. The statistical results show that the maximum intensity value is about 7.79, the median is 1.02, and the number of intensity values less than 1.10 accounts for 88.33 per cent of the total intensity values. Those with intensities greater than 1.10 may come from the active chromosphere, while the rest are considered to come from the quiet chromosphere. If the intensity value is small, many bright spots outside the active region will be deducted, which will have a small impact on the measurement of rotation. Larger intensity value, such as 1.15, will not affect the results. If it continues to be larger, some data in the active region will be brought in. Therefore, we choose the intensity value 1.1 as the best threshold. After removing the active chromosphere (butterfly patterns) with an intensity value greater than 1.10 from these synoptic maps, the remaining small intensity values represent the quiet chromosphere, which is displayed in the bottom panel of Fig. 1.
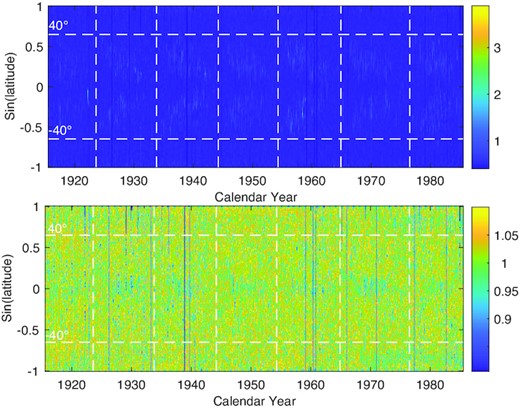
Top panel: the original Ca II K-normalized intensity as a function of latitude and time for the period 1915 August 10 to 1985 July 7 (CR827–CR1764). Bottom panel: the Ca II K-normalized intensity whose intensity values are less than 1.10 as a function of latitude and time in the considered time interval. The two horizontal white dashed lines show the latitudes of ±40°, and the vertical white dashed lines represent the minima of solar cycles.
To investigate the long-term characteristics of rotation parameters and its hemispheric asymmetry of the quiet chromosphere with solar activity cycles, we use the annual mean sunspot number (version 2, http://sidc.oma.be) to characterize the variability of solar activity, and the asymmetry of sunspot area in the northern and southern hemispheres (http://solarcyclescience.com/activeregions.html) is used to represent the asymmetry of solar activity. For a more detailed description of the sunspot data, we can see the previous work of Wan & Gao (2022).
2.2 Methods
The autocorrelation method has proven to be very useful in identifying any prominent periodic signals present in time series (Chandra, Vats & Iyer 2010). Hansen, Hansen & Loomis (1969) was the first one to use this method to determine synodic rotation period. Since then, more and more researchers applied this method to analyse the rotation period of a time series (Hansen et al. 1969; Stimets & Londono 1982; Vats et al. 1998, 2001; Chandra, Vats & Iyer 2009; Vats & Chandra 2011; Xu & Gao 2016; Li et al. 2019; Xiang, Ning & Li 2020; Sharma et al. 2020, 2021), and here we also use this method to do so. Details of the process of determining the rotation period can be found in the Data and Methods section of the work by Wan & Gao (2022). Fig. 2 displays the calculation results of autocorrelation coefficient (CC) for a certain year obtained at four different latitudes.
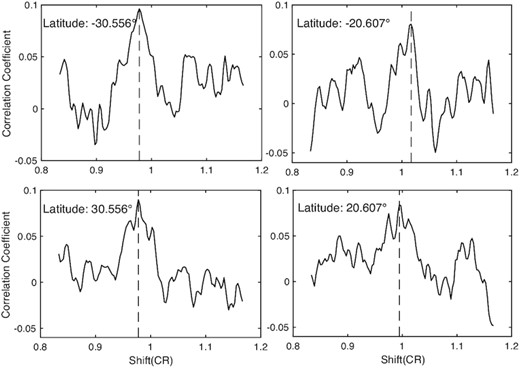
Autocorrelation coefficient (CC) of one time series of the quiet chromosphere Ca II K line intensity at a certain latitude in a certain year, varying with its relative phase shift. The four panels correspond to four different time series, whose latitudes are displayed at the top-left corner of each panel. The dashed vertical line in each panel represents the local maximum CC, and the abscissa value is the Carrington synodic rotation period (CR).
Generally, active regions are within 40 degrees. To highlight the impact of active regions and keep consistent with the work of Wan & Gao (2022), we only used the data at ±40° latitude belt. Finally, we get 118 rotation periods at 118 measured latitudes within ±40° latitude belt in each year. In Fig. 2, the rotation period is the CR, which is 27.275 days, and its corresponding rotation rate is 360°/(27.275 days), namely 13.199 (deg day−1). After the synodic rotation period (P) of a series is obtained, the rotation rate (R) of a certain latitude in a certain year is obtained as: R = P × 13.199 (deg day−1) (Shi & Xie 2013; Xie, Shi & Xu 2017; Li et al. 2019; Deng et al. 2020)).
3 RESULTS
Fig. 3 shows the long-term variation of parameters A and B with solar activity cycles. By investigating the relationship between the parameter A and the annual mean sunspot numbers, we find that there is a statistically insignificant positive correlation, and the correlation coefficient is 0.05. The parameter B has a weak negative correlation with the annual mean sunspot numbers, and the correlation coefficient is −0.18, which is statistically insignificant. In our previous work of Wan & Gao (2022), we found that there is a significant negative correlation between the level of solar activity and the parameter B of the chromosphere. However, this negative correlation is diminished in the quiet chromosphere. The main reason is that the negative correlation is mainly generated by large-scale magnetic fields, and it will be weakened by the elimination of large-scale magnetic fields.
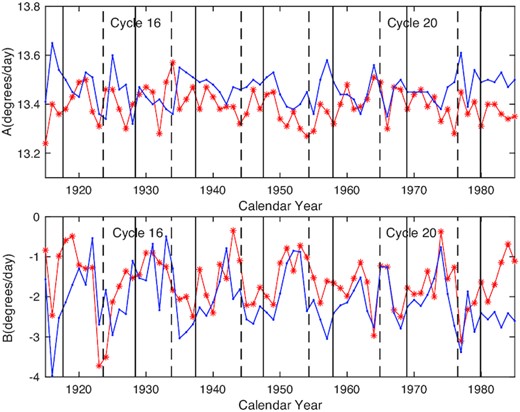
Top/bottom panels: Comparison of our study (the red star line) on the long-term variation of the parameter A/B with the work of Wan & Gao (2022) (the blue dotted line) during solar cycles 15–21, respectively. In all panels, the black vertical dashed/solid lines indicate the minimum/maximum years of solar cycles.
Fig. 3 also shows a detailed comparison between the long-term variation of parameters A and B of the quiet chromosphere and those of the chromosphere in the work of Wan & Gao (2022). As we can see from the figure, the equatorial rotation rate of the quiet chromosphere is smaller than that of the chromosphere, and we infer that this is because sunspots rotate quickly at lower latitudes. The absolute value of the parameter B is generally smaller for the quiet chromosphere than for the chromosphere, especially during periods of solar cycle maxima. Therefore, we induce that the differential of rotation rate is enhanced by large-scale magnetic fields.
Fig. 4 shows the annual rotation rate of the quiet chromosphere given by the second-order polynomial of differential rotation as a function of latitude and time in the considered time interval. It can be seen that rotation rates have a clear migration characteristic in a solar cycle.
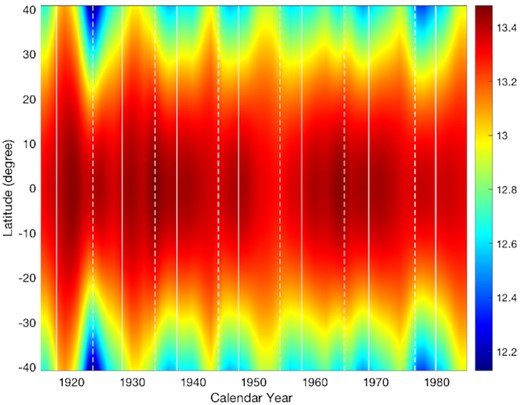
The annual rotation rate of the quiet chromosphere is given by the second-order polynomial of differential rotation as a function of latitude and time in the considered time interval. The rotation rate indicated by the colour bar and the unit is deg day−1. The white vertical dashed/solid lines represent the minimum/maximum years of solar cycles, respectively.
Fig. 5 shows four isopleth lines of rotation rates, and their corresponding rotation rates are 13.25, 13.15, 13.05, and 12.95 (deg day−1) from low to high latitudes. As shown in the figure, the migration of rotation rates seems to be thwarted during the decreasing phase of the solar cycle, which is in great contrast to the oscillation pattern of solar surface differential rotation (Snodgrass 1987; Li, Xie & Shi 2013a). Comparing it with the work of Wan & Gao (2022), we find that the migration of rotation rates of the quiet chromosphere from the equator towards the poles is relatively more obstructed than the chromosphere. The isopleth lines of the quiet chromospheric rotation rates are further apart towards the poles than those of the chromosphere, indicating that rotation rates of the quiet chromosphere decrease more slowly towards the poles; in other words, the absolute value of the parameter B in the quiet chromosphere is smaller than that of the chromosphere, which also indicates that the differential of rotation rate is enhanced by large-scale magnetic fields. Therefore, rotation rates of the quiet chromosphere are generally greater than that of the chromosphere at the same latitude.
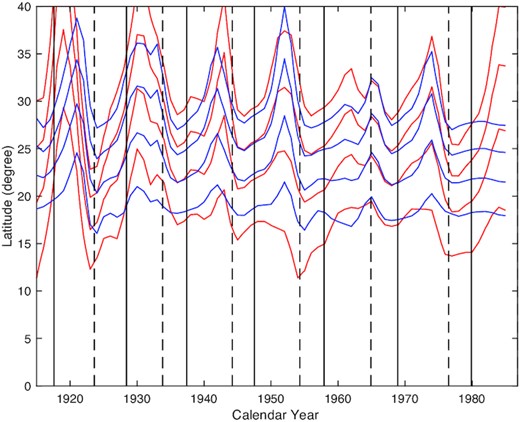
Comparison of our study on isopleth lines (red solid lines) of rotation rates with the work of Wan & Gao (2022) (blue solid lines). The corresponding rotation rates are 13.25, 13.15, 13.05, and 12.95 (deg day−1) from low to high latitudes. The vertical dashed/solid lines represent the minimum/maximum years of solar cycles.
Fig. 6 shows the parameter B changing on different phases of a solar cycle, and their corresponding standard errors. By calculating the mean value of the parameter B for all considered time frame within the same solar cycle phase relative to the nearest sunspot minimum/maximum, we obtain the dependence of the parameter B on the phase of the solar cycle. From the figure, we can see that the parameter B of the quiet chromosphere changes little during the ascending phase of a solar cycle. Comparing it with the work of Wan & Gao (2022), we find that the absolute value of the parameter B is generally smaller for the quiet chromosphere than for the chromosphere, especially during periods of solar cycle maxima, which also indicates that the differential of rotation rate is enhanced by large-scale magnetic fields. Therefore, we infer that the differential degree of the quiet chromosphere is smaller than that of the chromosphere, and correspondingly, the quiet chromosphere rotates faster than the chromopshere at ±40° latitude belt.
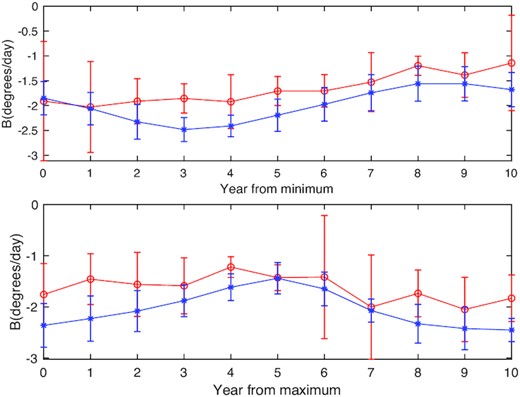
Top/bottom panels: Comparison of our study (the red solid line) on the mean value of the parameter B (the red solid line) depends on the phase of the solar cycle according to the years relative to the nearest sunspot minimum/maximum, and their corresponding standard error with the work of Wan & Gao (2022) (the blue solid line).
Fig. 7 shows the variation of the north–south (N-S) asymmetry coefficients of rotation rates with solar cycles. To investigate the relationship between the N–S asymmetry of the quiet chromospheric rotation rate and solar activities, we perform a correlation analysis and find a weak positive correlation between them. However, the correlation coefficient is 0.21, which is not statistically significant. We have also studied the relationship between the N–S asymmetry of the quiet chromospheric rotation rates and that of the chromospheric rotation rates. From Fig. 7, we find that the N–S asymmetry of the quiet chromosphere and the chromosphere is very different, implying that the hemispheres in which the chromosphere and the quiet chromosphere rotate quickly can be different during a solar cycle. We also find that the asymmetry coefficients of the chromosphere and the quiet chromosphere are positively correlated in solar cycles 15–17, while they are negatively correlated in solar cycles 18–21.
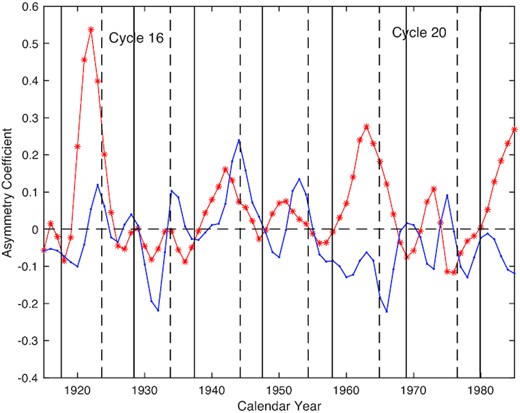
Comparison of our study (the red star line) on the asymmetry coefficient of rotation rates varying with time with the work of Wan & Gao (2022) (the blue dotted line). The black vertical dashed/solid lines indicate the minimum/maximum years of solar cycles.
In the chromosphere, the differential parameter B is negatively correlated with solar cycles, and the asymmetry coefficient of rotation is negatively correlated with the normalized asymmetry index of solar activity (Wan & Gao 2022). However, these negative relations are found to fade away in the quiet chromosphere, indicating that the differential of rotation rate in the quiet chromosphere seems to be strengthened by large-scale magnetic fields.
4 CONCLUSION AND DISCUSSION
In this study, 938 Carrington synoptic images of the chromospheric Ca II K resonance line intensity at the Mount Wilson Observatory from Carrington rotation 827 (1915 August 10) to 1764 (1985 July 7) at ±40° latitude belt are used to investigate the long-term variation of the quiet chromospheric differential rotation with solar activity cycles. To obtain the quiet chromosphere, some large Ca II K intensity values are removed from the original Carrington synoptic images.
By studying the long-term variation of the parameter B (the latitudinal gradient of rotation) for the quiet chromosphere with solar activity cycles, we find that the parameter B has a weak negative correlation with the annual mean sunspot numbers, which is statistically insignificant. The main reason for the weakening of this negative correlation in the quiet chromosphere is that the negative correlation is mainly generated by the large-scale magnetic field activity, and it will be weakened when large-scale magnetic fields are eliminated. Compared it with the work of Wan & Gao (2022) on the chromospheric differential rotation, we find that the parameter A of the quiet chromosphere is smaller than that of the chromosphere. We infer that this is because sunspots rotate quickly at lower latitudes. The absolute value of the parameter B is found to be generally smaller for the quiet chromosphere than for the chromosphere, especially during periods of solar cycle maxima. Therefore, we induce that the differential of rotation rate in the quiet chromosphere is enhanced by large-scale magnetic fields.
The time–latitude distribution characteristics of rotation rates of the quiet chromosphere and the chromosphere are slightly different. we find that rotation rates of the quiet chromosphere decrease more slowly towards the poles; in other words, the absolute value of the parameter B in the quiet chromosphere is smaller, which also indicates that the differential of rotation rate is enhanced by large-scale magnetic fields. Therefore, the quiet chromosphere rotates faster than the chromosphere at the same latitude.
The dependence of the parameter B on different phases of a solar cycle shows that the absolute value of the parameter B is generally smaller for the quiet chromosphere than for the chromosphere, especially during periods of solar cycle maxima. Therefore, we infer that the differential degree of the quiet chromosphere is smaller than that of the chromosphere, and correspondingly, the quiet chromosphere rotates faster than the chromopshere at ±40° latitude belt. To sum up, the differential of rotation rate in the quiet chromosphere at ±40° latitude belt is thus considered to be strengthened by large-scale magnetic fields, in sharp contrast to the effect of large-scale magnetic fields on the differential of the photosphere (Brajša, Ruždjak & Wöhl 2006; Li et al. 2013a; Li et al. 2013b).
Furthermore, the variation of the north–south (N–S) asymmetry coefficients of the quiet chromospheric rotation rates with solar cycles are also investigated. In the chromosphere, the asymmetry coefficient of rotation rates is negatively correlated with the normalized asymmetry index of solar activity (Wan & Gao 2022). However, this negative relation is found to fade away in the quiet chromosphere, which indicates that the differential of rotation rates in the quiet chromosphere seems to be strengthened by large-scale magnetic fields. The asymmetry coefficients of the chromosphere and the quiet chromosphere are found to be positively correlated in solar cycles 15–17, while they are negatively correlated in solar cycles 18–21. This result may just happen mathematically in this way, but it may not have any specific physical meaning. Further research is needed in the future.
ACKNOWLEDGEMENTS
We thank the referee for careful reading of the manuscript and constructive comments that improved the original version of the manuscript. The authors thank Professor Ke-Jun Li for his constructive ideas and helpful suggestions on the manuscript. This work is supported by the National Natural Science Foundation of China (11973085, 11903077, 11803086, and 41964007), the Yunling-Scholar Project (the Yunnan Ten Thousand Talents Plan), the Yunnan Fundamental Research Project (202201AS070042, 202101AT070019, 202101AT070063, and 202001AU070078), the National Project for Large-scale Scientific Facilities (2019YFA0405001), the CAS ‘Light of West China’ Program, and the Chinese Academy of Sciences.
DATA AVAILABILITY
Synoptic maps of Ca II K intensity are used in this study, which are available as public data at the web site: https://doi.org/10.7910/DVN/RQSEJ8. The annual mean sunspot number (version 2) can be publicly downloaded from https://sidc.oma.be. The Greenwich daily sunspot area time series of the northern and southern hemispheres is available from https://solarcyclescience.com/activeregions.html.
