


ABSTRACT
The first directly observed gravitational wave event, GW150914, featuring the merger of two massive black holes, highlighted the need to determine how these systems of compact remnant binaries are formed. We use the binary population synthesis code Compact Object Synthesis and Monte Carlo Investigation Code (COSMIC) to predict the types of massive stars that will show significant radial velocity (RV) variations, indicative of a potential compact object (i.e. a black hole or neutron star) orbiting the star. We ‘observe’ the binaries generated in the populations with a similar number of epochs and RV accuracy as planned for the Milky Way Mapper (MWM) survey. In this analysis, we are especially interested in systems where a compact remnant is orbiting a massive O or B star as these systems survived the first supernova and neutron star kick. We test the ability of the Milky Way Mapper observing strategy to distinguish among different mass-loss and kick prescriptions. We find that Wolf–Rayet stars or hot subdwarfs in binaries could be detectable (i.e. luminous, high ΔRVmax), viable progenitors of such objects, while the different prescriptions primarily affect the number of sources.
1 INTRODUCTION
In 2015, the Laser Interferometer Gravitational Wave Observatory and Virgo (LIGO/Virgo) directly observed gravitational waves (GWs). The GWs were created by a black hole binary merging to form one massive black hole (BH) about 62 times the mass of the Sun (Abbott et al. 2016). Such massive binaries are the strongest GW sources to which LIGO/Virgo is sensitive to and are inherently distinct signals from electromagnetic radiation. Since this first measurement, more detections have been made, including more BH+BH (binary black hole) mergers, two NS+NS (binary neutron star) mergers, and two possible BH + NS mergers (e.g. Abbott et al. 2019; Abbott et al. 2021d, e). The two NS mergers were further confirmed and localized with electromagnetic observations, including short γ-ray bursts (Abbott et al. 2017). So far, one of the surprising discoveries of the GW events detected is the presence of BH+BH mergers where the combined mass greatly exceeds the remnant masses expected from massive star evolution (Abbott et al. 2020b). In particular, Abbott et al. (2021d) found at least three BHs with masses exceeding 45 M⊙.
The formation of BH+BH, NS+NS, and BH+NS systems is therefore of considerable interest for the population of LIGO/Virgo GW sources. The formation of these systems in general, including systems that will not merge on cosmically relevant time scales, is an excellent laboratory for studies of binary populations and binary interactions. Most O stars are in binaries and binary interactions, such as mass stripping are common (e.g. Podsiadlowski, Joss & Hsu 1992; Kobulnicky & Fryer 2007; Sana et al. 2012), showing that the co-evolution of two massive stars adds many new mechanisms that could affect the system. Stars can undergo considerable amounts of mass transfer, both stable and unstable. Stable mass transfer can happen through Roche-lobe overflow or winds (Hurley, Tout & Pols 2002) while unstable mass transfer can initiate a common envelope phase and expulsion of substantial amounts of material from the system, thus reshaping the dynamics of the system. Other mechanisms of co-evolution such as tidal interaction can circularize the orbits of the stars (Hurley et al. 2002). Furthermore, with massive binaries, the threat of disruption in either of the two supernova (SN) kicks is also large, as is seen in observations, as well as disruption due to 50 |${{\ \rm per\ cent}}$| or more total mass-loss of the binary system because of the virial theorem. For example, pulsars can have birth velocities, ascribed to asymmetric SNe collapses, that far exceed the escape velocity of a binary system (e.g. Lyne & Lorimer 1994). Additionally, kicks could also bring about the higher fraction of runaway stars seen in higher mass bodies, an indication that a lot of systems do not survive the first SN (e.g. Stone 1979; Gies & Bolton 1986; Eldridge, Langer & Tout 2011; Renzo et al. 2019). Essentially, to even have any binary system with a NS or BH, many features of binary evolution have to be withstood.
Abbott et al. (2020a), Abbott et al. (2021a), and Abbott et al. (2021c) used the existing GW events to constrain the merging compact binary population, including mass distributions and mass ratios. We can approach the problem the other way, by exploring the properties of the progenitor systems. However, converting a mass distribution of living stars to their compact remnants is not straightforward because of the many factors that influence the evolution of massive stars, including mass-loss and SN kicks (e.g. Giacobbo & Mapelli 2018; Sana et al. 2012). While the dynamical formation of double compact binaries by capture is viable in dense stellar environments (e.g. Zwart & McMillan 2000; Banerjee, Baumgardt & Kroupa 2010; East & Pretorius 2012; Antonini & Rasio 2016), such systems do not produce visible progenitors. In this paper, we focus on isolated binaries, which are believed to contribute substantial numbers of progenitor systems (e.g. Bouffanais et al. 2021).
Historically, finding BHs and NSs in a binary system has been accomplished through detection of X-ray emission due to accretion. However, such a signature requires ongoing mass transfer from the stellar companion through either a strong wind or Roche-lobe overflow and is therefore present for a limited time and for a limited subset of binaries (e.g. Thompson et al. 2019). Pulsars have also been utilized to detect companions in non-interacting binaries (e.g. Yan et al. 2021; Lorimer et al. 2021; Eatough et al. 2021), through the use of radio timing and the eclipsing of such timings due to a companion as well as astrometric microlensing (e.g. Sahu et al. 2022; Lam et al. 2022). Nonetheless, incorporating other methods of observation, such as the measurement of radial velocity (RV) and ellipsoidal variability, we can detect BHs and NSs in binaries that are not interacting and, in some cases, will never interact, with the challenge of separating them from the far larger number of stellar binaries.
The advent of multi-object spectroscopic stellar surveys has made monitoring stars for radial velocities (RV) on an industrial scale a viable prospect. The APOGEE survey (Majewski et al. 2017) observed over 650 000 stars at least three times to identify RV variables, both to eliminate their influence on Galactic kinematic properties (Majewski et al. 2017) and to study them as scientifically interesting objects (e.g. Troup et al. 2016; Badenes et al. 2018). The LAMOST survey is measuring multi-epoch RVs for >105 stars at more than one epoch, using both low-resolution (e.g. Qian et al. 2019) and medium-resolution. Gaia Data Release 2 included ∼107 average RV measurements (Katz et al. 2019); with Data Release 3,1 Gaia has begun releasing data on both astrometric and RV binaries. The SDSS-V Milky Way Mapper (MWM) survey is planning on multi-epoch observations to get millions of spectra (and RVs) of stars throughout the Milky Way. This survey will produce the first densely sampled map of the Milky Way near the generally dust-obscured arms and bulge with its infrared (IR) capabilities. In addition, massive stars will be spectroscopically sampled to a greater extent, providing possible targets for the progenitors of the systems we are interested in throughout this paper (Kollmeier et al. 2017).
Sparse RV data in combination with photometric or astrometric information, especially with the release of GAIA DR3, has already been used to identify BH candidates around lower mass stars (e.g. Gu et al. 2019; Thompson et al. 2019; Liu et al. 2019; Rivinius et al. 2020; Jayasinghe et al. 2021, 2022; Gomel et al. 2022; Andrews, Taggart & Foley 2022; Shahaf et al. 2023; Lennon et al. 2022; El-Badry et al. 2022). Mostly, these groups looked for ellipsoidal variability caused by the tidal distortion of a companion due to a compact remnant with follow-up data to exclude contamination from a close stellar companion. It is also important to note that many of these candidates are being refuted due to other possible scenarios, such as rapidly rotating subgiant companions that make spectral disentangling more challenging (e.g. El-Badry & Quataert 2020; Abdul-Masih et al. 2020; Bodensteiner et al. 2020; El-Badry & Quataert 2021; El-Badry & Burdge 2022; El-Badry et al. 2022; El-Badry, Burdge & Mróz 2022). Essentially, there is extensive literature in searching for these seemingly invisible Galactic BH binaries, but similar data have not yet been obtained for massive stars in these large scale, big data surveys with millions of targets, except for the VLT-Flames Survey of 30 Doradus (Patrick et al. 2019). Therefore, we have a largely incomplete picture of the stages of binary evolution, such as post-common-envelope phases and survival after the first SN. However, studies have been done to show binary properties (including the binary fraction) at the time of SN, giving some insight into binary evolution (e.g. Kochanek 2018; Kochanek, Auchettl & Belczynski 2019; Kochanek 2021).
In this paper, we study the observability of progenitor systems to BH+BH, BH+NS, and NS+NS systems in few-epoch RV surveys of many stars, with a focus on those that merge within 13.7 billion yr. We generate populations of compact binaries using the Compact Object Synthesis and Monte Carlo Investigation Code (COSMIC2; Breivik et al. 2020). We measure the maximum RV change ΔRVmax throughout the evolutionary history for these systems. Badenes et al. (2018) showed that this statistic provides crucial information on the binary population even if complete orbital information is not recovered. In Section 2, we describe the steps used to create a binary population from COSMIC and the methods used to calculate the radial velocities to mimic a few-epoch survey. In Section 3, we analyse the results of a population built using the default COSMIC parameters (e.g. solar metallicity, iron core-collapse SN kicks drawn from a Maxwellian distribution). In Section 4, we analyse the difference in the distribution of the ΔRVmax statistic if we change either the metallicity or the kick prescription to illustrate how observations of progenitor systems can help constrain these parameters.
2 PREDICTING ΔRVMAX FOR PROGENITORS OF COMPACT OBJECT MERGERS
COSMIC is a python-based rapid binary synthesis code that can simulate the BH/NS binaries and their progenitors (Breivik et al. 2020). This code is adapted from Hurley, Pols & Tout (2000a), Hurley et al. (2002) and can trace the evolution of binary systems, including the evolution of the individual stars. In this paper, we used v3.3 of COSMIC to run our populations, and it has since been updated to v3.4.
COSMIC reports the evolutionary states of the two stars in a binary system based on the Hurley et al. (2000a) classifications. We summarize key points here and refer the reader to Hurley et al. (2000a) for additional information. On the Main-Sequence (MS), the underlying BSE code distinguishes between mostly or fully convective stars (MS, <0.7M⊙) and MS stars with appreciable radiative zones (MS, >0.7M⊙) because this modifies the angular momentum loss. The ‘Naked Helium Star’ sequence is the predicted position on the H-R diagram of pure helium stars that have formed from massive stars that have large amounts of mass-loss, either through winds or binary mass transfer. Observationally, these are Wolf–Rayet stars and their descendants or hot subdwarfs (e.g. Götberg et al. 2018).
The default input distributions used by COSMIC represent a reasonable set of choices based on our current knowledge, such as using the binary mass ratios, binary fractions, and the initial mass function (IMF) from Moe & Di Stefano (2017). Further, COSMIC models the physics of binary evolution using current knowledge as well, even though many parameters, such as common envelope efficiency (Regős & Tout 1995), remain uncertain. Nonetheless, these default parameters have been historically used in many binary star evolution (BSE) codes. While we do note that BSE is not perfect, we elect to use the default parameters defined by COSMIC for our initial run.
Part of our discussion focuses on the observable radial velocities for systems that will merge in a Hubble time as BH+BH, BH+NS, or NS+NS binaries and therefore possibly detectable by LIGO/Virgo. While there is a slight inconsistency in our approach of using systems that have merged in a Hubble time to predict the magnitude of RV variations observable now, our goal of understanding the manifestations of such systems should be little affected by this approximation.
2.1 Simulations
We start by generating a binary population using the multidimensional sampler in which COSMIC incorporates parameter distributions given by Moe & Di Stefano (2017). We set the size of the population to be 100 000 and specify the final star types to be NSs or BHs. For the initial binary population, we also use a user-specified star formation history (default):
SF_start = 13 700.0
SF_duration = 0.0
Z = 0.02,
where the start of star formation begins at the time of the Big Bang, lasts for 0.0 Myr, with a binary population metallicity of 0.02. All systems are then followed for a Hubble time. Since we focus on systems with two massive short-lived stars, treating our population as a burst is sufficient to address the questions of the expected RV variability as a function of evolutionary state for massive star binaries.
Once our initial binary population is generated, we evolve the binaries using COSMIC’s evolve class, using the default parameters given by COSMIC. The first line of Table 1 summarizes the outcomes of our population for all 100 000 binary systems.
A summary table of the number of sources in our different populations. ’Non-Mergers’ are simply those systems that do not merge in the amount of time that the user has specified for evolution to occur. In our example, this maximum evolutionary time is the lifetime of the universe. ’Disrupted Binaries’ (a subset of ’Non-Mergers’) include those binary systems that were disrupted only due to a SN, and thus do not merge. ’Stellar Mergers’ refers to systems that merged in various stages of evolution that were not BHs or NSs. While we use ‘stellar’ to describe such systems, the merging progenitors may be a compact object depending on the initial mass (i.e. a star with an initial mass of 15 M⊙ has a short lifetime of only ∼0.017 Myr and thus will have formed a compact remnant in 13.7 Gyr).
| Population | Total # of systems | # BH+BH | # NS+BH | # NS+NS | # Non-mergers | # Disrupted binaries | # Stellar mergers |
|---|---|---|---|---|---|---|---|
| Default | 99 999 | 481 | 198 | 87 | 49 200 | 28 943 | 50 033 |
| Kick = −1 | 100 000 | 512 | 214 | 147 | 42 047 | 18 272 | 57 080 |
| Kick = −2 | 100 000 | 490 | 267 | 141 | 43 329 | 20 312 | 55 773 |
| Kick = −3 | 100 000 | 129 | 68 | 17 | 50 589 | 33 266 | 49 197 |
| Z = 0.01 | 100 000 | 771 | 80 | 118 | 49 753 | 28 735 | 49 278 |
| Z = 0.03 | 99 992 | 0 | 0 | 68 | 48 192 | 27 556 | 51 732 |
2.2 Calculating ΔRVmax
From the output of the simulation, we receive certain properties of each star and binary system, such as the stellar evolutionary phase and orbital parameters, at timesteps when key evolutionary changes occur, such as the beginning or end of Roche-lobe Overflow (RLOF). These timesteps are therefore not equally spaced. Table 2 gives an example of the output of COSMIC for one binary system of our population, which illustrates how COSMIC defines important timesteps. Between each timestep the orbital properties of the system still change, but we only construct a single RV curve for each output timestep. We use the masses of the stars, the eccentricity of the system, the orbital period, and the semimajor axis to calculate the RV curve in two cases:
RV of the primary star when there are two massive living stars. We assume that when there are two living stars that the more massive star will outshine the lower mass star and RV variability of the primary will be detectable in a spectrum of the system; and
RV of the secondary star when there is one living star and one compact remnant (the primary), where there is only one source with detectable RV variability. Throughout this paper, we will continue to refer to the primary star as the initially more massive star, even after it becomes a compact remnant. This means that the primary remains labelled as the primary even after it becomes a compact remnant and is no longer the more massive body.
Example output from COSMIC for parameters we use in this paper for a single binary system in the population that ended with the merging of two BHs. Many more parameters are present in the output of the BPP dataframe in COSMIC.
| tphys | mass_1 | mass_2 | kstar_1 | kstar_2 | sep | porb | ecc | evol_type | bin_num |
|---|---|---|---|---|---|---|---|---|---|
| 0 | 84.0026 | 54.0964 | 1 | 1 | 540.2872 | 123.8551 | 0.5565 | 1 | 26 268 |
| 3.6172 | 48.1447 | 44.2675 | 2 | 1 | 777.1501 | 261.1950 | 0.5493 | 2 | 26 268 |
| 3.6184 | 48.0838 | 44.2693 | 2 | 1 | 350.4608 | 79.1235 | 0 | 3 | 26 268 |
| 3.6219 | 33.9440 | 58.0405 | 4 | 1 | 381.2995 | 89.9734 | 0 | 2 | 26 268 |
| 3.6291 | 18.5094 | 72.9804 | 4 | 1 | 728.6754 | 238.3346 | 0 | 4 | 26 268 |
| 3.6301 | 18.4170 | 72.9962 | 7 | 1 | 728.7640 | 238.4778 | 0 | 2 | 26 268 |
| 4.1944 | 8.4305 | 67.2429 | 8 | 1 | 880.0229 | 347.8096 | 0 | 2 | 26 268 |
| 4.2271 | 8.0506 | 66.9322 | 8 | 1 | 888.1171 | 354.2392 | 0 | 15 | 26 268 |
| 4.2271 | 7.5506 | 66.9322 | 14 | 1 | 894.1193 | 359.0355 | 0.0067 | 2 | 26 268 |
| 5.2997 | 7.5580 | 49.9486 | 14 | 2 | 1155.2845 | 600.1317 | 0.0067 | 2 | 26 268 |
| 5.3026 | 7.5598 | 49.6157 | 14 | 2 | 1153.5129 | 600.4832 | 0 | 3 | 26 268 |
| 5.3026 | 7.5598 | 49.6157 | 14 | 2 | 1153.5129 | 600.4832 | 0 | 7 | 26 268 |
| 5.3026 | 7.5598 | 19.1422 | 14 | 7 | 5.0758 | 0.2565 | 0 | 8 | 26 268 |
| 5.3026 | 7.5598 | 19.1422 | 14 | 7 | 5.0758 | 0.2565 | 0 | 4 | 26 268 |
| 5.8699 | 8.0976 | 8.5117 | 14 | 8 | 6.6323 | 0.4857 | 0 | 2 | 26 268 |
| 5.9021 | 8.1255 | 8.1286 | 14 | 8 | 6.7308 | 0.5020 | 0 | 16 | 26 268 |
| 5.9021 | 8.1255 | 7.6286 | 14 | 14 | 6.9514 | 0.5352 | 0.0317 | 2 | 26 268 |
| 388.3391 | 8.1255 | 7.6286 | 14 | 14 | 8.75E-05 | 2.39E-08 | 0 | 3 | 26 268 |
| 388.3391 | 8.4305 | 15.7541 | 15 | 14 | 0 | 0 | −1 | 6 | 26 268 |
| 13 700 | 0 | 15.7541 | 15 | 14 | 0 | 0 | −1 | 10 | 26 268 |
We next simulate the number of observations and their cadence for a few-epoch RV survey. For each distinct orbit of a given system, we randomly select a starting epoch as well as additional epochs both within a few days and months to years apart utilizing random number generators. This scheme was based on the typical cadences from the APOGEE survey. We select an arbitrary time and add observations based on random draws between 1–20 d and 20 – 500 d. We elected to gather 3 – 4 observations only, to match the number of observations in few-epoch surveys (e.g. Badenes et al. 2018). Fig. 1 shows an example of the sampled RV curve of the system in Table 2 at the highlighted timestep and the spacing of our 3 – 4 observations.
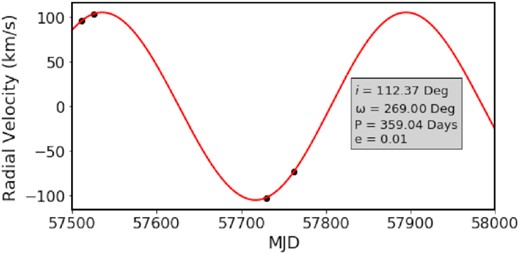
The solid-red line represents the RV curve for the highlighted timestep in Table 2 after 4.23 Myr of evolution. The primary star is now a BH (|$kstar\_1 = 14$|) while the secondary is still a main sequence star (|$kstar\_2 = 1$|). The inclination angle is i = 112.37° and eccentricity is near zero, but not exact. The black points represent our random ‘observations,’ used to calculate ΔRVmax.
3 RESULTS FOR THE DEFAULT POPULATION
For the rest of the paper, we first group binary systems in the population based on the final end states because GW detectors can reliably tell us which type of remnants merged, and then by the evolutionary status of the members at the time of the RV observations. For example, those that end up as BH+BH are further categorized into the group BH+Living Star or into the group Living Star+Living Star. We elect to do such a categorization to connect those end states with early stages that can be detected by RV variability of living stars. The same is applied to BH+NS as well as NS+NS systems.
To illustrate the changes in the binary system that affect its RV, we show in Fig. 2 the evolutionary history of one system that merges as a BH+BH. Both the primary and secondary experience mass-loss, first gradually over the main sequence and then more drastically when RLOF begins. The SN of the primary ejects additional mass from the system and causes the separation to increase markedly. Finally, the onset of the second RLOF phase leads to a common envelope phase and a further decrease in mass accompanied by a large decrease in the separation because of the drag force from the envelope. The secondary becomes a Naked Helium Star as a result of this interaction. The lower total mass and larger separation means that the phase where one member was a BH and the other is not yet evolved to large enough radii to do RLOF has the lowest semi-amplitude. We note that the RLOF and Common Envelope (CE) phases are extremely short-lived and would not be observed as X-ray binaries as a result.
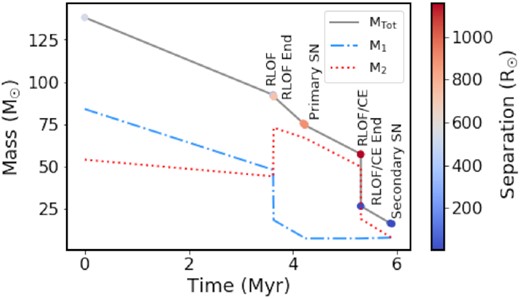
The evolutionary history of a representative merging BH+BH binary system. The grey line shows the total mass of the system up to the death of the secondary while the blue and red lines are the masses of the primary and secondary, respectively. The orbital separation is denoted by the colour bar. Note that ’Primary SN’ and ’Secondary SN’ refer to the formation of the compact objects; COSMIC only includes this in their documentation even though FeCCSN typically produce NSs (and not BHs). (Sukhbold et al. 2016).
3.1 BH+BH mergers
To represent what type of massive stars have a compact remnant orbiting them, we display a bar graph in Fig. 3(a) showing the cumulative time that the secondaries in the BH+BH population spend in each evolutionary state once the primary is a BH and before the secondary dies. We find that the majority of the time, these BHs orbit around Hydrogen MS or Naked Helium (He) MS stars with considerably less time spent around Hertzsprung Gap (HG) stars. This makes physical sense as the core-burning phases are the longest-lived stages in any star’s life cycle. Fig. 4 confirms that the orbital separations between the compact remnants and the secondaries are much greater when the secondaries are on the MS or Hertzsprung Gap than when they are Naked Helium Stars because most of the mass stripping to produce the He star is done in a CE phase.
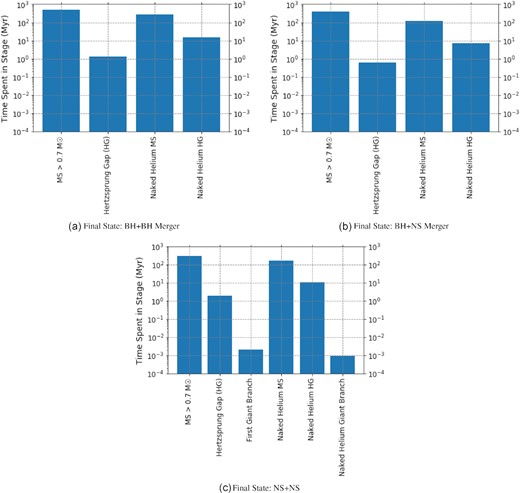
Cumulative time spent in a given, populated (e.g. no BH had a MS star < 0.7 M⊙ or red giant companion) evolutionary state by the secondaries when the primary is a BH or NS. For example, across all 481 BH+BH merging systems, the total time the secondary was a MS star > 0.7 M⊙ was about 500 Myr. The typical amount of time that the secondary star is living (from binary birth to the secondary SNe) are ∼6 Myr, ∼7 Myr, and ∼35 Myr for the BH+BH, BH+NS, and NS+NS mergers, respectively, while merging events take place hundreds of Myr later.
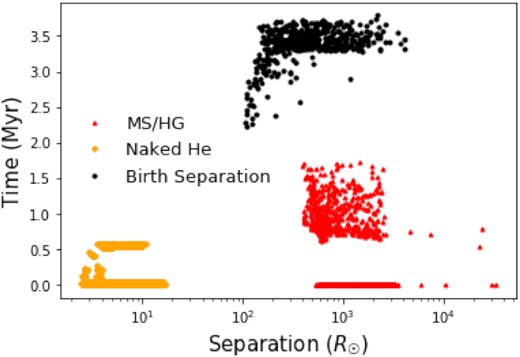
The orbital separations and lifetimes in each evolutionary stage in MYr for binaries producing BH+BH mergers, labelled by their evolutionary phases: group of Naked Helium stars (i.e. MS + Hertzsprung Gap) in orange, regular MS + Hertzsprung Gap stars in red, and the birth separation for all 481 binary systems in black. This allows easy visualization for observing how the separation changes with evolutionary time. Note that the other groups can include data for multiple timesteps while the birth separation strictly looks at the time spent in one specific timestep (the first) of the binary system that will merge as BH+BH. As such, the first timestep will be the longest as both stars are on the MS and interactions have not yet occurred.
For the binaries with MS and Hertzsprung Gap stars, both the separations and the periods, the latter affected by mass-loss from the system, are large. Therefore the radial velocities for the secondaries (the only observable stars) are extremely small (see equation 2). Fig. 5(a) shows the distribution of ΔRVmax for different evolutionary states. In this plot, we find that when the primary is a BH and the secondary is a living star post-common-envelope (Naked Helium MS + Naked Helium Hertzsprung Gap star), there is a shift in the RV towards much higher values. Although the latter phases are short-lived, they have high-RV amplitudes, which will aid in their detection and provide a possible way of observing these non-accreting systems. Not all systems have high ΔRVmax though, because sometimes the limited number of RV measurements were poorly phased or the inclination was high. There is also a gap in the ΔRVmax among the binaries with Naked He companions. This is a result of the evolutionary lifetime of different stages in the Naked He star sequence, and the bottom sequence is mostly composed of short-lived Naked He Hertzsprung Gap stars.
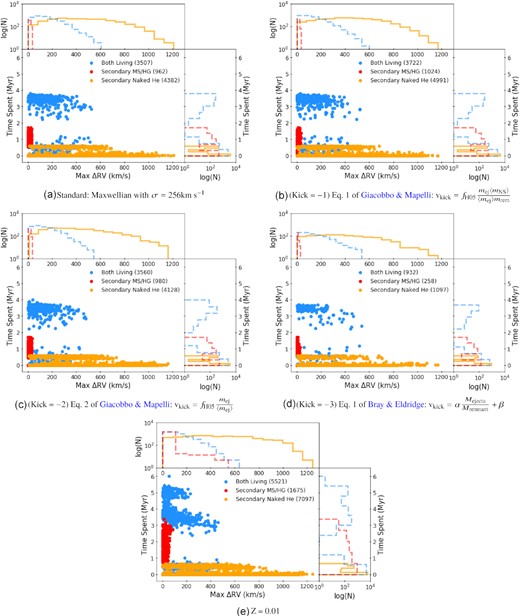
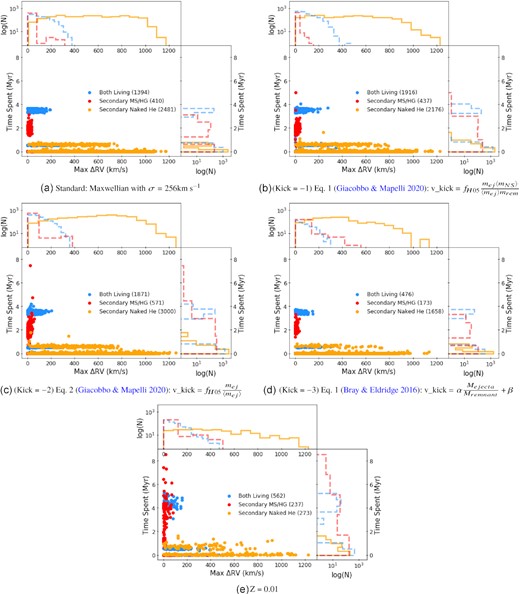
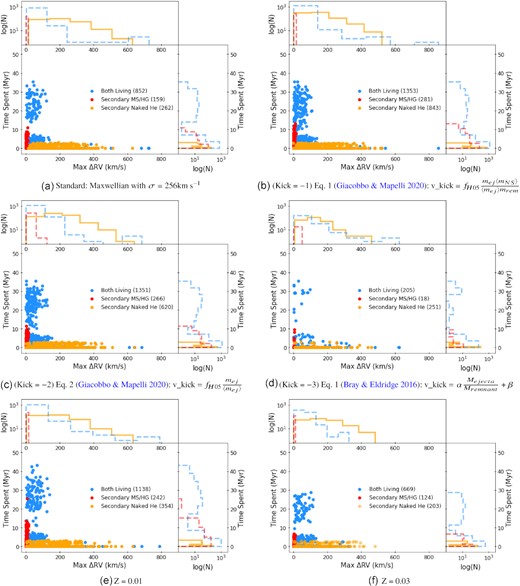
The distribution of ΔRVmax for systems with at least one living star before they end as BH+BH mergers for populations with different kick parameters and metallicities. Blue represents a binary system in which both stars are living, while orange and red represents a system where the primary is a BH. Red points represent MS and Hertzsprung Gap stars (see Fig. 3(a)) while orange is the group of Naked Helium stars. The most obvious effect of changing the metallicity is the predicted absence of BH+BH mergers for the metal-rich population (see Table 1), which is why there is no figure displayed for Z = 0.03. Note that those points close to 0.0 are not all exactly equal to zero. These points are a result of Naked He Hertzsprung Gap star and Naked He MS star with rapid timesteps generated by COSMIC, indicating the start and end of RLOF/CE.
3.2 BH+NS mergers
The progenitors to BH+NS mergers look quite similar to those of the BH+BH mergers, albeit smaller in number. In particular, we see the same evolutionary states of the secondary when the primary is a BH (see Fig. 3(b)) as well as a similar RV shift (Fig. A1(a) in Appendix (A)). The average time before the secondary undergoes core collapse increases from 5.6 Myr (BH+BH) to 6.7 Myr. Overall, the formation and evolution of these mergers are similar to that of BH+BH mergers.
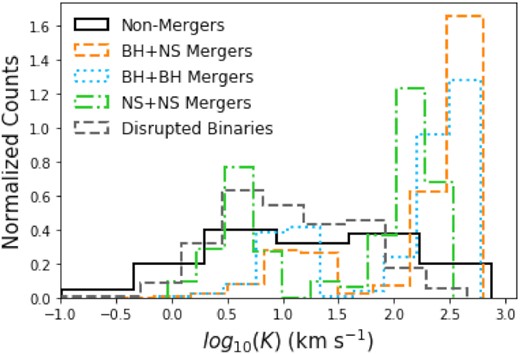
Histograms of the semi-amplitude (K) for all 100 000 binary systems in our default population for each timestep. For the ’Disrupted Binaries,’ we stop calculating the RV of the system after disruption, so these RV values correspond to the still-intact binary system. Note that we cut off the x-axis at –1.0, but there were still some ’Non-Mergers’ below this value, albeit very few. Reference Table 1 for the proper definition of ’Non-Mergers’ and ’Disrupted Binaries.’.
3.3 NS+NS mergers
We do find slightly different results when it comes to NS+NS mergers, because these systems have lower masses and longer lifetimes (∼35 Myr) before the second star collapses than those systems that contain a BH. As a result, we find a wider variety of evolutionary stages for the secondaries, including giant branch stars (i.e. first Giant Branch and Naked Helium star giant branch (Fig. 3(c)). As with the previous two types of binary systems, these compact object binaries, and eventual mergers, experience a RLOF/CE phase bringing the orbital separation to lower values. Fig. A2(a) in Appendix A summarizes the distribution of ΔRVmax for these systems. We note that while there is still an upward shift in the RV seen during the Naked Helium sequence, it is significantly lower in amplitude than the previous BH+NS and BH+BH systems, as expected due to the lower masses (see equation 2).
3.4 Non-mergers
It is important to know how the systems that do not merge differ from the merging systems in the previous section to compare the detectability of these sources. Fig. 6 illustrates that the general population (i.e. those binaries that are disrupted or do not merge) tend to have much smaller semi-amplitudes, and thus smaller radial velocities. The systems that end up disrupted have the lowest semi-amplitudes on average, as their more loosely bound systems lead neither to high speeds nor the ability to survive mass-loss and SN kicks.
We are also interested whether any system, merging or non-merging, can produce BH masses as high as the extremes detected by LIGO/Virgo. Fig. 7 shows the relationship between the total initial mass of a binary system and its total final mass. As expected, the higher the initial mass, the higher the final mass, which tends to produce BH+BH mergers. However, it is clear from this figure that these systems do not produce the most massive LIGO/Virgo sources (>30 M⊙). This could be because the default maximum mass imposed in COSMIC is 150 M⊙, and in combination with mass-loss due to solar-like metallicities as well as pair instability SNe, these systems are simply not created. As noted by Rodriguez et al. (2018), dynamical processes and enhanced interaction rates in clusters may therefore be critical in creating BHs at masses > 50 M⊙, especially in regions that are not low-metallicity as these low-metallicity regions are required to produce the most massive BHs (Belczynski et al. 2010; Vink et al. 2021).
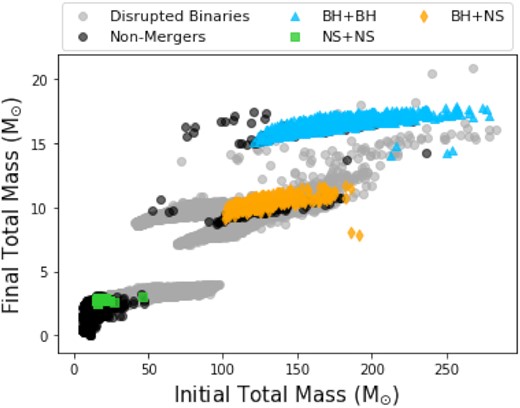
Combined final mass to combined initial mass of each binary system. For those merging systems, this is just the final mass of the remnant. We note that there are some non-mergers that overlap with the BH+BH merger systems in the top concentration.
4 TESTING PARAMETER SPACE
In Section 2.1, we generated a population with COSMIC using all of the default parameters; the configuration file records all flags, filters, sampling methods, and convergence data. However, we are also interested in how changes in certain parameters affected the predicted properties of the binary population. As a result, we ran more simulations of the same binary population size with different prescriptions to see the influence on the data. Note that there are a few parameters that cannot be changed that are embedded into COSMIC’s multidim algorithm, such as the IMF.
In particular, we explore the results of (1) changing the distribution of natal kicks and (2) changing the metallicity of the binary population. Table 1 shows the final end states for all of the binary systems in the different populations, including the default population for easy comparison. While we set all of the simulations to have 100 000 binary systems, sometimes one fewer binary system was generated even though we use the multidim sampler where the binary fraction is a parameter and is not user-specified. Despite private conversation with the creator of COSMIC, we do not know the cause, and refer the reader to section 2.1.2 of Breivik et al. (2020) as a possible source.
The kick prescription affects how many binaries are disrupted at the first or second SN, which in turn affects the number of GW sources we can expect. We consider a total of four simulations. The first used the default kickflag given by COSMIC, in which kicks are drawn from a bimodal distribution. Standard core-collapse SNe (one mode) draw their kicks from a Maxwellian with a sigma value of 265 km s−1, given by Hobbs et al. (2005). Two other simulations we ran include the revised natal kick distributions given by equation (1) and equation (2) in Giacobbo & Mapelli (2020). These natal kicks are still drawn from a sigma value of 265 kms−1, but are then scaled by the ejecta mass and remnant mass or just the ejecta mass, respectively. Finally, we ran a simulation utilizing equation (1) of Bray & Eldridge (2016). Fig. 8(a–d) compares the natal kick distributions given by these four prescriptions for both the systems that remain gravitationally bound and those that are disrupted. Unsurprisingly, we see that the non-disruptive kicks are generally lower in magnitude compared to those that unbind the system, but some systems can withstand high-kick velocities.
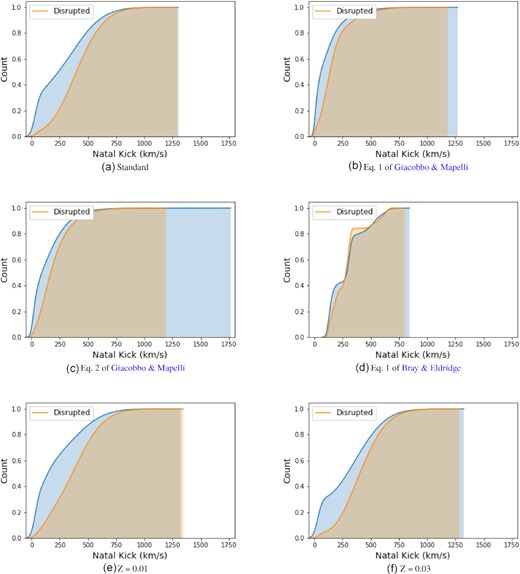
Cumulative, normalized histograms summarizing how the distribution of natal kicks change as certain parameters are modified. Systems that were disrupted by the kick are shown in orange, while the blue histogram represents those that remain binaries. The most notable change is when equation one of Bray & Eldridge, Bray & Eldridge is used, which is where we also see the highest number of disruptions. However, the other kick prescriptions see a decrease in the total number of disruptions compared to our default population.
Metallicity is well known to affect a star’s luminosity, effective temperature/colour, and mass-loss rate via stellar winds (e.g. Hurley, Pols & Tout 2000b; Tumlinson & Shull 2000; Vink, de Koter & Lamers 2001; Mapelli & Bressan 2013). All of these parameters contribute greatly to the observed properties of the star and to its evolution. For example, the size of its carbon-oxygen core, that will in turn affect the final remnant of a star (e.g. Fryer et al. 2012; Spera, Mapelli & Bressan 2015). Because of this, it is very important to consider the metallicity when studying the formation of compact binaries. In addition to the solar metallicity simulation ran in Section 2.1, in which had the metallicity of the binary population set to the solar value, Z = 0.02, we also ran simulations with the metallicity set to Z = 0.03 (more metal-rich) and Z = 0.01 (more metal-poor).
Fig. 5 shows the ΔRVmax distribution for the systems that merged as BH+BH binaries for the default parameter run and for the changed kick and metallicity runs. The duration of the phase where a ΔRVmax for a system was derived is shown on the y-axis. Appendix A shows the analogous plots for the BH+NS and NS+NS mergers (A1, A2). As expected, regardless of choice of metallicity or kick parameters, the systems with a Naked He star + BH show the largest ΔRVmax. When the systems have two living stars, they can also have large ΔRVmax, but before the envelope of the second star is stripped, BHs orbiting MS stars are the most difficult to detect with RVs.
However, there are large changes in the number and lifetimes of systems in different phases. The most dramatic example is the complete absence of BH+BH and BH+NS mergers, and only a few NS+NS mergers at Z = 0.03. These stars lose a lot of mass throughout their lifetimes because of the prescription for the strength of stellar winds as a function of metallicity; therefore, they are no longer massive enough to form BHs at the end of their lives (e.g. Woosley, Heger & Weaver 2002; Heger et al. 2003; Vink 2017). In contrast, our more metal-poor population saw the highest number of BH+BH mergers, but one of the lowest numbers of BH+NS mergers. This population also had less massive binaries (with ∼ 40 M⊙ stars) end up as BH+BH mergers, which led to a longer amount of time spent in the MS stage. This is seen in Fig. 5(e) where we have two distinct concentrations when both stars are living. It is also important to note here that this low-metallicity simulation did not produce sources that exceed 30 M⊙, the most massive LIGO/Virgo sources, even though our simulation did produce massive stars at the maximum mass allowed by COSMIC. We believe this is due to pair instability SNe, in which COSMIC fits to Table 1 of Marchant et al. (2019) (see also Farmer et al. (2019) and Stevenson et al. (2019)). Nonetheless, the changes in the number of sources for our kick prescriptions match nicely with Fig. 8. Figures (b) and (c) see the highest number of all mergers, due to the inherently low-velocity kicks for non-disruptions. Figure (d) see some of the lowest numbers, which is a result of the very high natal kicks (at least 100 km s−1) present in the population. Besides changes seen with the number of mergers, the formation mechanisms and radial velocities of these systems are similar to our initial population.
5 DISCUSSION
We have shown in Section 3 the ΔRVmax expected for systems with two massive stars as they evolve past their MS lifetimes, through the SN stage, and possibly end up as mergers. These changes in RV, especially for the systems with Naked He stars, are large enough to be easily detected in few-epoch surveys with ∼ 10 km s−1 velocity precision, such as LAMOST and MWM, provided that the stars are targeted for observations.
However, the exact number and configuration of the systems depends on the adopted parameters and on the underlying assumptions of the evolution of stars in COSMIC. We highlight two concerns here related to the use of the Fryer et al. (2012) prescription for predicting the remnant masses produced by core-collapse SNe. First, fallback that can occur onto the forming remnant fills in the mass gap between BHs and NSs, which is in contradiction to the current observational evidence. The most recent GW catalogue from the LIGO/Virgo Collaboration (e.g. Abbott et al. 2021b) still see no remnants in this gap, with the highest probability of a candidate in the gap being only 13 |${{\ \rm per\ cent}}$|. Further, no modern theoretical models predict significant fallback; stars really either explode, or they do not. Secondly, Patton & Sukhbold (2020) point out that the relationship between remnant mass and MS mass/carbon-oxygen core mass is not monotonic. They evolve a suite of CO cores with a range of composition and mass to explosion and find that only some cores exploded as SNe. The rest imploded directly to BHs, creating more massive remnants than previously expected. While these concerns will affect the details of the predictions, the main conclusions about the expected RV range and evolutionary state of companions remain. Indeed, we can hope that extensive RV observations and comparison with different remnant mass prescriptions can illuminate the explodability of massive stars.
Further, we have focused here on RV detection, which has the advantage of being able to probe distant systems, including massive stars in lower-metallicity environments such as the Magellanic Clouds. However, only a limited number of stars will be observed over at least a few epochs in current and planned surveys, while other methods such as astrometry also provides a way to detect Galactic BHs (e.g. Lu et al. 2016; Breivik, Chatterjee & Larson 2017).
Finally, Wiktorowicz et al. (2020) estimated how many non-interacting binary BHs are within the Milky Way, particularly those that are observable astrometrically by Gaia and spectroscopically by LAMOST. They find very similar results to ours, despite using different BPS models. Our evolutionary states tend to match their Gaia sample, where the living stars are luminous and massive, with BHs having an enhanced probability of being found around helium stars. They also find that systems with small separations contain a helium star and systems with large separations contain a MS star that has not yet interacted with its companion. These results agree with our analysis as well. They predict a large fraction of LAMOST stars with a detectable non-interacting BH companion will be MS stars, because they do not confine their analysis to systems where both stars are high mass. Nonetheless, this task of estimating the frequency and merging of compact remnants has been done numerous times before (e.g. Phinney 1991; Narayan, Piran & Shemi 1991; Tutukov & YungelSon 1993; Grishchuk et al. 2001; Abadie et al. 2010; Breivik et al. 2020; Shao & Li 2019) and will continue to constrain the order of magnitude span of expected sources with models.
6 CONCLUSIONS
We investigate the observability of progenitor systems to BH+BH, BH+NS, and NS+NS mergers in few-epoch RV data when at least one object is still a star and how the kick distribution and the metallicity affect the distribution of system parameters. We focus on the observing strategies used by recent and current surveys such as APOGEE, MWM, and LAMOST. We find that the highest velocity dispersion comes from systems with an observable Wolf–Rayet star or hot subdwarf (Naked Helium type star) and a BH or NS due to in-spiral (like the detected sources from LIGO/Virgo) likely resulting from CE and RLOF, bringing the orbital separation lower and lower. On the other hand, there are rather low values for ΔRVmax in systems that contain a MS, HG, or Giant Branch (GB) (in the case of NS+NS mergers) star in comparison to systems with Naked Helium type stars. Furthermore, when we change certain parameters known to affect binary star evolution, we still observe a shift in these respective categories, but obtain a different numbers of sources. Specifically, changes in the kick models have modest effects as does reducing the metallicity to half solar. The only really dramatic change comes from models with 50 per cent higher metallicity where BHs essentially no longer form. All in all, surveys such as MWM will observe N number of systems, and in combining the results of all the previous plots, we hope to refine how many stars we can expect of each type (i.e. MS, Hertzsprung Gap, Naked Helium) and what ΔRVmax they should have. From this data, we can learn what RV sensitivity is required for future surveys to achieve to be able to acquire such observations.
ACKNOWLEDGEMENTS
This paper is dedicated in the loving memory of Jean A. Banner-Carroll.
We thank Katie Breivik for invaluable technical assistance and advice. We also thank Rachel Patton for useful discussion and Chris Kochanek as well as Tharindu Jayasinghe for critical comments on early drafts of this paper.
We would like to acknowledge the land that The Ohio State University occupies is the ancestral and contemporary territory of the Shawnee, Potawatomi, Delaware, Miami, Peoria, Seneca, Wyandotte, Ojibwe, and Cherokee peoples. Specifically, the university resides on land ceded in the 1795 Treaty of Greeneville and the forced removal of tribes through the Indian Removal Act of 1830. As members of a land grant institution, we want to honour the resiliency of these tribal nations and recognize the historical contexts that has and continues to affect the indigenous peoples of this land.
DATA AVAILABILITY
COSMIC is a publicly available code and the simulations can be generated using the described parameters. If the complete data used to create the figures are needed, the data will be supplied upon reasonable request.
Footnotes
REFERENCES
APPENDIX A: GRAPH APPENDIX
Figs A1 and A2 show the RV distributions for BH+NS and NS+NS mergers.
As in Fig. 5, but for BH+NS.
As in Fig. 5, but for NS+NS.
