


ABSTRACT
We present polarization images of nine radio-loud (RL) quasars from the VLA B-array at 6 GHz. These quasars belong to the Palomar-Green (PG) ‘blazar’ sample comprising 16 RL quasars and eight BL Lac objects. Extensive polarization is detected in the cores, jets, and lobes of all the quasars, with cores primarily displaying magnetic (B-) fields transverse to, and jets displaying fields aligned with the jet direction. Hotspots display either transverse B-fields signifying B-field compression at terminal shocks or more complex structures. The fractional polarization in the cores ranges from 1 per cent to 10 per cent and jets/lobes from 10 per cent to 40 per cent. Several of the quasars show distorted or hybrid FRI/FRII radio morphologies with indications of restarted active galactic nucleus activity. We attribute this to the optical/UV selection criteria of the PG sample that remains unbiased at radio frequencies. The in-band spectral indices of the radio cores are relatively flat, while they are steep in the hotspots. This is consistent with the polarization structures where the hotspots appear to be locations of jet bends or bow-shocks. We present global properties for the entire PG ‘blazar’ sample. We find that jet powers correlate with accretion rates for the quasars; higher accretion rates result in more powerful radio jets. A correlation between the radio core fractional polarization and the 150 MHz total radio luminosity for the nine quasars studied here may imply that more organized B-fields at the jet bases lead to higher core fractional polarization and to more powerful radio jets.
1 INTRODUCTION
Active galactic nuclei (AGNs) are highly energetic and luminous non-stellar sources in the centres of galaxies that are powered by an actively accreting supermassive black hole (SMBH; Rees 1984; Rawlings & Saunders 1991). Radio-loud AGNs (RL AGNs) are AGNs with collimated, bipolar, relativistic jets (Blandford & Rees 1974), parametrized as having R = (S5 GHz/SB − band) ≥ 10, where R is the ratio of radio (5 GHz) to optical (B-band) flux densities (Kellermann et al. 1989). Only around |$\mathrm{15-20{{\ \rm per\ cent}}}$| of AGNs are radio-loud (Kellermann et al. 1989; Urry 2003) but these kpc-Mpc scale jetted AGNs have a major impact on their host galaxy and surrounding environments, stimulating and limiting the growth of galaxies, star-formation, and heating the circumgalactic medium (Blandford, Meier & Readhead 2019). The different classes of RL AGN are radio galaxies (RGs), quasars, and BL Lac objects. RGs and quasars are distinguished by the presence of narrow, as opposed to broad (velocity widths of ∼1000 km s−1), optical emission lines, respectively (Osterbrock 1978; Wills & Browne 1986), whereas the optical spectra of BL Lacs is mostly featureless and dominated by the continuum emission (Stickel et al. 1991; Stocke et al. 1991).
The prevailing jet-based RL AGN model is intrinsically anisotropic and orientation-based RL unification postulates that observational properties of RL AGNs (and in general of Type 1 and 2 AGNs) are explained by the different orientation of an opaque dust distribution (torus) relative to an observer and the effects of relativistic beaming (Barthel 1989; Antonucci 1993; Urry & Padovani 1995). The torus lies in the radio axis equatorial plane, surrounding the central engine and broad emission-line region obscuring them from view for certain viewing angles, resulting in Type 1 (broad + narrow optical emission lines; broad-line RGs and quasars) and Type 2 (narrow-line RGs) AGNs. Relativistic beaming of jets oriented at small angles to the observer leads to superluminal velocities, one-sided core-jet morphologies, depolarization asymmetry, and high source brightness. However, there are other phenomenological differences in RL AGNs unrelated to the viewing angle. A morphological divide in radio jets of RGs was first noted by Fanaroff & Riley (1974) and hence they are denoted as Fanaroff & Riley Type I (FRI) and Type II (FRII). The lower luminosity FRI RGs exhibit plume-like radio lobes, whereas the higher luminosity FRII RGs exhibit collimated jets with terminal ‘hotspots’. A division in total radio power was found to occur at L178 MHz = 2 × 1025 W Hz−1 sr−1 (Fanaroff & Riley 1974).
The RL unification posits that quasars are the pole-on counterparts of FRII RGs, while BL Lac objects are the pole-on counterparts of FRI RGs (Barthel 1989; Urry & Padovani 1995). Blazars have been historically characterized as AGNs with high luminosities, rapid variability, high and variable polarization, superluminal jet motion, and intense non-thermal emission across the electromagnetic spectrum. These properties are understood to be now largely explained by their relativistic jets being oriented at small angles to the line of sight, where both Doppler and projection effects become prominent. In addition, blazar spectral energy distributions (SEDs) exhibit double peaks, attributed to synchrotron radiation and inverse-Compton (IC) radiation, respectively (e.g. Abdo et al. 2010). While quasars are found to have low synchrotron peak frequency (νpeak < 1014.5 Hz), BL Lacs are found to span the entire range, with low-, intermediate-, and high-frequency-peaking BL Lacs (LBL, IBL, and HBL; Ghisellini et al. 2011).
The origin of the FR dichotomy in radio power and morphology is still an unresolved question, as is the question of the dramatically different optical spectra and broad-band SEDs in the blazar subclasses, aka the blazar divide. Various hypotheses have been put forth to explain the differences between the FR radio galaxies as well as the blazar sub-classes. Two popular suggestions include ‘intrinsic differences’ between FRIs and FRIIs in terms of jet kinetic power, driven by differences in the SMBH spins (e.g. Baum, Zirbel & O’Dea 1995; Celotti, Padovani & Ghisellini 1997; Bhattacharya et al. 2016), or efficiency of accretion (e.g. Meier et al. 1997; Marchesini, Celotti & Ferrarese 2004; Ghisellini et al. 2010), and ‘extrinsic differences’ in jet–medium interaction that results from differences in the surrounding medium (e.g. Prestage & Peacock 1988; Urry & Padovani 1995; Gopal-Krishna, Wiita & Hooda 1996).
High-excitation radio galaxies (HERGs) displaying strong optical emission lines are associated with high-rate, radiatively efficient (Shakura & Sunyaev 1973) accretion, whereas low-excitation radio galaxies (LERGs) with faint or absent lines are linked to low-rate, radiatively inefficient (Narayan & Yi 1995) accretion. FRI and FRII classes have been frequently associated with RI and RE accretion states, respectively (Jackson & Rawlings 1997). Almost all FRIs are LERGs and most FRIIs are HERGs. However, there are few known examples of FRI HERGs (Gürkan et al. 2022), and a significant population of FRII LERGs (Hine & Longair 1979). This association is also contradicted by the discovery of FRII-like BL Lacs and FRI-like quasars (Landt, Perlman & Padovani 2006; Kharb, Lister & Cooper 2010). Jet deceleration and subsequent decollimation in FRI jets, which likely occurs on kpc scales (Bicknell 1994; Laing & Bridle 2002), could be controlled by a combination of jet power and environmental density (Ledlow & Owen 1996). This suggestion has found support in recent LOFAR observations (Mingo et al. 2019; Mingo et al. 2022).
Jet formation mechanisms, either through the Blandford–Znajek (BZ; Blandford & Znajek 1977) or the Blandford–Payne (BP; Blandford & Payne 1982) mechanisms, or a combination of both, may also be driving the FR/blazar divide. Several theoretical models of AGN jets predict the generation of helical B-fields propagating outwards with the jet plasma (Meier, Koide & Uchida 2001; Lyutikov, Pariev & Gabuzda 2005; Hawley et al. 2015). Polarization observations are therefore important to understand and differentiate between different jet formation mechanisms. Earlier polarization studies of AGN jets have revealed that fractional polarization up to 40 per cent are common in radio jets at low radio frequencies (Bridle & Perley 1984). The inferred B-field structures (inferred to be perpendicular to the electric vector position angles, EVPA, for optically thin emission, and parallel to the EVPA for optically thick emission; Pacholczyk 1970) can be categorized as (i) B-fields predominantly parallel to the jet axis, (ii) B-fields predominantly perpendicular to the jet axis, and, (iii) B-fields perpendicular to the jet axis at the centre of the jet, but parallel near one or both of its edges. More powerful FRII sources tend to have B-fields parallel to the jet axis, whereas FRI sources typically display jets with the other two B-field configurations (Willis et al. 1981; Bridle 1982). In the jets of most powerful quasars, the inferred B-field direction after correction for Faraday rotation is normally along the jet, often following bends in the jet very closely (Bridle et al. 1994).
Very long baseline interferometry (VLBI) observations of blazars have found differences in magnetic (B-) field structures as well as rotation measures (RM) on parsec-scales (Cawthorne et al. 1993). BL Lacs tend to have their parsec-scale EVPA parallel to the jet direction, whereas RL quasars tend to show a perpendicular relative orientation (Lister & Homan 2005; Lister et al. 2013). Also, BL Lacs have been found to show systematically higher parsec-scale RM relative to the quasars (Zavala & Taylor 2005). However, it is not clear if these differences extend to kpc-scales.
In this paper, we present polarization-sensitive Karl G. Jansky Very Large Array (VLA) images for the jets and lobes of nine RL quasars to study their kpc-scale B-field structures. The selection criteria for our sample is discussed in Section (2). We have detailed the radio data reduction and calibration and imaging details in Section (3). Results from our observations are discussed in Section (4) along with a discussion on previous observations of our sources. Global correlations for the entire Palomar Green (PG) ‘blazar’ sample have also been discussed in Section (5). We discuss our results and findings in Section (6) and summarize and present our final conclusions in Section (7).
Throughout this paper, we have adopted Λ cold dark matter (ΛCDM) cosmology with H0 = 73 km s−1Mpc−1, Ωm = 0.3, and Ωv = 0.7 and used flat ΛCDM subroutine of astropy.cosmology subpackage (Astropy Collaboration 2013, 2018). The spectral index α is defined such that flux density at frequency ν, Sν∝να.
2 THE PG ‘BLAZAR’ SAMPLE
The PG UV-excess photographic survey was carried out in the U and B bands with the Palomar 18 inch Schmidt telescope in the late 1970s (Green, Schmidt & Liebert 1986). The PG UV-excess survey remains the largest complete optically selected survey for unobscured AGNs at low redshift and therefore has no radio selection biases. This makes this a good sample to examine the FR dichotomy, which was originally observed in the radio-selected 3C sample. The PG sample is one of the most well-studied samples of AGNs (Kellermann et al. 1989; Boroson & Green 1992; Miller, Rawlings & Saunders 1993) having extensive supplementary multiband data available in the literature, including accurate black hole (BH) masses, accretion rates, galactic properties including star formation rates (SFR), etc. (e.g. Davis & Laor 2011; Shangguan, Ho & Xie 2018; Xie et al. 2021). While the PG sample is well studied at optical/UV wavebands, sensitive high-resolution polarimetric radio observations have been lacking for most of the sources. These high-resolution polarimetric data are meant to fill that gap and provide a means to adequately resolve jet structures and to probe the environment through which jets are propagating.
The complete PG sample includes 1715 objects and covers a region of the sky that is 10 714 square deg. The limiting B-band magnitude for the PG sample is B = 16.1 mag. The sample was 84 per cent complete in 1986. Only 9 per cent of the PG sample sources are extragalactic in origin. Quasi-stellar objects (QSOs) constitute 5.4 per cent of the sample. QSOs include both RL and RQ quasars, with the latter making the vast majority (>80 per cent). Only four BL Lac objects were initially identified in the PG sample. These are PG0851+203 (OJ287), PG1218+304, PG1418+546, and PG1553+113. Padovani & Giommi (1995) revised this list to nine: apart from the original four, three BL Lacs were identified by Fleming et al. (1993): PG1246+586, PG1424+240, and PG1437 +398; and the two identified by Padovani & Giommi (1995) were PG1101+384 (Mrk421) and PG2254+075. Padovani & Giommi (1995) also noted that the PG sample may be missing 40 per cent of BL Lacs based on its U − B colour limit.
The PG ‘blazar’ sample presented in this paper comprises 16 RL quasars and eight BL Lac objects. Historically, blazars include only BL Lac objects and flat spectrum radio quasars (FSRQs). We have also included steep spectrum radio quasars (SSRQs) in this study, and loosely referred to the BL Lacs, FSRQs, and SSRQs collectively as ‘blazars’. This was chosen to increase the sample size while still including only Type 1 sources, where the jets are inclined relatively close to our lines of sight. Given that the half-opening angle of the dusty obscuring tori is ≤50° (Simpson et al. 1996), our selection restricts the quasar jet orientations to be ≤50° while displaying broad (≥1000 km s−1 velocity widths) emission lines in their optical/UV spectra. Nearly one-third of our sample quasars are optically violently variable (OVV) quasars. In the paper, when we refer to FSRQs and BL Lacs exclusively, we call them ‘classical’ blazars. Our PG ‘blazar’ sample was chosen using the following selection criteria.
Redshift z < 0.5;
Projected core-to-lobe extents ≳15 arcsec.
The projected lobe extents were chosen so that the ∼5 arcsec uGMRT Band 4 (∼600 MHz) observations can sample the lobes three or more times. This results in the ∼1 arcsec VLA 6 GHz B-array observations probing at least ∼5 kpc scale regions at the distance of these sources. 1 BL Lac object, viz., PG1246+586, was excluded due to the redshift cut-off and 1 PG RL quasar, viz., PG1211+143, was excluded as it was unresolved on kpc-scales (Danehkar et al. 2018). In general, Type 1 AGNs are good candidates for carrying out polarimetric observations as smaller inclination angles and Doppler boosting effects are conducive to reduced depolarizing effects from intervening media as well as radio flux density brightening. Fig. 1 and Table 1 presents the range of redshifts and spatial extents in kpc of the PG ‘blazar’ sample. Table 2 presents other properties of this sample in literature. In this paper, we present the VLA images of nine sample RL quasars which we had already acquired data for from our PG blazar sample.1 Silpa et al. (2021a) have already discussed source PG0007+106 using these data but we mention those results as this source is also a part of our sample and we also provide the in-band spectral index image of the same.
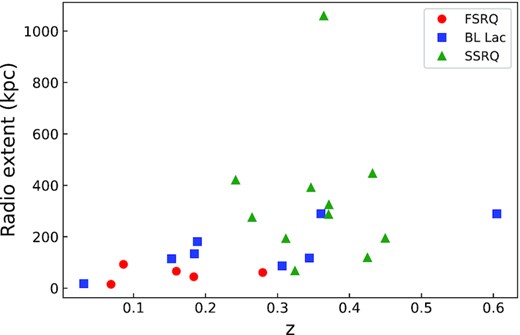
Distribution of redshifts z w.r.t. the radio extents in kpc for the PG ‘blazar’ sample.
The PG ‘blazar’ sample.
| S.No. | Name | Other name | RA | Dec. | Redshift | Radio extent (arcsec | kpc) | Type |
|---|---|---|---|---|---|---|---|
| 1 | PG0851+203 | OJ 287 | 08h54m48|${_{.}^{\rm s}}$|87 | +20d06m30|${_{.}^{\rm s}}$|64 | 0.306501 | 20 | 87 | BL Lac |
| 2 | PG1101+384 | Mrk 421 | 11h04m27|${_{.}^{\rm s}}$|31 | +38d12m31|${_{.}^{\rm s}}$|79 | 0.030893 | 30 | 18 | BL Lac |
| 3 | PG1218+304 | RBS 1100 | 12h21m21|${_{.}^{\rm s}}$|94 | +30d10m37|${_{.}^{\rm s}}$|16 | 0.184537 | 45 | 134 | BL Lac |
| 4 | PG1418+546 | OQ+530 | 14h19m46|${_{.}^{\rm s}}$|59 | +54d23m14|${_{.}^{\rm s}}$|78 | 0.152845 | 45 | 115 | BL Lac |
| 5 | PG1424+240 | OQ+240 | 14h27m00|${_{.}^{\rm s}}$|39 | +23d48m00|${_{.}^{\rm s}}$|03 | 0.160680a | 45 | 290 | BL Lac |
| 6 | PG1437+398 | RBS 1414 | 14h39m17|${_{.}^{\rm s}}$|47 | +39d32m42|${_{.}^{\rm s}}$|80 | 0.344153 | 25 | 117 | BL Lac |
| 7 | PG1553+113 | RBS 1538 | 15h55m43|${_{.}^{\rm s}}$|04 | +11d11m24|${_{.}^{\rm s}}$|36 | 0.360365 | 60 | 290 | BL Lac |
| 8 | PG 2254+075 | OY+091 | 22h57m17|${_{.}^{\rm s}}$|30 | +07d43m12|${_{.}^{\rm s}}$|30 | 0.188765 | 60 | 181 | BL Lac |
| 9 | PG0007+106 | Mrk 1501 | 00h10m31|${_{.}^{\rm s}}$|00 | +10d58m29|${_{.}^{\rm s}}$|50 | 0.086032 | 60 | 93 | FSRQ |
| 10 | PG1226+023 | 3C 273 | 12h29m06|${_{.}^{\rm s}}$|69 | +02d03m08|${_{.}^{\rm s}}$|59 | 0.159492 | 25 | 66 | FSRQ |
| 11 | PG1302−102 | RBS 1212 | 13h05m33|${_{.}^{\rm s}}$|01 | −10d33m19|${_{.}^{\rm s}}$|43 | 0.27949 | 15 | 61 | FSRQ |
| 12 | PG1309+355 | Ton 1565 | 13h12m17|${_{.}^{\rm s}}$|75 | +35d15m21|${_{.}^{\rm s}}$|08 | 0.183734 | 15 | 44 | FSRQ |
| 13 | PG2209+184 | II Zw 171 | 22h11m53|${_{.}^{\rm s}}$|88 | +18d41m49|${_{.}^{\rm s}}$|85 | 0.06873 | 12 | 15 | FSRQ |
| 14 | PG0003+158 | 4C+15.01 | 00h05m59|${_{.}^{\rm s}}$|23 | +16d09m49|${_{.}^{\rm s}}$|02 | 0.449711 | 35 | 194 | SSRQ |
| 15 | PG1004+130 | 4C+13.41 | 10h07m26|${_{.}^{\rm s}}$|09 | +12d48m56|${_{.}^{\rm s}}$|18 | 0.24186 | 115 | 421 | SSRQ |
| 16 | PG1048−090 | 3C 246 | 10h51m29|${_{.}^{\rm s}}$|91 | −09d18m10|${_{.}^{\rm s}}$|19 | 0.346528 | 83 | 392 | SSRQ |
| 17 | PG1100+772 | 3C 249.1 | 11h04m13|${_{.}^{\rm s}}$|86 | +76d58m58|${_{.}^{\rm s}}$|19 | 0.31163 | 44 | 193 | SSRQ |
| 18 | PG1103−006 | 4C−00.43 | 11h06m31|${_{.}^{\rm s}}$|77 | −00d52m52|${_{.}^{\rm s}}$|38 | 0.424968 | 22 | 119 | SSRQ |
| 19 | PG1425+267 | Ton 202 | 14h27m35|${_{.}^{\rm s}}$|60 | +26d32m14|${_{.}^{\rm s}}$|54 | 0.364262 | 218 | 1060 | SSRQ |
| 20 | PG1512+370 | 4C+37.43 | 15h14m43|${_{.}^{\rm s}}$|06 | +36d50m50|${_{.}^{\rm s}}$|35 | 0.370922 | 58 | 287 | SSRQ |
| 21 | PG1545+210 | 3C 323.1 | 15h47m43|${_{.}^{\rm s}}$|53 | +20d52m16|${_{.}^{\rm s}}$|61 | 0.264659 | 70 | 275 | SSRQ |
| 22 | PG1704+608 | 3C 351 | 17h04m41|${_{.}^{\rm s}}$|37 | +60d44m30|${_{.}^{\rm s}}$|52 | 0.371411 | 66 | 325 | SSRQ |
| 23 | PG2251+113 | 4C+11.72 | 22h54m10|${_{.}^{\rm s}}$|42 | +11d36m38|${_{.}^{\rm s}}$|74 | 0.32427 | 15 | 68 | SSRQ |
| 24 | PG2308+098 | 4C+09.72 | 23h11m17|${_{.}^{\rm s}}$|75 | +10d08m15|${_{.}^{\rm s}}$|75 | 0.432064 | 83 | 447 | SSRQ |
Note. Column (1): Serial Number. Column (2): PG names of sources. Column (3): Other common names of sources. Column (4): Right ascension. Column (5): Declination. Column (6): Redshift†. Column (7): Radio extents in arcsec and kpc. Column (9): Type of blazaraz = 0.60468 has been suggested by Paiano et al. (2017). We have used this updated value in our calculations.†All redshift values reported are corrected to the reference frame defined by the 3K CMB on NASA NED.2 The NASA/IPAC Extragalactic Database (NED) is operated by the Jet Propulsion Laboratory, California Institute of Technology, under contract with the National Aeronautics and Space Administration. Radio extents derived from Miller et al. (1993) at 5 GHz or from 1.4 GHz VLA FIRST / NVSS images for sources unresolved at 5 GHz.
The PG ‘blazar’ sample properties.
| S.No. | Name | Type | |$\mathrm{\log _{10} (M_{BH} / M_{\odot })}$| | Ref | R | |${\log _{10} \dot{M} \mathrm{(M_{\odot }\,yr^{-1})}}$| | Ref | |$\mathrm{\log _{10} SFR(M_{\odot }\,yr^{-1})}$| | Ref | |$\bar{Q}$| (1042 erg s−1) |
|---|---|---|---|---|---|---|---|---|---|---|
| 1 | PG0851+203 | BL Lac | 8.5 | 1 | – | – | – | – | – | 210 |
| 2 | PG1101+384 | BL Lac | 8.23 | 1 | – | – | – | – | – | 6.58 |
| 3 | PG1218+304 | BL Lac | 8.47 | 1 | – | – | – | – | – | 9.23 |
| 4 | PG1418+546 | BL Lac | 8.74 | 1 | – | – | – | – | – | 61.80 |
| 5 | PG1424+240 | BL Lac | 6.42 | 1 | – | – | – | – | – | 988 |
| 6 | PG1437+398 | BL Lac | 8.95 | 1 | – | – | – | – | – | 165 |
| 7 | PG1553+113 | BL Lac | 7.25 | 1 | – | – | – | – | – | 120 |
| 8 | PG 2254+075 | BL Lac | 8.85 | 1 | – | – | – | – | – | 43 |
| 9 | PG0007+106 | FSRQ | 8.87 | 2 | 197 | −0.42 | 3 | 0.92 | 5 | 7.01 |
| 10 | PG1226+023 | FSRQ | 9.18 | 2 | 1138 | 1.18 | 3 | 1.56 | 6 | 4850 |
| 11 | PG1302−102 | FSRQ | 9.05 | 2 | 187 | 0.92 | 3 | 1.82 | 5 | 161 |
| 12 | PG1309+355 | FSRQ | 8.48 | 2 | 18 | 0.37 | 3 | 1.06 | 5 | 9.92 |
| 13 | PG2209+184 | FSRQ | 8.89 | 2 | 141 | −0.98 | 3 | 0.46 | 5 | 1.50 |
| 14 | PG0003+158 | SSRQ | 9.45 | 2 | 175 | 0.79 | 3 | <1.25 | 5 | 2380 |
| 15 | PG1004+130 | SSRQ | 9.43 | 2 | 228 | −0.37 | 4 | 1.42 | 5 | 847 |
| 16 | PG1048−090 | SSRQ | 9.37 | 2 | 377 | 0.3 | 3 | <1.15 | 5 | 2690 |
| 17 | PG1100+772 | SSRQ | 9.44 | 2 | 322 | 0.29 | 3 | 1.83 | 5 | 3540 |
| 18 | PG1103−006 | SSRQ | 9.49 | 2 | 272 | 0.21 | 3 | <1.15 | 5 | 2250 |
| 19 | PG1425+267 | SSRQ | 9.9 | 2 | 53.6 | 0.07 | 3 | 1.79 | 5 | 519 |
| 20 | PG1512+370 | SSRQ | 9.53 | 2 | 190 | 0.2 | 3 | 1.19 | 5 | 1920 |
| 21 | PG1545+210 | SSRQ | 9.47 | 2 | 418 | 0.01 | 3 | <1.15 | 5 | 1930 |
| 22 | PG1704+608 | SSRQ | 9.55 | 2 | 645 | 0.38 | 3 | 1.94 | 5 | 4640 |
| 23 | PG2251+113 | SSRQ | 9.15 | 2 | 365 | 0.66 | 3 | 0.46 | 5 | 1760 |
| 24 | PG2308+098 | SSRQ | 9.76 | 2 | 188 | 0.22 | 3 | <1.25 | 5 | 2000 |
Notes. Column (1): Serial Number. Column (2): PG names. Column (3): Blazar type. Column (4): Black hole masses. Column (5): References for black hole masses. Column (6): Radio loudness parameter from Kellermann et al. (1994). Column (7): Accretion rates. Column (8): References for accretion rates. Column (9): Star Formation Rates (SFR). Column (10): References for SFR. Column (11): Jet Power. References- 1: Wu, Gu & Jiang (2009), 2: Shangguan et al. (2018), 3: Davis & Laor (2011), 4: Luo et al. (2013), 5: Xie et al. (2021), 6: Westhues et al. (2016)
3 RADIO DATA: REDUCTION AND ANALYSIS
The radio data were acquired using the VLA in the C-band (6 GHz) B-array configuration from 2020 August 10 to 2020 October 15 (Project ID: 20A-182) with a resolution of 1.1 arcsec. 16 spectral windows with 64 channels each were chosen to span the frequency range of 4.5–6.6 GHz. The average time on source was around 10 min. Polarization calibrators 3C286 and 3C138 were used. For more details, see Table 3. We used the casa calibration pipeline for VLA data reduction for the initial calibration and flagging. This was followed by manual polarization calibration.
VLA observational details of the nine PG quasars.
| Source | Observation date | Time on source | Flux calibrator | Phase calibrator | Leakage calibrator | Polarization angle calibrator |
|---|---|---|---|---|---|---|
| PG0003+158 | 2020-Aug-20 | 10m42s | 3C138 | J0010+1724 | 3C84 | 3C138 |
| PG0007+106 | 2020-Aug-20 | 10m54s | 3C138 | J0010+1724 | 3C84 | 3C138 |
| PG1004+130 | 2020-Aug-25 | 10m42s | 3C138 | J1016+2037 | 3C84 | 3C138 |
| PG1048−090 | 2020-Sep-27 | 10m51s | 3C138 | J1130−1449 | 3C84 | 3C138 |
| PG1100+772 | 2020-Aug-22 | 10m24s | 3C138 | J1044+8054 | 3C84 | 3C138 |
| PG1103−006 | 2020-Aug-22 | 10m30s | 3C138 | J1058+0133 | 3C84 | 3C138 |
| PG1226+023 | 2020-Oct-15 | 10m36s | 3C286 | J1150−0023 | 3C286 | 3C286 |
| PG1309+355 | 2020-Oct-12 | 10m30s | 3C286 | J1310+3220 | 3C286 | 3C286 |
| PG1704+608 | 2020-Aug-10 | 07m06s | 3C286 | J1740+5211 | 3C286 | 3C286 |
Notes. Column(1): PG source name. Column(2): Observation date. Column(3): Time on source. Column(4): Flux calibrator. Column(5): Phase calibrator. Column(6): Leakage calibrator Column(7): Polarization angle calibrator
First, the model of a polarized calibrator was set manually using the task setjy in casa. For this, we provided the model parameters such as the reference frequency, Stokes I flux density at the reference frequency, the spectral index and the coefficients of the Taylor expansion of fractional polarization and polarization angle as a function of frequency about the reference frequency. The coefficients were estimated by fitting a first-order polynomial to the values of fractional polarization and polarization angle as function of frequency, which were obtained from the NRAO VLA observing guide.2 Stokes I flux density values were calculated from the Perley & Butler (2017) scale and used to estimate the spectral index by fitting and provided the coefficients for Stokes I flux density at reference frequency, the spectral index (alpha), and curvature (beta).
Polarization calibration was carried out in three steps: (i) the cross-hand (RL, LR) delays were solved using a polarized calibrator with strong cross-polarization (either 3C138 or 3C286). This was carried out using the task gaincal with gaintype = kcross in casa; (ii) the instrumental polarization (i.e. the frequency-dependent leakage terms or ‘D-terms’) was solved using a polarized calibrator with good parallactic angle coverage. We used the task polcal in casa to solve for instrumental polarization with with poltype = Df + QU while using the polarized calibrators (either 3C138 or 3C286) and poltype = Df while using the unpolarized calibrator (3C84). The average value of the D-term amplitude turned out to be ≈ 7 per cent; (iii) the frequency-dependent polarization angle was solved using a polarized calibrator with known EVPA (either 3C138 or 3C286). This was carried out using the task polcal in casa with poltype = Xf.
The calibration solutions were then applied to the multisource data set. The casa task split was used to extract the calibrated visibility data for the sources from the multisource data set while averaging the spectral channels such that the bandwidth (BW) smearing effects were negligible. The total intensity or the Stokes I image of the sources created using the multiterm-multifrequency synthesis (MT-MFS; Rau & Cornwell 2011) algorithm of tclean task in casa. Three rounds of phase-only self-calibration followed by one round of amplitude and phase self-calibration were carried out for almost all the data sets, except those for PG1704+608 and PG1309+355 for which only two rounds of phase-only self-calibration were carried out. Images were made using natural weighting with robust=+0.5 in casa. For PG1048−090, we created the images using robust=+2 in order to reduce the Y-shaped deconvolution errors that showed up around the hotspots. Stokes Q and U images were created from the final self-calibrated visibility data.
Linear polarized intensity |$\mathrm{P = \sqrt{Q^2 + U^2}}$| and the EVPA χ = 0.5 tan−1(U/Q) images were obtained by combining the Stokes Q and U images using the aips3 task comb with opcode = polc (which corrects for Ricean bias) and pola, respectively. Regions with intensity values less than times times the rms noise in the P image and with values greater than 10° error in the χ image were blanked using comb. Fractional polarization FP = P/I images were obtained in comb with opcode = div. Regions with fractional polarization errors ≳10 per cent were blanked in the image. While imaging with the MT-MFS algorithm of the tclean task in casa, we used two Taylor terms to model the frequency dependence of the sky emission by setting the parameter nterms = 2. This produced in-band spectral index images and spectral index noise images for individual sources. We blanked the pixels with spectral index errors greater than 0.3.
The average r.m.s. noise in the Stokes I images is 3 × 10⁻⁵ mJy beam−1 (except for the outlier PG1226+023 or 3C273). The results from these images are presented in Table 4. We note that PG1048−090 was imaged with a circular convolved beam of size of 3.17 arcsec to minimize the imaging artefacts, which were difficult to get rid of completely with different weighting schemes. Flux density values reported in the paper were obtained using the Gaussian-fitting aips task jmfit for compact components like the core, and aips verb tvstat for extended emission. The FP and spectral index values noted are the mean values over the noted region. The rms noise values were obtained using aips tasks tvwin and imstat. aips procedure tvdist was used to obtain spatial extents.
Observational results.
| Source | Irms (Jy beam−1) | Prms (Jy beam−1) | Region | P (Jy) | I (Jy) | FP (per cent) | α | |
|---|---|---|---|---|---|---|---|---|
| PG0003+158 | 2.752E-05 | 2.390E-06 | Core | (3.6 ± 0.8) E-04 | 1.65E-01 | 8 ± 2a | −0.13 ± 0.13 | |
| Hotspot region | NW | (1.8 ± 0.2) E-03 | 3.3264E-02 | 9 ± 2 | −1.0 ± 0.2 | |||
| SE | (4.0 ± 0.2) E-03 | 7.3481E-02 | 11 ± 2 | −1.2 ± 0.3 | ||||
| Lobes | NW | (3.5 ± 0.8) E-03 | 2.8033E-02 | 23 ± 5 | −1.2 ± 0.4 | |||
| SE | (4.4 ± 0.8) E-03 | 4.5004E-02 | 17 ± 4 | −1.5 ± 0.6 | ||||
| SE jet knot | (1.04 ± 0.05)E-03 | 6.3260E-03 | 17.7 ± 0.8 | −1.3 ± 0.1 | ||||
| PG0007+106 | 1.559E-05 | 2.770E-06 | Core | (1.2 ± 0.3) E-04 | 1.26E-01 | 0.8 ± 0.3 | 0.12 ± 0.03 | |
| Lobes | W | (2.3 ± 0.5) E-04 | 4.18E-03 | 16 ± 4 | −1.0 ± 0.3 | |||
| PG1004+130 | 2.641E-05 | 4.769E-06 | Core | (2.7 ± 0.8) E-05 | 2.90E-02 | 3 ± 1 | −0.3 ± 0.2 | |
| Lobes | NW | (2.9 ± 0.3) E-02 | 1.2465E-01 | 28 ± 4 | −2.0 ± 0.2 | |||
| SE | (1.3 ± 0.3) E-02 | 4.9203E-02 | 31 ± 9 | −2 ± 1 | ||||
| SE jet | (3.0 ± 0.5) E-03 | 1.5625E-02 | 24 ± 5 | −2.4 ± 0.5 | ||||
| NW jet knot /hotspot | (1.6 ± 0.5) E-04 | 1.8104E-03 | 26 ± 8 | −1.8 ± 0.7 | ||||
| PG1048-090 | 9.089E-04 | 5.375E-05 | Core | (8 ± 2) E-05 | 4.9798E-02 | 2.1 ± 0.4 | 0.2 ± 0.4 | |
| Hotspot region | NW | (1.4 ± 0.1) E-02 | 2.4785E-01 | 10 ± 2 | −0.64 ± 0.13 | |||
| SE | (3.1 ± 0.1) E-02 | 2.8795E-01 | 14 ± 2 | −1.2 ± 0.1 | ||||
| PG1100+772 | 3.292E-05 | 4.032E-06 | Core | (1.17 ± 0.05) E-03 | 1.17E-01 | 2.7 ± 0.4 | 0.55 ± 0.006 | |
| Hotspot region | W | (1.751 ± 0.009) E-02 | 2.1315E-01 | 10.48 ± 0.08 | −1.051 ± 0.003 | |||
| E | (1.314 ± 0.007) E-02 | 1.1189E-01 | 14.3 ± 0.7 | −0.938 ± 0.004 | ||||
| Lobes | W | (3.5 ± 0.2) E-02 | 1.9166E-01 | 23 ± 2 | −0.86 ± 0.07 | |||
| E | (1.8 ± 0.3) E-02 | 8.5160E-02 | 25 ± 4 | −1.2 ± 0.2 | ||||
| Jet | (6.4 ± 0.3) E-03 | 5.7812E-02 | 15 ± 4 | −0.86 ± 0.07 | ||||
| Ridge | E | (1.05 ± 0.07) E-02 | 4.173E-02 | 23 ± 3 | −0.68 ± 0.07 | |||
| PG1103-006 | 2.511E-05 | 2.511E-05 | Core | (2.08 ± 0.07) E-03 | 1.37E-01 | 5.8 ± 0.3 | −0.319 ± 0.004 | |
| Hotspot region | NW | (2.18 ± 0.08) E-03 | 3.1218E-02 | 13 ± 1 | −0.76 ± 0.03 | |||
| SE | (1.11 ± 0.02) E-02 | 8.8719E-02 | 18.5 ± 0.8 | −0.93 ± 0.02 | ||||
| Lobes | NW | (1.47 ± 0.07) E-02 | 1.3515E-01 | 19 ± 2 | −0.7 ± 0.3 | |||
| SE | (7.2 ± 0.7) E-03 | 1.2988E-01 | 20 ± 2 | −0.6 ± 0.2 | ||||
| SW | (2.4 ± 0.5) E-03 | 1.3785E-02 | 25 ± 6 | −1.9 ± 0.2 | ||||
| NE | (9 ± 2) E-04 | 2.7121E-03 | 20 ± 5 | −0.9 ± 0.3 | ||||
| NW jet | (7.6 ± 0.2) E-03 | 1.1045E-01 | 10.2 ± 0.5 | −0.806 ± 0.008 | ||||
| PG1226+023 | 2.237E-03 | 2.439E-04 | Core | (2.128 ± 0.009)E+00 | 2.16E+01 | 11 ± 2 | −0.327 ± 0.004 | |
| Hotspot region | SW | (5.6 ± 0.2)E-01 | 5.19E+00 | 15 ± 2 | −0.902 ± 0.03 | |||
| PG1309+355 | 8.706E-05 | 9.592E-06 | Core | (1.3 ± 0.2)E-04 | 4.69E-02 | 0.37 ± 0.07 | 0.17 ± 0.06 | |
| PG1704+608 | 4.671E-05 | 1.014E-05 | Core | (1.36 ± 0.08) E-03 | 2.12E-02 | 8.2 ± 0.9 | −0.8 ± 0.7 | |
| Hotspot region | NE (up) | (4.54 ± 0.02) E-02 | 5.2227E-01 | 11.5 ± 0.4 | −0.96 ± 0.02 | |||
| NE (lw) | (3.75 ± 0.02) E-02 | 2.1331E-01 | 15.4 ± 0.9 | −1.06 ± 0.04 | ||||
| SW | (1.8 ± 0.2) E-03 | 9.6707E-03 | 16 ± 2 | −2.0 ± 0.2 | ||||
| Lobes | NW | (2.0 ± 0.5) E-03 | 2.3813E-02 | 23 ± 7 | −0.2 ± 0.7 | |||
| NE | (1.4 ± 0.1) E-02 | 1.6121E-01 | 13 ± 2 | −1.2 ± 0.5 | ||||
| SW | (2.2 ± 0.7) E-03 | 4.1280E-02 | 14 ± 3 | −1.9 ± 0.5 |
Notes. Column (1): PG source name. Column (2): R.M.S noise in Stokes I (total intensity) image. Column (3): R.M.S noise in polarized intensity image. Column (4): Region of the source and location. Column (5): Polarized flux density. Column (6): Total flux density. Column (7): Fractional Polarization. Column (8): Spectral index aFP at intensity peak position is 0.9 ± 0.3 per cent. bFP at intensity peak position is 0.27 ± 0.09 per cent.
We note that Faraday rotation effects are not expected to be significant at 5 GHz in the kpc-scale observations of jets and lobes (e.g. Saikia et al. 1987; Pudritz, Hardcastle & Gabuzda 2012). For several of the sample sources, viz., PG1004+130, PG1048−090, PG1100+772, and PG1226+023, the average integrated kpc-scale RM values are, respectively, −16 ± 5, +0 ± 3, +29 ± 1, and +2.0 ± 0.2 rad m−2 (Simard-Normandin, Kronberg & Button 1981). Integrated RM ≲ 50 rad m−2 result in rotation of ≲10° at 5 GHz. RM values can indeed be higher than the integrated RM values in smaller local regions, which can influence the local inferred B-field directions (e.g. McKean et al. 2016; Silpa et al. 2021b). However, the absence of strong Faraday effects is supported by the observed polarization in the jets in these sources which tend to lie either parallel or perpendicular to the local jet direction, with the inferred B field directions being perpendicular to the direction of the EVPA vectors for optically thin regions of emission; such orientations could be indicative of organized B-field structures (see Pudritz et al. 2012). We had estimated the bandwidth depolarization in 5 GHz VLA data by comparing the ratios of polarized flux density of individual sub-bands (of 512 MHz BW each) to that of the full band (of 2 GHz BW); this turned out to be around a factor of 0.5 (Silpa et al. 2022).
4 RESULTS
We have presented the total intensity and polarization images, as well as the in-band spectral index images in Figs 2–12. The quantitative results have been noted in Table 4 where we have adopted the definitions of a jets, knots, and hotspots as detailed by Bridle & Perley (1984). We find extensive polarization in the cores, jets, lobes, and hotspots of all the quasars, with the exception of PG1309+355 which remains largely unresolved but shows core polarization (see Table 4). The radio morphology shows distortions and complexities. The spectral indices are typically flat/inverted for the radio cores, with the sole exception of PG1704+608, but steep in the jets and hotspots (Table 4). Next, we describe these details for the individual sources.
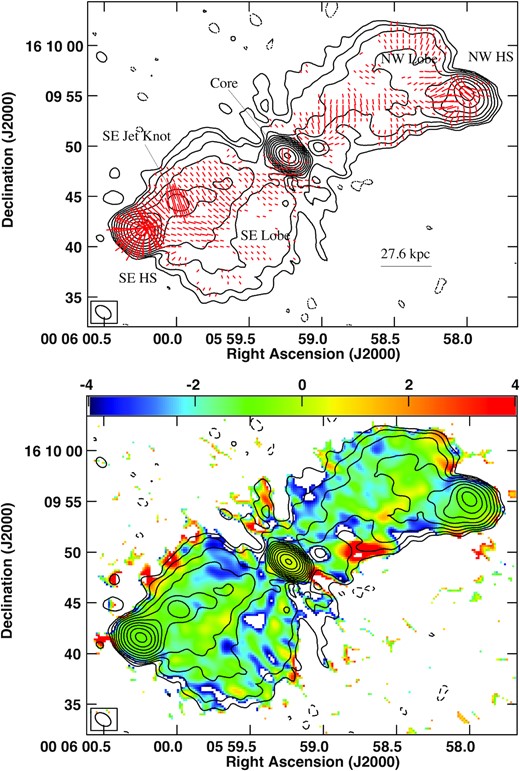
VLA 6 GHz contour image of quasar PG0003+158 (4C 15.01) superimposed with red (top) polarized intensity vectors and (bottom) in-band spectral index image. The inferred B-fields are perpendicular to the polarization vectors assuming optically thin emission. The beam is 1.71 arcsec × 1.13 arcsec with a PA of 55.18°. The peak surface brightness IP is 161.0 mJy beam−1. The contour levels in percentage of the peak surface brightness IP are −0.045, 0.045, 0.09, 0.18, 0.35, 0.7, 1.4, 2.8, 5.6, 11.25, 22.5, 45, 90 Jy beam−1. The length of the EVPA vectors is proportional to polarized intensity with 5 arcsec corresponding to 1.25 mJy beam−1.
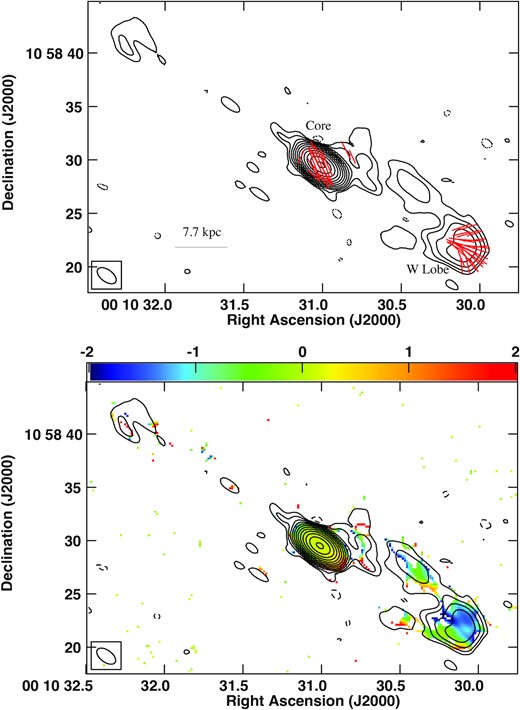
VLA 6 GHz contour image of quasar PG0007+106 superimposed with red (top) polarized intensity vectors and (bottom) in-band spectral index image. The inferred B-fields are perpendicular to the polarization vectors assuming optically thin emission. The beam is 2.04 arcsec × 1.12 arcsec with a PA of 53.54°. The peak surface brightness IP is 123.98 mJy beam−1. The contour levels in percentage of the peak surface brightness IP are −0.045, 0.045, 0.09, 0.18, 0.35, 0.7, 1.4, 2.8, 5.6, 11.25, 22.5, 45, 90 Jy beam−1. The length of the EVPA vectors is proportional to polarized intensity with 5 arcsec corresponding to 0.156 mJy beam−1 (see Silpa et al. 2021a).
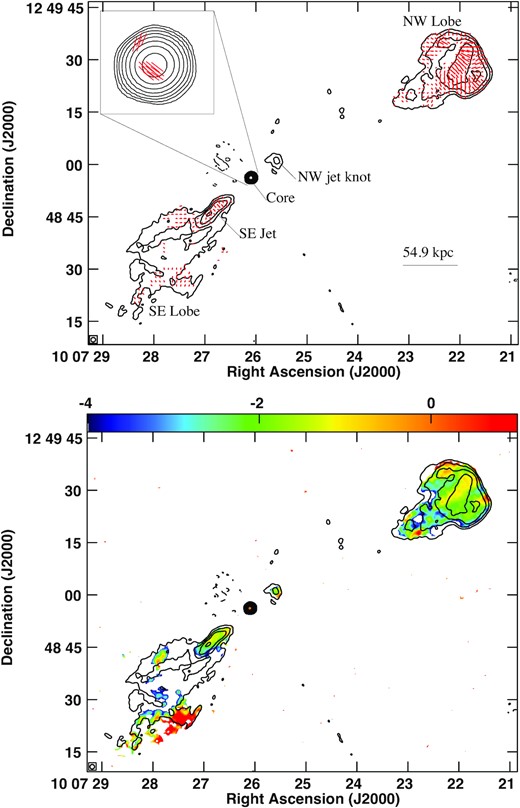
VLA 6 GHz contour image of quasar PG1004+130 (4C 13.41) superimposed with red (top) polarized intensity vectors and (bottom) in-band spectral index image. The beam is 1.35 arcsec × 1.29 arcsec with a PA of −80.03°. The peak surface brightness IP is 28.62 mJy beam−1. The contour levels in percentage of the peak surface brightness IP are −0.4, 0.4, 1.0, 2.0, 4.0, 8.0, 16, 32, 64 Jy beam−1. The length of the EVPA vectors is proportional to polarized intensity with 10 arcsec corresponding to 2.27 mJy beam−1. The inset shows a zoomed-in image of the core and 0.5 arcsec corresponding to 0.05 mJy beam−1.
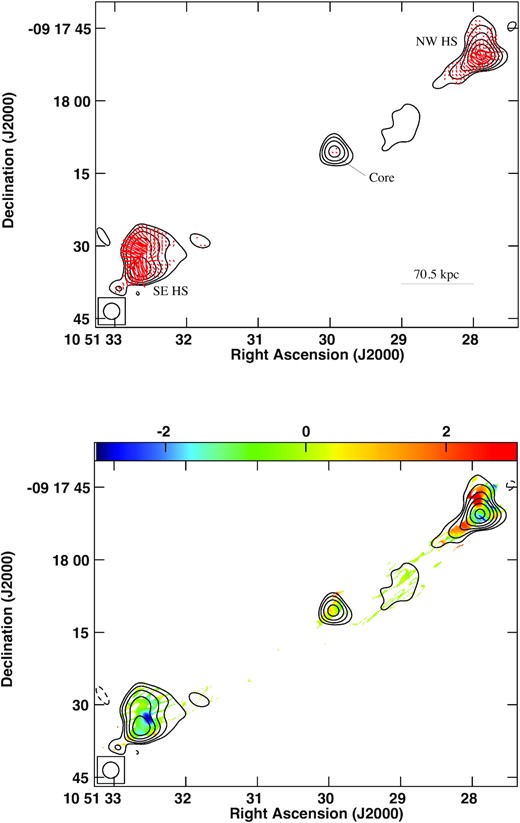
VLA 6 GHz contour image of quasar PG1048-090 (3C246) superimposed with red (top) polarized intensity vectors and (bottom) in-band spectral index image. The beam is 3.35 arcsec × 3.35 arcsec with a PA of 0°. The peak surface brightness IP is 0.1836 Jy beam−1. The contour levels in percentage of the peak surface brightness IP are −2.5, 2.5, 5.0, 10.0, 20.0, 40.0, 80.0 Jy beam−1. The length of the EVPA vectors is proportional to polarized intensity with 5 arcsec corresponding to 6.25 mJy beam−1.
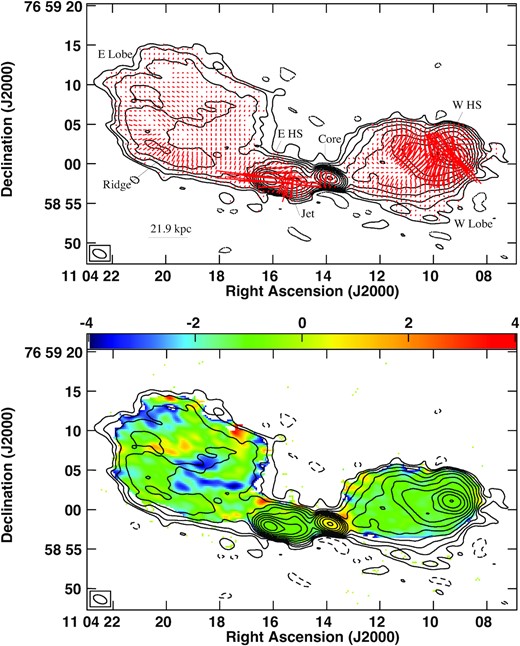
VLA 6 GHz contour image of quasar PG1100+772 superimposed with red (top) polarized intensity vectors and (bottom) in-band spectral index image. The inferred B-fields are perpendicular to the polarization vectors assuming optically thin emission. The beam is 1.79 arcsec × 1.00 arcsec with a PA of 67.35°. The peak surface brightness IP is 107.6 mJy beam−1. The contour levels in percentage of the peak surface brightness IP are −0.09, 0.09, 0.18, 0.35, 0.7, 1.4, 2.8, 5.6, 11.25, 22.5, 45, 90 Jy beam−1. The length of the EVPA vectors is proportional to polarized intensity with 5 arcsec corresponding to 3.57 mJy beam−1.
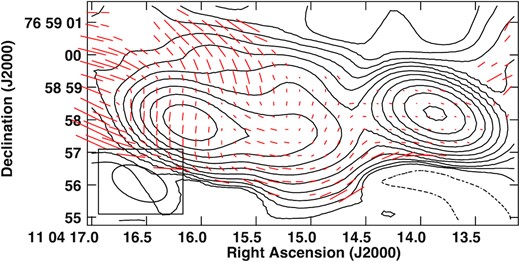
VLA 6 GHz contour image of the core and eastern hotspot of quasar PG1100+772 (3C249.1) superimposed with red polarization vectors whose length is proportional to fractional polarization, rotated by 90° to indicate the B-field direction, assuming optically thin emission. The beam is 1.79 arcsec × 1.00 arcsec with a PA of 67.35°. The peak surface brightness IP is 107.6 mJy beam−1. The contour levels in percentage of the peak surface brightness IP are −0.09, 0.09, 0.18, 0.35, 0.7, 1.4, 2.8, 5.6, 11.25, 22.5, 45, 90 Jy beam−1. 1 arcsec length of the vector corresponds to 25 per cent.
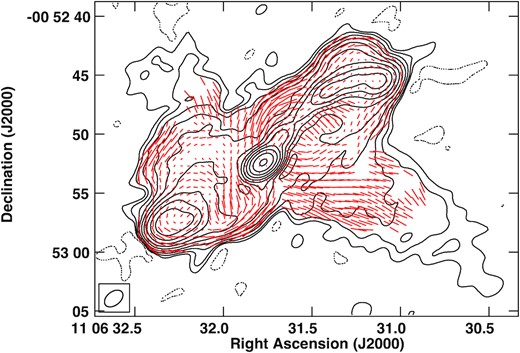
VLA 6 GHz contour image of PG1103−006 (4C−00.43) superimposed with red polarization vectors whose length is proportional to fractional polarization, rotated by 90° to indicate the B-field direction, assuming optically thin emission. The beam is 1.79 arcsec × 1.15 arcsec with a PA of −51.79°. The peak surface brightness IP is 128.7 mJy beam−1. The contour levels in percentage of the peak surface brightness IP are −0.045, 0.045, 0.09, 0.18, 0.35, 0.7, 1.4, 2.8, 5.6, 11.25, 22.5, 45, 90 Jy beam−1. 2 arcsec length of the vector corresponds to 62.5 per cent.
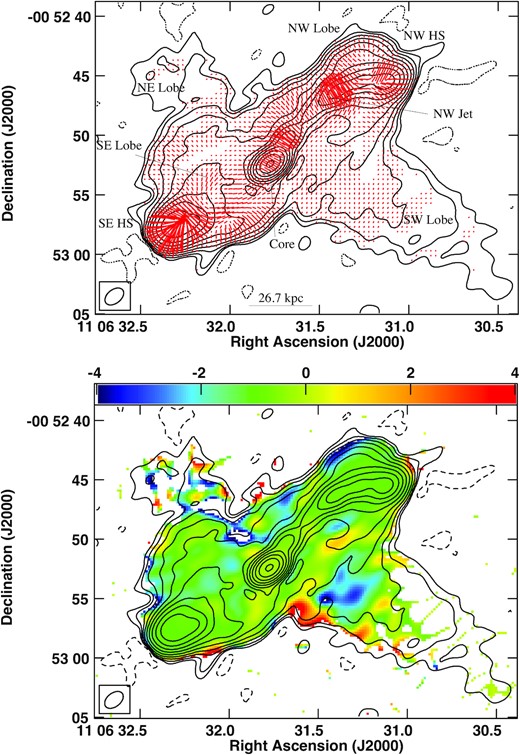
VLA 6 GHz contour image of quasar PG1103−006 superimposed with red (top) polarized intensity vectors and (bottom) in-band spectral index image. The beam is 1.79 arcsec × 1.15 arcsec with a PA of −51.79°. The peak surface brightness IP is 128.7 mJy beam−1. The contour levels in percentage of the peak surface brightness IP are −0.09, 0.09, 0.18, 0.35, 0.7, 1.4, 2.8, 5.6, 11.25, 22.5, 45, 90 Jy beam−1. The length of the EVPA vectors is proportional to polarized intensity with 2 arcsec corresponding to 2.00 mJy beam−1.
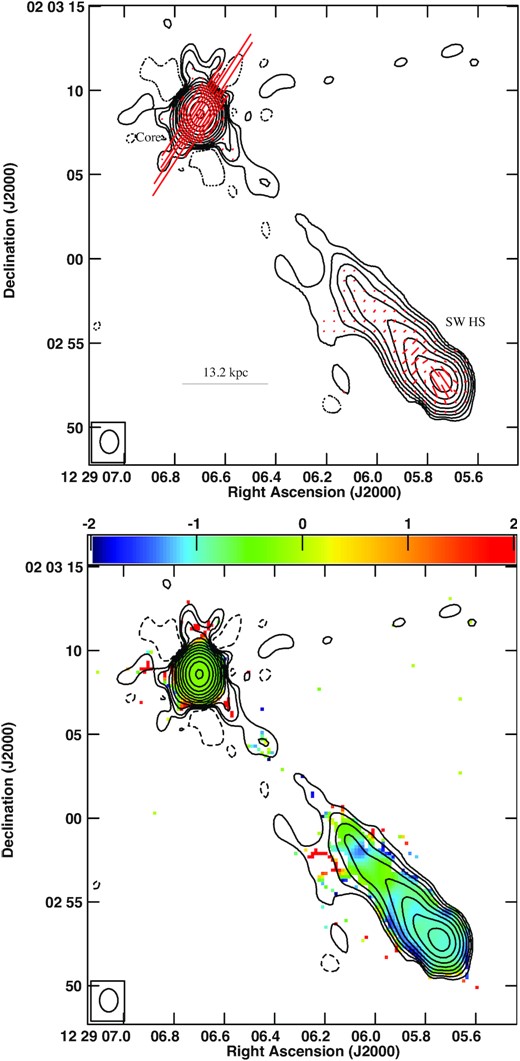
VLA 6 GHz contour image of quasar PG1226+023 (3C273) superimposed with red (top) polarized intensity vectors and (bottom) in-band spectral index image. The beam is 1.37 arcsec × 1.09 arcsec with a PA of −0.43°. The peak surface brightness IP is 21.05 Jy beam−1. The contour levels in percentage of the peak surface brightness IP are −0.045, 0.045, 0.09, 0.18, 0.35, 0.7, 1.4, 2.8, 5.6, 11.25, 22.5, 45, 90 Jy beam−1. The length of the EVPA vectors is proportional to polarized intensity with 2 arcsec corresponding to 333.33 mJy beam−1.
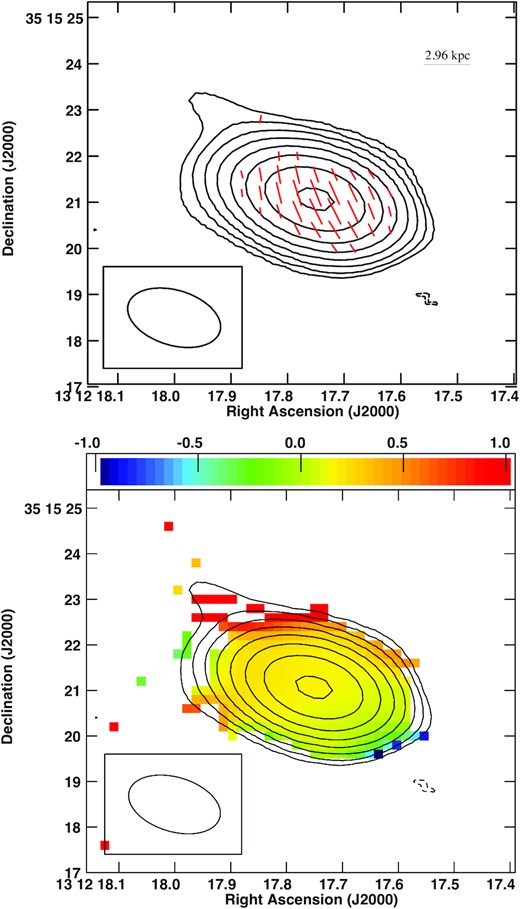
VLA 6 GHz contour image of quasar PG1309+355 (Ton 1565) superimposed with red (top) polarized intensity vectors and (bottom) in-band spectral index image. The beam is 2.07 arcsec × 1.19 arcsec with a PA of 73.31°. The peak surface brightness IP is 0.047415 Jy beam−1. The contour levels in percentage of the peak surface brightness IP are −0.7, 0.7, 1.4, 2.8, 5.6, 11.25, 22.5, 45, 90 Jy beam−1. The length of the EVPA vectors is proportional to polarized intensity with 1.0 arcsec corresponding to 0.23 mJy beam−1.
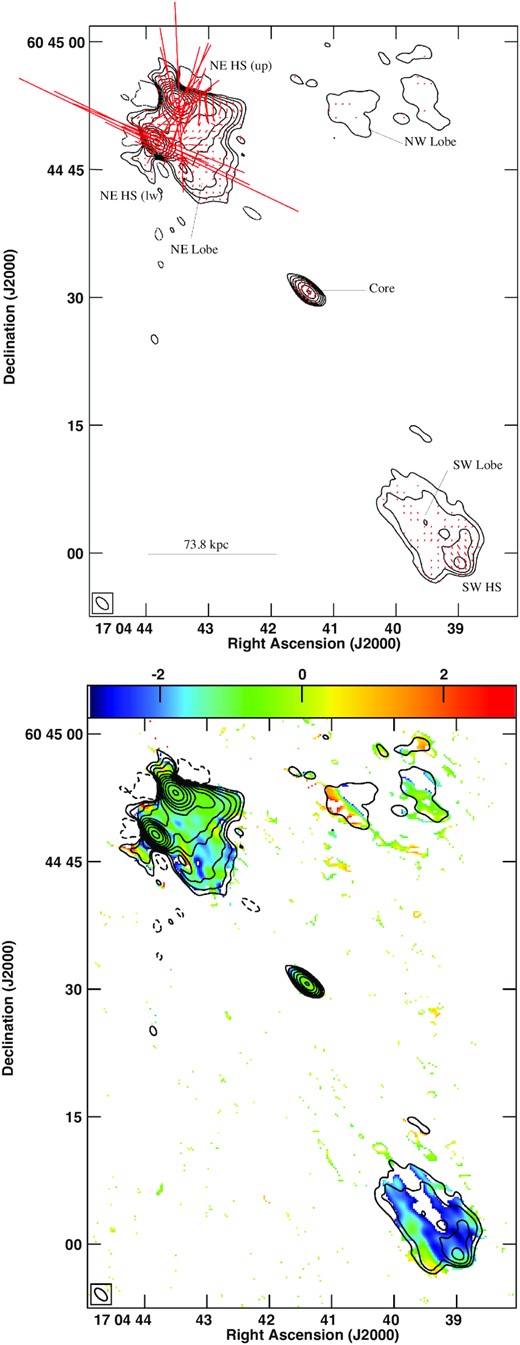
VLA 6 GHz contour image of quasar PG1704+608 (3C351) superimposed with red (top) polarized intensity vectors and (bottom) in-band spectral index image. The beam is 1.82 arcsec × 0.97 arcsec with a PA of 44.86°. The peak surface brightness IP is 317.2 mJy beam−1. The contour levels in percentage of the peak surface brightness IP are −0.09, 0.09, 0.18, 0.35, 0.7, 1.4, 2.8, 5.6, 11.25, 22.5, 45, 90 Jy beam−1. The length of the EVPA vectors is proportional to polarized intensity with 5 arcsec corresponding to 4.16 mJy beam−1.
4.1 Notes on individual sources
4.1.1 PG0003+158
This SSRQ (aka 4C+15.01) was imaged with the VLA A-array at 5 GHz by Miller et al. (1993) who detected only the bright and compact regions (i.e. core and hotspots) of this large double radio source. Our image detects the diffuse lobe emission as well and shows extensive polarization in its core, lobes, and hostpots (Fig. 2). The inferred B-field is transverse to the jet direction for the optically thick radio core. The southern jet knot has an inferred B-field morphology inconsistent with a shocked region; the B-field vectors are aligned with the jet flow rather than perpendicular. This jet knot could be a site for particle re-acceleration/energizing which should show a relatively flat spectral index without B-field enhancement. However, the spectral index of the jet knot is −1.3 ± 0.1, making it steeper than the α of the hotspots (−1.2 ± 0.3 for the southern hotspot and −1.0 ± 0.2 for the northern hotspot), suggesting this to be a portion of the jet itself. This is then consistent with the findings of Bridle et al. (1994) who found that jet knots that are elongated in directions close to that of the jet, the EVPA vectors tend to be orthogonal to the jet axis. The inferred B-fields in the lobes are largely aligned with the local jet direction assuming optically thin emission. A jet region entering the southern hotspot is highly polarized, exhibiting parallel inferred B-fields. The inferred B-fields are aligned with the edges of the hotspot regions. Recent VLBI results from Wang et al. (2023) indicate that the parsec-scale approaching jet is towards the south-east but offset from the straight line connecting the core to the southern hotspot, indicating jet curvature.
4.1.2 PG0007+106
This SSRQ (aka III Zw 2) has been classified as a radio intermediate quasar by Miller et al. (1993), Falcke, Sherwood & Patnaik (1996a), and Falcke, Patnaik & Sherwood (1996b). Its host galaxy has prominent tidal tails and arms indicative of a recent merger systems (Dunlop et al. 1993; Surace, Sanders & Evans 2001). The source is known to be variable at both radio and optical wavelengths (e.g. Schnopper et al. 1978; Terasranta et al. 1992). Using the 685 MHz uGMRT and 6 GHz VLA polarimetric observations, Silpa et al. (2021a) were able to identify the signatures of a jet+wind-like stratification in the radio outflow of this PG quasar (see Fig. 3). The possible stratification in the outflow was revealed by the presence of different inferred B-field structures in the different frequency and different resolution images; uGMRT images sampled the outer sheath of the jet/lobe, while the VLA images sampled the inner spine of the jet/lobe. The VLBI image from Wang et al. (2023) shows an unresolved core.
4.1.3 PG1004+130
This SSRQ (aka 4C+13.41) appears to be a restarted source as observed in the bright jet-core-counterjet emission on the 30 arcsec scales (Fig. 4). A clear surface brightness discontinuity is observed between the jet-counterjet and the larger lobe emission. The inferred B-field is transverse to the jet direction for the optically thick radio core. The terminal region on the western side does not show a typical B-field configuration in its hotspot (i.e. transverse to the jet direction). This could indicate weakening of the hotspot as the previous episode of activity has died down. The jet seen inside the south-eastern lobe shows B-field vectors parallel to the jet direction (assuming optically thin emission) ending in a weak hotspot with B-field vectors nearly perpendicular to the jet direction. This B-field structure is similar to the one seen in 3C219 by Clarke et al. (1992) for its restarting jet. The south-eastern lobe shows diffuse emission that is not well detected in our higher resolution images. The VLBA image from Wang et al. (2023) indicates that the parsec-scale (approaching) jet is aligned well with the south-eastern inner jet.
Gopal-Krishna & Wiita (2000) have classified this quasar as a hybrid FRI/FRII morphology source and Miller et al. (2006) found an X-ray counterpart a little upstream of the radio FR I jet, with a flat photon index and a concave SED more typical of FR II quasar jets than FR I jets. Gopal-Krishna & Wiita (2000) have explained this hybrid nature as resulting from environmental differences in density, i.e. the density of the surrounding medium is higher towards the SE causing decollimation. This source is also a broad absorption line (BAL) QSO (Wills, Brandt & Laor 1999).
4.1.4 PG1048−090
This SSRQ (aka 3C246) is a member of a galaxy cluster (Yates, Miller & Peacock 1989). It is relatively poorly imaged at radio frequencies compared to the other sources. Previous VLA images show the presence of a core and two hotspots; however, the jet and lobe emission is very faint (Miller et al. 1993; Kellermann et al. 1994; Dennett-Thorpe, Barthel & van Bemmel 2000). We find a similar structure in our images (Fig. 5). The Y-shaped ears around the north-western hotspot are due to deconvolution errors that remain in spite of self-calibration and must be regarded as image artefacts. We find that the core and two hotspots show extensive polarization; however, their fractional polarization is low. This would be consistent with the presence of X-ray-emitting gas in the galaxy cluster (e.g. Sarazin 1986). The inferred B-field is transverse to the jet direction for the optically thick radio core. The western hotspot shows a polarization structure (B-field aligned along the jet direction) consistent with the jet entering the hotspot region. The in-band spectral index image (Fig. 5) shows that the core has an inverted spectrum, while the hotspots have steep spectra. The VLBA image from Wang et al. (2023) indicates that the parsec-scale (approaching) jet is in the north-west direction.
4.1.5 PG1100+772
This SSRQ (aka 3C249.1) is a candidate restarted source (Marecki 2012; Fernini 2007, Fig. 6). The western lobe is FRII-like, while the eastern one does not have a terminal hotspot and is FRI-like. This makes the source a hybrid FRI/FRII radio source. The inferred B-field is transverse to the jet direction for the optically thick radio core. The polarization features in the inner ‘hotspot’ are consistent with a terminal shock in that the B-vectors are transverse to the jet direction here (Fig. 7). Further down the eastern lobe, the B-field vectors resemble the bubble-like lobe structures observed in several Seyfert galaxies (Kharb et al. 2006; Sebastian et al. 2020) and is relatively flat in spectral index. The VLBI image from Wang et al. (2023) shows an unresolved core.
This source was observed at VLA 5 GHz B/C array by Bridle et al. (1994) and Gilbert et al. (2004) who identified that the two lobes are asymmetric in size, intensity, and surface brightness. The west lobe is edge-brightened with a well-resolved hotspot near its western end. The east lobe is edge-darkened except for a resolved ridge along its southern boundary. Bridle et al. (1994) note that a jet enters it on its extreme southern edge and terminates abruptly at 7.7 arcsec (∼34 kpc) from the central feature. The degree of polarization is greatest at the edges of the lobes, particularly east of eastern hotspot at the end of the jet, where it reaches 55 per cent to 65 per cent. Interestingly, we have detected a polarization of 44 ± 4 per cent in this region which is a ∼10–40 per cent reduction. The EVPA vectors are roughly perpendicular to the main ridge in the east lobe and to the outer boundaries of the west lobe. At 0.35 arcsec resolution from the combined A, B, and C configuration data, all structures in the east lobe are fully resolved. The jet bends at least twice on its path to the resolved terminal hot spot at its east end.
Many different explanations have been proposed in the literature for the peculiar morphology of PG1100+772, including a dense cluster environment (Hintzen 1984), cooling flows (Crawford, Fabian & Johnstone 1988), interacting systems (Stockton & MacKenty 1983), the ‘flip-flop’ mechanism (Lonsdale & Morison 1983), and restarted activity (Marecki 2012). There is an emission-line system extending for several arcseconds around the quasar, plus an extended optical continuum that may be of stellar origin (Richstone & Oke 1977; Boroson & Oke 1984).
4.1.6 PG1103−006
This RL quasar (aka 4C -00.43) is an X-shaped radio source (Figs 8 and 9). The jets appear to be S-shaped, especially going North, which could be consistent with jet precession. This quasar has been observed previously by the VLA by Hutchings et al. (1998) who did not detect the X-shape as prominently. Hutchings et al. (1996) studied this source as those residing inside galaxy cluster environments. Rector, Stocke & Ellingson (1995) did not see any correlation between galaxy density and quasar radio morphology in their sample of QSOs of which PG1103−006 is one. Such a correlation is expected from jet–ICM interaction. Our polarization structures in the inner lobes match those of Reid, Kronberg & Perley (1999); however, they also did not pick up the X-shaped lobe emission in their VLA 4.9 GHz B-array images. The VLBI image from Wang et al. (2023) shows that the parsec-scale (approaching) jet is aligned with the north-west jet direction.
The inferred B-field structure in the north-western jet stays aligned with the jet throughout, all the way to the north-western hotspot. The inferred B-field in the radio core is transverse to the jet direction for the optically thick core. The inferred B-field appears to be be bow-shock-like in both the hotspots, as seen in the southern hotspot of III Zw 2. Extensive polarization is observed in the X-shaped wings. Although the inferred B-fields are aligned with the direction of the wings (see Fig. 8), the vectors do not follow the flow ‘around the corner’ unambiguously. Nevertheless, we do find them to be largely consistent with the ‘hydrodynamical backflow model’ (see Cotton et al. 2020). We discuss the models for X-shaped sources in Section 6 ahead.
4.1.7 PG1226+023
This famous FSRQ (aka 3C273) is the first identified quasar (Schmidt 1963). It is one of the closest and most luminous of all quasars. Imaging of this source has been done at multiple wavebands (e.g. Perley & Butler 2017). 3C273 has a bright, flat-spectrum nucleus with highly variable flux density, and a one-sided, highly polarized, narrow jet extending ∼23 arcsec to the south-west of the nucleus. Our 5 GHz image (Fig. 10) is consistent with the previous total intensity, polarization, and spectral index images of 3C273 (Perley & Butler 2017). The inferred B-field is transverse to the jet direction in the optically thick radio core, i.e. the unresolved base of the jet. The inferred B-field is aligned with the jet direction along the jet and becomes transverse to it at the position of the southern hotspot. The VLBI image from Wang et al. (2023) indicates that the parsec-scale (approaching) jet is towards the south-west and shows clear curvature.
4.1.8 PG1309+355
This radio-intermediate FSRQ (aka Ton1565) has been suggested to be a boosted RQ quasar (Miller et al. 1993). It shows a compact radio morphology in VLA A and D array 5 GHz data (Kellermann et al. 1994). Its host galaxy shows evidence of a spiral-like substructure (Kim et al. 2008). In view of its small viewing angle, strong UV absorption lines are observed in its HST spectrum (Brandt, Laor & Wills 2000). Brandt et al. (2000) note that it is moderately X-ray weak for a radio-loud QSO. We had chosen this object as being potentially extended based on its NVSS image. However, we detect only a compact radio core in our 5 GHz data (Fig. 11) which shows marginal fractional polarization (∼0.4 per cent). Our VLA data have failed to detect any extended diffuse emission or hotspots on kpc-scales. An archival VLA A-array image4 at 22 GHz (resolution 100 × 75 mas) does indicate a faint jet-like extension to the west of the core. If this is indeed the kpc-scale jet direction in PG1309+355, the inferred B-field is transverse to the jet direction for optically thick core emission. The VLBI image from Wang et al. (2023) shows an unresolved core.
The in-band spectral index (Fig. 11) also suggests a gradient to the south-west which could hint at the presence of an unresolved core-jet structure. Its EVN image, however, suggests a mas-scale core-jet structure to the south-east (Falcke et al. 1996b). It is possible that the jet curves towards the south-west on scales intermediate between the VLA and EVN+MERLIN. Large jet bents going from parsec- to kpc-scale are commonly observed in blazars (Kharb et al. 2010). Moreover, Falcke et al. (1996a) suggest that PG1309+355 might not be a boosted radio-quiet quasar based on their observations.
4.1.9 PG1704+608
This SSRQ (aka 3C351) shows the presence of multiple hotspots and a one-sided distorted radio lobe in VLA and GMRT images (Bridle et al. 1994; Vaddi et al. 2019). A 15 GHz image from the Cambridge 5-km telescope shows that in the northern hotspot, the southern component is compact, while the northern component shows extended emission (Laing 1981). Our 5 GHz image shows the complex radio morphology in total intensity and polarization (Fig. 12). The inferred B-field is parallel to the jet direction for the optically thin radio core. The southern hotspot shows the characteristic B-field morphology of a hotspot (transverse to the jet direction). The jet direction appears to have suddenly changed in this source as is also visible in the misaligned northern radio lobe. In in-band spectral index image (Fig. 12) shows similarly steep spectrum in both the northern as well as southern hotspots. Both lobes show diffuse emission that are not well detected in our higher resolution images. The VLBA image from Wang et al. (2023) does not resolve the core.
Overall, we find that the fractional polarization in the radio cores ranges from 0.8 per cent to 10 per cent and in the jets/lobes from 10 per cent to 40 per cent (see Table 4). The radio cores primarily display inferred B-fields transverse to the jet direction (assuming optically thick emission) except PG1704+608 where the core emission is optically thin the B-field vectors are aligned along the jet direction. The inferred B-fields are aligned parallel to the local jet directions whenever a jet or a jet knot is observed. The inferred B-field becomes transverse in the compact hotspot regions. However, several hotspots like those in PG1004+130 and PG1100+772 show a more complex B-field structure. We discuss these in greater detail in Section 6 ahead. The B-fields in the radio lobes are almost always aligned with the lobe edges.
5 GLOBAL CORRELATIONS
We have looked at various global correlations for the PG ‘blazar’ sample using the most recent and reliable estimates of BH masses, accretion rates, and SFR values. As far as possible, we have relied on estimates that were obtained uniformly for the various blazar sub-classes. These properties are listed in Table 2. We have used the Kolmogorov–Smirnov (KS) test for evaluating statistical differences between properties of various populations and the Kendall-τ test to measure the significance of correlations between different properties. We report the radio jet kinetic power |$\bar{Q}$| without errors as systematic uncertainties in the estimation methods dominate the statistical uncertainty in the data. MBH and |$\dot{M}$| do not have reported errors in Shangguan et al. (2018), Wu et al. (2009), and Davis & Laor (2011) due to the same. In some instances, error bars are not shown as errors are smaller than the symbol sizes .
5.1 Black hole mass
The SMBH masses of the sample blazars were obtained from Wu et al. (2009) and Shangguan et al. (2018). We note that the BH masses were estimated from the H β line luminosity in Shangguan et al. (2018) and from the R-band host galaxy magnitudes in Wu et al. (2009); these different mass estimation methods might potentially be introducing biases between the blazar sub-classes. We note that the BH mass estimates obtained by converting a single-band optical luminosity using an empirical correlation, as obtained by Wu et al. (2009), may be suspect. This may be the reason for the unusually small BH masses in PG1424+240 and PG1553+113.
The BH masses for the quasars in this paper however all come from Shangguan et al. (2018). We discuss the possible selection biases affecting the BH masses in the PG sample in Section 6. The distribution of BH masses log10(MBH/M⊙) and redshifts for the sample blazars are shown in Fig. 13. We find that the hypothesis that quasars and BL Lacs have different BH masses cannot be ruled out at the 95 per cent confidence level (KS test p = 0.0007). RL quasars have systematically larger BH masses compared to the BL Lacs in our sample. However, we also find that the SSRQs have systematically higher BH masses compared to the FSRQs (KS test p = 0.0027), as well as BL Lacs and FSRQs combined (KS test p = 0.00009). So the major BH differences are between the SSRQs and the classical blazars. We find that the BH masses seem to be marginally correlated with the core fractional polarization FPC (Kendall τ test p = 0.044) and anticorrelated with radio core prominence RC (Kendall τ test p = 0.012) for the nine quasars studied here (Figs 14 and 15). The errors in Rc are smaller than the symbol sizes in Fig. 15. We discuss the implications of these findings in Section 6.
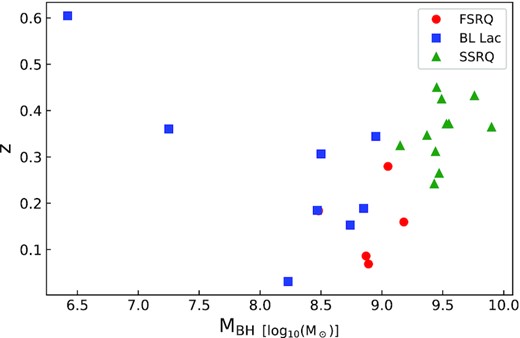
Distribution of redshifts z w.r.t. the log of BH masses (MBH/M⊙) for the sample blazars.

Log of radio core fractional polarization FPC ( per cent) versus log of BH masses (MBH/M⊙) of the quasars.
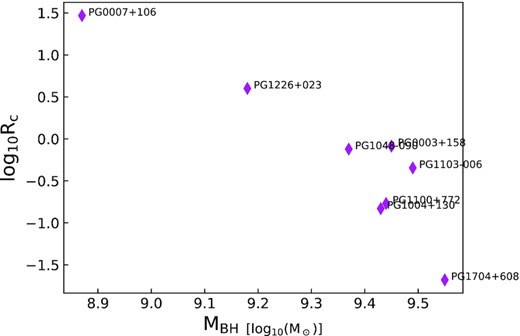
Log of radio core prominence RC versus log of BH masses (MBH/M⊙) of the quasars.
5.2 Star formation rate
The SFR for the PG quasars reported here have been obtained from Xie et al. (2021) except for PG1226+023 which was obtained from Westhues et al. (2016). The conventional methods to determine SFR for non-active galaxies (which include rest-frame UV-optical SED fitting, optical emission lines, mid-infrared (IR) flux density, e.g. Kennicutt 1998; Kennicutt & Evans 2012) may not be reliable for galaxies hosting AGNs, especially of Type I. Typically, in the rest-frame far-IR, the contrast between the typical SED of a star-forming galaxy and an AGN SED is the largest and the thermal far-IR continuum emission from cool dust grains primarily traces star formation from the host galaxy and is used in most studies (e.g. Haas et al. 2003; Dai et al. 2018). The total IR luminosity (LIR) of the host galaxy was calculated by integrating the Draine & Li (2007) component of the best-fitting LIR model. LIR was obtained from 8–1000 |$\mu$|m measurements. The SFR derived from LIR can only provide us with an upper limit for host galaxy SFR, especially for highly beamed or high-luminosity AGNs. In the case of BL Lac objects, optical emission from BL Lacs is often dominated by the nuclear source. The FIR and submillimetre also show high flux densities and synchrotron contamination from radio region due to jet triggering and beaming angle (Seal Braun 2017). Therefore, we cannot use LIR as a surrogate for SFR in the case of BL Lac objects. We find that the SFR values are not significantly different between FSRQs and SSRQs (KS test p = 0.27).
5.3 Jet power
We find a correlation between the radio core fractional polarization and the radio core spectral index (Kendall τ test p = 0.044, see Fig. 16) for the nine quasars; cores with relatively steep spectral indices have a higher fractional polarization. We note that the core spectral indices are typically flat/inverted with the exception of PG1704+608. This implies a relative dominance of unresolved jet emission in the radio core emission.
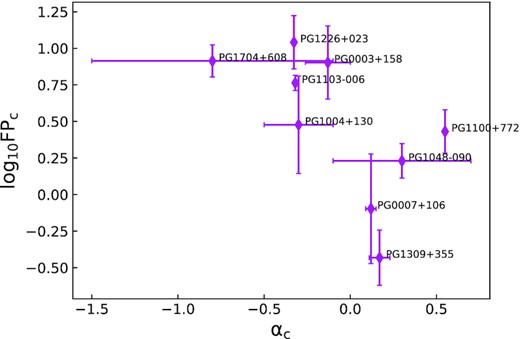
Log of radio core fractional polarization FPC (per cent) versus core spectral index αC.
We find a correlation between the radio core fractional polarization and the 150 MHz total radio luminosity (Kendall τ test p = 0.024, see Fig. 17) for the nine quasars; cores with higher fractional polarization also have higher total radio luminosity at 150 MHz. This could imply that more organized B-fields in the cores lead to higher core fractional polarization and to more radio powerful sources. Interestingly, we found no correlation between the radio core fractional polarization and the accretion rates for the nine quasars (Kendall τ test p = 0.180).
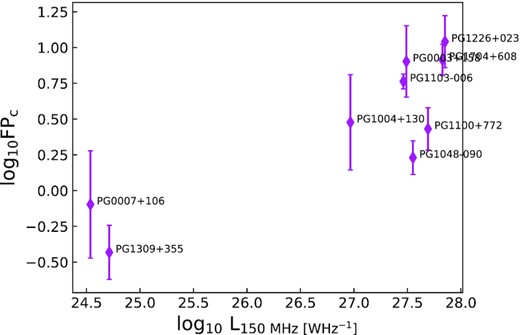
Log of radio core fractional polarization FPC (per cent) versus log of total luminosity at 150 MHz (L150 MHz) of the quasars.
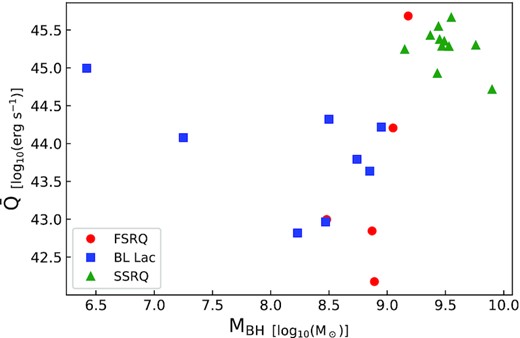
Distribution of jet power in erg s−1 versus BH masses |$\mathrm{\log _{10} (M_{BH} / M_{\odot })}$| for the PG blazar sample.
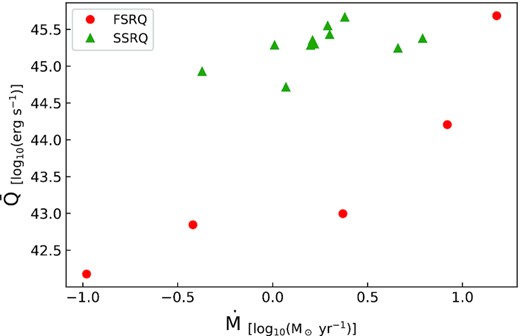
Distribution of jet power in erg s−1 versus accretion rates |$\dot{M}$| for the PG blazar sample.

Distribution of jet power in erg s−1 versus SFR |$\mathrm{\log _{10} (M_{\odot }\,yr^{-1})}$| for the PG quasars.
We looked for a correlation between jet power and accretion rates (|$\dot{M}$|) for the blazars. We obtained |$\dot{M}$| for the quasars from Davis & Laor (2011), except for the BAL QSO, PG1004+130. For this source, we have adopted an η = 0.1 value and Eddington ratio |$\dot{m_{Edd}}=0.09$| from Luo et al. (2013) and used it to compute its accretion rate. Corresponding |$\dot{M}$| values were not available for the BL Lacs. We find that the jet power is correlated with accretion rate for both FSRQs (Kendall τ test p = 0.016) and SSRQs (Kendall τ test p = 0.060) with the former being a stronger correlation. Taken together, the jet power of quasars (FSRQs + SSRQs) remains significantly correlated with the accretion rate (Fig. 19; Kendall τ test p = 0.020). Interestingly, we find that the jet power is correlated with the galactic SFR when quasars are considered collectively, (Kendall τ test p = 0.0515) but not when taken individually (Fig. 20; FSRQ Kendall τ test p = 0.0833 and SSRQ Kendall τ test p = 0.4772). We discuss the implications of this finding in the next section.
6 DISCUSSION
Our VLA observations reveal that most of the quasars have a disturbed or hybrid FRI/FRII-type radio morphology. Some of them appear to be restarted sources as well, showing clear surface brightness discontinuities between the episodes. We find that in the nine quasars studied here, the typical hotspot B-field morphology signifying a terminal shock (i.e. B-field perpendicular to the jet direction) is often seen in only one of the hotspots. The inferred B-fields in the radio cores are transverse to the jet direction in all the sources assuming optically thick emission with the exception of PG1704+608 where the B-field are aligned along the jet direction and the core emission is optically thin. The inferred B-fields are aligned parallel to the local jet directions whenever a jet or a jet knot is observed. The in-band spectral index images show that, while the radio cores in all sources exhibit flat/inverted spectral indices (with the exception of PG1704+608), the hotspots in several sources have relatively steep spectral indices. This is also consistent with the polarization structures, where the hotspots appear to not be compact terminal shocked regions, but rather locations of jet bends or bow-shock like structures. Such bow-shock like features are consistent with restarted jet activity (e.g. Clarke & Burns 1991; Silpa et al. 2021a).
Assuming that the aligned B-fields in the jets signify the dominance of a poloidal B-field component in them, and the transverse B-fields in the cores signify a dominant toroidal B-field component at the unresolved bases of the jets, then we see a transition from a toroidal field to a poloidal field along the radio jets. However, it has been suggested that the toroidal B-field component becomes more dominant and the poloidal component decays faster with distance from the core, since the poloidal field varies as r−2 and the toroidal field varies as r−1 v−1 (e.g. Begelman, Blandford & Rees 1984). One then needs to invoke some mechanism that can sustain poloidal B-fields over large distances, and explain the quasar results, such as the α-turbulence dynamo mechanism (Parker 1955). Alternately, Silpa et al. (2021a) had suggested that the transverse to poloidal B-field structure that they had detected in the case of the radio-intermediate quasar III Zw 2 was an indicator of a ‘jet+wind’ composite radio outflow. It is indeed interesting to note that the majority of the quasars (5/9) would qualify as radio-intermediate quasars (with R values ≲ 250; Falcke et al. 1996a, see Table 2).
The distorted/hybrid/restarted radio structures could be a consequence of the selection criteria of the PG sample which relies on UV-excess and a star-like nucleus. The PG quasar sample is biased towards luminous sources with high Eddington ratios (Hooper et al. 1996; Laor 2000; Jester et al. 2005). These properties are closely related to the accretion disc state of the sources and remains largely unbiased in terms of the radio properties of these sources. In principle, this could be suggesting that the kpc-scale radio emission could be influenced by the interaction with its environment. Sensitive low-frequency observations with less restrictive selection effects than earlier studies are also revealing a more complex extended source population, including candidate hybrid RGs, restarting and remnant RGs (e.g. Kapińska et al. 2017; Mingo et al. 2019; Jurlin et al. 2021).
The quasar PG1103−006 is an X-shaped source. Two primary models have been invoked in the literature to explain such sources: (1) a reorientation of the BH spin axes (Ekers et al. 1978; Dennett-Thorpe et al. 2002), (2) superposition of two independent jets produced by two SMBHs residing in the same host galaxy (Lal & Rao 2007), and (3) hydrodynamical backflows from the overpressured main jets deflected by the ellipsoidal hot interstellar medium of the host galaxy (Leahy & Williams 1984; Capetti et al. 2002). The polarization structure observed in PG1103−006 is fully consistent with the hydrodynamical backflow model as the inferred B-fields are aligned with the flow of plasma along the X-shaped lobes. It is worth noting that the S-shaped jets are consistent with jet precession, although precession cannot explain the entire structure seen in PG1103−006.
We have looked at the total radio power at 150 MHz for the sample sources w.r.t. the FR dividing line (Mingo et al. 2019) in Fig. 21. We have not corrected for Doppler boosting as we did not have reliable Doppler beaming factors for all our sources. In terms of total radio power at 150 MHz, all the nine quasars in this paper with the exception of PG0007+106 and PG1309+355 (and PG2209+184 in the larger quasar sample) have FRII-like radio powers. However, not all of them have FRII-like radio morphologies with clear terminal hotspots. It is known that in other samples of radio-loud quasars, not all possess FRII-like (with terminal hotspots) radio morphologies (e.g. Leahy & Perley 1991; Black et al. 1992; Kharb et al. 2010). Three BL Lac objects, viz., PG0851+203, PG1424+240, and PG1437+398, have FRII-like radio powers. All the remaining BL Lacs have FRI-like radio powers. Overall, the PG blazar sample sources do not follow the simple unification scheme that suggests that FRI radio galaxies are the parent population of BL Lac objects and FRII radio galaxies are the parents population of radio-loud quasars.
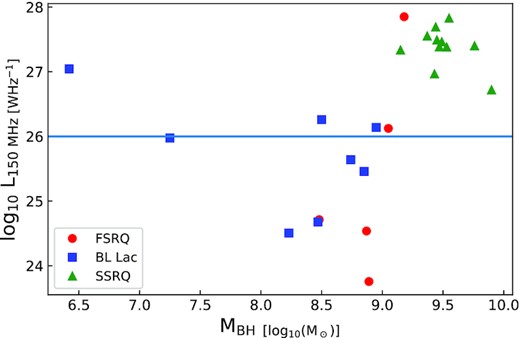
Distribution of log of total luminosity at 150 MHz (L150 MHz) for the PG ‘blazar’ sample. The blue line indicates the FRI/FRII luminosity divide derived by Mingo et al. (2019).
We find that PG quasars and BL Lacs have different BH masses, with the RL quasars having systematically larger BH masses compared to the BL Lacs. However, we also find that the SSRQs have systematically larger BH masses than the FSRQs, as well as BL Lacs and FSRQs combined. Therefore, the major difference in BH masses is between SSRQs and the ‘classical’ blazars. Gu, Cao & Jiang (2001) have shown that steep- and flat-spectrum quasars have similar distributions of BH masses compared to radio luminosity and radio loudness parameter R. However, as noted by Oshlack, Webster & Whiting (2002), disc-like line emission could change the BH mass estimates by a large factor of 2. Indeed, we find that a factor of 2 change in the BH masses of the FSRQs make them indistinguishable from the BH masses of SSRQs (KS test p = 0.1).
The optical selection criteria of the PG survey is biased against lower optical luminosity RL quasars (Oshlack et al. 2002; Jester et al. 2005). The RL quasars selected on the basis of UV excess tend to be optically luminous with larger BH masses (Oshlack et al. 2002) due to the correlation between the host’s bulge mass and the BH mass. We find an anticorrelation between BH masses and radio core prominence RC for the nine quasars studied in this paper. This could be a consequence of the line emission originating in a disc (e.g. Oshlack et al. 2002) which would then result in smaller BH masses for larger face-on quasars (see above). BH masses seem to be marginally correlated with the FPC. While this correlation could be suffering from small number statistics, in principle, it could imply a relation between BH mass and more organized/uniform B-fields in jets as they are launched from the BHs. This correlation needs to be further examined with more data.
The jet power estimates for the PG quasars discussed here come from the calculations of Punsly et al. (2018). These authors have corrected the Willott et al. (1999) relation for use in blazars by introducing the parameter |$\it f$| to account for deviations from 100 per cent filling factor, minimum energy, a low-frequency cut-off at 10 MHz, the jet axis at 60° to the LOS, and no protonic contribution, as well as energy lost expanding the lobe into the external medium, back flow from the head of the lobe, and kinetic turbulence. Willott et al. (1999) had estimated the long-term, time-averaged bulk radio jet kinetic power |$\bar{Q}$| of jets using the radio luminosity at 151 MHz as a surrogate for the luminosity of the radio lobes, motivated by the assumption that the core emission is attenuated by synchrotron self-absorption at 151 MHz. Blundell & Rawlings (2000) had estimated f to lie in the range of 10 < f < 20 for most FRII radio sources. We used an average value of 15 in this paper. This relation was proposed for FR II radio galaxies and quasars. We adopt this relation to estimate the power of jets in BL Lac objects following Cao (2003) since BL Lac objects have similar radio properties as radio quasars.
We have found a marginal correlation between the radio core fractional polarization and the radio core spectral index for the nine quasars; cores with steeper spectral indices have a higher fractional polarization. This implies a dominance of unresolved jet emission in the radio cores of these quasars.
For the entire blazar sample, the jet power appears to be significantly correlated with BH mass (Kendall τ test p = 0.0025). However, this correlation disappears when the blazar subsamples (of FSRQs, SSRQs, and BL Lacs) are considered individually, suggesting that there is not a strong correlation between these two parameters. The jet power is correlated with accretion rate for both FSRQs (Kendall τ test p = 0.016) and SSRQs (Kendall τ test p = 0.060) with the former being a stronger correlation. Taken together, the quasars (FSRQs +SSRQs) have their jet power correlated with their accretion rates (Kendall τ test p = 0.020).
We find that the jet power is correlated with the galactic SFR when quasars are considered collectively (Kendall τ test p = 0.0515), but not when taken individually (FSRQ Kendall τ test p = 0.0833 and SSRQ Kendall τ test p = 0.4772). While the marginal correlation between jet powers and the SFR in the host galaxies of the quasars could in principle be consistent with radio-mode feedback, many caveats remain (see Harrison 2017; Scholtz et al. 2018). For instance, Zhuang & Ho (2020) and Zhuang, Ho & Shangguan (2021) have found a correlation between SFR and accretion rates. Additionally, as discussed by Ward et al. (2022), specific SFR estimates are typically higher in galaxies hosting higher Eddington ratio AGN (for e.g. the PG blazars). Therefore, we cannot draw any conclusions about radio-mode AGN feedback from our current data.
7 SUMMARY AND CONCLUSIONS
In this paper, we have presented results from 6 GHz VLA polarimetric observations of nine RL quasars. These quasars are a part of our well-selected PG ‘blazar’ sample comprising six RL quasars and eight BL Lac objects. We summarize our primary findings below.
The quasars exhibit extensive polarization in their cores, jets/lobes, and hotspots, with the exception of PG1309+355, which remains largely unresolved but shows core polarization. The fractional polarization in the cores ranges from 0.8 per cent to 10 per cent and jets/lobes from 10 per cent to 40 per cent. The inferred B-fields in the radio cores are transverse to the jet direction in all the quasars assuming optically thick emission, with the exception of PG1704+608 where the B-fields are aligned along the jet direction in the optically thin radio core. The inferred B-field directions are largely aligned with the local jet direction in the jets and jet knots of the quasars. The inferred B-fields are transverse to the jet direction in several of the hotspots, consistent with B-field compression in the terminal shock regions. The inferred B-fields in several other hotspots are consistent with jet bends or bow-shock-like structures. Such bow-shock like features are consistent with restarted jet activity. The inferred B-fields in the radio lobes are mostly aligned with the lobe edges.
A large fraction of the quasars show either distorted (S- or X-shaped) morphologies, hybrid FR radio morphologies, or restarted activity; the latter is noted as a clear discontinuity in the surface brightness of different features between different episodes. The polarization structures in several hotspots are consistent with restarted jet activity. We attribute this diversity in morphology to the optical/UV selection criteria of the PG sample that remains unbiased at radio frequencies.
The polarization structure observed in the X-shaped quasar PG1103−006 is consistent with the hydrodynamical backflow model as the inferred B-fields are aligned with the flow of plasma along the optically thin X-shaped wings.
The in-band spectral index images of these nine quasars show flat/inverted spectral indices in the radio cores (with the exception of PG1704+608), while the hotspots in several sources have relatively steep spectral indices. This along with the complex polarization structures of the hotspots are also consistent with restarted jet activity in these quasars.
For the entire PG ‘blazar’ sample (BL Lacs, FSRQs, and SSRQs) we find that they do not fit neatly into the different Fanaroff–Riley total power regime at 150 MHz, as well as Fanaroff–Riley radio morphologies. Several quasar lobes lack a terminal hotspot typical of FRII radio galaxies. Correlations with BH masses appear to be affected by various selection effects related to the mass estimations for the different blazar sub-classes.
We find that the jet mechanical powers correlate with accretion rates for the 16 PG quasars. Accretion rates were not available for the PG BL Lacs. This correlation implies that higher accretion rates result in more powerful radio jets. We also find a correlation between the radio core fractional polarization and the 150 MHz total radio luminosity for the nine quasars considered here. That is, cores with higher fractional polarization also have higher total radio luminosity at 150 MHz. This can imply that more organized B-fields at the jet bases lead to higher core fractional polarization and to more radio powerful jets.
ACKNOWLEDGEMENTS
We thank the referee for their constructive suggestions that have significantly improved this manuscript. JB, PK and SS acknowledge the support of the Department of Atomic Energy, Government of India, under the project 12-R&D-TFR-5.02-0700. LCH acknowledges and was supported by the National Science Foundation of China (11721303, 11991052, 12011540375) and the China Manned Space Project (CMS-CSST-2021-A04, CMS-CSST-2021-A06). CMH acknowledges funding from an United Kingdom Research and Innovation grant (code: MR/V022830/1). For the purpose of open access, the authors have applied a Creative Commons Attribution (CC BY) licence to any Author Accepted Manuscript version arising. The National Radio Astronomy Observatory is a facility of the National Science Foundation operated under cooperative agreement by Associated Universities, Inc. This research has used the NASA/IPAC Extragalactic Database (NED), which is operated by the Jet Propulsion Laboratory, California Institute of Technology, under contract with the National Aeronautics and Space Administration. This research has used the VizieR catalogue access tool, CDS, Strasbourg, France (DOI: 10.26093/cds/vizier). The original description of the VizieR service was published in 2000, A&AS 143, 23.
DATA AVAILABILITY
The data underlying this article will be shared on reasonable request to the corresponding author. The VLA data underlying this article can be obtained from the NRAO Science Data Archive (https://archive.nrao.edu/archive/advquery.jsp) using the proposal ID: 20A-182.
Footnotes
New VLA observations have recently been approved for the remaining 15 sources.
Astronomical Image Processing System; Wells (1985)
We note that there is no 4π factor because of the anisotropic jet emission, e.g. see Peacock (1999).
