


ABSTRACT
We study a sample of single Galactic post-asymptotic giant branch (post-AGB) stars with known surface chemical composition. Gaia EDR3 and Gaia DR3 parallaxes have enabled accurate determinations of the luminosities of these objects, thus making it possible to characterize them in terms of their initial masses, chemical compositions, and progenitor ages. We used extant evolutionary sequences of asymptotic giant branch (AGB) stars produced using the ATON stellar evolutionary code extended to the post-AGB phase, specifically for this study. The luminosity and surface carbon abundance together prove to be the most valuable indicator of the previous evolution and nucleosynthetic history of the star, particularly regarding the efficiency of mixing mechanisms and the growth of the core. This analysis allows us to place the post-AGB sample into classes based on their evolutionary history on the AGB. This includes low-mass objects that evolved as M-type stars without third dredge-up, carbon stars, and intermediate-mass AGB stars with hot bottom burning (HBB). Additionally, our analysis reveals that AGB nucleosynthesis is not homogeneous, even for stars with similar initial masses and metallicities. The approach of using observations of post-AGB stars to constrain AGB and post-AGB models shed new light on still debated issues related to the AGB evolution, such as the threshold mass required to become a C-star, the minimum mass for HBB and the amount of carbon that can be accumulated in the surface regions of the star during the AGB lifetime, as well as deep mixing experienced during the red giant branch phase.
1 INTRODUCTION
The stars evolving across the asymptotic giant branch (AGB) have attracted the interest of the astrophysical community in the last decades, owing to the relevant role played in different astrophysical contexts, such as the interpretation of the chemical patterns traced by stars in the Milky Way (Romano et al. 2010) and other galaxies (Vincenzo et al. 2016; Romano et al. 2020), the formation of multiple populations in globular clusters (D’Ercole et al. 2008, 2010), the derivation of the mass of high-redshift galaxies (Maraston et al. 2006). Furthermore, AGB stars are generally regarded as important dust factories, providing a relevant contribution to the overall dust budget in the Universe, in the Local Universe, and at high redshift (Valiante et al. 2009).
The modelling of the AGB phase has been significantly improved in recent times, with a more physically sound description of some key physical mechanisms, such as the computation of low-temperature opacities in environments enriched in carbon (Marigo 2002) and a self-consistent coupling of nuclear burning and mixing of chemicals in regions of the star unstable to convection (Herwig 2000, 2005). More recent efforts were devoted to include the description of dust formation in the AGB winds (Ventura et al. 2012, 2014; Nanni et al. 2013, 2014), which allowed the study of evolved stellar populations in the Magellanic Clouds (Dell’Agli et al. 2014a, 2015a,b; Nanni et al. 2016, 2018, 2019) and other galaxies in the Local Group (Dell’Agli et al. 2016, 2018b, 2019a,b).
Despite the recent improvements, the robustness of the results provided by the modelling of the AGB phase is hampered by the poor knowledge, from first principles, of some physical mechanisms that deeply affect the internal structure and the evolution of AGB stars, primarily convection and mass-loss (Karakas & Lattanzio 2014). Non-local models of the convective instability and self-consistent descriptions of mass-loss are currently being developed. However, the comparison with the observational evidence is presently the only possibility to provide valuable indications of the efficiency of some physical mechanisms, particularly those affecting directly the surface chemical composition of the stars (e.g., Kamath et al. 2012; Lugaro et al. 2012; Cristallo et al. 2015; Karakas & Lugaro 2016; Karakas et al. 2018; Ventura et al. 2018). Indeed the knowledge of the surface chemistry of evolved stars proves extremely useful to their characterization, as it is extremely sensitive to the balance between various mechanisms, such as hot bottom burning (HBB; Blocker & Schonberner 1991) and third dredge-up (TDU; Iben 1974), which produce different chemical patterns. The latter phenomenon favours an enrichment in the surface 12C. The activation of HBB results in the depletion of the surface 12C and the synthesis of 14N, which increases by ∼1 dex; the surface 12C/13C ratio is expected to reach the equilibrium value ∼3–4. Further consequences of the ignition of HBB are the synthesis of lithium, via the Cameron & Fowler (1971) mechanism, and the production of sodium. In the metal-poor domain, further nuclear channels are activated, such as the Mg–Al–Si nucleosynthesis (Dell’Agli et al. 2018a).
A valuable approach to infer information on the evolution of AGB stars is offered by the study of post-AGB stars. The chemical composition of these objects reflects the final surface chemistry, at the end of the AGB phase, and is determined by the combination of TDU and HBB. On the observational side, determination of the surface chemical composition of post-AGB stars is easier than for AGBs, since molecular veiling dominates the spectra of AGB stars (e.g. García Hernández et al. 2006, 2009). In addition, the most extreme AGBs are heavily obscured and escape detection (and chemical abundance studies) in the optical range (e.g. García Hernández et al. 2007) and/or they may display extremely complex near-infrared spectra (e.g. McSaveney et al. 2007). On the other hand, during the brief post-AGB phase, the warm stellar photosphere makes it possible to quantify photospheric abundances for a very wide range of elements (Reyniers & Van Winckel 2003). These include elements such as carbon (C), nitrogen (N), and oxygen (O), up to the heaviest slow neutron-capture elements, i.e. s-process elements, such as strontium (Sr), zirconium (Zr), barium (Ba), lanthanum (La), lead (Pb), and elements in between.
An additional point in favour of studying post-AGB objects is that the excursion to the blue, towards the planetary nebulae phase, occurs at a substantially constant luminosity, which depends on the core mass at the end of the AGB. The latter quantity is tightly connected with mass and metallicity of the progenitor, which allows for a direct comparison between the observed surface abundances and the expectations from stellar evolution modelling. Therefore, the determination of the luminosity of post-AGB stars, combined with the knowledge of their surface chemical composition, allows not only to study the details of the post-AGB phase, but also to draw important information on the previous AGB evolution.
This approach has been so far only partially applied to Galactic post-AGB stars, owing to the poor knowledge of their distances, which has prevented an accurate estimate of their luminosities. Astrometric solutions (e.g. parallaxes) from Gaia are partly removing this limitation, by providing distances and luminosities from a growing sample of post-AGB stars, with known chemical composition. The combined information of luminosity and chemical composition (metallicity and mass fractions of CNO, iron-peak elements, and s-process elements) of a sample of 31 Galactic single post-AGB sources have been recently published by Kamath et al. (2022, hereafter Paper I).
The goal of this work is to study the sample of stars presented in Paper I, by comparing results from observations with predictions from AGB evolution modelling. We use AGB models by our group, already available in the literature, complemented by new evolutionary sequences, extended to the post-AGB phase, when required. This study is the first step towards the development of a methodology aimed at the interpretation and the characterization of a comprehensive sample of post-AGB stars observed in the Galaxy, to reconstruct their evolutionary history, opening the way to the use of these stars to draw information on the chemical evolution, the metal enrichment, and the star-formation history of their host system.
In the following, we describe the main features of the AGB evolution, the stellar evolution models upon which this analysis is based, and the methodology followed to characterize the individual sources. We will mainly focus on the objects with the best-quality flags, discussing how these observations can be used to shed new light on still debated issues regarding the AGB phase, such as the mass threshold required to reach the C-star stage and the occurrence of HBB. Some peculiar cases, hardly explained based on canonical stellar evolution modelling, are also commented.
2 THE CHEMICAL COMPOSITION OF AGB STARS, ON THEIR PATH TO THE POST-AGB PHASE
The evolution of the stars through the AGB phase is extensively described in dedicated reviews, such as those by Herwig (2005), and more recently by Karakas & Lattanzio (2014). During the AGB phase, the surface chemistry of the stars changes under the effects of TDU and/or by HBB. The efficiency of these mechanisms depends on the initial mass of the star; thus, the modification of the surface chemistry changes significantly with the stellar mass. We can broadly distinguish the following four different behaviours:
Stars that start the AGB phase with mass below ∼1 M⊙ experience a few thermal pulses (TPs) before the envelope is lost. These objects fail to reach the C-star stage; thus, they evolve through the post-AGB phase as M-type stars. The final surface composition of these stars shows little (if any) carbon and s-process enrichment, whereas some nitrogen enrichment of the order of ∼0.5 dex is expected, owing to the first dredge-up (FDU) experienced during the red giant branch (RGB) phase.
Stars of mass in the 1–3 M⊙ range experience a series of TDU events during the AGB lifetime, which eventually turn these objects into carbon stars. The surface chemistry is characterized by significant s-process and carbon enrichment, plus some nitrogen enhancement, connected to the FDU. Some oxygen enrichment is also expected, though much smaller than the carbon enhancement.
3–4 M⊙ stars experience both TDU and HBB. They are expected to enter the post-AGB with surface chemistry enriched in carbon and s-process. The nitrogen is expected to be significantly higher (a factor of 10 or more) than the initial content, owing to the effects of HBB, which produces N via proton captures onto carbon nuclei.
The surface chemistry of M > 4 M⊙ stars is largely affected by HBB; thus, it reflects the equilibria of CNO nucleosynthesis, with large nitrogen enhancement. During the final AGB phases, after HBB is turned off, some late-TDU episodes might rise the surface carbon and favour further s-process enrichment. This possibility, still debated, might be tested by the study of the surface chemistry of post-AGB stars descending from massive AGB progenitors.
The threshold masses given earlier must be considered as approximate values, which are sensitive to the metallicity and the modelling of the star. The minimum masses required to reach the C-star stage and to ignite HBB decrease with metallicity (Karakas & Lattanzio 2014).
We present a more exhaustive explanation of the above arguments in the Appendix.
3 AGB AND POST-AGB MODELLING
We use AGB models of stars of different mass, with metallicities 10−3 < Z < 0.014, which correspond to the |$-1.3\ \lt\ [\rm {Fe}/\rm {H}]\ \lt\ 0$| range, thus allowing the study of all the sources investigated in Paper I. These models were presented in Ventura et al. (2014) for the metallicities Z = 0.001, Z = 0.002, and Z = 0.004; in Marini et al. (2021), for Z = 0.008; and in Ventura et al. (2018), for Z = 0.014. The interested reader is referred to these papers for the details on the physical input used to calculate the evolutionary sequences and the main physical and chemical properties of the model stars. We give here only the following assumptions adopted, most relevant for this work:
The temperature gradient within regions of the star unstable to convection are found via the full spectrum of turbulence (hereafter FST) model (Canuto & Mazzitelli 1991);
Extra mixing is assumed from convective borders during the AGB phase, by assuming an exponential decay of convective velocities, with an e-folding distance of |$0.002\ \rm {\mathit{ H}}_{\rm p}$|, the latter quantity being evaluated at the formal border, fixed via the Schwarzschild criterion;
Mass-loss during the AGB phase of oxygen-rich stars is modelled according to Bloecker (1995), the free parameter ηR entering the Bloecker (1995) recipe is set to ηR = 0.02, in agreement with the calibration given in Ventura, D’Antona & Mazzitelli (2000). During the carbon star phases, the treatment published by the Berlin group (Wachter et al. 2002, 2008) was adopted; and
The computation of the surface molecular opacities takes into account changes in the mixture connected to carbon enrichment, according to the schematization by Marigo & Aringer (2009).
The AGB computations mentioned above were extended until the very end of the AGB phase, when the mass of the envelope was reduced to below a few tenths of solar masses; the only exception are the Z = 0.008 models published in Marini et al. (2020), which are extended to the post-AGB phase. This study requires the determination of the luminosity expected during the post-AGB evolution, which, in turn, demands detailed modelling of the transition from the AGB to the post-AGB phase. For these reasons the afore-mentioned evolutionary sequences were extended to the post-AGB phase; this was limited to the model stars whose post-AGB luminosities overlap with those of the Paper I sample. This study also required the computation of the evolutionary sequences of M < 1 M⊙ stars, not included in the papers cited earlier. The extension of the computations to the post-AGB phase required a few adjustments to the numerical structure of the stellar evolution code, consisting in the adoption of shorter time-scales and in the freezing of the rezoning of the mesh points for a limited number of models, following the beginning of the contraction to the post-AGB phase. Numerical experiments showed that the results obtained in terms of the post-AGB luminosity and surface chemistry are independent of the details of the choices of the time-steps adopted. Further details of the methodology followed to model the post-AGB phase are given in Marini et al. (2020).
For model stars of initial mass above 3 M⊙, the detailed modelling of the transition to the post-AGB phase was hampered by the numerical difficulties connected to the development of a local opacity maximum caused by M-shell electrons of iron group species, which inhibits convergency (Lau et al. 2012). In these cases, we could extend the computations until the mass of the envelope drops below 0.1 M⊙, the effective temperature is slightly above 3000 K, and the general contraction towards the post-AGB phase has started. Given the relatively short evolutionary time-scales of AGB stars descending from massive progenitors, no further significant increase in the core mass is expected to take place: therefore, the luminosity reached by the model stars during the phase when the numerical instabilities started can be safely considered as representative of the post-AGB phase. We checked that in all the cases considered HBB was already turned off by the gradual loss of the envelope; thus, no further modification due to CN (or CNO) nucleosynthesis is expected. The only mechanism potentially able to alter the surface chemistry is the occurrence of a very late TP followed by a TDU episode that would favour a significant increase in the surface 12C, thus triggering important deviations from the chemical composition reported in Table 1. While this possibility cannot be definitively ruled out, we believe it extremely unlikely. Indeed we find that in these stars during the final TPs experienced the TDU events become less and less efficient as the envelope is gradually consumed by stellar winds, and that no TDU took place after the two last TPs experienced before the computations stopped. Therefore, we do not expect any significant change in the surface chemistry, even in the case that a late TP is experienced.
The post-AGB luminosity (column 2), core mass (column 3), and surface CNO mass fractions (columns 4, 5, and 6) of model stars of different mass (column 1) and metallicity. The initial masses refer to the beginning of the AGB phase. For the 3.5 M⊙ model star of metallicity Z = 4 × 10⁻³ and for the 3.5 and 4 M⊙ model stars of metallicity Z = 8 × 10⁻³, the values of core mass and luminosity refer to the point when the evolutionary computations stopped owing to numerical difficulties, which happened when the mass of the envelope was ∼0.1 M⊙.
| |$\rm {\it{M}}/\rm {M}_{\odot }$| | L/L⊙ | |$\rm {\it{M}}_{\rm core}/\rm {M}_{\odot }$| | [C/Fe] | [N/Fe] | [O/Fe] |
|---|---|---|---|---|---|
| Z = 10−3 | |||||
| 0.70 | 3850 | 0.55 | −0.04 | 0.55 | 0.40 |
| 0.75 | 4100 | 0.565 | −0.04 | 0.56 | 0.40 |
| 0.80 | 4300 | 0.561 | 0.80 | 0.56 | 0.40 |
| 0.85 | 4500 | 0.565 | 0.82 | 0.57 | 0.40 |
| 0.95 | 5050 | 0.567 | 1.50 | 0.57 | 0.51 |
| 1.25 | 7000 | 0.58 | 2.45 | 0.58 | 0.60 |
| 1.50 | 7600 | 0.593 | 2.12 | 0.59 | 0.80 |
| Z = 2 × 10⁻³ | |||||
| 0.75 | 4000 | 0.560 | −0.05 | 0.57 | 0.40 |
| 0.77 | 4700 | 0.564 | 0.00 | 0.57 | 0.40 |
| 0.78 | 4800 | 0.565 | 0.42 | 0.57 | 0.40 |
| 0.80 | 4800 | 0.562 | 1.01 | 0.57 | 0.40 |
| 0.90 | 5300 | 0.565 | 1.06 | 0.57 | 0.40 |
| 1.00 | 5400 | 0.57 | 1.30 | 0.58 | 0.45 |
| 1.10 | 5900 | 0.572 | 1.51 | 0.58 | 0.49 |
| 1.25 | 6500 | 0.584 | 1.65 | 0.58 | 0.50 |
| Z = 4 × 10⁻³ | |||||
| 0.80 | 4500 | 0.564 | −0.02 | 0.10 | 0.20 |
| 0.85 | 5250 | 0.571 | 0.00 | 0.12 | 0.20 |
| 0.90 | 5100 | 0.564 | 0.83 | 0.15 | 0.20 |
| 1.00 | 5400 | 0.566 | 0.92 | 0.21 | 0.20 |
| 1.25 | 5900 | 0.573 | 0.98 | 0.30 | 0.26 |
| 1.50 | 6700 | 0.582 | 1.09 | 0.36 | 0.29 |
| 1.75 | 7800 | 0.588 | 1.25 | 0.41 | 0.29 |
| 2.00 | 7850 | 0.60 | 1.25 | 0.48 | 0.38 |
| 2.50 | 10 100 | 0.63 | 1.51 | 0.53 | 0.50 |
| 3.00 | 16 050 | 0.75 | 1.32 | 0.47 | 0.55 |
| 3.50 | 19 000 | 0.84 | 0.63 | 1.52 | 0.30 |
| Z = 8 × 10⁻³ | |||||
| 0.75 | 4000 | 0.55 | 0.0 | 0.30 | 0.20 |
| 0.80 | 4200 | 0.557 | 0.0 | 0.30 | 0.20 |
| 0.85 | 5100 | 0.564 | 0.0 | 0.30 | 0.20 |
| 0.90 | 5550 | 0.574 | 0.0 | 0.30 | 0.20 |
| 0.95 | 5500 | 0.571 | 0.58 | 0.30 | 0.20 |
| 1.00 | 6200 | 0.584 | 0.44 | 0.32 | 0.22 |
| 1.25 | 6500 | 0.59 | 0.60 | 0.30 | 0.23 |
| 1.50 | 7450 | 0.602 | 0.59 | 0.36 | 0.24 |
| 1.75 | 8300 | 0.632 | 0.69 | 0.39 | 0.20 |
| 2.0 | 8200 | 0.617 | 0.80 | 0.44 | 0.20 |
| 2.5 | 8600 | 0.606 | 1.12 | 0.55 | 0.26 |
| 3.0 | 9300 | 0.66 | 1.14 | 0.57 | 0.50 |
| 3.5 | 21 500 | 0.79 | 0.35 | 1.55 | 0.36 |
| 4.0 | 23 000 | 0.87 | 0.22 |
A summary of the predicted post-AGB properties is reported in Table 1, where the post-AGB luminosities, core masses, and surface abundances of the CNO species are given, for model stars of various mass and metallicity. For |$\rm {\it{M}} \le 2\ \rm {M}_{\odot }$| stars, undergoing the helium flash, the masses reported in column 1 refer to the values at the beginning of the core helium burning phase, thus neglecting the mass-loss taking place during the RGB: Therefore, those masses must be considered as lower limits of the progenitors’ mass, particularly for |$\rm {\it{M}}\ \lt\ 1.5\ \rm {M}_{\odot }$| stars, which experience mass-losses of the order of |$0.1{-}0.2\ \rm {M}_{\odot }$| during the RGB evolution.
All the results reported in Table 1 refer to evolutionary sequences where no late TP occurred during the transition from the AGB to the post-AGB phase. The possibility that a late TP takes place while the star is contracting at constant luminosity was explored by Bloecker & Schoenberner (1997), who found that the star keeps virtually its original chemical composition, since the small envelope mass limits the depth penetration of the envelope convection. We could verify that this is the case in the very few evolutionary sequences when a late TP was found. The only case examined by Bloecker & Schoenberner (1997) where the chemical composition is exposed to significant changes is the occurrence of a very late TP, during the cooling sequence to the White Dwarf stage. This event would lead to an H-deficient chemistry, strongly enriched in helium, carbon, and s-process. In this work, this possibility is not considered.
In the right-hand panel of Fig. 1, we present the post-AGB luminosities of model stars (full circles) of different initial mass, as a function of the surface carbon at the end of the AGB phase: Solid lines connect results corresponding to same metallicity. The evolutionary sequences trace an anticlockwise trend with mass. The tracks first move to the right, as the higher the initial mass of the star, the higher the number of TP and TDU events experienced, the larger the surface carbon enrichment. Little increase in the luminosity is found in the initial part of the tracks, because |$\rm {\it{M}} \le 2\ \rm {M}_{\odot }$| stars develop core electron degeneracy during the RGB evolution; thus, they start the AGB phase with similar core masses. This part of the tracks corresponds to the cases (1) and (2) discussed in Section 2.
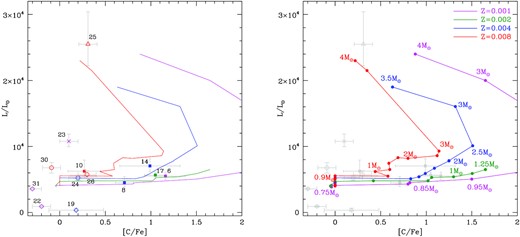
Surface carbon and luminosity of the post-AGB stars flagged as Q1 in Paper I, overimposed to results from stellar evolution modelling, represented by the solid lines, that connect the expected carbon and luminosity of model stars of different mass and same metallicity. The colour coding used for the lines is reported in the right-hand panel. Stars showing s-process enrichment are represented with full circles, whereas open points refer to sources with no sign of any s-process enrichment. The meaning of the symbols used to represent the different sources is as follows: circles – low-mass stars, not experiencing any TDU episode; squares – stars that experienced TDU and not HBB; triangles – stars that experienced both TDU and HBB; asterisks – stars that suffered an early loss of the external envelope; and diamonds – stars that failed to reach the AGB phase.
The left turn of the tracks for masses ∼2.5–3 M⊙ is connected with the activation of HBB, which destroys the surface carbon previously accumulated via TDU [case (3) of Section 2]. In this case, the luminosity increases with the (initial) mass of the star, as the AGB and post-AGB core masses are sensitive to the mass of the star in this mass domain. For M ∼ 4 M⊙, no surface carbon enrichment is expected, owing to the prevailing role of HBB over TDU in changing the surface chemical composition [case (4) of Section 2].
All the [N/Fe] quantities reported in Table 1 are positive, with most of the model stars reaching the post-AGB phase with [N/Fe] ∼ 0.3–0.5. This is mostly related to the effects of FDU. Note that the N values reported in Table 1 must be considered as lower limits, as no RGB deep mixing related to e.g. thermohaline mixing (Eggleton, Dearborn & Lattanzio 2006) or rotation (Charbonnel 1995) was considered in the models used in this investigation. |$\rm {\it{M}} \ge 3.5\ \rm {M}_{\odot }$| model stars are characterized by large N abundances [N/Fe] > 1, a signature of the HBB experienced during the AGB.
From the oxygen abundances reported in Table 1, we see that no change in the surface 16O is expected in |$\rm {\it{M}}\ \lt\ 1\ \rm {M}_{\odot }$| stars, as FDU leaves the surface oxygen unchanged, and the TDU episodes are too few (if any) and in any case not sufficiently deep to trigger a modification in the surface oxygen. Higher mass stars experience a higher number of TDU events, sufficiently deep to reach regions of the stars enriched in 16O, which leads to an increase in the post-AGB [O/Fe] > 0. The largest oxygen enhancement, δ[O/Fe] ∼ 0.3, is found in |$\sim\!{3}\ \rm {M}_{\odot }$| stars, which experience the highest number of TDU events.
4 THE CHARACTERIZATION OF POST-AGB STARS
In Table 2, we present the post-AGB sources used in this investigation, their effective temperatures, luminosities, and CNO abundances (from Paper I). All the objects considered are likely either single stars or stars with undetermined wide orbits such that the binary interaction during evolution is limited and they likely evolve as single stars. We retain Paper I’s classification of the objects into s-process enriched and non-s-process enriched. Additionally, we also consider the quality flags proposed in Paper I, wherein Q1 (Quality 1) denotes objects with good astrometric solutions and Q2 (Quality 2) denotes objects with probably unreliable astrometry (see Paper I for more details). We note that while Paper I was based on the Gaia EDR3 astrometric solutions, we have checked the recent Gaia DR3 data and we find no change in astrometric solutions (and hence derived luminosities) between the Gaia EDR3 and Gaia DR3. In Table 2, the objects are allocated unique ID numbers which we use in the following sections and figures. For the benefit of the reader, we also tabulate the main results of this study: progenitor masses and the predicted chemistry for each object, as elaborated in the following sections.
Fundamental physical and chemical properties of the post-AGB sources discussed in Paper I. The last two columns report the mass of the progenitor (at the beginning of the AGB phase) and the physical mechanisms most relevant for the variation of the surface chemistry based on our interpretations.
| Index | Object | |$\rm {\it{T}}_{\rm eff}$| | L/L⊙ | [Fe/H] | C/O | [C/Fe] | [N/Fe] | [O/Fe] | Flag | M | Chemistry |
|---|---|---|---|---|---|---|---|---|---|---|---|
| s-Process-enriched stars | |||||||||||
| 1 | IRAS Z02229+6208 | 5952 | 12959 | −0.45 ± 0.14 | – | 0.78 ± 0.15 | 1.19 ± 0.15 | – | Q2 | 3–3.5 M⊙ | TDU + HBB |
| 2 | IRAS 04296+3429 | 7252 | 10009 | −0.62 ± 0.11 | – | 0.8 ± 0.2 | 0.39 ± 0.2 | – | Q2 | 1–1.5 M⊙ | TDU |
| 3 | IRAS 05113+1347 | 5025 | 2037 | −0.49 ± 0.15 | 2.42 ± 0.40 | 0.65 ± 0.16 | – | 0.01 ± 0.27 | Q2 | 1–1.3 M⊙ | TDU |
| 4 | IRAS 05341+0852 | 6274 | 324 | −0.54 ± 0.11 | 1.06 ± 0.30 | 1.03 ± 0.10 | – | 0.75 ± 0.11 | Q2 | 0.5–0.6 M⊙ | FLASH |
| 5 | IRAS 06530−0213 | 7809 | 4687 | −0.32 ± 0.11 | 1.66 ± 0.39 | 0.83 ± 0.13 | – | 0.35 ± 0.11 | Q2 | 1.5–2 M⊙ | TDU |
| 6 | IRAS 07134+1005 | 7485 | 5505 | −0.91 ± 0.20 | 1.24 ± 0.29 | 1.16 ± 0.22 | 0.57 ± 0.19 | 0.81 ± 0.19 | Q1 | 0.9–1.2 M⊙ | TDU |
| 7 | IRAS 07430+1115 | 5519 | 20 | −0.31 ± 0.15 | 1.71 ± 0.30 | 0.79 ± 0.13 | – | 0.30 ± 0.22 | Q2 | 0.5–0.6 M⊙ | FLASH |
| 8 | IRAS 08143−4406 | 7013 | 4509 | −0.43 ± 0.11 | 1.66 ± 0.39 | 0.71 ± 0.10 | 0.01 ± 0.22 | 0.19 ± 0.13 | Q1 | 1–1.5 M⊙ | TDU |
| 9 | IRAS 08281−4850 | 7462 | 9584 | −0.26 ± 0.11 | 2.34 ± 0.42 | 0.75 ± 0.21 | – | 0.12 ± 0.11 | Q2 | 1.5–2 M⊙ | TDU |
| 10 | IRAS 12360−5740 | 7273 | 6258 | −0.40 ± 0.15 | 0.45 ± 0.20 | 0.27 ± 0.18 | 0.22 ± 0.32 | 0.31 ± 0.05 | Q1 | 1–1.5 M⊙ | TDU |
| 11 | IRAS 13245−5036 | 9037 | 11221 | −0.30 ± 0.10 | 1.11 ± 0.30 | 0.57 ± 0.21 | – | 0.26 ± 0.13 | Q2 | 1.5–2 M⊙ | TDU |
| 12 | IRAS 14325−6428 | 7256 | 4935 | −0.56 ± 0.10 | 2.27 ± 0.40 | 1.18 ± 0.23 | 0.18 ± 0.20 | 0.57 ± 0.09 | Q2 | 1.5–2 M⊙ | TDU |
| 13 | IRAS 14429−4539 | 9579 | 5049 | −0.18 ± 0.11 | 1.29 ± 0.26 | 0.68 ± 0.23 | – | 0.31 ± 0.12 | Q2 | 1.5–2 M⊙ | TDU |
| 14 | IRAS 19500−1709 | 8239 | 7053 | −0.59 ± 0.10 | 1.02 ± 0.17 | 0.99 ± 0.06 | 0.41 ± 0.30 | 0.72 ± 0.04 | Q1 | 1.5–2 M⊙ | TDU |
| 15 | IRAS 20000+3239 | 5478 | 14342 | −1.4 ± 0.2 | – | 1.7 ± 0.2 | 2.1 ± 0.2 | – | Q2 | 3–3.5 M⊙ | TDU + HBB |
| 16 | IRAS 22223+4327 | 6008 | 2163 | −0.3 ± 0.11 | 1.04 ± 0.22 | 0.59 ± 0.06 | 0.15 ± 0.30 | 0.31 ± 0.06 | Q2 | 0.5–0.6 M⊙ | FLASH |
| 17 | IRAS 22272+5435 | 5325 | 5659 | −0.77 ± 0.12 | 1.46 ± 0.26 | 1.05 ± 0.07 | – | 0.63 ± 0.02 | Q1 | 1–1.3 M⊙ | TDU |
| 18 | IRAS 23304+6147 | 6276 | 7712 | −0.81 ± 0.2 | 2.8 ± 0.2 | 0.91 ± 0.12 | 0.47 ± 0.15 | 0.17 ± 0.03 | Q2 | 2–2.5 M⊙ | TDU |
| Non-s-process-enriched stars | |||||||||||
| 19 | IRAS 01259+6823 | 5510 | 340 | −0.6 ± 0.1 | 0.4 ± 0.3 | 0.18 ± 0.15 | – | 0.31 ± 0.06 | Q1 | 0.5–0.6 M⊙ | FDU |
| 20 | IRAS 08187−1905 | 5772 | 2619 | −0.6 ± 0.1 | – | 0.62 ± 0.15 | 0.49 ± 0.3 | 0.26 ± 0.1 | Q2 | 0.5–0.6 M⊙ | FLASH |
| 21 | SAO 239853 | 7452 | 23490 | −0.81 ± 0.1 | – | 0.4 ± 0.15 | 0.6 ± 0.2 | 0.8 ± 0.2 | Q2 | 4–5 M⊙ | HBB |
| 22 | HD 107369 | 7533 | 910 | −1.1 ± 0.1 | – | <−0.2 | 0.49 ± 0.3 | 0 ± 0.2 | Q1 | 0.5–0.6 M⊙ | FDU |
| 23 | HD 112374 | 6393 | 10777 | −1.2 ± 0.1 | – | 0.1 ± 0.2 | 0.5 ± 0.2 | 0.8 ± 0.2 | Q1 | 2.5–3 M⊙ | FDU, TDU |
| 24 | HD 133656 | 8238 | 5227 | −0.7 ± 0.1 | – | 0.3 ± 0.2 | 0.5 ± 0.2 | 0.6 ± 0.2 | Q1 | 0.8–1 M⊙ | FDU |
| 25 | HR 6144 | 6728 | 25491 | −0.4 ± 0.1 | – | 0.3 ± 0.2 | 0.9 ± 0.2 | 0.3 ± 0.2 | Q1 | 4–5 M⊙ | HBB |
| 26 | HD 161796 | 6139 | 5742 | −0.3 ± 0.1 | – | 0.3 ± 0.2 | 1.1 ± 0.2 | 0.4 ± 0.2 | Q1 | 1–1.2 M⊙ | FDU |
| 27 | IRAS 18025−3906 | 6154 | 2324 | −0.51 ± 0.15 | 0.43 | 0.46 ± 0.2 | 0.74 ± 0.2 | 0.56 ± 0.2 | Q2 | 0.8–1 M⊙ | FDU, TDU |
| 28 | HD 335675 | 6082 | 15843 | −0.9 ± 0.2 | 0.25 | 0.4 ± 0.35 | <0.27 | 0.77 ± 0.19 | Q2 | – | – |
| 29 | IRAS 19386+0155 | 6303 | 9611 | −1.1 ± 0.14 | – | 0.1 ± 0.2 | – | – | Q2 | 0.7–0.8 M⊙ | FDU |
| 30 | IRAS 19475+3119 | 8216 | 6775 | −0.24 ± 0.15 | 0.19 | −0.09 ± 0.30 | – | 0.30 ± 0.02 | Q1 | 0.8–1 M⊙ | FDU |
| 31 | HR 7671 | 6985 | 3579 | −1.6 ± 0.1 | 0.05 | −0.57 ± 0.13 | 0.51 ± 0.16 | 0.46 ± 0.05 | Q1 | 0.5–0.6 M⊙ | FDU |
To characterize the individual post-AGB sources, we compare the observed chemical composition and the derived luminosities with the results from Section 3 from stellar evolution modelling. We refer to the values reported in Table 1 in the following discussion.
The luminosity of post-AGB stars provides valuable information to characterize the individual sources, as it is tightly connected with the core mass, thus with the initial mass of the star, which, in turn, allows the determination of the age and formation epoch of the progenitors. The luminosity of post-AGB stars is a more robust indicator of the core mass and hence of the initial mass of the star than the AGB luminosities, because the latter are subject to variations related to the occurrence of TPs and to variability, whereas no significant variations in the overall energy flux is expected during the post-AGB phase.
Among the chemical species involved in CNO cycling, we deduce from the values reported in Table 1 that the surface carbon, in particular the [C/Fe] quantity, is the most sensitive to the stellar mass and metallicity. This is because the gradual accumulation of 12C in the external regions of the star depends of the number of TDU events experienced, which grows with the mass of the star (see also Fig. A2 in the Appendix). The tight link between the surface carbon and the mass of the star holds even in the massive AGB domain where HBB is activated, as the most relevant effect of HBB is the destruction of the surface carbon.1
The nitrogen content of post-AGB stars is less sensitive than carbon to the progenitor mass in the M < 3 M⊙ mass domain [cases (1) and (2) in Section 2], because no significant changes in the surface 14N are expected to occur during the AGB phase; thus, the differences in the surface nitrogen are only connected to the different efficiencies of the FDU, which is dependent upon initial mass and is deepest at around 2.5 |$\rm{M}_{\odot}$| (see Boothroyd & Sackmann 1999). A significant rise in the nitrogen content is found for stars experiencing HBB [cases (3) and (4) of Section 2], descending from |$\rm {\it{M}}\ \gt\ 3\ \rm {M}_{\odot }$| progenitors.
Overall, both [C/Fe] and [N/Fe] span a ∼1 dex range (see Table 1); however, [C/Fe] is much more tightly connected to the mass of the star than [N/Fe]. This is the main motivation behind our choice of basing this analysis primarily on the carbon abundances of the individual sources. Furthermore, [N/Fe] is available for only |$\sim\!{50}{{\ \rm per\ cent}}$| of the sample stars.
Use of the oxygen abundance for the characterization of the sources in the sample discussed here is not trivial, considering the behaviour of the surface 16O during the life of the star. Unlike carbon and nitrogen, no significant variation in the surface oxygen is expected during the RGB evolution. Oxygen depletion due to HBB is expected in metal-poor massive AGBs (Ventura et al. 2013; Dell’Agli et al. 2018a) and in extremely metal-poor |$\rm {\it{M}} \ge 3\ \rm {M}_{\odot }$| stars (Ventura et al. 2021); we do not expect to see any trace of this in the given context, as we will show that the sample stars from Paper I descend from slightly subsolar |$\rm {\it{M}} \le 4\ \rm {M}_{\odot }$| progenitors. Regarding low-mass stars (|$\rm {\it{M}} \le 3\ \rm {M}_{\odot }$| progenitors), we see in Table 1 that some oxygen enrichment is found in model stars within the |$2{-}3\ \rm {M}_{\odot }$| mass range. The expected increase in the surface 16O is within 0.3 dex, thus much smaller than the variation of carbon and comparable with the typical errors associated to the derived abundances. A further issue connected to the use of oxygen for the characterization of post-AGB stars is that the initial oxygen content is sensitive to the α-enhancement of the gas from which the star formed; the signature of the α-enhancement will unfortunately leave the imprinting on the post-AGB oxygen, because, unlike carbon and nitrogen, no significant changes that might erase the initial content are expected during the RGB and AGB phases.
On the basis of this discussion, we will consider the luminosity and the surface carbon of post-AGB stars as the most reliable witnesses of the previous AGB evolution of the individual sources, thus the most relevant factors to characterize the stars, in terms of mass and formation epoch of the progenitors, and of the efficiency of the different mechanisms which contributed to the modification of the surface chemical composition. This is the motivation for the choice of the carbon–luminosity plane as the privileged working tool for this investigation, on which comparing the observations with results from stellar evolution modelling, from the infancy of the stars until the post-AGB, the phase that the sources in the sample stars are nowadays evolving through. The conclusions drawn from this analysis will be further strengthened or disregarded by looking for consistency, whenever possible, with the observed nitrogen and oxygen abundances, which are important to test the efficiency of physical mechanisms other than TDU, such as deep mixing during the RGB and the activation of HBB.
In Fig. 1 (left-hand panels), the surface carbon and luminosity of the sample stars reported in Paper I, flagged as Q1, are compared with those derived from evolutionary calculations and discussed in Section 3. The sources are indicated with various symbols, each corresponding to the interpretation given in this study, and different colours, according to the metallicity.
The sample stars showing s-process enrichment, represented with filled symbols in Fig. 1, are mostly composed by 1–1.5 M⊙ stars of sub-solar metallicity, which experienced a series of TDU events. This group, which corresponds to the case (2) discussed in Section 2, consists of five stars, indicated with squares in the figure, formed earlier than 2 Gyr ago. They are not expected to evolve at luminosities above ∼8000 L⊙ (see Table 1), which is consistent with the observations. The surface nitrogen, available for all these sources but ID 17, is 0 < [N/Fe] < 0.6 in all cases, consistent with the N enhancement due to the FDU.
The stars exhibiting no sign of s-process enrichment are shown in Fig. 1 with open symbols. Three out of these sources, indicated with open circles, are interpreted as descending from low-mass progenitors, of initial mass below |$\sim\!1\ \rm {M}_{\odot }$|, which followed the evolution described in point (1) of Section 2. This conclusion is based on the surface chemical composition, with [C/Fe] < 0.5 in all cases, and the nitrogen abundances, in agreement with the expectations from FDU [the only exception is HD 161796, (ID 26) with [N/Fe] = 1.1, which we discuss separately in Section 7]. Furthermore, their luminosities are within the error bar consistent with those expected for the progeny of 0.8–1 M⊙ stars, when evolving through the post-AGB phase.
These are the oldest objects in the sample examined, formed definitively earlier than 5 Gyr ago.2 According to our understanding these stars started the AGB phase with an envelope mass below ∼0.3–0.4 M⊙, which was lost after a few TPs, typically four or five, after the star experienced at most a couple of TDU events, thus preventing significant s-process enrichment. Such TDU events would be sufficient to raise the surface carbon after the depletion during the RGB phase; however, the final [C/Fe] is not expected to grow in excess of the values detected for these stars.
The group of stars showing no trace of s-process enrichment also include one bright source (open triangle in Fig. 1), which, based on the surface chemical composition, we deduce to have suffered HBB during the AGB evolution. This star will be discussed in detail in Section 6.
In the following sections, we will discuss the Q1 stars grouped according to the derived progenitor mass and formation epoch, and the physical mechanisms that played the dominant role in changing the surface chemistry.
5 THE LUMINOSITY THRESHOLD FOR CARBON ENRICHMENT
While it is generally recognized that the formation of carbon stars is due to the occurrence of repeated TDU episodes (Iben & Renzini 1982), the efficiency of this mechanism and the evolutionary stage during the AGB evolution when the first TDU event is experienced are still debated. Results from observations of carbon stars in the Magellanic Clouds showed that use of the classic Schwarzschild neutrality criterion was not sufficient to reproduce the lower luminosity tail of carbon stars (e.g. Iben 1981), thus pushing modellers to introduce overshoot from the base of the convective envelope. Given the tight connection between core mass and the physical properties (primarily luminosity) of AGB stars, some studies were devoted to fix the core mass at which TDU begins during the AGB evolution (Groenewegen & Sloan 1993; Marigo, Girardi & Bressan 1999).
Assuming that post-AGB stars are the result of TDU during the AGB phase and not the result of a late TP with mixing, which could result in C, N, and possibly even O enrichment, the study of the threshold luminosity of carbon-enriched post-AGB stars turns out to be a more valuable, indirect indicator of the efficiency of TDU than the luminosities derived for carbon stars in the AGB phase. Indeed, in the latter case, it is possible that the star is observed during an evolutionary phase following a TP, when the luminosity has not recovered the pre-TP value, thus preventing a reliable determination of the core mass of the star. On the other hand, during the post-AGB phase the luminosity stays approximately constant, which allows a much more reliable indication of the core mass of the star.
Regarding the models used in this work, which similarly to the studies mentioned above assume overshoot from the borders of regions unstable to convection (see the beginning of Section 3), the threshold mass and luminosity required to achieve carbon enrichment during the AGB phase can be deduced by the values reported in Table 1. The stars experiencing TDU descend from progenitors with masses at the beginning of the AGB in the 0.85–0.95 M⊙ range. This affects the minimum post-AGB luminosity below which we do not expect to detect carbon enriched sources, which is in the 4500–5500 L⊙ range. This is outlined in Fig. 2 that shows the luminosities reported in Table 1, for stars of different mass and metallicity.
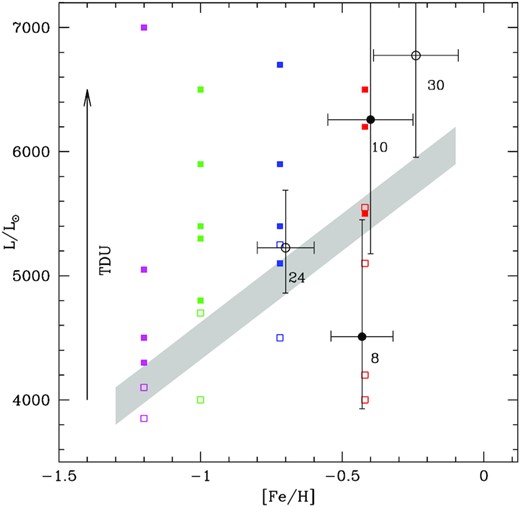
Full squares indicate the luminosity of the model stars reported in Table 1, grouped according to the metallicity, reported on the abscissa. The same colour coding as in Fig. 1 is adopted. The shaded regions separate the upper region of the plane, where we expect to find stars that experienced TDU, from the low-luminosity tail, corresponding to stars that either experienced no TDU, or that experienced at most one to two TDU events, not sufficient to turn them into C-star and to trigger a significant s-process enrichment. Black points refer to the sources discussed in Section 5, where full symbols indicate stars with some s-process enrichment and open points refer to stars with no s-process.
The results from stellar evolution modelling, obtained when exploring the separation between low-mass, oxygen-rich stars and their C-rich counterparts, show that there is a narrow luminosity range, of ∼200 L⊙, characterizing the post-AGB evolution of either groups of stars. This can be noticed in Table 1, by inspection of the post-AGB luminosities of Z = 4 × 10⁻³ and Z = 8 × 10⁻³ model stars of mass close to the oxygen-rich to C-rich transition. The small inversion in the mass–luminosity trend is due to the fact that the occurrence of TDU, which leads to the formation of carbon stars, decreases the core mass, so that the final luminosity is lower than in the lower mass counterparts that fail to experience TDU. To outline this mass–luminosity inversion in correspondence to the luminosity threshold separating low-mass, oxygen-rich sources from carbon stars, we indicate the transition zone with a grey-shaded region in Fig. 2. In that region of the plane, we may expect to find either type of stars.
The sample presented in Paper I includes four sources, which according to our understanding, based on the observed surface chemistry and the derived luminosities, descend from stars that either just failed to achieve any carbon and s-process enrichment, or experienced only very few TDU, sufficient to raise the surface carbon with respect to the abundance at the end of the RGB phase. These stars are the ideal target to study the efficiency of TDU and the evolutionary stage during the AGB phase of low-mass stars, when we expect this mechanism to begin. In the first group, we find HD 133656 (ID 24) and IRAS 19475+3119 (ID 30), whereas the second subsample encompasses IRAS 08143−4406 (ID 8) and IRAS 12360−5740 (ID 10). The metallicity and luminosity of these stars, with the relative error bars, are reported in Fig. 2, where the luminosities of the stars of different mass and metallicity included in Table 1 are also shown, and indicated with full squares.
According to the evolutionary models used in this analysis we expect that the luminosity of HD 133656 (ID 24) is slightly below |$5000\ \rm {L}_{\odot }$|, whereas for IRAS 19475+3119 (ID 30), which is the highest metallicity source in the sample, we expect |$\rm {\it{L}} \sim 6000\ \rm {L}_{\odot }$|. Regarding ID 8 and ID10, which have a slightly subsolar metallicity, we expect that the luminosities are in the |$5500{-}6000\ \rm {L}_{\odot }$| range. These values are compatible, within the observational errors, with the luminosities given for the above sources. The study of these sources offers a unique opportunity to draw information on the conditions under which low-mass stars experience TDU, thus on the minimum luminosity at which we expect to observed carbon stars in galaxies. A tighter determination of the luminosity of these four stars is needed to test the validity of the modelling used here, or to understand the corrections in the treatment of convective borders required to reproduce the observations.
6 HOT BOTTOM BURNING
The possibility that AGB stars experience HBB dates back to the 80’s (Renzini & Voli 1981) and was further investigated by Blocker & Schonberner (1991), who first proposed that the stars experiencing HBB deviate significantly from the classic core mass–luminosity relationship derived by Paczyński (1970). The study by Ventura & D’Antona (2005) stressed the role played by convection modelling on the determination of the temperature at the base of the convective envelope, thus on the strength of HBB: In particular, the FST treatment used here was demonstrated to lead to much stronger HBB conditions with respect to models based on the classic MLT description. As discussed in Section 2, HBB is experienced by M ≥ 3–3.5 M⊙, whereas stars formed with mass below this minimum threshold do not experience any HBB, thus their surface chemical composition may be altered by TDU only.
As discussed in Section 2, the occurrence of HBB leaves important signatures in the surface chemical composition of the stars, the most impressive effect being the large nitrogen enhancement. In the example shown in Fig. A1, the final N, with which a ∼4 M⊙ star is expected to enter the post-AGB phase, is ∼20 times higher than the initial content. For the stars that experience HBB, the knowledge of the surface carbon is an indicator of the relative efficiency of TDU and HBB in the modification of the surface chemistry, considering their opposite effect on the surface 12C. Theoretically, the surface oxygen abundance of post-AGB stars might also provide important information on the strength of the HBB experienced, as significant reduction of the surface oxygen is expected in stars experiencing strong HBB. However, this cannot be tested in this study, because the depletion of oxygen is expected only in metal-poor environments (Lugaro et al. 2012; Ventura et al. 2013; Fishlock et al. 2014; Dell’Agli et al. 2018a), whereas this sample is mostly composed by slightly subsolar metallicity stars.
HR 6144 (ID 25) is the brightest star in the sample, enriched in nitrogen. The luminosity of ID 25 is in the |$23\,000{-}30\,000\ \rm {L}_{\odot }$| range. The surface chemistry reported in Paper I outlines no or poor carbon and s-process enrichment (see Table 2). The combination of the above results is consistent with the hypothesis of a |$4{-}5\ \rm {M}_{\odot }$| progenitor, in which the effects of HBB were dominating over TDU during the AGB lifetime. The surface nitrogen is [N/Fe] ∼ 1, which is a further evidence of the poor effects of TDU during the previous AGB phase: Indeed efficient TDU would bring additional, primary carbon available to synthesize nitrogen to the surface, which would favour larger surface nitrogen than the quantity reported in Paper I (Ventura et al. 2013). The lack of lithium (Luck, Bond & Lambert 1990) is also consistent with the understanding proposed here for this source: According to our hypothesis, ID 25 experienced strong HBB, with temperatures at the base of the envelope of the order of 90 MK; thus, the lithium-rich phase is concluded before the end of the AGB evolution, as the consumption of 3He is extremely fast. On the qualitative side, this case, as far as the evolution of the surface lithium is concerned, is similar to the one shown in Fig. A1.
Based on the above arguments, we conclude that HR 6144 formed 100–200 Myr ago, thus being the youngest object in the sample presented in Paper I.
Further confirmation for the origin of this source might come from the determination of the sodium abundance, as the temperatures mentioned above are sufficient for the activation of the Ne-Na nucleosynthesis, which should have favoured the sodium synthesis, with [Na/Fe] = 0.8–1 (Ventura et al. 2013). Some aluminium production, due to proton captures by the heavy isotopes of magnesium 25Mg and 26Mg is expected too; however, the overall Al increase is within +0.3 dex, thus not easy to be confirmed by the observations. The behaviour of sodium and aluminium expected for this source is shown in Fig. A1. For the metallicity of ID 25 no depletion of 24Mg, which would favour a much larger Al increase, is expected (Dell’Agli et al. 2018a). An additional check of the reliability of the interpretation given for this source is the determination of the 12C/13C ratio, which is expected to be in the 3–20 range. Carbon ratios of the order of 3–4 correspond to the equilibrium values of the proton capture nucleosynthesis and would indicate a pure HBB effect; on the other hand 12C/13C of the order of 10 or more would witness a contribution from TDU. Currently, there are no observationally derived estimates of carbon isotopic ratios of HR 6144. In this work, we aim to bridge this gap by carrying out a systematic and comprehensive observational infrared (IR) spectroscopic study of post-AGB stars to derive isotopic ratios of CNO and other elements, such as magnesium.
Based on the interpretation reached on the basis of the present-day data, we deduce that strong HBB conditions, similar to those experienced by HR 6144, quench TDU, such that the surface chemistry is mainly altered by HBB, with no effects from TDU. Further studies are required to add more robustness to this conclusion, which will be confirmed or disregarded according to whether future observations of post-AGB stars will confirm that all the brightest sources populate the same region of the carbon–luminosity plane as HR 6144, or if some bright post-AGB are s-process enriched and are located on the upper right panel of the plane shown in Fig. 1.
7 A SIGNATURE OF DEEP MIXING DURING THE RGB
In Section 4, we identified three sources as the descendants of low-mass progenitors that lost the surface envelope after having experienced only a few TPs, with no significant effects of TDU. One of these stars, namely HD 161796 (ID 26), is characterized by an extremely large surface nitrogen, [N/Fe] = 1.1. Large N enhancements are commonly associated with HBB. We rule out this possibility for this source, as the post-AGB luminosities of the stars that experienced HBB are definitively above |$\sim\!15\,000\ \rm {L}_{\odot }$|, far in excess of the |$5000{-}6300\ \rm {L}_{\odot }$| values indicated by the observations. ID 26 is a Q1 star; thus, it is unreasonable that the luminosity deviates significantly from the range given above.
A possible explanation for the unusually large nitrogen derived for this source is extremely deep mixing during the RGB ascending. This possibility was explored e.g. by D’Antona & Ventura (2007), in relation to the presence of oxygen-poor giants in globular clusters. Significant N enhancement associated to thermohaline mixing occurring during the RGB was also found by Angelou et al. (2012). The effects of deep RGB mixing of various depths on the surface nitrogen is shown in the left-hand panel of Fig. 3, where it is reported the variation of the surface N as a function of the luminosity of the star, starting from the post-MS phase until the ignition of the helium flash. It is clear in the figure the ∼0.2 dex increase in the surface N, due to the effects of FDU, then the further rise in [N/Fe], due to deep mixing. The surface nitrogen abundance at the ignition of the helium flash is approximately the same with which the star evolves through the post-AGB phase, since no significant variation in the surface N is expected during the AGB evolution of low-mass stars.
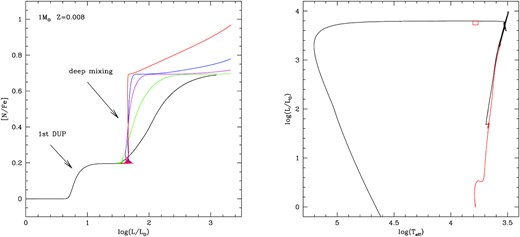
Left-hand panel: Variation of the surface nitrogen of a 1 M⊙ model star during the RGB phase, as a function of the luminosity. The colour coding refers to the efficiency of the assumed extra mixing from the base of the convective envelope that begins after the star evolves through the luminosity bump (the details of the schematization used to model extra mixing are found in D’Antona & Ventura 2007). Right-hand panel: The evolutionary track of the 1 M⊙ model star, split into the pre-helium flash (red line) and post-helium burning evolution (black); the red rectangle indicates the derived effective temperature and luminosity of HD 161796 (ID 26), with the observational uncertainties.
Our interpretation for ID 26 is that it started the AGB phase with a mass in the |$1{-}1.1\ \rm {M}_{\odot }$| range. Assuming a ∼0.1 M⊙ mass-loss during the RGB, this corresponds to age 4–5 Gyr. Lower masses are ruled out, because the star must have experienced one or two TDU events before entering the post-AGB phase, otherwise the surface carbon left behind by deep mixing would be [C/Fe] < 0 (D’Antona & Ventura 2007), whereas the observed value is [C/Fe] = 0.3. We disregard higher mass progenitors, as in that case the star should show up a larger carbon (see Table 1) and significant s-process enrichment, which is not observed.
The evolutionary track of the proposed model is shown in the right-hand panel of Fig. 3, where we see consistency with the values of effective temperature and the upper limit of the luminosity range derived by the observations. A more robust estimate of the luminosity of this source is required before the explanation proposed here can be considered fully reliable.
8 A STAR THAT FAILED THE TDU
Kamath et al. (2017) discovered a bright star in the Small Magellanic Cloud that shows up no carbon and s-process enrichment, thus experienced only a few (if any) TDUs. This finding was in tension with standard AGB evolution modelling, because the stars entering the post-AGB phase with luminosities similar to that of the star studied in Kamath et al. (2017), around |$8000\ \rm {L}_{\odot }$|, which correspond to |$1.5{-}2\ \rm {M}_{\odot }$| progenitors, are expected to exhibit significant carbon and s-process enrichment, as can be seen in the values reported in Table 1. The Kamath et al. (2017) discovery gave origin to a debate regarding the physical mechanisms potentially able to affect the efficiency of TDU during the AGB evolution.
In the sample discussed here, we find an object, HD 112374 (ID 23), similar to the one studied by Kamath et al. (2017), with luminosity |$\sim\!10^4\ \rm {L}_{\odot }$|, no (or poor) carbon enhancement, no sign of s-process enrichment. This case is even more cumbersome than the object investigated by Kamath et al. (2017), because the stars entering the post-AGB with luminosities similar to ID 23 descend from 2–3 M⊙ progenitors (see right-hand panel of Fig. 1), and are those expected to experience the highest number of TPs and to reach the largest surface carbon mass fractions during the AGB lifetime. The contrast between the observed and the expected surface carbon is enhanced by the low metallicity of this source ([Fe/H] = −1.2, see Table 2): Results from AGB modelling indicated [C/Fe] above 2; however, in Paper I, the surface carbon of this source is only slightly above solar.
A possible way to characterize post-AGB stars sharing properties similar to the one discovered by Kamath et al. (2017) is considering models in which TDU is artificially inhibited, and identify the progenitor mass which is expected to enter the post-AGB phase with the core mass corresponding to the luminosity observed. This approach, when compared with the results based on the models so far discussed, would lead to lower mass progenitors, as the core mass of a model star of a given initial mass grows bigger if the TDU is weaker. An alternative possibility is to consider model stars that evolve until reaching the core mass corresponding to the post-AGB luminosity and that experienced the number of TDU events required to obtain the observed carbon, then to assume that a fast loss of the external envelope halted further growth of the core mass and increase in the surface carbon.
While we cannot rule out the action of physical mechanisms that in some specific cases reduce the efficiency of TDU, we do not consider this possibility in this analysis, because evolutionary results with no extra mixing from the base of the envelope showed inconsistency with the observations, as the final surface carbon was still much larger than observed. We therefore explore the second possibility, by trying to identify the progenitors of ID 23 based on their AGB evolution, looking for consistency between the values of carbon and luminosity derived from the observations with those attained by the model stars during specific evolutionary stages during the AGB lifetime, when we assume that the envelope is lost. The physical mechanism responsible for such rapid loss of the envelope is uncertain. Mass-loss is a stochastic process, with variations within up of a factor 10. Here, we claim higher rates, which are commonly associated with common envelope evolution; the latter possibility seems at odds with the single nature of the stars examined here. We leave this problem open.
We consider AGB evolutionary sequences of model stars of different mass and metallicity Z = 10−3, suitable to describe ID 23. In agreement with the discussion of Section 4, we focus on the time evolution of luminosity and surface carbon, shown in Fig. 4, where they are compared with the quantities for this star given in Paper I. The 2 and 2.5 M⊙ model stars experience a series of TDU events, which make the surface of the stars to be more and more enriched in carbon. The 3 M⊙ model star follows the same behaviour during the first part of the AGB evolution; after HBB begins the surface carbon shows up a series of ups and downs, according to whether HBB or TDU affect the surface chemistry.
![Time variation of luminosity (left-hand panel) and surface carbon (right-hand panel) of Z = 10−3 model stars of different initial mass, during the AGB phase. Grey-shaded regions indicate the luminosity and [C/Fe] of the source HD112374 (ID 23).](https://oup.silverchair-cdn.com/oup/backfile/Content_public/Journal/mnras/519/2/10.1093_mnras_stac3366/1/m_stac3366fig4.jpeg?Expires=1750374954&Signature=Uhz6WeI7RkxwSTPaIkGRB2g57paYeEgUSMfaL-0FqYwF0P5~5Xfd8wOzyIH0tyS4~f5UfuK9-Qix7Z05JT1vhq5Z8~I3e~tjLyGl695-nzZ6tuBgMqvdLyQhaq2WYP2WAM1YLGcc5xh-9DJj2gDLuJWwAAZsato3rYanlKQlaUd470gElg6~PD5BewbfE~eVq4IlPRxKwvdE6yzcZZ0SpFgNTjSsy9K6QF4VlKnvdVwZ9xWPeYMAvrAPzwo5oFm30wqqaXLdubkh6h481i1Dy3xMKKH5X-z~qeoL-uYc5JhheddcI-xEXf0nCFXX8Ej-~owl3ZuJP9DtZP46XSXQWQ__&Key-Pair-Id=APKAIE5G5CRDK6RD3PGA)
Time variation of luminosity (left-hand panel) and surface carbon (right-hand panel) of Z = 10−3 model stars of different initial mass, during the AGB phase. Grey-shaded regions indicate the luminosity and [C/Fe] of the source HD112374 (ID 23).
From the results shown in Fig. 4, we deduce that for ID 23 we can rule out M < 2 M⊙ progenitors, as these stars evolve fainter than the derived luminosity during the whole AGB and post-AGB phases. The M = 2 M⊙ progenitor case can be disregarded too, since these stars reach luminosities of the order of |$\sim\!10^4\ \rm {L}_{\odot }$| only during the very final AGB stages (see the blue track in the left-hand panel of Fig. 4), after large quantities of carbon have been accumulated into the surface regions, as clear in the right-hand panel of Fig. 4.
Our best guess is that this source descends from a ∼2.5 M⊙ star, which started the contraction to the post-AGB after experiencing a few TPs and one TDU event, which was sufficient to raise the surface carbon to the current value, after the depletion due to the FDU. The luminosity of the star during this phase is consistent with the value given in Paper I. According to this interpretation ID 23 formed approximately half Gyr ago.
The 3 M⊙ model star reaches luminosities consistent with the one given for ID 23 during the early-AGB phase, before the beginning of TPs. The possibility that ID 23 descend from a 3 M⊙, thus is younger than the age given above, cannot be ruled out: this hypothesis is however in some tension with the fact that the star is slightly enriched in carbon, whereas according to results from stellar evolution modelling stars evolving through the early-AGB phase are characterized by subsolar carbon, owing to the effects of FDU.
9 TOWARDS THE FAINT SIDE: HB AND POST-HB STARS
The sample presented in Paper I includes four Q1 sources, whose luminosities are not consistent with the hypothesis that they have undergone a complete AGB evolution and are now contracting to the Planetary Nebula (PN) phase: IRAS 01259+6823 (ID 19), IRAS 08187−1905 (ID 20), HD 107369 (ID 22), and HR 7671 (ID 31). The luminosities of these stars are below the values reported in Table 1, even in the very low-mass domain. The position of these objects in the HR diagram is reported in Fig. 5.
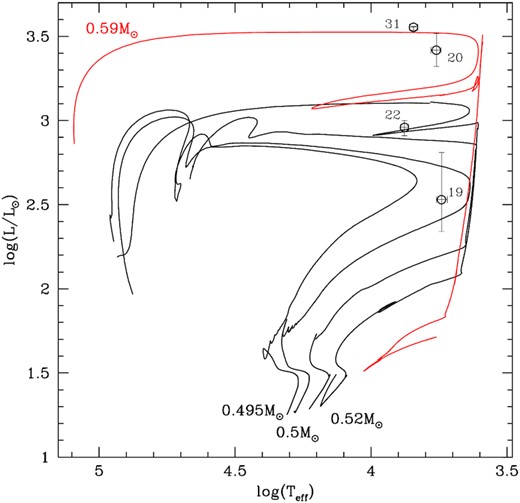
Effective temperature and luminosity of the faint sources flagged as Q1 in Paper I (from brightest to faintest): HR 7671 (ID 31), IRAS 08187−1905 (ID 20), HD 107369 (ID 22), and IRAS 01259+6823 (ID 19). Black tracks refer to the HB and post-HB evolution of 0.495–0.52 M⊙ stars that start contraction before reaching the AGB and red line refers to a 0.59 M⊙ star that evolves to the blue after experiencing two TPs.
The existence of low-luminosity stars likely contracting towards the white dwarf stage was first noticed by Kamath et al. (2016), who discovered a sample of stars in the Magellanic Clouds exhibiting some IR excess, with luminosities in the 200–2000 L⊙ range: The interpretation proposed by the authors was that those stars are currently evolving off the RGB, as a result of binary interaction, which favoured an early loss of the external mantle. A similar explanation can be hardly applied to this case, as there are no indications that the four sources belong to binary systems. Indeed, we are not considering at all the possibility that these stars are evolving off the RGB as a consequence of the loss of the envelope, even as single stars. The luminosity of ID 19 is below 1000 L⊙, whereas we expect that most of the mass-loss during the RGB evolution of single stars, which might potentially lead to an early contraction before the occurrence of the helium flash, would take place during the approach to the tip of the RGB, thus at luminosities close to 2000 L⊙. On the other hand, ID 31 is much brighter than the RGB tip; thus, it is definitively evolving through a post-RGB phase.
We propose that these stars descend from 0.8–1 M⊙ progenitors, which soon after completing the HB evolution started to contract to the blue side of the HR diagram, before reaching the AGB phase. According to this interpretation these sources, which correspond to the stars populating the blue side of some Galactic globular clusters, suffered significant mass-loss, of the order of 0.2–0.4 M⊙, during the RGB evolution, and started the core helium burning phase with masses ∼0.5 M⊙. The early start of the contraction phase was due to the fast loss of their external envelope, whose mass during the HB was of the order of 0.05 M⊙.
These are the oldest objects in the sample, which formed 8–10 Gyr ago; unfortunately no robust derivation of the age of the stars can be obtained here, as our analysis allows an estimate of the mass at the beginning of the HB; however, unfortunately the initial mass of the star, the crucial quantity to infer the formation epoch, depends on the mass-loss occurred during the RGB, which can change significantly from star to star.
It is clear from Fig. 5 that the luminosity range of these sources extends over a factor 10, which reflects the different progenitor mass3 and the evolutionary phase during which they are currently observed. We propose that ID 19 and ID 22 did not reach the TP phase before contracting, whereas ID 20 and ID 31 began the post-AGB evolution after experiencing only a few TPs. We discuss these two cases separately.
9.1 AGB-manqué stars
In stars of initial mass below |$\sim 2\ \rm {M}_{\odot }$|, the ignition of helium in the central regions takes place in conditions of electron degeneracy, via a thermally unstable process, known as the core helium flash (Deupree 1984; Mocák et al. 2008). After the occurrence of the flash the electron degeneracy in the core is removed within ∼1 Myr, and the stars resume core helium burning under conditions of thermal stability, then evolve through the AGB, after the exhaustion of central helium.
An exception to this general behaviour is found when the mass of the envelope above the helium core at the beginning of the HB phase is reduced to a few hundreds of solar mass. Under these conditions, after the HB evolution (since the stars barely reach the AGB), and a relatively short expansion phase, they start contracting, evolving through the so-called AGB-manqué phase (Greggio & Renzini 1990).
To test the possibility that some of the stars discussed here are nowadays in the AGB-manqué phase, we calculated various evolutionary sequences, started from the HB, of stars of mass in the 0.49–0.6 M⊙ range, extended until the start of the WD cooling. Some of these tracks are shown in Fig. 5.
We find that the AGB-manqué evolution is experienced by 0.49 M⊙ ≤ M ≤ 0.52 M⊙ stars, which correspond to structures made up of a helium core and an envelope with mass Menv below 0.04 M⊙. More specifically, for Menv < 0.01 M⊙, the evolutionary tracks move vertically then turn to the blue (this case is not shown in Fig. 5 for clarity sake); however, for 0.01 M⊙ < Menv < 0.04 M⊙, the stars begin the overall contraction after evolving to the red side of the diagram; this behaviour is followed by the model stars described by the black lines in Fig. 5. Note that the total masses given above might change according to different factors that affect the determination of the core mass found at the tip of the RGB, which is core mass assumed for the computation of the core helium burning phase; on the other hand, the threshold envelope masses delimiting the different types of post-HB evolutions are substantially independent of metallicity and other physical and chemical ingredients.
In the 0.495 and 0.5 M⊙ cases, we note the effects of a late-helium ignition just during the PN phase, before the WD evolution. The 0.52 M⊙ model star experiences a single TP, which makes the evolutionary track to describe a wide loop to the blue, before moving again to the red, before the final contraction, preceding the WD evolution.
The effective temperatures and luminosities of the sources ID 19 and ID 22 are fully consistent with the evolutionary tracks of 0.5–0.52 M⊙ stars; thus, we suggest an AGB-manqué characterization for both sources. According to this understanding, these stars started the HB phase with envelope masses ∼0.02 M⊙ (ID 19) and ∼0.04 M⊙ (ID 22), thus descending from hot HB stars, similar to those populating the blue side of the HBs of some Galactic globular clusters, such as NGC 2419 (Ripepi et al. 2007) and NGC 2808 (Bedin, Piotto G. & Zoccali M 2000).
9.2 An extremely short AGB phase
The stars ID 20 and ID 31 are the brightest sources which failed to complete (or to reach) the AGB phase. Their luminosity is, however, higher than the three sources examined earlier in this section, which is inconsistent with the hypothesis that they are evolving in the post-HB phase. This can be seen in Fig. 5, where we notice that the evolutionary tracks of |$0.49{-}0.52\ \rm {M}_{\odot }$| stars are too faint to explain ID 20 and ID 31.
The position of these sources in the HR diagram is nicely reproduced by the evolutionary track of the |$0.59\ \rm {M}_{\odot }$| model star. We therefore propose that they are the slightly higher mass counterparts of ID 19 and ID 22: The mass-loss experienced during and shortly after the HB evolution was not sufficient to remove the whole envelope; thus, ID 20 and ID 31 could reach the AGB phase and started contracting shortly after the beginning of the TPs phase.
Greggio & Renzini (1990) proposed that the evolution of these objects is halted at the first TP, as a consequence of the sudden increase in the luminosity of the star. We prefer to keep more general in the present context, and propose that the mass of the envelope at the end of the HB phase was so small that the contraction began shortly after the start of this evolutionary phase. Numerical experiments, in which the mass of the envelope was artificially removed at the ignition of the first TP, show that within the context of the scenario proposed by Greggio & Renzini (1990), the mass of the sources ID 19 and ID 22 at the beginning of the HB would be ∼0.62 M⊙.
Independently of the details of the evolutionary stage at which the residual mass of the envelope is completely removed from the star and contraction begins, the above arguments suggest that ID 19 and ID 22 descend from HB stars originally composed by the helium core and a ∼0.1 M⊙ envelope, which shortly after the beginning of the AGB phase started the overall contraction that led to the current evolutionary stage.
10 THE SOURCES FLAGGED AS Q2 IN PAPER I
The sample investigated in Paper I includes stars, flagged as Q2, characterized by unreliable astrometry. The distribution of these sources on the carbon–luminosity plane is shown in Fig. 6. Comparison with Fig. 1 indicates that the distribution of Q1 and Q2 stars are broadly similar, although the luminosity error bars of Q2 stars are on the average significantly higher.

We focus in particular on IRAS Z02229+6208 (ID 1) and IRAS 20000+3239 (ID 15), both enriched in nitrogen and s-process enhanced, which suggests that both TDU and HBB acted to change the surface chemical composition. This suggests ∼3 M⊙ progenitors.
In Fig. 7, we show the time evolution of the surface chemical composition of a |$3\ \rm {M}_{\odot }$| star with metallicity Z = 10−3, which we believe to be a possible progenitor of ID 15. The effects of HBB are seen in the rise of the surface nitrogen (left-hand panel), which grows by a factor ∼40 with respect to the N abundance at the beginning of the AGB phase.4 The behaviour of the surface carbon is a key indicator of the combined effects of TDU + HBB: During the first part of the AGB evolution, the surface 12C increases owing to the effects of TDU; however, after ∼2 × 10⁵ yr, we note the effects of HBB in the fast drop of the surface carbon during the interpulse phases. During the very final AGB phases, after HBB was turned off by the loss of the envelope, the effects of TDU take over, and the surface 12C rises again, until reaching the final value of [C/Fe] ∼ 1.5, with which the star is expected to evolve to the post-AGB phase.
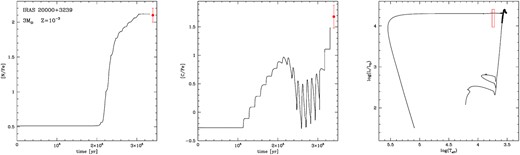
AGB variation of the surface nitrogen (left-hand panel) and carbon (middle panel) of a 3 M⊙ model star of metallicity Z = 10−3, as a function of the AGB lifetime. Red points with the error bars refer to the measure abundances of the source IRAS 20000+3239 (ID 15). The right-hand panel reports the evolutionary track of the same model star on the HR diagram and the effective temperature and luminosity of IRAS 20000+3239, with the associated error box.
The final values of the surface C and N are consistent with the abundances given for ID 15. The evolutionary track for this star (right-hand panel) is also consistent with the observations, with the expected luminosity during the post-AGB phase, |$\rm {\it{L}} \sim 20\,000\ \rm {L}_{\odot }$|, well within the observational uncertainties. Note that this is a Q2 star, which is a further reason for taking the luminosity given in Paper I and listed in Table 2 with some caution.
The discussion for ID 15 can be similarly extended to ID 1, which also exhibits carbon and nitrogen enhancement, with [C/Fe] = 0.8 and [N/Fe] = 1.2. For this source, we also expect a progenitor of mass just above the minimum threshold required to activate HBB, ∼3.5 M⊙,5 that formed ∼250 Myr ago. Both TDU and HBB leave important signatures in the surface chemical composition of these stars. In the carbon–luminosity plane shown in Fig. 6, this source is found in a different position with respect to IRAS 20000+3239, despite the similarity in the progenitor mass: As discussed in Section 2, this is due to the higher metallicity of ID 1, which, for a given increase in the surface abundances of carbon or nitrogen, makes the corresponding increase in [C/Fe] or [N/Fe] smaller. According to our modelling, the luminosity of ID 1 is |$\sim\!16\,000{-}18\,000\ \rm {L}_{\odot }$|, which is consistent with the |$10\,000{-}17\,000\ \rm {L}_{\odot }$| range given by the observations. A tighter estimate of the luminosity is required to further validate the understanding proposed here. Future confirmation of luminosity values close to the lower limit within the observational error would be at odds with the current interpretations, as no HBB is expected to take place in stars that enter the post-AGB phase with |${\it{L}}\ \lt\ 15\,000\ \rm {L}_{\odot }$|.
The star SAO 239853 (ID 21) might also have undergone an evolutionary path similar to ID 1 and ID 15, although the lack of any s-process enrichment indicates that the dominant role in the modification of the surface chemical composition was played by HBB. This is largely consistent, within the error bars, with the luminosity given in Paper I, which is in the 13 000–48 000 L⊙ range. The nitrogen enhancement is slightly below (∼0.2 dex) the expectations from stellar evolution modelling, even in the case that the N produced is of secondary origin only. If the modification of the surface chemistry was mostly due to the effects of HBB, we conclude that ID 21, similarly to the case of ID 25, discussed in Section 6, descends from 4–5 M⊙ progenitors. This interpretation holds only if the luminosity of this source is above ∼20 000 L⊙. In future, more accurate measurements of the parallax will lead to a luminosity estimate close to the current lower limits, i.e. 13 000 L⊙, we will rather regard ID 21 a star that failed the TDU, such as ID 23, discussed in Section 8.
Turning to lower luminosity stars, IRAS 06530−0213 (ID 5) and IRAS 14429−4539 (ID 13) likely descend from 1.5–2 M⊙ progenitors, which reached the C-star stage during the AGB phase: This is consistent with the surface carbon and the luminosities given in Paper I. A similar interpretation should hold for IRAS 04296+3429 (ID 2), IRAS 09281−4850 (ID 9), IRAS 13245−5036 (ID 11), and IRAS 23304+6147 (ID 18), as suggested by the surface carbon abundances. The luminosities of the latter four objects are slightly higher than expected on the basis of stellar evolution modelling (see Fig. 6); however, the error bars are too large to draw any conclusion on that regard.
The sample of s-process-enriched stars flagged as Q2 encompasses the sources IRAS 05113+1347 (ID 3), IRAS 05341+0852 (ID 4), IRAS 07430+1115 (ID 7), and IRAS 22223+4327 (ID 16), whose luminosities, in the 20–2200 L⊙ range, are far below the threshold limit required to reach the C-star stage. These data, if confirmed by future Gaia data releases, might indicate a present post-HB evolution, and the signature of deep mixing occurring during the helium flash, such as the one proposed by Schwab (2020) to explain the unusually high lithium abundances observed in clump stars. However, further confirmation of the luminosities is required before these sources can be regarded as outliers with respect to theoretical predictions.
11 CONCLUSIONS
We used stellar evolutionary computations, extended until the white dwarf cooling phase, of 0.7–4 M⊙ stars with metallicities from Z = 10−3 to solar, to investigate a sample of post-AGB stars in the Galaxy, for which the surface chemistry and the luminosities, based on Gaia parallaxes, have been recently presented. The knowledge of the luminosity proves crucial for the study of this class of stars, given the tight connection between the luminosity, the current mass of the stars, and the mass of the progenitors.
Among the various observables, we find that the combined knowledge of the surface carbon and of the luminosity proves the best indicator of the past history of the individual sources and of the nature of their progenitors.
The comparison with results from stellar evolution modelling shows that |$\sim\!40{{\ \rm per\ cent}}$| of the stars in the sample examined descend from 1–3 M⊙ progenitors that after repeated convective events became carbon stars: These objects are s-process enriched and exhibit a surface C/O above unity.
A few sources are interpreted as the progeny of low-mass stars that started the AGB phase with mass below ∼1 M⊙, and began the contraction to the post-AGB before experiencing any carbon enrichment: According to this understanding, these objects, with luminosities in the 4000–5000 L⊙ range, formed earlier than 5 Gyr ago.
The sources ID 15, ID 21, ID 23, and ID 25, whose surface chemical composition shows up the signature of proton-capture processing, are identified as the youngest stars in the sample, descending from 3–4 M⊙ progenitors that experienced both TDU and HBB.
A few sources are characterized by luminosities far below the minimum threshold of 4000 L⊙ expected for stars evolving through the AGB. These objects are tentatively identified as the progeny of low-mass (∼0.5–0.7 M⊙), post-core helium burning stars, which after a short expansion phase lost the entire envelope and failed to reach the AGB. These are the oldest objects in the sample.
This study confirms that post-AGB stars are a precious tool to reconstruct the evolution of the stars through the post-MS phases. The analysis of the chemical composition of post-AGB stars of different mass can potentially shed new light on still poorly constrained aspects of the AGB evolution, a few examples being the mass transition separating low-mass objects evolving as M-type stars from carbon stars, the mass and luminosity threshold required for the ignition of HBB, the possibility that stars experiencing HBB eventually get enriched in carbon owing to late TDU events, deep mixing during the RGB pase. The availability of Gaia parallaxes is crucial to this research, because it allows the study of the vast sample of Galactic post-AGB, so far hampered by the poor knowledge of the distances, that prevented the determination of one essential ingredient for this study, namely the luminosity of the individual objects.
Future incoming developments of this study will be a more detailed analysis of the stars considered in this work, due to the tighter constrains on the luminosity that will come from DR4, and the application to these key concepts to a wider post-AGB Galactic sample.
ACKNOWLEDGEMENTS
DK acknowledges the support of the Australian Research Council (ARC) Discovery Early Career Research Award (DECRA) grant (DE190100813). DK and AIK are supported in part by the Australian Research Council Centre of Excellence for All Sky Astrophysics in 3 Dimensions (ASTRO 3D), through project number CE170100013. HVW acknowledges support from the Research Council, KU Leuven under grant number C14/17/082.
DATA AVAILABILITY
The data underlying this article are available in the article and in references therein.
Footnotes
The range of masses explored in Table 1 is limited to |$4\ \rm {M}_{\odot }$| as there is no indication of the presence of the progeny of massive AGBs in the sample stars studied here; however, the low-surface carbon expected in post-AGB sources descending from massive AGB stars must be considered for future investigations.
Unfortunately no firm conclusions on the age of these stars can be drawn, because as discussed in previous sections the masses deduced from this analysis, based on the values reported in Table 1, refer to the beginning of the AGB phase, whereas the age is connected with the initial mass of the star, which is sensitive to the unknown mass-loss occurred during the RGB.
In this case, we refer to the mass at the beginning of the quiescent core helium burning phase.
In the figure, which refers to the AGB phase, the initial surface [N/Fe] is ∼0.5. The evolution was calculated with a solar-scaled nitrogen: The supersolar [N/Fe] at the beginning of the AGB phase is due to the combined effects of the FDU and second dredge-up events.
The minimum threshold mass to reach HBB conditions slightly depends on metallicity, and changes from ∼3 M⊙, for Z = 10−3, to ∼3.5 M⊙, for Z = 8 × 10⁻³
REFERENCES
APPENDIX A: A SUMMARY OF THE PHYSICAL AND CHEMICAL EVOLUTION THROUGH THE AGB PHASE
The mechanisms able to alter the surface chemical composition of AGB stars are TDU and HBB. The stars experiencing TDU are expected to show up large 12C enhancement and s-process enrichment during the post-AGB phase. The lack of carbon enrichment in post-AGB stars can be due to the following reasons: (i) the mass of the envelope at the beginning of the AGB was so small that the whole external mantle was lost after only a few TPs, with no (or scarce) effects of TDU; (ii) the star experienced an early loss of the envelope, owing to e.g. a tight gravitational encounter or to mass transfer to a companion star; and (iii) the star experienced HBB, with the depletion of the surface 12C via proton capture reactions taking place in the innermost regions of the envelope, once the temperatures in those zones reach (or exceed) ∼30 MK.
Case (i) is associated to the evolution of low-mass stars, with total mass at the beginning of the AGB of the order of |$\sim\!1\ \rm {M}_{\odot }$|, or below. This class of objects is expected to enter the post-AGB phase with luminosities below |$\sim 5000\ \rm {L}_{\odot }$| (Miller Bertolami 2016), and to exhibit poor (if any) 12C enrichment and 14N enhancement, as a consequence of the FDU (see e.g. Sweigart, Greggio & Renzini 1989) and possibly of deep mixing during the RGB ascending (Lagarde et al. 2012, 2019). The mass threshold below which the stars follow this kind of evolution is sensitive to the metallicity of the star and is still debated, as the modelling of TDU is extremely sensitive to the treatments of the convective borders, the related mixing at the base of the convective envelope, and the description of mass-loss (Karakas & Lattanzio 2014).
Case (ii) corresponds to stars which undergo a fast loss of the external envelope, so that the AGB evolution is accelerated with the rapid contraction of the structure, which starts the post-AGB phase. The number of TPs experienced, and also of the TDU events, is lower the earlier is the loss of the external mantle. The growth of the core mass and luminosity is also truncated.
The stars corresponding to case (iii) above are those which evolve on core masses above |$0.8\ \rm {M}_{\odot }$|, which reflects into initial masses |$\rm {\it{M}}\ge 3\ \rm {M}_{\odot }$| (Ventura et al. 2013). The stars undergoing HBB evolve at large luminosities during the AGB lifetime, spanning the |$2\times 10^4{-}2\times 10^5\ \rm {L}_{\odot }$| range, which typically reach a peak value, before the gradual loss of the envelope makes the luminosity to decrease, and to enter the post-AGB phase with values in the |$1.5\times 10^4{-}3\times 10^4\ \rm {L}_{\odot }$| range.
A typical example of such a behaviour can be seen in the top-left panel of Fig. A1 that shows the evolution of the luminosity of a |$4\ \rm {M}_{\odot }$| model star: We notice the fast increase in the luminosity, which grows up to |$\sim\!{3}5\,000\ \rm {L}_{\odot }$|, then declines during the final AGB phases, after the total mass, has decreased by |$\sim\!{50}{{\ \rm per\ cent}}$|. A similar trend is followed by the temperature at the bottom of the envelope, |$\rm {\it{T}}_{\rm bce}$|, which in this specific case grows up to ∼80 MK, in conjunction with the luminosity peak, then declines until HBB is turned off.
The bottom panels of Fig. A1 show the evolution of the surface chemical composition. On the left-hand, we report the mass fractions of the most relevant chemicals entering the CNO cycling. The surface chemical composition of post-AGB stars previously exposed to HBB is significantly enriched in nitrogen. In the case reported in Fig. A1, the combined effects of FDU and HBB lead to a surface nitrogen enrichment of a factor ∼20 with respect to the initial mass fraction.
In Fig. A1, we see the effects of the activation of the Ne-Na nucleosynthesis, with the production of sodium. Proton capture reactions by the two less abundant isotopes of magnesium, 25Mg and 26Mg, favour the synthesis of 27Al. This is shown in the bottom-right panel of Fig. A1, where we see that both sodium and aluminium increase to [Na/Fe] ∼ 1 and [Al/Fe] ∼ 0.3, respectively.
We also see in the same panel the effects of the activation of the Cameron & Fowler (1971) mechanism, which favours the synthesis of large quantities of lithium; the lithium-rich phase, outlined with grey shading in Fig. A1, lasts until there is some 3He available in the envelope, then it is destroyed, until the envelope is substantially lithium-free. Whether the stars experiencing HBB enter the post-AGB phase with some lithium in the surface regions depends on the strength of the HBB experienced, thus the largest temperatures reached at the bottom of the convective envelope. For |$\rm {\it{T}}_{\rm bce}$| in excess of ∼60 MK, the consumption of the surface 3He is so fast that the lithium-rich phase is extremely short, thus preventing the survival of lithium until the beginning of the post-AGB evolution; this is the case shown in Fig. A1. Conversely, when HBB is weaker, lithium survives until the end of the AGB evolution.
The predictions regarding the carbon abundance for the stars experiencing HBB are more tricky, as the surface 12C is sensitive to the balance between the effects of HBB, which destroys the surface 12C via proton fusion, and TDU, which brings freshly synthesized carbon to the surface regions. According to the modelling used in this investigation, TDU and HBB approximately balance each other for stars in the |$3{-}4\ \rm {M}_{\odot }$| mass range; however, in higher mass stars strong HBB quenches TDU, thus preventing both carbon enrichment and s-process enhancement (Boothroyd, Sackmann & Ahern 1993). The effects of TDU and HBB are clear in Fig. A1, particularly those associated to late-TDU events, which rise the surface 12C. However, the argument is still highly debated because both the strength of HBB and the inwards penetration of the convective envelope after each TP are extremely sensitive to the description of the convective instability (Karakas & Lattanzio 2014).
Regarding the surface abundances of the individual chemical species, and the predictions regarding the mass fractions during the post-AGB phase, we focus on the CNO elements and neglect helium in the following discussion, because the helium abundances are not available for the sample stars discussed in Paper I.
For the stars not included in cases (i), (ii), and (iii) mentioned earlier, descending from progenitors with mass in the |$1{-}3\ \rm {M}_{\odot }$| range, we expect to observe significant carbon enrichment, owing to the effects of repeated TDU events. A few examples of the evolution of these objects can be seen in Fig. A2 that reports the AGB variation of the surface carbon and the luminosity for stars of different mass and metallicity. The masses were selected so that both the stars that experience only a few TDU events and those that attain the largest carbon enrichment are represented in the figure: For a given metallicity, the final [C/Fe] is higher the higher is the initial mass of the star.
An important result, clearly visible in Fig. A2, is that the final [C/Fe] is higher the lower is the metallicity. This is partly due to the higher efficiency of TDU experienced by lower metallicity AGBs, as suggested by observations of external galaxies, such as the Large Magellanic Cloud, Small Magellanic Cloud, and dwarf spheroidal galaxies that show higher numbers of C-stars than in the Milky Way (Zijlstra et al. 2006; Sloan et al. 2012), which is evidence that it is easier to obtain TDU at lower metallicities, for a given mass. However, the most relevant effect to consider on this regard is that, for a given amount of carbon transported to the surface by TDU, the percentage increase in the surface carbon with respect to the initial quantity is higher the lower is the initial mass fraction of 12C, which scales with the metallicity. On regard of the results of Fig. A2, the model stars with initial mass |$2.5$| and |$3\ \rm {M}_{\odot }$|, with final [C/Fe|$]\, \sim 1.85$| and ∼1.3, respectively, enter the post-AGB phase with similar surface carbon mass fractions, slightly below 1.5.
This will be important in the interpretation of the carbon data, which will be addressed in the following sections. These stars are also expected to exhibit nitrogen enhancement, as a result of RGB mixing. Some oxygen enrichment is possible if the inwards penetration of the surface convection during the TDU events is sufficiently deep to reach layers enriched in 16O. We will return to this point in the next section.
The stars discussed in point (i) earlier are expected to show-up chemical compositions reflecting the effects of the FDU, with a possible further contribution from one or two TDU episodes. The occurrence of the FDU favours the surface nitrogen enrichment and the depletion of the surface carbon. If no TDU episode takes place, the surface carbon is characterized by negative values of [C/Fe]. However, a single TDU event is sufficient to restore solar-scaled or slightly higher values. Oxygen is untouched by FDU; thus, it is expected that these stars reach the post-AGB with the same oxygen as in the gas from which they formed.
Finally, for what concerns the stars treated in point (iii), which experienced HBB, the clearest signature of the nuclear activity at the base of the envelope, as clear in Fig. A1, is the surface nitrogen enhancement. This expectation is rather robust, as it is substantially independent of the strength of HBB, since CN cycling is the nuclear activity most easily activated under HBB conditions. This is different from other nuclear channels, such as Ne-Na cycling or the Mg-Al-Si chain, whose ignition critically depend on the temperature at the bottom of the convective envelope (see e.g. Ventura et al. 2018 for a more exhaustive discussion on the sensitivity of the degree of the HBB nucleosynthesis to convection modelling in solar metallicity AGBs). In case that the modification of the surface chemistry is determined by HBB only, with no effects related to TDU, the expected increase in [N/Fe] is not sensitive to the metallicity, as the nitrogen produced is of secondary origin, being synthesized by the CNO elements present in the mixture from which the stars formed. In metal-poor stars, significant depletion of the surface oxygen takes place (Dell’Agli et al. 2018a), but the metallicities of the sample stars discussed here are not sufficiently low to see these effects.
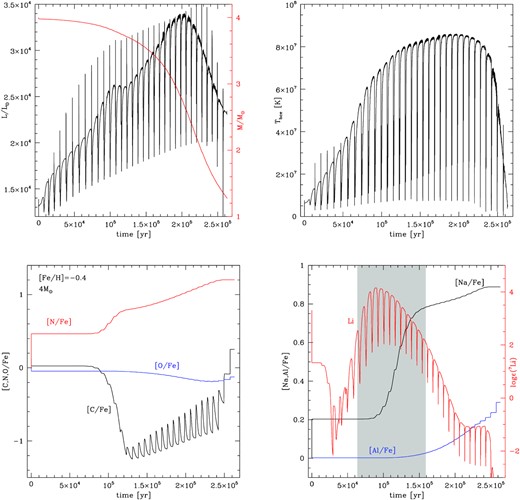
Top-left panel: AGB variation of the luminosity (black line, scale on the left y-axis) and current mass (red, scale on the right-hand) of a |$4\ \rm {M}_{\odot }$|, Z = 8 × 10⁻³ model star, experiencing HBB. Top-right panel: Run of the temperature at the base of the envelope. The fast excursions of the luminosity and temperature at the base of the envelope correspond to the ignition of TPs. The bottom panels report the variation of the surface CNO mass fractions (bottom-left panel) and of magnesium, aluminium, and lithium (bottom-right panel). The scale for lithium, in red, is on the right vertical axis and is given in the log ϵ(7Li) = 12 + log (n(7Li)/n(H))) unit. Grey shading indicates the superrich lithium phase, when log ϵ(7Li) > 2.
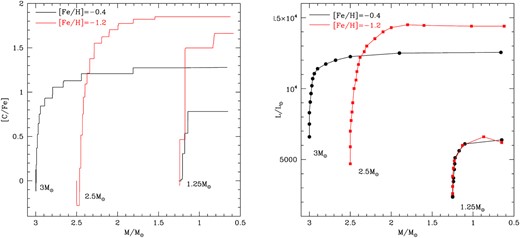
AGB variation of the surface carbon (left-hand panel) and luminosity (right-hand panel) of model stars of different mass and metallicity, undergoing TDU. On the abscissa, we report the current mass of the star. The points on the tracks on the right-hand panel correspond to the interpulse phases.
