


ABSTRACT
We present the results from studying 140 radio sources in the GLEAM (GaLactic and Extragalactic All-sky MWA [Murchison Widefield Array]) 4-Jy (G4Jy) Sample. These sources were followed-up with MeerKAT to assess their radio morphology and enable host-galaxy identification, as existing radio images of 25 to 45-arcsec resolution do not provide sufficient information. We refer to these sources as the MeerKAT-2019 subset. The aim is to identify the host galaxy of these sources by visually inspecting the overlays comprising radio data from four surveys (at 150, 200, 843/1400, and 1300 MHz). Our morphological classification and host-galaxy identification relies upon the ∼7-arcsec resolution images from MeerKAT (1300 MHz). Through the visual inspection of the overlays, 14 radio sources in the MeerKAT-2019 subset have wide-angle tail morphology, 10 are head-tail, and 5 have X-, S-/Z-shaped morphology. Most of the remaining sources have the radio morphology of typical symmetric lobes. Of 140 sources, we find host galaxies for 98 sources, leaving 42 with no identified host galaxy. These 42 sources still have ambiguous identification even with higher resolution images from MeerKAT.
1 INTRODUCTION
Two main galaxy populations are known to radiate vast amounts of radio emission: star-forming galaxies and galaxies with an active galactic nucleus (AGN), with AGNs being the dominant emitter. Both populations play a tremendous role in galaxy evolution. The impact of star formation on galaxy evolution is through the collapse of the molecular clouds to form stars, thereby building stellar mass. However, stellar mass growth may be halted (usually in galaxies with low mass) if, for instance, the supernova is powerful enough to expel gas from the system (Efstathiou 2000) or the gas is stripped away due to the interaction with another galaxy (Mihos, Richstone & Bothun 1991).
Meanwhile, the process of material falling onto the supermassive black hole (SMBH) at the galaxy’s centre may sometimes produce relativistic radio jets (Urry & Padovani 1995; Netzer 2015). AGN activity has been shown to significantly impact the host galaxy by suppressing or promoting star formation; however, this is still a point of contention. Morganti et al. (2013) demonstrated that star formation might be suppressed whereby the radio jets expel gas from the system. Meanwhile, Croft et al. (2006) showed that the jets might trigger the collapse of the molecular gas and promote star formation.
In order to gain a better acumen of which of these scenarios is more significant, a large sample of AGN with powerful relativistic radio jets is needed to provide robust statistics on the features of these AGN, taking into account attributes such as jet inclination with respect to the plane of the galaxy (García-Burillo et al. 2014), the size of the molecular gas reservoirs (Emonts et al. 2011), and jet power (Mukherjee et al. 2016). Additionally, we need a large sample to unravel the effects of jet power, age, and environmental density on radio luminosity and investigate these properties as a function of redshift. Moreover, the mechanism of how jets are launched is still poorly understood, as well as how these sources evolve with redshift. This is because most studies are constrained to the 173 ’radio loud’ AGN in the revised Third Cambridge Catalogue of Radio Sources (3CRR, S178 MHz > 10.9 Jy; Laing, Riley & Longair 1983). Therefore, this work is significant in that it will help to better populate the high-luminosity end.
AGN activity occurs in at least two modes, leading to two intrinsically different AGN populations. This dichotomy is most likely caused by the difference in the efficiency of the mechanism governing accretion onto the central SMBH (e.g. see review by Heckman & Best 2014). The first AGN activity mode is ‘quasar mode’, also called ‘cold mode’, ‘radiative mode’, or ‘high-excitation’. The material is accreted onto the central SMBH through a radiatively efficient, optically thick, and geometrically thin disc (Shakura & Sunyaev 1973). These radiatively efficient AGN are typically connected to the most luminous AGN, radiating across a broad range of the electromagnetic spectrum. A fraction of these AGN are radio-loud AGN with powerful radio jets extending for tens or hundreds of kpc. The second AGN activity mode is ‘radio mode’, also called ‘jet mode’ or ‘low-excitation’. In this mode, the accretion of material onto the central SMBH produces little radiated energy but can result in the production of highly energetic jets. These radiatively inefficient AGN are connected to low to intermediate luminosity AGN. The evolution of the low-luminosity AGN has been probed by several studies using deeper, narrow-area surveys such as VLA-COSMOS 3GHz Large project (Smolčić et al. 2017) and LoTSS Deep Field (Sabater et al. 2019; Kondapally et al. 2022).
White et al. (2020a, b) have created a large sample of AGNs with the purpose of identifying how the properties of such sources vary as a function of redshift and/or environment. This sample is known as the GLEAM [GaLactic and Extragalactic All-sky MWA (Murchison Widefield Array; Tingay et al. 2013; Hurley-Walker et al. 2017)] 4-Jy (G4Jy) Sample and is 10 times larger than the 3CRR, due to its lower flux density limit and larger survey area (|$24,731\, \text{deg}^2$|). The 3CRR sample, selected at low radio frequency and complete with optical data, has made it possible to conduct groundbreaking research such as the link between radio jet power and optical luminosity (Rawlings & Saunders 1991), which indicates that extragalactic radio sources share a central engine mechanism responsible for their emission. Moreover, the 3CRR sample was used in the study of Barthel (1989) to show that a unification model based on the orientation of the AGN can explain the observed properties of quasars and radio galaxies.
The G4Jy Sample, which is a complete sample above 4-Jy at 151 MHz, is made up of 1863 of the brightest radio sources selected from the GLEAM survey using the extragalactic catalogue (Galactic latitude, |b| > 10°). The GLEAM survey uses observations from MWA, the precursor telescope for the low-frequency component of the SKA (Square Kilometre Array). MWA surveyed the entire southern sky (Declination, Dec < 30°) at low radio frequencies in the range 72–231 MHz. The resolution of the GLEAM survey is declination dependant and is approximated by |$2.5\times 2.2\, \text{arcmin}^2/\text{cos}(\delta +26.7^{\circ })$| at the central frequency of 154 MHz, which corresponds to a synthesized beam of ∼2 arcmin at 200 MHz. The G4Jy Sample does not suffer from orientation bias as these sources are selected at low frequencies. Lower frequency observations do not suffer from Doppler-boosting effects, a phenomenon inherent in surveys at higher frequencies.
White et al. (2020a, 2020b) performed the host-galaxy identification for 1606 radio sources in the G4Jy Sample through visual inspection of overlays comprising a set of radio contours overlaid onto mid-infrared Wide-field Infrared Survey Explorer (WISE; Wright et al. 2010) W1 band images. The sets of radio contours used are from; GLEAM (∼2-arcmin resolution), NRAO VLA Sky Survey [NVSS (45-arcsec resolution); Condon et al. 1998] or Sydney University Molonglo Sky Survey [SUMSS (45-arcsec resolution); Mauch et al. 2003, 2007] and TIFR GMRT Sky Survey first alternative data release [TGSS ADR1 (25-arcsec resolution); Intema et al. 2017]. The host galaxy identification of the remaining sources was constrained by the poor resolution provided by NVSS/SUMSS and TGSS. Moreover, there were some discrepancies in the literature concerning the host galaxy for some of the sources. As a result, higher-resolution observations are needed to perform host galaxy identification of these sources. The main objective of this study is to identify the host galaxies of a subset of 140 G4Jy radio sources, which we regard as the MeerKAT-2019 subset. The MeerKAT-2019 subset sources showed complex ‘enigmatic’ radio morphologies at 45 and 25-arcsec resolution images. These sources were observed with MeerKAT (1.3 GHz and ∼7-arcsec resolution), providing better sensitivity and angular resolution than TGSS and NVSS/SUMSS.
1.1 Paper outline
This paper is outlined as follows. Section 2 gives a brief overview of the radio and infrared data we used to construct the overlays. The MeerKAT observations and data reduction are briefly described. Section 3 explains how the MeerKAT-2019 subset was constructed, the overlays creation, and our labels for host-galaxy identification. The results, of which we give comments on the most interesting sources, are given in Section 4. The discussion and conclusion are given in sections 5 and 6, respectively. Throughout this paper, a flat Lambda-CDM model was assumed: H0 = 70 km/s/Mpc, Ωm = 0.3, and ΩΛ = 0.7 (Planck Collaboration 2016), and we use the sign convention S ∝ να, where α is the spectral index and S is the integrated flux density at frequency ν.
2 DATA
In this section, we briefly describe (1) the MeerKAT observations and data reduction and (2) additionally the data sets used to perform the host galaxy identification of our sample.
2.1 Radio data
2.1.1 MeerKAT observations (1.3 GHz)
We observed1 140 objects from the G4Jy Sample using the L-band (856–1712 MHz) receivers of MeerKAT (Jonas & MeerKAT Team 2016). A combination of the brightness of the G4Jy sources, and the high instantaneous sensitivity and excellent (u, v) plane coverage of MeerKAT meant that 5-min snapshot observations per target were sufficient to achieve the two primary goals of unambiguous host galaxy identification, and morphological classification. Targets were observed in four blocks, grouped by Right Ascension. The overhead encompassed scans of the primary calibrator (either PKS B1934−638 or PKS 0408−65, depending on the RA), an RA-dependent secondary calibrator that was typically observed after every five target scans, the primary polarisation calibrator (either 3C 138 or 3C 286), and slewing time. The telescope correlator was configured to deliver 8-second integrations and 4096 frequency channels, with the latter being averaged by a factor of 4 prior to processing.
The data were processed in standard fashion, with the raw MeerKAT visibilities for each of the four blocks being converted to Measurement Set format using the KAT Data Access Library.2 Standard flagging commands were applied to all targets to remove the low gain edges of the telescope’s bandpass response, as well as to flag known regions of persistent radio frequency interference on interferometer spacings below 600 m. Autoflagging software was then used on the calibrator sources, after which the calibrators were used to derive instrumental delay, gain, and bandpass corrections. Application of these corrections to the calibrators themselves was followed by another round of autoflagging on the residual (corrected−model) visibilities, after which the instrumental corrections were re-derived and applied to the targets. The calibrated target data were then flagged and imaged. A multifrequency clean component model derived from deconvolution within a masked region was used to perform phase and delay self-calibration, and the corrected data were re-imaged and finally primary beam corrected. A Briggs robust value (Briggs 1995) of −0.3 was used, except for a small number of targets where uniform (robust = −2.0) weighting was used to increase angular resolution and reduce residual side lobe emission that remained due to calibration deficiencies.
The self-calibrated data were also re-imaged in eight frequency chunks with data on spacings below 164 wavelengths discarded from the inner region of the (u, v) plane. The resulting cube was used to produce a spectral-index image for each source. This was achieved by masking all pixels where the Stokes I brightness was below 1 mJy per beam, and subsequently extracting the spectrum of each sight-line through the cube and fitting for its slope in log-brightness vs log-frequency space.
Flagging was performed using the casa (McMullin et al. 2007) and tricolour3 packages. Referenced calibration made use of the casa package, with the cubical (Kenyon et al. 2018) software used for self-calibration. All imaging made use of the wsclean (Offringa et al. 2014) software. Primary beam correction was done in the image plane, using an azimuthally averaged image of the Stokes I primary beam, evaluated at the nominal band centre frequency of 1284 MHz using the eidos (Asad et al. 2021) package. Our data processing scripts are available online4 (Heywood 2020), and can be consulted for further details of the reduction process. These scripts were also used to deploy the data processing jobs on the two high-performance computing facilities used for this work, namely the ilifu5 cloud computing facility, and the Centre for High-Performance Computing (chpc6) Lengau cluster.
2.1.2 GLEAM catalogue and images (72-231 MHz)
The GLEAM survey constitutes observations from MWA, which observed the entire southern sky Dec. < 30° at low radio frequencies in the range of 72–231 MHz. We use 200 MHz images with a resolution of ∼2 arcmin of the GLEAM survey for visual inspection in this work. GLEAM survey covers 24 831 square degrees for Dec. < 30° and |b| > 10°. The survey is 99.97 per cent reliable above a 5σ (∼50 mJy) threshold, 90 per cent complete at 170 mJy, and 50 per cent complete at 55 mJy.
2.1.3 TGSS ADR1 catalogue and images (150 MHz)
TGSS is made up of observations from the Giant Metrewave Radio Telescope (GMRT; Swarup 1991), which surveyed the sky above Dec. = −55°. Observations at Dec. > −53° were retained for the ADR1 due to the poor data quality at low elevations. Moreover, TGSS has incomplete coverage in the region 6h.5 < RA < 9h.5, 25° < Dec. < 39° (Intema et al. 2017). This survey, observed at 150 MHz frequency with a resolution of 25 × 25 arcsec2 (or |$25^{^{\prime \prime }}\times 25^{^{\prime \prime }}/\text{cos}(\text{Dec} - 19^{\circ }$|) for sources at Dec < 19°, complements the broad frequency range and surface-brightness sensitivity of the MWA. The survey has a sensitivity limit below 5 mJy per beam (7σ threshold) over the majority of its coverage and an astrometric accuracy of < 2 arcsec in RA and Dec.
2.1.4 SUMSS catalogue and images (843 MHz)
The Molonglo Observatory Synthesis Telescope (MOST; Mills 1981; Robertson 1991) previously surveyed the southern sky (Dec. < −30°, |b| > 10°) at 843 MHz creating SUMSS with a resolution of 45 × 45 arcsec. At Dec. < −50° SUMSS reaches a sensitivity limit of ∼5σ (6 mJy per beam) threshold and 10 mJy per beam at Dec. > −50°. For sources brighter than 200 mJy at 843 MHz, the observed astrometric accuracy is ∼ 1–2 arcsec, while the largest positional error observed for the survey is ∼ 30 arcsec. This survey has a similar resolution and sensitivity to NVSS. For this work, SUMSS is used for GLEAM components at Dec <−39.5° and NVSS for GLEAM components at Dec ≥−39.5°.
2.1.5 NVSS catalogue and images (1.4 GHz)
NVSS constitutes observations from the Very Large Array (VLA; Thompson et al. 1980) which surveyed the northern sky (Dec. = −40°) at 1.4 GHz frequency. The survey has a resolution of 45 arcsec and a 5σ threshold in peak source brightness of ∼2.5 mJy per beam. For sources brighter than 15 mJy, the observed astrometric accuracy is ≤ 1 arcsec.
2.2 Mid-infrared
2.2.1 AllWISE catalogue
WISE, launched in 2009, is an infrared space telescope that has mapped the entire sky at four wavelength bands 3.4, 4.6, 12, and 22 |$\mu$|m known as W1, W2, W3 and W4, respectively. The four bands correspond to 6.1, 6.4, 6.5, and 12.0 arcsec resolution. In this work, we use the 6.1 arcsec resolution images (W1 band, 3.4 |$\mu$|m) as our greyscale and the AllWISE (Cutri et al. 2013) positions for host galaxy identification, complemented by the radio contours from the surveys mentioned in Section 2.1. At the 5σ threshold, AllWISE has an improved sensitivity of 0.054, 0.071, 0.73, and 5.0 mJy in the four WISE bands, respectively, and positional error of < 1 arcsec, as compared to the WISE All-Sky data release (Cutri et al. 2012).
2.3 Optical redshift surveys
2.3.1 6dFGS
The 6-degree Field Galaxy Survey (6dFGS; Jones et al. 2004) obtained optical spectroscopy for the southern sky (Dec < 0°, |b| > 0°) using the 6dF multifibre spectroscopy on the United Kingdom Schmidt Telescope (UKST; Tritton 1978). For sources brighter than K = 12.65 in the 2MASS Extended Source Catalog (Jarrett et al. 2000), the final data release of 6dFGS (DR3; Jones et al. 2009) provides redshifts, which we use for our work. 6dFGS has a resulting median redshift of 0.053.
2.3.2 2MRS
The 2 Micron All Sky Survey (2MASS; Skrutskie et al. 2006) Redshift Survey (2MRS; Huchra et al. 2012) constitute spectroscopic observations from various telescopes (see Table 1). The survey initially observed galaxies with Ks < 11.25 mag and later observed galaxies below the Galactic latitude limit of 6dFGS (|b| > 10°). We use redshifts from this survey for G4Jy sources not detected in the 6dFGS. For sources which had no available redshift in 6dFGS and 2MRS, we further searched their redshifts from the NASA/IPAC Extragalactic Database, Kilo-Degree Survey (KiDS; de Jong et al. 2017), Sloan Digital Sky Survey (SDSS; Alam et al. 2015), and Half Million Quasars (HMQ) Catalogue (Flesch 2015).
Telescopes and instruments used to compile 2MRS.
| Observatory/telescope | Camera | Coverage | Res. | No. of galaxies with Ks |
|---|---|---|---|---|
| (Å) | (Å) | <11.75 >11.75 | ||
| Fred L. Whipple 1.5 m | FAST | 3500–7400 | 5 | 7590 2596 |
| Cerro Tololo 1.5 m | RCSpec | 3700–7200 | 7 | 3245 238 |
| McDonald 2.1 m | es2 | 3700–6400 | 4 | 114 50 |
| Cerro Tololo 4 m | RCSpec | 3700–7400 | 3 | 48 |
| Hobby-Eberly 9.2 m | LRS | 4300–10800 | 9 | 3 |
‘Res.’ in column 5 is the spectral resolution. Table taken from Huchra et al. (2012).
3 METHOD
3.1 Construction of the MeerKAT-2019 subset
Our sample, defined as the MeerKAT-2019 subset, comprises 140 radio sources from the G4Jy Sample. Poor resolution data at 25 and 45 arcsec and complex morphologies limited host-galaxy identification. The MeerKAT-2019 subset includes: 13 sources (Table 2) whose host galaxy was provided (White et al. 2020a, b), one G4Jy source (G4Jy 1523) whose host galaxy is affected by nearby bright, mid-infrared emission, and 126 sources with uncertain identification. For the 13 sources, there were some discrepancies in the literature concerning their host galaxy; therefore, higher-resolution images were required to confirm the provided host galaxy.
| G4Jy name | GLEAM component name(s) |
|---|---|
| G4Jy 40 | GLEAM J002056-190853 and GLEAM J002112-191041 |
| G4Jy 285 | GLEAM J024103+084523 and GLEAM J024107 + 084452 |
| G4Jy 333 | GLEAM J031152-312959 |
| G4Jy 570 | GLEAM J054049-614233 |
| G4Jy 717 | GLEAM J083710-195152 |
| G4Jy 747 | GLEAM J090147-255516 |
| G4Jy 917 | GLEAM J112554-352321 |
| G4Jy 1094 | GLEAM J134855-252700 |
| G4Jy 1205 | GLEAM J145509-365543 |
| G4Jy 1260 | GLEAM J152659-135059 |
| G4Jy 1537 | GLEAM J192606-573954 |
| G4Jy 1638 | GLEAM J203444-354849 |
| G4Jy 1741 | GLEAM J215415-455319 and GLEAM J215435-454954 |
3.2 Overlays
We use APLpy (Robitaille & Bressert 2012) to create overlays that are ∼10 arcmin across for all the sources in the MeerKAT-2019 subset. The overlays consist of contours from four surveys (GLEAM, NVSS/SUMSS, TGSS, and MeerKAT) overlaid onto the mid-infrared WISE (W1, 3.4 |$\mu$|m) images. The W1 band is used as our greyscale image because it has better sensitivity and resolution than W2, W3, and W4 bands. However, for radio sources with no detected host in mid-infrared, we use the optical Pan-STARRS (Panoramic Survey Telescope and Rapid Response System; Chambers et al. 2019) images instead. Radio sources with a faint infrared host are most likely at high redshifts. So we need deep surveys to probe them, hence the use of Pan-STARRS images in this study. We set the lowest contour level to 3σ for the radio surveys in the overlays. However, for sources with artefacts in the MeerKAT imaging, we set the lowest contour to a higher value. We then cross-matched the MeerKAT-2019 subset with the AllWISE catalogue, using a radius of 3 arcmin from the centroid position via TOPCAT (Taylor 2005), and overplot these AllWISE positions in the overlays (indicated by green crosses, ’x’). Fig. 1 is an example of a 10 × 10 arcmin overlay showing all of the data sets mentioned in this section.
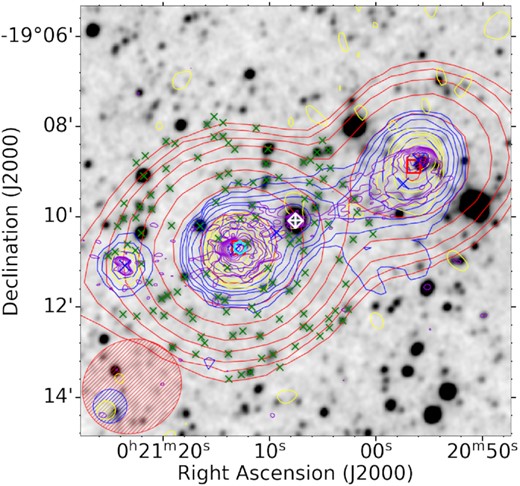
An overlay of G4Jy 40, centred at RA = 00h21m07s.53, Dec. = −19°10′05″.4. The radio contours are from GLEAM (170–231 MHz; red), NVSS (1.4 GHz; blue), TGSS (150 MHz; yellow), and MeerKAT (1.3 GHz; purple), overlaid on the inverted greyscale WISE (3.4 |$\mu$|m) image. Shown in the bottom left corner is the beam size for each survey; GLEAM (red), NVSS(blue), TGSS (yellow), and MeerKAT (purple). The cyan hexagon indicates the brightness-weighted centroid position, the green crosses ‘x’ signs are the AllWISE positions within 3 arcmin from the centroid position, and the white ‘ + ’ sign is the AllWISE position for the corresponding host galaxy for this source. The white diamond is the 6dFGS position, the red squares are the GLEAM components positions, and blue crosses are NVSS/SUMSS components positions.
3.3 Radio morphology classification
Host galaxy identification is highly associated with understanding the radio morphology of the radio source. In this paper, we determine the radio morphology of the MeerKAT-2019 subset using the ∼7 arcsec resolution images from MeerKAT, and use the following four categories:
‘single’ – the radio source has a compact morphology in the MeerKAT image,
‘double’ – the radio source has two distinct lobes in the MeerKAT image but there is no detection of the radio core, or the source has an extended, elongated emission which is suggestive of radio lobes in the MeerKAT image,
‘triple’ – the radio source has a radio core and two distinct radio lobes in the MeerKAT image,
‘complex’ – the radio source has a morphology that does not meet the above three categories.
3.4 Host galaxy identification and flags
We aim to identify the host galaxy of the radio emission by assessing the radio morphology and determining which AllWISE position is likely the host galaxy. For sources with ‘single’ morphology, the host galaxy is likely to be at the centre. The host galaxy is likely to be located between the two distinct radio lobes for sources with ‘double’ morphology. However, if there is more than one AllWISE position on-axis, we leave the source unidentified; unless there is a definitive core position. For radio sources with ‘triple’ morphology, we expect the host galaxy to coincide with the position of the radio core (see Fig. 1). Lastly, we are unable to provide the host galaxy for sources with ‘complex’ morphology. Following White et al. (2020a, b), we then use the following labels to indicate the host flag for each source in the MeerKAT-2019 subset;
‘i’ – the source has a corresponding host galaxy identified in the AllWISE/2MASS catalogue,
‘u’ – it is unclear which AllWISE or 2MASS source is the host galaxy as (1) the source has complex radio morphology or (2) there is no radio core detected in the MeerKAT image that coincides with the AllWISE/2MASS position,
‘m’ – either the source is affected by nearby bright mid-infrared emission, or there is no corresponding AllWISE position,
‘n’ – given the type of radio emission involved (e.g. cluster relic or radio halo), no host-galaxy position should be indicated.
3.5 Flux densities at 1.3 GHz
We calculated the integrated flux density at 1.3 GHz (|$S_{\rm {int}, 1.3~\rm {GHz}}$|) for 1387 G4Jy sources by summing the flux densities within the 3σ contour level, where σ is the local rms in the 1.3 GHz image from MeerKAT. This integrated flux density is in Jy per beam, and to convert it to Jy; we divide the summation by the beam area. We provide the core intensity (|$S_{\rm {core}}, 1.3~\rm {GHz}$|), in Jy per beam units, for sources with an identified host galaxy by extracting the flux density at the pixel value of the host galaxy position in the MeerKAT image. Both integrated flux densities and core intensity are provided in Table 3.
Properties of sources in the MeerKAT-2019 subset. Columns 1–3 are; the G4Jy name, host flag, and the host galaxy name. Columns 4 is the redshift, Column 5 is the redshift reference, and Column 6 is the spectral index (α) between 151 and 1300 MHz. Columns 7–9 are the core intensity at 1300 MHz (SC13) in mJy per beam, integrated flux density at 1300 MHz (S13) in Jy, and integrated flux density at 1400 MHz (S14) in Jy. Columns 10–11 are the radio luminosities at 1300 MHz (L13) and 1400 MHz (L14) in W/Hz. Column 12 is the linear size (LS), and Column 13 is the radio morphology label based on MeerKAT ∼7-arcsec resolution images. The full table is available online.
| G4Jy name | Host flag | Host name | z | z ref. | α | SC13 | S13 | S14 | L13 | L14 | LS | Morphology |
|---|---|---|---|---|---|---|---|---|---|---|---|---|
| [mJy per beam] | [Jy] | [Jy] | [W/Hz] | [W/Hz] | [Mpc] | |||||||
| G4Jy 14 | i | WISEA J000707.12 + 053609.6 | 0.216 | (1) | 98.166 | 0.441 ± 0.085 | Double | |||||
| G4Jy 40 | i | WISEA J002107.53 − 191005.4 | 0.096 | (2) | −0.707 | 0.230 | 1.261 ± 0.140 | 2.85 × 1025 | Triple | |||
| G4Jy 47 | i | WISEA J002531.45 − 330246.2 | 0.05 | (2) | −0.815 | 0.424 | 1.527 ± 0.162 | 1.494 | 8.95 × 1024 | 8.75 × 1024 | 0.091 | Double |
| G4Jy 77 | u | −2.604 | 0.046 ± 0.027 | 0.035 | Complex | |||||||
| G4Jy 84 | i | WISEA J004605.01 − 633319.2 | 0.075 | (2) | −0.82 | 0.269 | 0.731 ± 0.100 | 9.94 × 1024 | 0.215 | Triple |
3.6 Calculation of spectral indices
4 RESULTS
The host-galaxy identification of radio emission of 140 G4Jy sources relies upon the ∼7-arcsec resolution images from MeerKAT as existing radio images from TGSS and NVSS/SUMSS with resolutions of 25 and 45 arcsec, respectively, do not provide sufficient detail. We resolve the ’complex’ morphologies evident in the TGSS and/or NVSS/SUMSS images with these new images from MeerKAT and enable host-galaxy identification for 98 sources in the MeerKAT-2019 subset, through visual inspection of the overlays and manually pinpointing the host galaxy. Of the 98 sources with an identified host galaxy in the MeerKAT-2019 subset, the host galaxies of two sources (G4Jy 1371 and G4Jy 1540) were identified using the optical Pan-STARRS images as the host galaxies of these sources are not detected in the mid-infrared AllWISE images. In Table 3, we present our findings for the MeerKAT-2019 subset.
4.1 Radio sources with an identified host galaxy
4.1.1 Previous identifications
White et al. (2020a, b) provided the host-galaxy identification for 13 of 140 G4Jy radio sources (Figs 1, 2, 3 and 4). However, as these were ‘borderline’ identifications (with some accompanied by discrepancies in the literature), higher-resolution data was needed to confirm the host galaxy. With the MeerKAT follow-up images, we confirm the host galaxy of the 13 sources provided by White et al. (2020a, b).

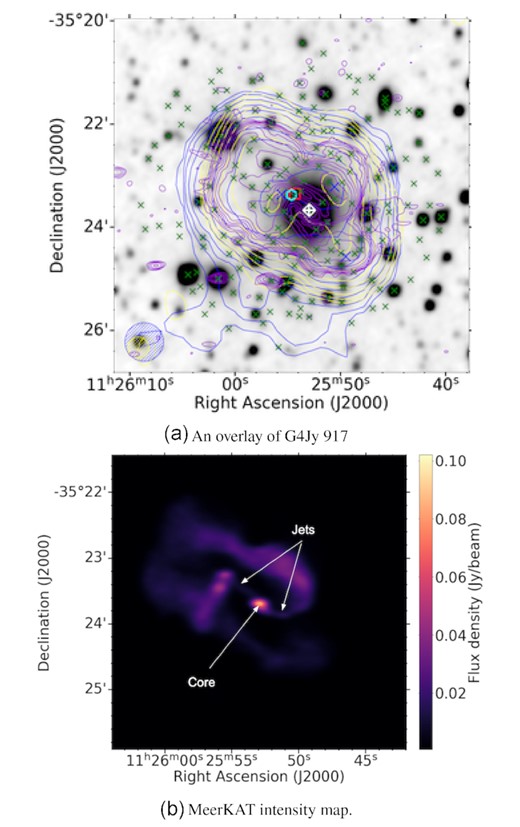
Top panel: An overlay of G4Jy 917 (one of the 13 sources with discrepancies in the literature concerning the host galaxy identification). The data sets, symbols, beams, and contours are the same as those described in Fig. 1. Bottom panel: The intensity map at 1.3 GHz of G4Jy 917 showing the structure of this radio source. The morphology is very complex, and includes the emission eastwards of the core forming a right-angled bend.

G4Jy 40 (Fig. 1): White et al. (2020a, b) inferred the host galaxy (AllWISE J002107.53 − 191005.4) of this radio source (with radio lobes GLEAM J002056 − 190853 and GLEAM J002112 − 191041) based on the interpretation of Nilsson (1998) that G4Jy 40 has a ‘double’ morphology with the largest angular size of 252 arcsec, using the radio map of Schilizzi & McAdam (1975). However, the 4.7 GHz image from Reid, Kronberg & Perley (1999) reveals a radio source with ‘triple’ morphology that spans ∼160 arcsec from lobe to lobe (cyan contours in fig. 15 of White et al. 2020a). Due to the incorrect coordinates presented in the Reid et al. (1999) image, a higher resolution image needs to be used to confirm if GLEAM J002056 − 190853 is associated with G4Jy 40. The ∼7-arcsec resolution image from MeerKAT reveals a radio source with ‘triple’ morphology. The tight concentric contours at the centre (RA = 00h21m05s.54, Dec. = −19°10′05″.34) verify that AllWISE J002107.53 − 191005.4 (g002107.53 − 191005.4, z = 0.096) is the mid-infrared host galaxy of the extended emission, and GLEAM J002056 − 190853 and GLEAM J002112 − 191041 are the radio lobes, with flux densities of 0.919323 Jy and 4.862407 Jy at 151 MHz, respectively.
G4Jy 285 (GLEAM J024103 + 084523 and GLEAM J024107 + 084452; Fig. 2a): The host galaxy of the extended radio emission of G4Jy 285, also known as NGC 1044 (4C +08.11), is AllWISE J024106.17 + 084416.9, also detected in 2MRS (J02410618 + 0844167, z = 0.021). This identification is in agreement with White et al. (2020a, b) and van Velzen et al. (2012). The radio source traces a zig-zag emission; however, it was unclear whether the low-frequency emission towards the northeast (GLEAM J024133 + 084940) is associated with G4Jy 284 (White et al. 2020a, b). We cannot confirm whether the radio emission is associated with G4Jy 284 as there is no detection of this emission in our 1.3 GHz image from MeerKAT. We only have a shallow ‘snapshot’ image. A longer observation time might reveal something.
G4Jy 333 (GLEAM J031152 − 312959; Fig. 2b): MeerKAT contours reveal ‘triple’ morphology with edge-brightened lobes. We confirm that AllWISE J031154.01 − 313010.6 is the host galaxy. However, we find no redshift information in the literature.
G4Jy 570 (GLEAM J054049 − 614233; Fig. 2c): ‘Double’ extended morphology is evident in SUMSS and MeerKAT contours. This radio source (PKS B0540 − 617) is in cluster A3362. The host galaxy of this radio source is AllWISE J054050.82 − 614237.2 (z = 0.081) which agrees with White et al. (2020a, b) and the optical identification of Jones & McAdam (1992).
G4Jy 717 (GLEAM J083710 − 195152; Fig. 2d): This radio source, known as PKS B0834 − 19, has ‘single’ morphology evident in all surveys. We confirm that the host galaxy of this source is AllWISE J083711.18 − 195156.6 (z = 1.032), which agrees with the optical identification provided by Fugmann, Meisenheimer & Roeser (1988) and di Serego Alighieri et al. (1994). We note the artefacts in the MeerKAT image, which result in an overestimated integrated flux density at 1.3 GHz. We therefore present an overlay where the lowest contour level has been adjusted to 48σ. G4Jy 717 has the flattest spectral index (|$\alpha ^{1300~\rm {MHz}}_{151~\rm {MHz}} = -0.17$|) in the MeerKAT-2019 subset.
G4Jy 747 (GLEAM J090147 − 255516; PKS 0859 − 25, Fig. 2e): ‘Double’ extended radio morphology is evident in the MeerKAT contours. We confirm that AllWISE J090147.26 − 255516.2 (z = 0.305) is the host galaxy of the radio emission. The MeerKAT contours start at 48σ as artefacts are present at lower levels.
G4Jy 917 (GLEAM J112554 − 352321): PKS B1123 − 315 (Fig. 3a) is in the cluster AS 665. The higher resolution image from MeerKAT shows the distinct inner structure of this radio source where knots are evident in the eastwards jet (Fig. 3b). Furthermore, this jet is bent forming a right angle while the emission resulting from the westwards jet appears to be pushed towards south. The radio core is evident in the 1.3 GHz image from MeerKAT, which coincides with the position of the radio core from the 4.9 GHz image provided by Ekers et al. (1989). The host galaxy of the radio emission is AllWISE J112552.95 − 352340.3, which appears in 6dFGS (g1125529 − 352340, z = 0.033). This identification is in agreement with van Velzen et al. (2012), and a deeper MeerKAT image will be presented by Thorat et al. (in preparation).
G4Jy 1094: The wide-angle tail (WAT) radio morphology is evident in the MeerKAT image (Fig. 4a). We confirm that the radio source is hosted by the mid-infrared AllWISE source J134854.17 − 252724.5, detected in 6dFGS at z = 0.126. This radio source is in the cluster Abell 1791, located at the centre (Slee, Perley & Siegman 1989).
G4Jy 1205: The radio source known as PKS 1452 − 367 (Fig. 4b) has a ‘triple’ morphology with diffuse edges evident in MeerKAT contours. We confirm that the mid-infrared AllWISE J145509.61 − 365507.4 (g1455096 − 365508, z = 0.095) is the host galaxy, which is in agreement with van Velzen et al. (2012).
G4Jy 1260: The radio source known as PKS B1526 − 136 (Fig. 4c) has a ‘single’ morphology evident in all surveys. We confirm that the host galaxy is the mid-infrared AllWISE J152659.45 − 135100.0 at redshift z = 1.687. This radio-loud quasar has the highest redshift in the MeerKAT-2019 subset (so far) and is one of the sources with a very flat spectral index (|$\alpha _{1300~\rm {MHz}}^{151~\rm {MHz}} = -0.36$|). The MeerKAT contours start at 24σ as artefacts are present at lower levels.
G4Jy 1537 (PKS B1921 − 577 Fig. 4d): ‘Triple’ morphology is evident in the 1.3 GHz image from MeerKAT. We confirm that the mid-infrared AllWISE J192605.75 − 574016.4 (6dFGS g1926057 − 574017, z = 0.061) is the host galaxy of the WAT radio source. The MeerKAT contours start at 12σ as artefacts are present at lower levels.
G4Jy 1638 (Fig. 4e): The head-tail radio morphology is evident in the 1.3 GHz image from MeerKAT. The corresponding host galaxy of the radio emission is AllWISE J203444.74 − 354901.7, appearing in 6dFGS as g2034447 − 354902 (z = 0.089).
G4Jy 1741 (Fig. 4f): Edge-brightened radio lobes and a compact core are evident in the 1.3 GHz image from MeerKAT. We confirm that AllWISE J215422.96 − 455231.3 is the host galaxy of the ‘triple’ morphology radio source, detected in 6dFGS (g2154230 − 455232, z = 0.145).
4.1.2 Newly identified X- and S-/Z-shaped radio sources
X- and S-/Z-shaped radio galaxies form a subclass of radio galaxies with intriguing radio morphology. These radio galaxies are characterised by an additional pair of secondary radio lobes (generally referred to as wings) that are more diffuse, have low surface brightness and are misaligned from the radio core compared to the primary lobes (Ekers et al. 1978; Leahy & Parma 1992). The orientation of the secondary lobes generally defines the X- or S-/Z-shaped morphology. For S-/Z-shaped morphology, the low surface brightness secondary lobes emerge from the edges of the high surface brightness secondary lobes. For X-shaped morphology, the axis of the secondary lobes is nearly perpendicular to the axis of the primary lobes. In the MeerKAT-2019 subset, four radio sources (G4Jy 284, G4Jy 530, G4Jy 1377, and G4Jy 1798) have an X-shaped morphology, and one radio source (G4Jy 1523) has an S-/Z-shaped morphology (Fig. 5). Below, we discuss only a few (11) that are interesting.
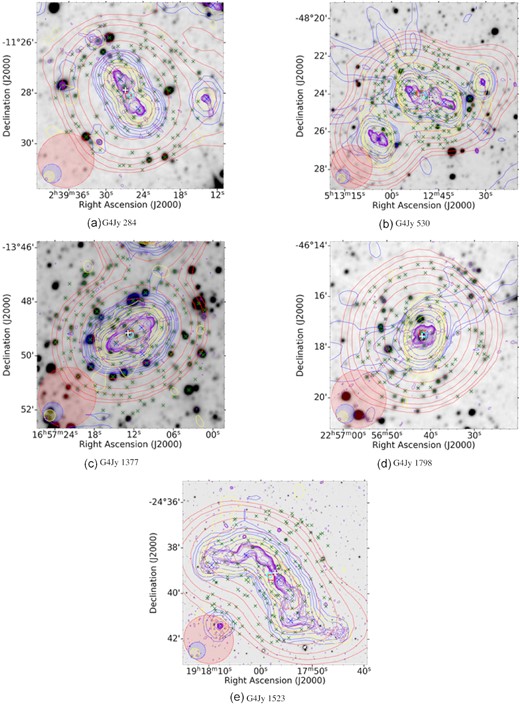
Four radio sources with X-shaped morphology and one G4Jy source (G4Jy 1523) with S-/Z-shaped morphology in the MeerKAT-2019 subset. For G4Jy 1523, PanSTARRS image is used as greyscale base for the overlay and green crosses are from 2MASS. The data sets, symbols, beams, and contours are the same as those described in Fig. 1.
G4Jy 284 (GLEAM J023926 − 112806, Fig. 5a): A (borderline) X-shaped morphology, and the detection of the radio core, is evident in the MeerKAT contours. The mid-infrared source that coincides with the radio core is AllWISE J023926.84 − 112752.6. However, there is no redshift information in the literature for the host galaxy.
G4Jy 530 (GLEAM J051250 − 482358, PKS 0511-48, Fig. 5b): For this radio source, Smith & Robertson (1985), using a radio map with a spatial resolution of 53 arcsec × 46 arcsec, reported an optical identification that matches AllWISE J051247.41 − 482416.5, classified as a Seyfert type 2 galaxy. However, White et al. (2020a, b) asserted that the radio map of Smith & Robertson (1985) is not of sufficient resolution to rule out the presence of another mid-infrared source on the axis connecting the radio lobes. The X-shape morphology evident in the MeerKAT contours support the optical identification of Smith & Robertson (1985), and we therefore identify AllWISE J051247.41 − 482416.5 as the host galaxy. The low surface brightness radio emission (secondary lobes) might be due to plasma backflow in the primary lobes. The MeerKAT contours start at 12σ as artefacts are present at lower levels.
G4Jy 1377 (GLEAM J165712 − 134911, Fig. 5c): This radio source is known as PKS B1654-137. An X-shaped morphology is evident in the MeerKAT contours, with the primary lobes aligned northwest and southeast, while the secondary lobes are aligned northeast and southwest. The mid-infrared counterpart of this radio source is the AllWISE source, J165712.85 − 134909.5, at z = 0.124.
G4Jy 1798 (GLEAM J225641 − 461726, Fig. 5d): There are two AllWISE positions near the centroid, and it was not clear which AllWISE position is the most-likely host galaxy. The MeerKAT image reveals an X-shaped galaxy with the primary lobes aligned northwest and southeast while the secondary lobes are aligned northeast and southwest. We then use a DSS image as our greyscale and identify the mid-infrared host galaxy as 2MASS J22564196 − 4617345, at z = 0.080.
G4Jy 1523 (GLEAM J191757 − 243917, Fig. 5e): MeerKAT contours reveal a Z-shaped radio galaxy suggestive of precessing jets. The radio source was previously assigned host flag ‘m’ as the host galaxy in the AllWISE image is obscured by the nearby star (White et al. 2020a, b). As a result, the 2MASS image was used as the greyscale base image for the overlay, and the identified host galaxy is 2MASS 19175722 − 2439053. We find no redshift information in the literature, but follow-up SALT (Southern African Large Telescope; Buckley, Swart & Meiring 2006) spectroscopy (PI: White) has been obtained for this source.
4.1.3 Newly identified head-tail and WAT radio sources
Head-tail and WAT radio galaxies are a subclass of radio galaxies associated with clusters. The WAT and head-tail morphology observed is explained by the radio galaxy falling into a cluster. The ram pressure from the surrounding medium pushes the radio jets and lobes backwards, forming a WAT or head-tail morphology. In the MeerKAT-2019 subset, we find that 10 sources have head-tail morphology and 14 have WAT morphology.
G4Jy 14 (GLEAM J000707 + 053607, Fig. 6a): ‘Double’, extended radio morphology, suggestive of radio lobes, is evident in NVSS and TGSS contours. The host galaxy could not previously be provided for this source as there were two mid-infrared positions at a similar distance from the centroid position, and there was no detection of the radio core (White et al. 2020a, b). However, the radio contours from MeerKAT reveal two resolved sources, with one being a head-tail radio source towards the northeast. We therefore mark the two sources as unrelated (see Section 4.2.2) and identify the host galaxy of the head-tail radio source as the mid-infrared AllWISE J000707.12 + 053609.6 (z = 0.2161). The MeerKAT contours start at 12σ as artefacts are present at lower levels.
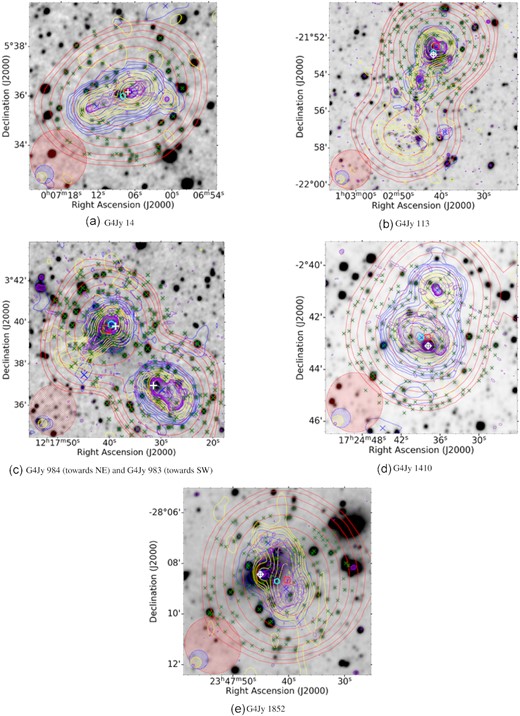
Radio sources with head-tail morphology in the MeerKAT-2019 subset. The data sets, symbols, beams, and contours are the same as those described in Fig. 1.
G4Jy 113 (GLEAM J010241 − 215227, Fig. 6b): The radio source whose radio morphology from NVSS and TGSS is challenging to understand is located in the cluster Abell 133. White et al. (2020a, b) could not provide the host galaxy due to the disagreements in the literature concerning the radio morphology of G4Jy 113. Slee et al. (2001) classified the radio source as a cluster relic generated via merger shocks, while Rizza et al. (2000) and Fujita et al. (2002) classified this source as a remnant radio lobe. Our radio image from MeerKAT indicates that G4Jy 113 is a head-tail radio source, with concentric radio-contours nearby highlighting an unrelated source. The former has spectral index, |$\alpha ^{1300~\rm {MHz}}_{151~\rm {MHz}} = -1.8$|, and we identify the host galaxy as the AllWISE J010241.76 − 215254.2, detected in 6dFGS as g0102418 − 215256 (z = 0.057). This galaxy is referred to as galaxy ’H’ by Slee et al. (2001).
G4Jy 984 (GLEAM J121740 + 033940; Fig. 6c): There is a tail of emission evident in the TGSS contours for the northern source; however, it was unclear where the host galaxy could be. The MeerKAT contours reveal a far more detailed view of the structure of G4Jy 984, with the inner parts of the jet appearing distinct before combining into a tail towards the southeast. We identify the host galaxy as AllWISE J121738.77 + 033948.2 (z = 0.0778). The southwest radio source (not part of the MeerKAT-2019 subset) appears in the G4Jy catalogue as G4Jy 983 (4C + 04.41), previously assigned host flag ’m’. This radio source is in the cluster Z5029 (RA = 12h17m14s, Dec. = 03°39′23″). Head-tail radio morphology is evident in the MeerKAT contours, and we identify the host galaxy as the mid-infrared AllWISE source J121731.43 + 033656.4 (z = 0.773).
G4Jy 1410 (GLEAM J172437 − 024246; Fig. 6d): Based on the compactness of the TGSS contours, it was unclear whether G4Jy 1410 (the southern source in the overlay) is a ‘double’ or a head-tail galaxy, and as such, the host galaxy was not provided. MeerKAT contours reveal a head-tail radio galaxy (G4Jy 1410) and a ‘double’ morphology radio galaxy (GLEAM J172436 − 024055) towards the north, which has a flux density of 3.79 Jy at 151 MHz (White et al. 2020a, b). Therefore, GLEAM J172436 − 024055 is not part of the G4Jy catalogue as it does not meet the criterion of flux density being above 4-Jy at 151 MHz. We identify the host galaxy of G4Jy 1410 as AllWISE J172437.79 − 024305.6 detected in 2MRS as J17243782 − 0243062 (z = 0.034). This identification is in agreement with van Velzen et al. (2012).
G4Jy 1852 (GLEAM J234740 − 280839; Fig. 6e): This radio source is in the cluster Abell 4035. A head-tail radio morphology with diffuse tail emission is evident in the MeerKAT contours. The mid-infrared source that coincides with the radio core is AllWISE J234745.06 − 280826.2. This identification corresponds to IC 5358, which is the brightest galaxy in a cluster.
G4Jy 47 (GLEAM J002530 − 330336; Fig. 7a): Wide-angle tail radio morphology is evident in the higher-resolution image from MeerKAT. This radio source appears in the Molonglo Southern 4-Jy Sample (MS4; Burgess & Hunstead 2006) as MRC B0023-33. The host galaxy is the mid-infrared AllWISE J002531.45-330246.2 at redshift z = 0.050, which agrees with the host galaxy identification of Burgess & Hunstead (2006) and van Velzen et al. (2012). An optical counterpart is ESO 350-G-15, the brightest galaxy in cluster AS 41 (ACO89).
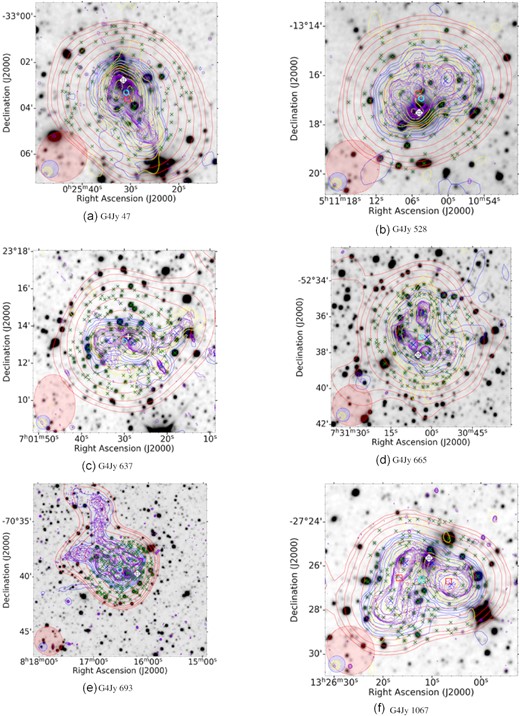
Radio sources with WAT radio morphology in the MeerKAT-2019 subset. The data sets, symbols, beams, and contours are the same as those described in Fig. 1.
G4Jy 528 (GLEAM J051104 − 131645; Fig. 7b): WAT morphology with diffuse tail emission is evident in MeerKAT contours. The host galaxy is AllWISE J051104.82 − 131730.3 at z = 0.043.
G4Jy 637 (GLEAM J070130 + 231313; Fig. 7c): A radio source known as 4C +23.18 in the literature (Olsen 1970). Based on the TGSS contours, White et al. (2020a, b) identified the morphology as WAT. However, it was unclear which AllWISE source was the host galaxy. With a higher resolution image from MeerKAT, we confirm that this is indeed a WAT radio source. We identify the host galaxy as AllWISE J070129.05 + 231325.6 at z = 0.092.
G4Jy 665 (GLEAM J073104 − 523710; Fig. 7d): The radio morphology of G4Jy 665 is not quite clear in both SUMSS and TGSS contours, and as a result, this radio source was assigned a ‘complex’ morphology label, host flag ‘u’ and confusion flag ‘0’. The MeerKAT image reveals two unrelated radio sources, both having a WAT morphology and a detected host galaxy in the mid-infrared. The host galaxy of the southern source (indicated with a white ‘ + ’ in the overlay) is AllWISE J073104.92 − 523808.6 at z = 0.09035, and the host galaxy of the northern source is AllWISE J073103.39 − 523546.8 at z = 0.07690. Given that the MeerKAT image reveals two unrelated sources with integrated flux densities of 0.836 Jy (southern source) and 0.314 Jy (northern source) at 1.3 GHz, this implies the integrated flux density at 151 MHz (5.12469 Jy) of G4Jy 665 is the sum of the integrated flux densities of the two sources. With this in mind, G4Jy 665 should be re-inspected in terms of the integrated flux density at 151 MHz, as this parameter is the G4Jy Sample’s defining criterion (S151 MHz > 4 Jy).
G4Jy 693 (GLEAM J081630 − 703925; Fig. 7e): WAT radio morphology is evident in the MeerKAT contours, including detection of the radio core. An optical identification provided by Jones & McAdam (1992) does not coincide with the radio core detected in the MeerKAT image. The corresponding host galaxy is the mid-infrared AllWISE J081611.74-703945.3 at redshift z = 0.033.
G4Jy 1067 (GLEAM J132606 − 272641 and GLEAM J132616 − 272632, Fig. 7f): The radio contours from TGSS, NVSS and MeerKAT indicate WAT radio morphology, but the radio core is only detected in the MeerKAT image. The mid-infrared source that coincides with the radio core is AllWISE J132610.59 − 272538.6 at redshift z = 0.044. This radio source, known as PKS B1323 − 271, is in the cluster Abell 1736.
4.1.4 New identification via the spectral index map
G4Jy 1554 (GLEAM J193252 − 081739): White et al. (2020a, b) classified this radio source as ‘double’ morphology based on NVSS and TGSS contours. ‘Complex’ morphology is evident in the MeerKAT contours (Fig. 8a) with a slight indication of a radio core. The spectral index map (see Section 2.1.1; Fig. 8b) indicates a radio core. We identify AllWISE J193252.79 − 081803.4 (z = 0.101) as the host galaxy.
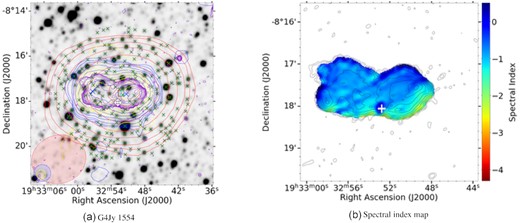
Top panel: Overlay of G4Jy 1554. The data sets, symbols, beams, and contours are the same as those described in Fig. 1. Bottom panel: The spectral index map with MeerKAT contours overlaid.
4.1.5 Giant radio galaxies
Giant radio galaxies (GRGs) are a subclass of radio galaxies with a projected linear size > 0.7 Mpc. Their incredible Mpc-scale sizes make them one of the largest known objects in the Universe. We find three sources (Figs 4f and 9) with linear sizes above 0.7 Mpc in the MeerKAT-2019 subset.
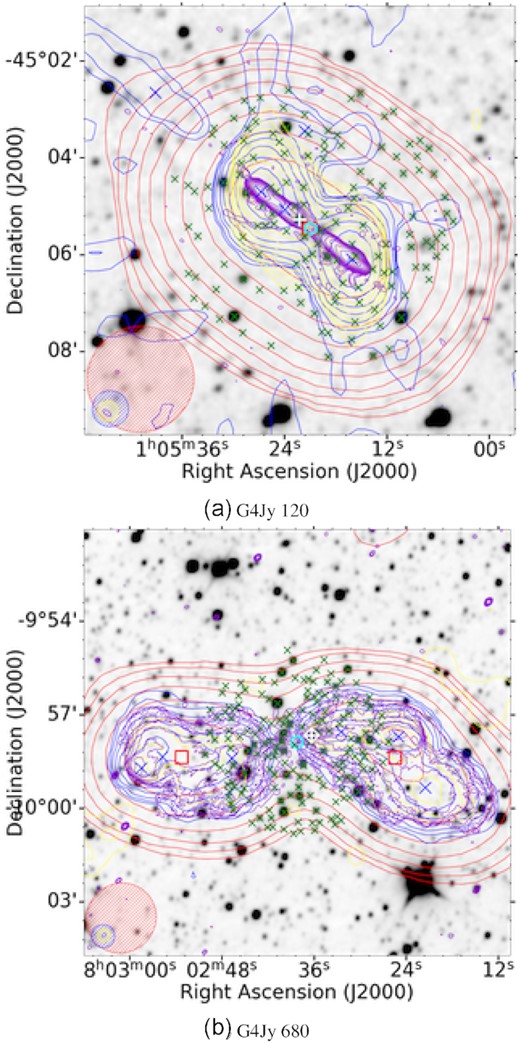
Radio galaxies with linear size above 0.7 Mpc in the MeerKAT-2019 subset. The data sets, symbols, beams, and contours are the same as those described in Fig. 1.
G4Jy 120 (GLEAM J010521 − 450527; Fig. 9a): ‘Double’ morphology is evident in the MeerKAT contours. We identify the host galaxy as AllWISE J010522.21 − 450517.2 at z = 0.7. This redshift value and the angular extent of 139.717 arcsec correspond to the linear size of 1.004 Mpc.
G4Jy 680 (GLEAM J080225 − 095823 and GLEAM J080253 − 095822; Fig. 9b): This radio source has several AllWISE positions that could be likely the host galaxy (White et al. 2020a). The MeerKAT image reveals the radio core which coincide with AllWISE J080236.28 − 095739.9, detected in 6dFGS as g0802363 − 095740. This identification is consistent with the optical identification of Schilizzi (1975). The redshift of 0.070 and the angular extent of 9.13 arcmin at 1.4 GHz correspond to the linear size of 0.732 Mpc.
4.1.6 Possible GRG
G4Jy 641 (GLEAM J070525 − 451328 and GLEAM J070546 − 451158; PKS B0703 − 451): A possible GRG with radio emission that spans ∼8 arcmin from lobe to lobe in the 1.3 GHz image from MeerKAT (Fig. 10). ‘Triple’ morphology is evident in the MeerKAT contours, and there is a detection of a hotspot in the southwestern lobe. However, there is an AllWISE position at the center of this hotspot emission, which makes it likely unrelated to G4Jy 641 An optical identification provided by Jones & McAdam (1992; marked with the orange ‘ + ’ sign in the overlay) appears to be incorrect. The corresponding host galaxy that coincides with the radio core is AllWISE J070532.94 − 451308.8. We find no redshift information in the literature and therefore cannot provide the linear size of this radio galaxy.

4.1.7 Quasi-stellar radio source
G4Jy 1843 (GLEAM J233511 − 663702; PKS B2332 − 62; Fig. 11): This radio source has a ‘complex’ morphology (likely artefacts) evident in the SUMSS contours, and there is no coverage in TGSS. The diffraction spikes evident in the mid-infrared image, and WISE colours, suggest that AllWISE J233510.30 − 663655.7 (close to the centroid position) is a star. However, the ‘double’ morphology evident in the MeerKAT contours strongly suggest that this AllWISE source is likely the host galaxy of the radio emission (cf. the quasar 3C 273, which appears in the G4Jy Sample as G4Jy 1003; White et al. 2020a). We therefore regard AllWISE J233510.30 − 663655.7 as the host galaxy of this radio emission.
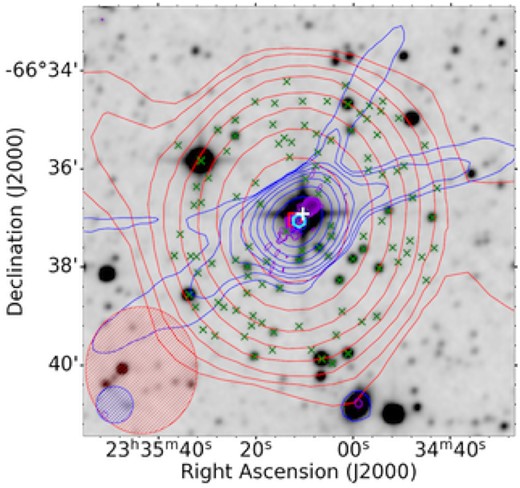
An overlay of a quasi stellar object (G4Jy 1843). The data sets, symbols, beams, and contours are the same as those described in Fig. 1.
4.2 Unidentified sources
The overlays for MeerKAT-2019 subset sources discussed in this section are available as online supplementary material.
4.2.1 Amorphous morphology
G4Jy 77 (GLEAM J004130 − 092221) is B0038 − 096 in the cluster Abell 85. This radio source is interpreted as a radio halo in the literature (Bagchi, Pislar & Lima Neto 1998). The unusual morphology in the NVSS and TGSS contours is also evident in the MeerKAT image. We find that this radio source has the steepest spectral index (|$\alpha ^{1300~\rm {MHz}}_{151~\rm {MHz}} = -2.604$|) in the MeerKAT-2019 subset, followed by G4Jy 1117 (|$\alpha ^{1300~\rm {MHz}}_{151~\rm {MHz}} = -2.018$|).
G4Jy 513 (GLEAM J045826 − 300717, PKS B0456 − 30): This radio source in cluster A3297 has a dense field of mid-infrared AllWISE sources. Jones & McAdam (1992) interpreted the radio morphology as a cluster halo. The optical identification they provided coincide with the mid-infrared AllWISE source marked with the letter ‘A’ in our overlay. This galaxy is at z = 0.131, which is consistent with the redshift of the cluster. We are unable to provide/confirm whether the provided optical identification by Jones & McAdam (1992) is the host galaxy for this radio emission due to the complex, amorphous morphology evident even in the higher-resolution image from MeerKAT. There is no detection of the radio core in neither the MeerKAT image nor the spectral index map.
G4Jy 700 (GLEAM J082231 + 055626): A radio source with diffuse emission known as 3C 198 in the 3C catalogue. Wyndham (1966) provided an optical identification corresponding to AllWISE J082231.95 + 055706.8 marked with the letter ‘A’ in our overlay. However, there is no core detection in the higher-resolution image from MeerKAT nor in the spectral index map. The lack of core detection could be that the MeerKAT images are generated from 5-min snapshot observations, and a longer integration time may be needed. The spectral index map reveals old emission in the inner regions, indicating that there is no ongoing ejection of electrons. This is the typical distribution of spectral indices in radio galaxies. Often the plasma near the centre is a result of backflow from the jets and is therefore older with a steeper spectral index.
4.2.2 Unrelated sources
Radio sources whose radio emission is blended together by NVSS/SUMSS (45 arcsec resolution) and TGSS (25 arcsec resolution) but MeerKAT images (∼7 arcsec resolution) reveal two resolved sources. We find six sources (G4Jy 14, G4Jy 456, G4Jy 665, G4Jy 671, G4Jy 1491, and G4Jy 1815) in the MeerKAT-2019 subset where MeerKAT images (VLASS image for G4Jy 456) clearly reveal two unrelated sources. For G4Jy 671 and G4Jy 1491, the morphology in both NVSS/SUMSS and TGSS was uncertain, and the sources were therefore assigned ‘complex’ morphology (White et al. 2020a, b). Given that the MeerKAT contours reveal two resolved, unrelated sources, we do not provide the properties (i.e, |$\alpha ^{1300~\rm {MHz}}_{151~\rm {MHz}}$|, |$L_{1300~\rm {MHz}}$| and linear size) of these sources since the integrated flux density at 151 MHz for these sources is the sum of the two resolved, unrelated sources which were blended by NVSS/SUMSS and TGSS.
G4Jy 456: The extended, ‘double’ morphology is evident in the NVSS and TGSS contours. To resolve the ambiguity of the host galaxy for this source, we obtained a higher-resolution radio image from archival VLA Sky Survey [VLASS; 3 GHz and 2.5 arcsec resolution); Lacy et al. 2020] as the MeerKAT visibilities for this particular source, and G4Jy 453 are entirely flagged. The VLASS contours reveals two unrelated sources with ‘single‘ and ‘double’ morphologies, respectively. The radio source with ‘single’ morphology has a faint mid-infrared host, while the mid-infrared counterpart of the ‘double’ morphology source is AllWISE J042536.76 + 083217.7 at z = 1.1.
G4Jy 671: In both SUMSS and TGSS contours, the radio morphology of G4Jy 671 is not clear. The radio morphology could either be a head-tail, core-jet or ‘double’ morphology with asymmetric jets. Hence this radio source was given the morphology label ‘complex’, host flag ‘u’, and confusion flag ’0’. The 1.3 GHz radio map from MeerKAT shows two unrelated radio sources with triple (northern source, S1.3 GHz = 1.062 Jy) and ‘single’ (southern source; S1.3 GHz = 0.237 Jy) morphology, both having a detected host galaxy in mid-infrared. The host galaxy of the triple morphology source is AllWISE J074146.64 − 523415.9, and AllWISE J074151.46 − 523524.4 is the host galaxy of the radio source with ‘single’ morphology. Given that there are two unrelated sources resolved by MeerKAT, the confusion flag of G4Jy 671 needs to be updated to ‘1’.
G4Jy 1491 (GLEAM J183356 − 394023): Based on the SUMSS and TGSS contours, it was unclear whether this radio source has a head-tail, ‘double’ or core-jet morphology (White et al. 2020b, a), and as such, it was assigned a ’complex’ morphology label. The MeerKAT image indicates that there are two unrelated sources having ‘single’ and ‘triple’ morphology, respectively. The radio source with ‘single’ morphology towards the north has no detected host galaxy in the mid-infrared, while the host galaxy of the southern source with ‘triple’ morphology is AllWISE J183359.36 − 394158.3. The integrated flux density of G4Jy 1491 at 151 MHz is 4.24799 Jy. Given that the MeerKAT image reveals two unrelated sources, this implies the integrated flux density at 151 MHz for G4Jy 1491 is the sum of the integrated flux densities of the two sources resolved by MeerKAT. With this in mind, the integrated flux density at 151 MHz of G4Jy 1491 needs to be recalculated and the confusion flag updated to ‘1’.
5 DISCUSSION
The primary aim of this work is to confirm/determine the host galaxy of the radio emission of 140 G4Jy sources (referred to as the MeerKAT-2019 subset) via visual inspection of overlays. Identifying the host galaxy of the radio source is required if we are to merge low-frequency radio data with other data sets, allowing us to develop a comprehensive, multiwavelength view of the many processes occurring within these radio sources. Of the 140 sources making up the MeerKAT-2019 subset, we have identified the host galaxy of 98 sources. The host galaxy of G4Jy 1554 was identified through the inspection of the spectral index map, as the host could not be resolved through the overlay. We therefore assigned host flag ‘i’ to the sources with an identified host galaxy. Of the remaining 42 sources with no identified host galaxy; 23 are assigned host flag ‘u’, 18 have a faint mid-infrared host and are assigned host flag ‘m’, and one source (G4Jy 77) is assigned host flag ‘n’ as this radio source is identified as a radio halo. These MeerKAT-2019 subset sources still have an ambiguous host galaxy, even with higher-resolution images from MeerKAT.
5.1 Brightness-weighted centroid to host-galaxy separation
Fig. 12 shows the separation between the brightness-weighted centroid position and host galaxy position for all the sources with an identified host galaxy, ncmp_GLEAM = 1 and confusion_flag = ‘0’ in the MeerKAT-2019 subset and the G4Jy Sample. The brightness-weighted centroid position is the weighted average of the NVSS/SUMSS components positions, where the flux densities of these components are taken as weights. The NVSS/SUMSS components are associated with the G4Jy sources if they are within the 3σ GLEAM contour. The brightness-weighted centroid position is subject to error, if, for instance, the G4Jy source has two components in NVSS/SUMSS, and one component is two times brighter than the other component. Then the brightness-weighted centroid position will be shifted to the brighter component. This centroid position will then have a significant offset from the radio core and the host galaxy position. The median offset in RA is 0.108 arcsec, and the median offset in Dec. is 2.322 arcsec for the MeerKAT-2019 subset. The median offset in RA and Dec. for the G4Jy Sample is −0.144 arcsec and −0.040 arcsec, respectively.
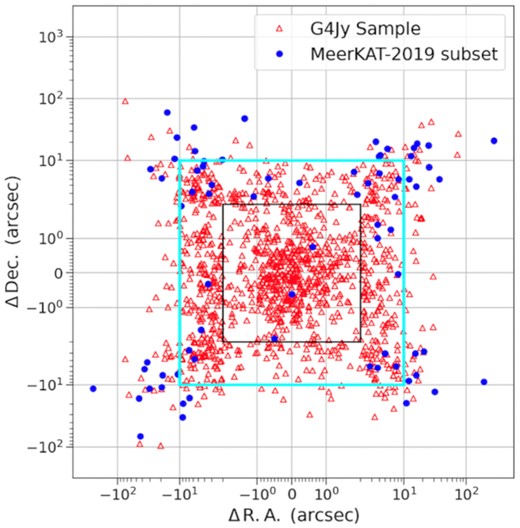
The brightness-weighted centroid position to host galaxy position separation plot for the G4Jy Sample (red unfilled triangles) and MeerKAT-2019 subset (blue filled circles) sources with an identified host galaxy, ncmp_GLEAM = ‘1’ and confusion_flag = ‘0’. The brightness-weighted centroid position is the weighted average of the NVSS/SUMSS components positions that are within the 3σ GLEAM contour of the G4Jy source. The ncmp_GLEAM indicates the number of GLEAM components associated with the G4Jy source. We selected sources with ncmp_GLEAM = ‘1’ because sources with more than one GLEAM component have the same brightness-weighted centroid position. The confusion_flag (either ‘0’ or ‘1’) indicates if the G4Jy source is affected by nearby unrelated emission detected above 6σ in NVSS/SUMSS and the position of the peak emission of this unrelated source is within the 3σ GLEAM contour level for the G4Jy source. We set the confusion_flag to ‘0’ to select sources that are not affected by nearby emission. The unusual square shape is because ‘symlog’ (a symmetric log) is used for the x- and y-scale. This means that it is linear in the region |ΔRA| < 2″ and |ΔDec| < 2″ (black square) and a log scale outside this region.
Overall, 1215 sources in the G4Jy Sample have an identified host galaxy (sources with host flag ‘i’), ncmp_GLEAM = ‘1’ and confusion_flag = ‘0’, while the MeerKAT-2019 subset have 72 sources satisfying these criteria. About 10 per cent of the sources in the G4Jy Sample have a larger positional offset (|$|\Delta \rm {R.A.}| \gt 10^{\prime \prime }$|, |$|\Delta \rm {Dec.}| \gt 10^{\prime \prime }$|; sources outside the square cyan region), while the majority of the sources (57 per cent) in the MeerKAT-2019 subset populate this outer region (see Table 4). We expect to have this larger positional offset for the MeerKAT-2019 subset because this subset is biased towards G4Jy sources with ‘complex’ morphologies (i.e. head-tail, WAT and morphology that is not compact, nor typical symmetric double lobed) evident in NVSS/SUMSS and TGSS. For instance, sources with head-tail (Fig. 6) and WAT (Fig. 7) morphologies have their centroid position at the centre of the emission while their host galaxy is at the apex of the emission.
The fractions (and numbers) of G4Jy sources, within the full sample and MeerKAT-2019 subset, with different degrees of offset between the brightness-weighted centroid position and the host-galaxy position (see Section 5.1). ‘Black outline’ and ‘cyan outline’ are referring to the demarcations in Fig. 12.
| Within the black outline | Between the black and cyan outlines | Outside of the cyan outline | |
|---|---|---|---|
| (Approximately |$|\Delta \rm {R.A.}| \lt 2^{\prime \prime }$|, | (Approximately |$2^{\prime \prime } \lt |\Delta \rm {R.A.}| \lt 10^{\prime \prime }$|, | (Approximately |$|\Delta \rm {R.A.}| \gt 10^{\prime \prime }$|, | |
| |$|\Delta \rm {Dec.}| \lt 2^{\prime \prime }$|) | |$2^{\prime \prime } \lt |\Delta \rm {Dec.}| \lt 10^{\prime \prime }$|) | |$|\Delta \rm {Dec.}| \gt 10^{\prime \prime }$|) | |
| G4Jy Sample | 41 per cent (496) | 49 per cent (597) | 10 per cent (122) |
| MeerKAT-2019 subset | 4 per cent (3) | 39 per cent (28) | 57 per cent (41) |
Note that these G4Jy sources have had the following criteria applied to them: host flag = ‘i’, confusion flag = ’0’, and consisting of a single GLEAM component.
5.2 WISE colors
The WISE survey’s four bands make it an excellent instrument for investigating galaxies’ stellar structure and interstellar processes. The two shorter wavelength bands (W1 and W2) are used to map the stellar mass distribution in galaxies, whilst the longer wavelength bands (W3 and W4) are used to map warm dust emission and polycyclic aromatic hydrocarbon emission, which both trace the present star formation activity and AGN heating. Additionally, the WISE colours (W1–W2 and W2–W3) have been utilised to distinguish various astronomical objects (e.g. Wright et al. 2010; Mateos et al. 2012; Mingo et al. 2016), which occupy distinct areas in the WISE colour–colour plot. The WISE colour–colour plot (Fig. 13) is produced in this work to see where the G4Jy Sample and MeerKAT-2019 subset sources lie. Overall, 1,606 sources from the G4Jy Sample have host galaxy identified in AllWISE; however, 13 sources form part of the MeerKAT-2019 subset (see Section 3 on the subset construction). The MeerKAT-2019 subset has 92 sources (including the 13) with AllWISE identification. Most sources in both the G4Jy Sample (63 per cent) and MeerKAT-2019 subset (42 per cent) occupy the AGN region (W1–W2 > 0.5), with a handful of sources in the AGN wedge (solid black box) defined by Mateos et al. (2012) for the G4Jy Sample. The G4Jy Sample is dominated by powerful AGN selected at low frequencies. There is a greater fraction of sources in the elliptical region for the MeerKAT-2019 subset (34 per cent) than in the G4Jy Sample (10 per cent).
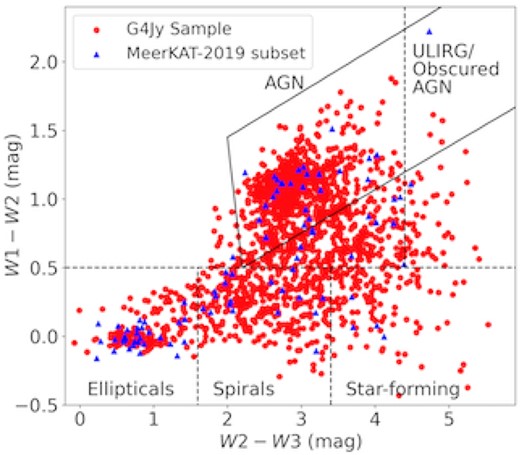
WISE colour–colour plot. W1, W2, and W3 correspond to wavelengths 3.4 |$\mu$|m, 4.6 |$\mu$|m, and 12 |$\mu$|m.
The elliptical and spiral regions are known to be dominated by low-excitation radio galaxies (LERGs) as these sources lack a dusty torus, while high-excitation radio galaxies (HERGs) dominate the region above W1–W2 > 0.5. Additionally, LERGs are thought to be connected with FR-I, whereas HERGs are thought to be related to FR-II. Several investigations, however, demonstrate that there is an overlap between HERG FR-Is and LERG FR-IIs (e.g. Hardcastle, Evans & Croston 2009; Best & Heckman 2012; Whittam et al. 2018; Mingo et al. 2019).
5.3 Radio properties
5.3.1 Spectral indices
The two-point spectral index (|$\alpha ^{1300~\rm {MHz}}_{151~\rm {MHz}}$|) between two radio frequencies (151 MHz and 1300 MHz) was calculated for 1338 sources in the MeerKAT-2019 subset, assuming S ∝ να, where S is the integrated flux density at frequency ν. The top panel of Fig. 14 shows the overall distribution of the two-point spectral index between 151 MHz and 1300 MHz for the MeerKAT-2019 subset compared with the distribution of the two-point spectral index between 151 MHz and 1400 MHz for the G4Jy Sample (obtained from the G4Jy catalogue). Both samples have a Gaussian-like distribution. The median spectral index of the G4Jy Sample and the MeerKAT-2019 subset are −0.781 and −0.819, respectively. One-hundred and twenty-seven (127) sources in the MeerKAT-2019 subset have a spectral index in the range |$-1.2 \lt \alpha ^{1300~\rm {MHz}}_{151~\rm {MHz}} \lt -0.5$|, and the majority of these sources (74) have a ‘double’ morphology (bottom panel of Fig. 14). Six MeerKAT-2019 subset sources have an ultra-steep spectral index (|$\alpha ^{1300~\rm {MHz}}_{151~\rm {MHz}} \lt -1.2$|), where G4Jy 77 is identified as a radio halo in the literature, G4Jy 1117 is likely a cluster relic, G4Jy 113 and G4Jy 1852 have head-tail morphology, and G4Jy 708 has a WAT morphology. The steep spectra of radio halos and cluster relics is due to synchrotron and Inverse Compton (IC) losses.
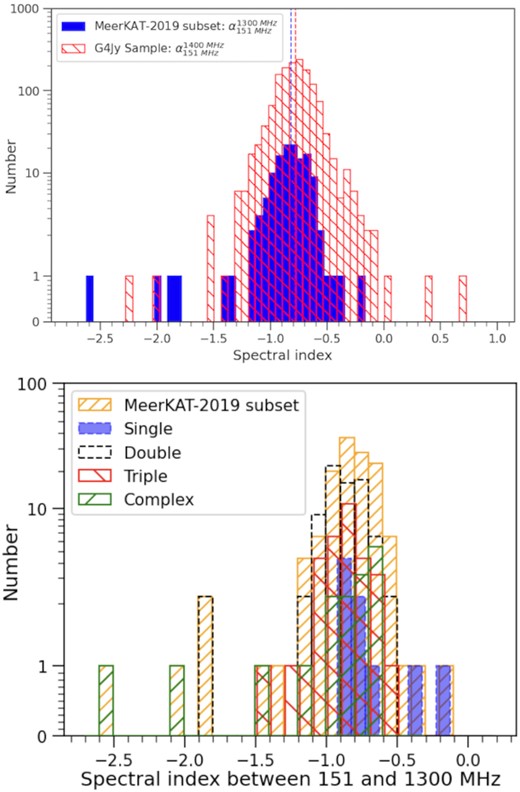
Top panel: The distribution of the spectral index between 151 and 1300 MHz for the MeerKAT-2019 subset and the distribution of the spectral index between 151 and 1400 MHz for the G4Jy Sample. Bottom panel: The distribution of the spectral index between 151 and 1300 MHz for the full MeerKAT-2019 subset and sources with ’single’, ’double’, ’triple’, and ’complex’ morphologies.
5.3.2 Radio luminosity
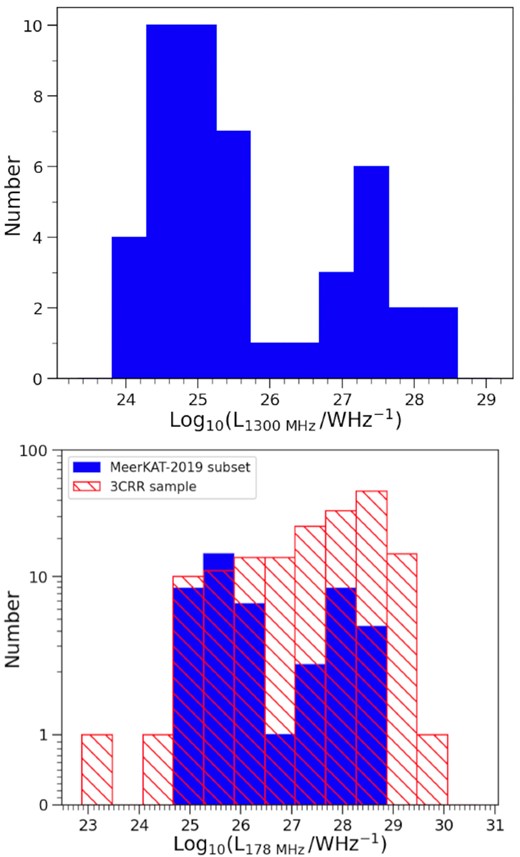
Top panel: The distribution of the 1.3 GHz radio luminosity for the MeerKAT-2019 subset. Bottom panel: For the purpose of comparison with the 3CRR sample, we calculated the integrated flux density at 178 MHz to obtain the radio luminosity at 178 MHz for the MeerKAT-2019 subset.
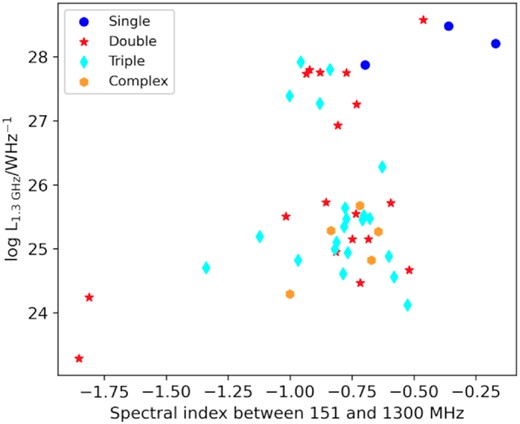
Plot of the two-point spectral index between 151 MHz and 1300 MHz vs. radio luminosity at 1300 MHz for the MeerKAT-2019 subset.
The bottom panel of Fig. 15 shows the distribution of the radio luminosities at 178 MHz (|$L_{178~\rm {MHz}}$|) of the MeerKAT-2019 subset compared with the radio luminosities 178 MHz (|$L_{178~\rm {MHz}}$|) of the 3CRR sample. For the radio luminosity at 178 MHz of the MeerKAT-2019 subset, we obtained (1) the integrated flux density at 181 MHz and (2) the G4Jy spectral index (calculated within the GLEAM band) from the G4Jy catalogue and calculated the integrated flux density at 178 MHz. The MeerKAT-2019 subset sources have typical radio luminosities of the 1025 W Hz−1 to 1029 W Hz−1, while 3CRR sources have typical radio luminosities of the order 1024 to 1030 W Hz−1.
6 CONCLUSIONS
This study presents the analysis from studying 140 radio sources in the G4Jy Sample, referred to as the MeerKAT-2019 subset. Here, we summarize the work done in this study.
We constructed ∼10’ by 10’ overlays for all the sources in the MeerKAT-2019 subset. The overlays comprise radio data from GLEAM (200 MHz, ∼2-arcmin resolution), NVSS (1400 MHz, 45-arcsec resolution)/SUMSS (843 MHz, 45-arcsec resolution), TGSS (150 MHz, 25-arcsec resolution), and MeerKAT (1300 MHz, ∼7-arcsec resolution), overlaid onto mid-infrared WISE images (3.4 |$\mu$|m).
We visually inspected the overlays and classified 11 sources as ‘single’ morphology, 78 as ‘double’, 33 as ‘triple’ and 16 as ‘complex’ morphology radio sources. We note that most sources have radio morphology of typical symmetric lobes, while 10 sources have head-tail morphology, 14 have WAT morphology, and 5 have X-, S-/Z-shaped morphology.
We have identified the host galaxy of 98 sources in the MeerKAT-2019 subset, where the host galaxies were manually pinpointed through visual inspection. The 98 sources are assigned host flag ‘i’, following White et al. (2020a, b) Of the remaining sources with no host galaxy identified, 23 are assigned host flag ‘u’ as they have an ambiguous host even with higher resolution images from MeerKAT, G4Jy 77 is assigned host flag ’n’ as it is identified as a radio halo in the literature, and 18 are assigned host flag ‘m’ as they have a faint mid-infrared host.
Based on the brightness-weighted centroid position to host galaxy position separation plot, the MeerKAT-2019 subset have larger positional offset compared to the G4Jy Sample. The MeerKAT-2019 subset is biased towards the G4Jy sources with ‘complex’ morphologies (including those with head-tail and WAT morphologies). We therefore expect to have these larger positional offsets. For instance, in head-tail sources, the host galaxy position will be near the apex of the radio emission instead of at the centre, where the brightness-weighted centroid position is.
We collected redshifts for 51 radio sources with an identified host galaxy in the MeerKAT-2019 subset and calculated their radio luminosity at 1.3 GHz. Radio sources with the steepest spectral index (|$\alpha ^{1300~\rm {MHz}}_{151~\rm {MHz}} \lt -1.2$|) have low radio luminosities. These MeerKAT-2019 subset sources have typical head-tail morphology evident in MeerKAT contours. In contrast, sources with flat spectral index (|$-0.5 \lt \alpha ^{1300~\rm {MHz}}_{151~\rm {MHz}} \lt 0.5$|) have higher radio luminosities and redshifts above 1. The higher luminosity of compact, flat spectrum sources could be the result of relativistic beaming.
This study has demonstrated the significance of a telescope’s angular resolution and sensitivity for morphological classification and host-galaxy cross-identification of radio sources at low frequencies. The sensitivity and angular resolution (∼7 arcsec) of MeerKAT has allowed us to resolve ambiguous host-galaxy identifications and enigmatic radio morphologies of the MeerKAT-2019 subset, evident in NVSS/SUMSS (45 arcsec) and/or TGSS (25 arcsec) images.
These new identifications are crucial for gathering multiwavelength data, with 42 of these MeerKAT-2019 subset sources having already been observed (2020-1-MLT-008; PI: White) with SALT.
SUPPORTING INFORMATION
Figure S1. Top panel: An overlay of G4Jy 77.
Figure S2. Top panel: An overlay of G4Jy 513.
Figure S3. Top panel: An overlay of G4Jy 700.
Figure S4. Radio sources in the MeerKAT-2019 subset whose radio emission is blended together by NVSS/SUMSS and TGSS.
Table S1. The full version of Table 3.
Please note: Oxford University Press is not responsible for the content or functionality of any supporting materials supplied by the authors. Any queries (other than missing material) should be directed to the corresponding author for the article.
ACKNOWLEDGEMENTS
The MeerKAT telescope is operated by the South African Radio Astronomy Observatory, which is a facility of the National Research Foundation, an agency of the Department of Science and Innovation. We acknowledge use of the Inter-University Institute for Data Intensive Astronomy (IDIA) data-intensive research cloud for data processing. IDIA is a South African university partnership involving the University of Cape Town, the University of Pretoria, and the University of the Western Cape. The authors acknowledge the Centre for High-Performance Computing (CHPC), South Africa, for providing computational resources to this research project. We thank Chris Schollar, Masechaba Sydil Kupa, and Fernando Camilo for SARAO archive and DOI support. PKS and SVW acknowledge the financial assistance of the South African Radio Astronomy Observatory (SARAO; https://www.sarao.ac.za). IH also acknowledges support from SARAO, which is a facility of the National Research Foundation (NRF), an agency of the Department of Science and Innovation.
DATA AVAILABILITY
For updates on the G4Jy Sample, please see https://github.com/svw26/G4Jy. The MeerKAT images and overlays (DOI: 10.48479/wyab-t838) can be accessed at https://zenodo.org/communities/g4jy, as well as via the SARAO archive https://archive-gw-1.kat.ac.za/public/repository/10.48479/wyab-t838/index.html). The full Table 3 and overlays for sources discussed in Section 4.2 are available as online supplementary material.
Footnotes
Project code: SCI-20190418-SW-01, PI: White
Of the 140 sources, we were unable to obtain images for two sources (G4Jy 453 and G4Jy 456) as the visibilities were entirely flagged due to a burst of strong radio frequency interference.
We have excluded sources where MeerKAT contours reveal two unrelated sources (see Section 4.2.2).
