


ABSTRACT
HS 2325+8205 is a long-period eclipsing dwarf nova with an orbital period above the period gap (Porb > 3 h) and is reported to be a Z Cam-type dwarf nova. We study the light variation and the quasi-periodic oscillations (QPOs) of HS 2325+8205 based on the photometry of theTransiting Exoplanet Survey Satellite (TESS). Using a continuous wavelet transform, a Lomb–Scargle periodogram (LSP), and sine fitting methods, we find for the first time that there is a QPO of ∼2160 s in the long outburst top light curves of HS 2325+8205. Moreover, we find that the oscillation intensity of the QPOs of HS 2325+8205 is related to the orbital phase, and the intensity in orbital phases 0.5–0.9 is stronger than in orbital phases 0.1–0.5. Therefore, the relationship between the oscillation intensity of QPOs and the orbital phase may become a topic of research into the origin of QPOs. In addition, we use the LSP to correct the orbital period of HS 2325+8205 to 0.19433475(6) d.
1 INTRODUCTION
Dwarf novae (DNe) are a subtype of cataclysmic variable stars (CVs): a semi-detached close binary system consisting of a white dwarf (WD; primary) and a late-type star (secondary). Secondary matter fills the Roche lobe, and WD accreted matter from the secondary star through the inner Lagrangian point (Warner 1995). The transferred material from the secondary star forms a bright collision zone (hotspots) with the edge of the accretion disc (Warner 1995). Compared with other CVs, DNe have intermittent outbursts with small amplitudes, and the luminosity increases by about 2–8 magnitudes from a few days to a few weeks. According to the different characteristics of the outburst, DNe can be divided into three main subtypes: Z Cam, SU UMa, and U Gem. The outburst can be explained by the thermal limit-cycle instability in the accretion disc (DIM; Lasota 2001). The orbital evolution of CVs is driven by angular momentum loss (AML). It is remarkable that there is an obvious lack of CVs with a period of about 2–3 h, which is the well-known orbital period gap (Knigge 2006). The standard model explains the period gap by assuming a magnetic interruption mechanism; the magnetic braking (MB; Rappaport, Verbunt & Joss 1983) controls the AML above the period gap (Porb > 3 h), while the gravitational radiation (GR; Paczyński & Sienkiewicz 1981) drives the evolution of CVs in a shorter period (Porb < 2 h). The observed minus calculated (O − C) method of mid-eclipse times is an effective method to study the orbital period variation and is widely used to study the orbital period evolution of eclipsed binary stars. A large number of studies have shown that orbital cyclic variation exists in a large number of CVs,for example, V2051 Oph (Qian et al. 2015), EX Dra (Han et al. 2017), U Gem (Dai & Qian 2009), and EM Cyg (Liu et al. 2021). It is generally accepted that DNe have three types of rapid oscillations (Warner 2004): DNe oscillations (DNOs), long-period DNe oscillations (lp-DNOs), and quasi-periodic oscillations (QPOs). QPOs were first proposed by Patterson, Robinson & Nather (1977), and their period is longer than that of DNOs and lp-DNOs, ranging from hundreds of seconds to thousands of seconds.
HS 2325+8205 was classified as a CV candidate by Morgenroth (1936). It was classified as a CV by Aungwerojwit et al. (2005) in the Hamburg Quasar Survey (HQS; Hagen et al. 1995). Shears et al. (2011) observed 44 outbursts of HS 2325+8205 from 2007 to 2009, of which 33 occurred in a short period. The duration of the outburst was less than 7 d and the brightness was less than 14 mag, whereas the duration of the long outburst was greater than 9 d and the brightness was greater than 13.9 mag. Pyrzas et al. (2012) made photometric and spectroscopic observations of HS 2325+8205 from 2003 to 2007 and obtained many mid-eclipse times. Because of the short recurrence time (12–14 d), they classified HS 2325+8205 as a Z Cam-type DN. Hardy et al. (2017) also carried out photometry analysis on HS 2325+8205 and obtained three mid-eclipse times. The QPOs of HS 2325+8205 have not been studied because of the lack of observations. Based on the TESS photometry, we conducted an in-depth study of the light variations and QPOs.
In this paper, we investigate the data of HS 2325+8205 from TESS to study the light variations and the QPOs. This paper is structured as follows. In Section 2, we briefly describe the data of HS 2325+8205 observed by TESS. In Section 3, we present the characteristics of light variation and the detection of QPOs. In Section 4, we discuss the physics of the origin of QPOs. We conclude in Section 5.
2 TESS PHOTOMETRY
We have used the data released by the Transiting Exoplanet Survey Satellite (TESS; Ricker et al. 2015), which was launched in 2018, and these were generated by the TESS Science Processing Operations Center (SPOC; Jenkins et al. 2016) of the NASA Ames Research Center, which is managed by the TESS Payload Operations Center (POC) of the Massachusetts Institute of Technology (MIT). The wavelength of TESS’s observations range from 600 to 1000 nm, covering 2100 skies per pixel (Ricker et al. 2015). In TESS’s observations, the sky is divided into several sectors, and each sector observation is about one month. The sector observation has a long cadence (30 min) mode and a short cadence (2 min) mode.
HS 2325+8205 was observed by TESS in sectors 18, 19, 25, and 26, respectively. The observation time of sector 18 is from 2019 November 3 (MJD 58790) to 2019 November 27 (MJD 58814), sector 19 is from 2019 November 28 (MJD 58815) to 2019 December 23 (MJD 58840), sector 25 is from 2020 May 14 (MJD 58983) to 2020 June 8 (MJD 59008), and sector 26 was observed from 2020 June 9 (MJD 59009) to 2020 July 4 (MJD 59034). Each sector has a data gap of about 1 d due to data transmission. The total time of the four observations is about 94 d, with 68 685 data points, and the exposure time is 120 s in a short cadence mode (2 min). Seven outbursts in total were observed in the four observations, which provided a lot of data support for the study of HS 2325+8205 (see Fig. 1).
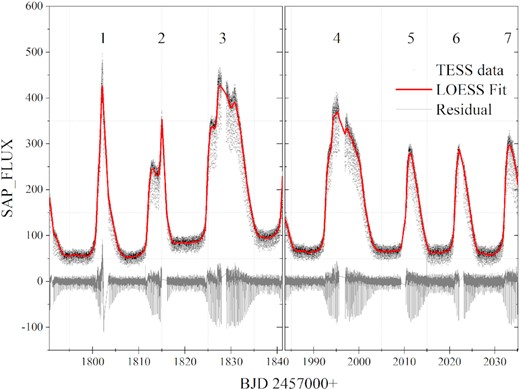
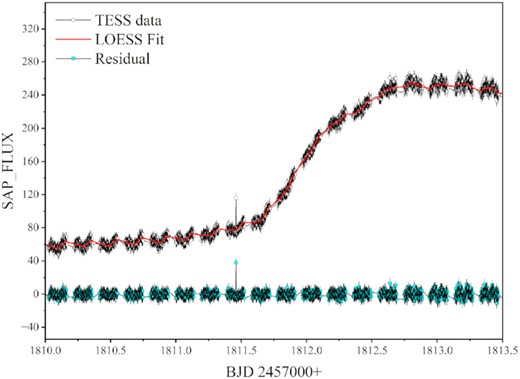
Light curves of HS 2325+8205. The solid red line is the loess fit, and the solid grey line is the residual.
3 DATA ANALYSIS AND RESULTS
3.1 Eclipse and period
The TESS data of HS 2325+8205 contain many eclipse curves, which provide excellent data support for us to study the orbital period. First, we used locally weighted regression (loess; Cleveland 1979) with a smoothing span of 0.1 to smooth the light curves. Then, the smooth curves were subtracted from the original light curves to obtain the light curves with the trend of outburst removed (see Fig. 1). Finally, a Lomb–Scargle periodogram (LSP; Lomb 1976) was used to detect periodic signals. Using the LSP, we find that the orbital period of HS 2325+8205 is 0.19433475(6)d (|$\Omega =5.145760\pm 1.56\times 10^{-6}\, \mathrm{d}^{-1}$|; see Fig. 2). The uncertainty is based on the half-width at half maximum (HWHM) Gaussian fitting centred on the significant power.
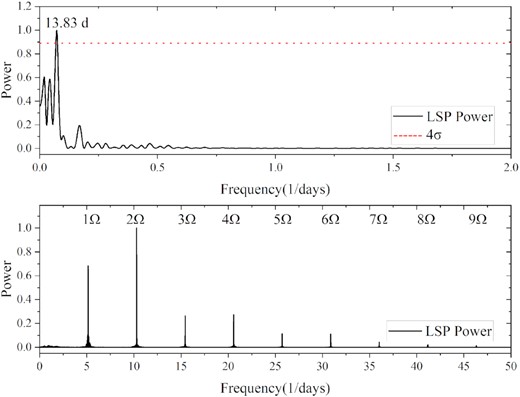
LSP of HS 2325+8205. The top panel is the LSP of the recurrence period, and the red dotted line is four times the standard deviation (4σ). The bottom panel is the LSP of the orbital period, and we use the symbol Ω for the frequency of the orbital period and its harmonics.
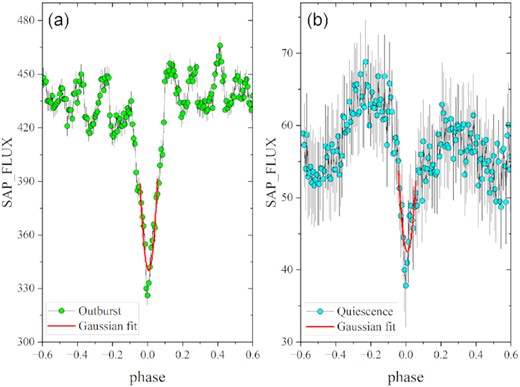
An example of using a Gaussian fit to obtain the minima. (a) and (b) are in outburst (E = 174) and quiescence (E = 15), respectively. The solid red line is the Gaussian fit of the eclipse profile with phase widths of 0.1.
3.2 Outbursts and double humps
TESS observed seven outbursts of HS 2325+8205 from four different sectors (18, 19, 25, and 26). All outbursts are numbered 1–7 by us in the order of outbursts (see Fig. 1). Depending on the duration of the outbursts, outbursts 1, 2, 5, and 6 are short outbursts with a duration of ∼7 d, while outbursts 3 and 4 are long outbursts with a duration of ∼13 d. Long outbursts are longer than ∼9 d observed by Shears et al. (2011). Four different outburst types can be distinguished by the amplitude and duration of the outbursts (see Fig. 4). Outburst 1 shows a short duration (∼7 d) but a large amplitude. Outburst 3 has a long duration (∼13 d) and a large amplitude, with the mid-brightness interval. Outburst 5 has a short duration (∼7 d) and a small amplitude. Outburst 2 has a short outburst duration with a mid-brightness interval. In other TESS observations, it can be found that the data will be abnormal near the end of an observation period, so the authenticity of outbursts 1 and 2 needs to be verified.
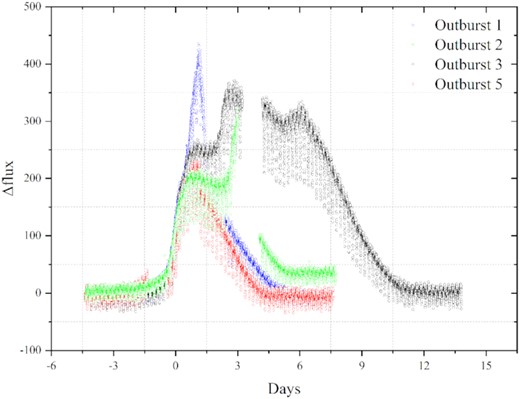
Comparison of four different outburst curves.
The LSP was used to detect the recurrence time of the outburst and the recurrence time obtained was ∼13.83 d (see Fig. 2). Based on the Ritter and Kolb catalogue (Ritter & Kolb 2003), Pyrzas et al. (2012) made statistics on 22 Z Cam-type DNe and found that their occurrence times are mainly distributed in the range 11–18 d, which is consistent with the recurrence time of HS 2325+8205 observed by TESS. It is further confirmed that HS 2325+8205 is a Z Cam-type DN in the recurrence time, but the standstill of the typical characteristic of Z Cam-type DNe still needs to be verified by the observation.
We folded all the quiescent data of HS 2325+8205 using 0.19433475(6) d and found the peculiar double humps similar to XY Ari at phases 0.2–0.4 and 0.7–0.9, which can be explained by ellipsoidal modulation (Warner 2003). According to the ellipsoidal modulation, the distorted Roche lobe shape of the secondary star faces us with the maximum area at orbital phases 0.25 and 0.75, showing double humps on the light curve (see Fig. 5). During the orbital phases 0.0–0.5, the secondary star moves away from us, and during the orbital phases 0.5–1.0, it moves closer to us. Therefore, the brightness of the secondary star in the orbital phases 0.5–1.0 is brighter than that in the orbital phases 0.0–0.5, and the darkest occurs in the orbital phases ∼0.5 of the secondary star eclipse.
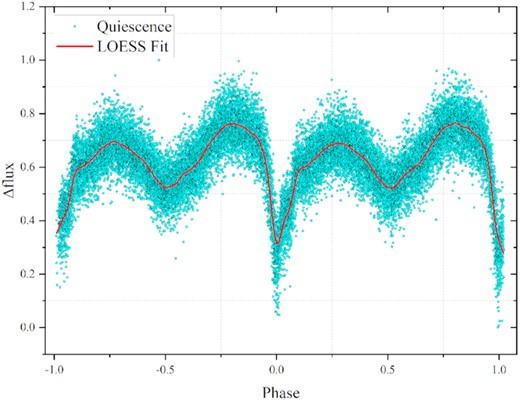
Phase-folded light curve of HS 2325+8205 during quiescence. The solid red line is the loess fit, and the folding period is 0.19433475(6) d.
3.3 QPOs
Current research shows that QPOs are widely present in CVs with high mass transfer rates, such as nova-like variables and DNe in outburst, and the QPOs appearing in DNe are most significant at the peak of outburst (Robinson & Nather 1979; Warner 2004). By analysing the TESS data of HS 2325+8205, we found that the out-of-eclipse curves had apparent oscillations at the peak of the long outburst of HS 2325+8205.
We first remove the eclipse part of the light curves with a new epoch (equation 1). Then we use loess with a smoothing span of 0.003 to fit all curves, to exclude the interference of double humps. Finally, the smooth curves were subtracted from the original light curves to obtain the out-of-eclipse curves with the outburst and the eclipse trend removed (see Fig. 6).
Example of removing the trend of outburst and eclipse from the light curve. The data gap is the removed eclipse.
We analysed all out-of-eclipse curves using a continuous wavelet transform (CWT; Polikar et al. 1996); see Fig. 7. The two-dimensional (2D) power spectrum results of the CWT show that there is a QPO with a frequency of |${\sim}40\, \mathrm{d}^{-1}$| at the top of long outburst (see Figs 8 and 9). Furthermore, we obtained the same results for the long outburst top curves using the LSP (see Fig. 10), which further confirms that the QPO of HS 2325+8205 is ∼2160 s.
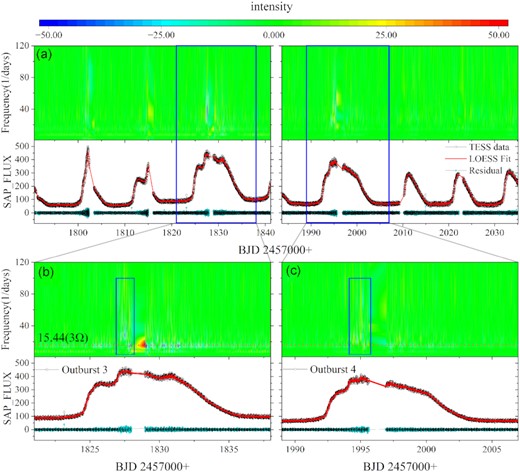
CWT 2D power spectra and their corresponding light curves. (a) All CWT 2D power spectra and their corresponding light curves. (b) and (c) are the CWT 2D power spectra of outbursts 3 and 4 and their corresponding light curves. The rectangular box is the top light curve. The red dotted lines are the harmonics of the orbital period (3Ω ≈ |$15.44\, \mathrm{d}^{-1}$|).
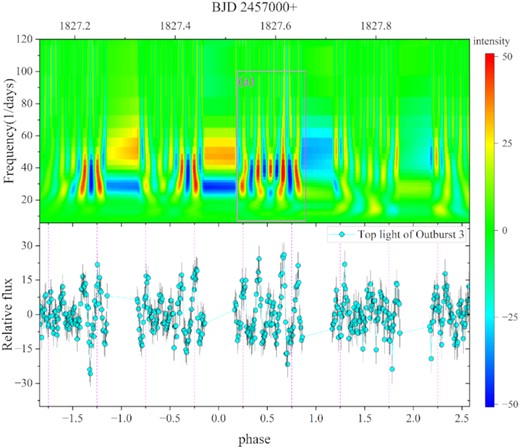
CWT 2D power spectrum of the top curve of outburst 3 and its corresponding light curves. (a) The rectangular box is where the intensity of QPOs is greatest, and the abscissa is processed to the orbital phase.
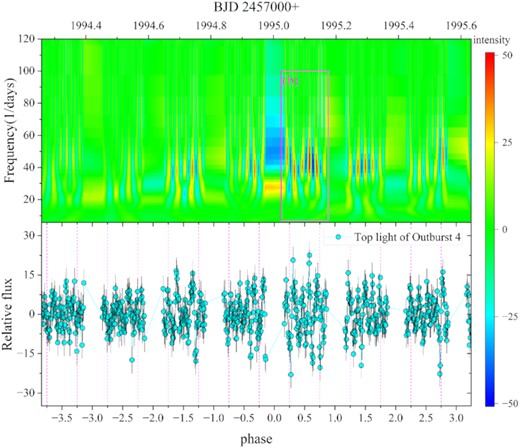
CWT 2D power spectrum of the top curves of outburst 4 and its corresponding light curves. (b) The selected part is where the intensity of QPOs is greatest.
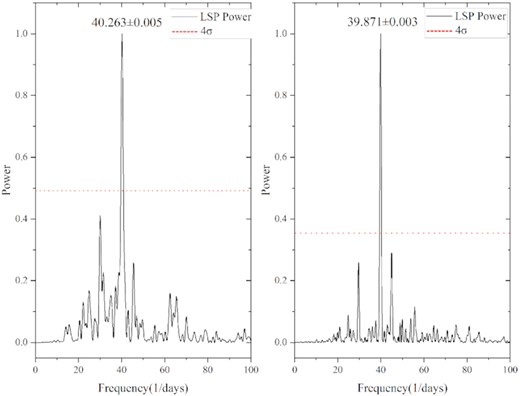
The LSP of the top curves of outbursts 3 and 4 (left and right panels, respectively). The red dotted line is four times the standard deviation (4σ) of the LSP.
Through the 2D power spectrum, we found that the oscillation intensity of QPOs is related to the orbital phase. We select the places with the strongest oscillation in outbursts 3 and 4, respectively, for analysis. We calculated the orbital phase corresponding to the light curves and performed sinusoidal fitting. By comparing the 2D power spectrum and the light curves, we found that the intensity of QPOs in orbital phases 0.5–0.9 is stronger than that in orbital phases 0.1–0.5, which is the weakest at ∼0.5 (see Figs 11 and 12). The intensity of QPOs in orbital phases 0.5–0.9 is stronger than in orbital phases 0.1–0.5 and also in other out-of-eclipse curves with significant oscillations (see Figs 8 and 9), which may be ideal probes to study the origin of QPOs.
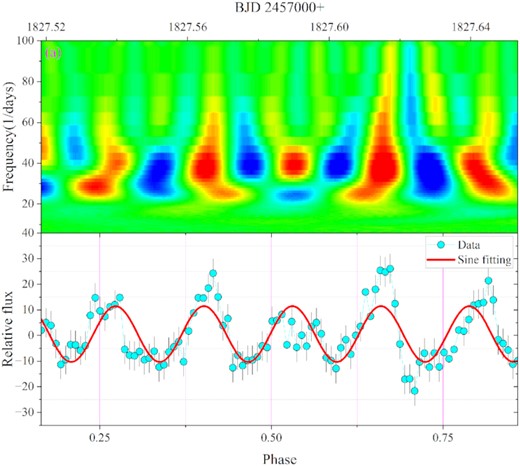
The enlarged view of the area selected by the red rectangle (a) in Fig. 8 and its corresponding light curves. The solid red line in the bottom panel is the sine fit (the best fit is |$40.13\pm 0.46\, \mathrm{d}^{-1}$|), and the abscissa is processed to the orbital phase.
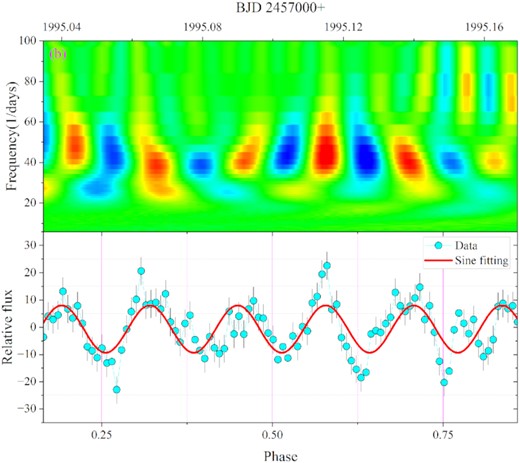
The enlarged view of the area selected by the red rectangle (b) in Fig. 9 and its corresponding light curves. The best sine fit is |$39.79\pm 0.39\, \mathrm{d}^{-1}$|.
4 DISCUSSION
Warner (2004) suggested that there are at least three types of QPOs, after statistical analysis of about 50 CVs. The first type is DNO-related QPOs, which coexist with DNOs and oscillate for several hundreds of seconds. The second is the IP-related QPOs, whose oscillation period is about 1000 s. The generation of these is related to the structure of intermediate polars (IPs; Patterson et al. 2002). Except for DNO-related QPOs and IP-related QPOs, the remaining QPOs are the third type (other QPOs; Warner 2004; Scepi, Begelman & Dexter 2021). In this study, we propose several different explanations for the origin of QPOs, such as the internal oscillation of the accretion disc, the reprocessing of light by orbital blobs (Patterson 1979), the radial oscillation of the accretion disc (Okuda et al. 1992), the interruption and reprocessing of travelling waves in the inner edge of the accretion disc (Lubow & Pringle 1993), and the influence of the magnetic field of the WD on the accretion disc (Paczyński 1978). QPOs widely exist in CVs with high mass transfer rates, such as nova-like variables and DNe in outbursts, and another consensus is that QPOs are closely related to accretion discs.
Through the analysis of Section 3.3, we found that there are QPOs with oscillation periods of ∼2160 s in HS 2325+8205. Based on the classification of Warner (2004), it is known that the rapid oscillation of ∼2160 s belongs to the third type of QPOs (other QPOs), and there is no relevant theoretical model to describe it. In addition, we found that the intensity of QPOs is related to the orbital phase. The intensity of QPOs in orbital phases 0.5–0.9 is stronger than in orbital phases 0.1–0.5. In the most significant light curve of QPOs, the intensity is weakest at the orbital phase ∼0.5. Current research suggests that the light sources of the orbital signal mainly consist of three components:
the irradiation of the secondary star by the accretion disc and/or the WD (Kimura et al. 2020);
the ellipsoidal modulation caused by the motion of the secondary star, which reaches its peak at the orbital phases 0.25 and 0.75 (Warner 2003; Kimura et al. 2020);
the orbital hump caused by hotspots, which mainly exists in the orbital phase of 0.7–0.9 during quiescence and the outburst is not significant (La Dous 1994; Warner 1995).
The irradiation of the secondary depends on the disc’s geometry and luminosity; if the accretion disc is tilted, the surface of the secondary accretion disc will receive more radiation than in other cases because the internal hot part of the accretion disc is easily exposed to the surface of the secondary. At orbital phase 0.5, the irradiated area of the secondary star we observed is the largest, and the brightness reaches its peak. Negative superhumps are the most conspicuous sign of the tilted disc in CVs (e.g. Bonnet-Bidaud, Motch & Mouchet 1985; Patterson et al. 1993; Harvey et al. 1995; Patterson 1999). During the analysis of the orbital period of HS 2325+8205, we did not find periodic signals shorter than the orbital period by about a few per cent, so we will not consider the first component.
Although the intensity variation of QPOs is similar to the phase of the double humps during quiescence, the QPOs exist only during the outburst, thus ruling out the influence of secondary stars. Moreover, the primary in the orbital phase of 0.5–0.9 is moving away from us, which cannot be caused by (2).
The accretion flow from the secondary star collides with one side of the accretion disc to form hotspots, which are brightest when the hotspots face us at the orbital phase of about 0.7–0.9 (Warner 1995). Robinson & Nather (1979) observed that QPOs were still found in the DN, U Gem, during the eclipse of hotspots, thus ruling out the origin of QPOs from hotspots. In addition, the orbital hump caused by hotspots is not significant with the brightening of the accretion disc. Although Robinson & Nather (1979) ruled out the origin of QPOs from hotspots, they did not analyse the influence of hotspots on the oscillation intensity of QPOs. In addition,in Robinson & Nather (1979), the amplitude of the QPOs of U Gem can be found to be significantly larger around orbital phase 0.9 than elsewhere (see Robinson & Nather 1979 for details). Combined with our analysis, we believe that although hotspots are excluded from the origin of QPOs and are not significant at the time of outburst, it is still uncertain whether they contribute to the intensity of QPOs. We suggest that the relationship between the intensity of QPOs and the orbital phase has a high research value and can be used to study the origin of QPOs.
5 CONCLUSIONS
In this paper, based on the data observed by TESS for HS 2325+8205, we have conducted in-depth research on its peculiar light curves and QPOs. First, we corrected the orbital period of HS 2325+8205 to be 0.19433475(6)d using the LSP. We obtained 491 new mid-eclipse times using a Gaussian fit. Secondly, we found that HS 2325+8205 has four different types of outbursts, but there are two that may not be actual outbursts, and the outburst period is about 13.83 d. In addition, there are double humps in quiescence, which may be caused by ellipsoidal modulation. Finally, based on the LSP, CWT and sine fitting methods, for the first time we have found that there are QPOs with a period of ∼2160 s in the long outburst of HS 2325+8205. In addition, we have also found that the intensity of QPOs is related to the orbital phase. The intensity of QPOs in orbital phases 0.5–0.9 is stronger than in orbital phases 0.1–0.5. Through the analysis of orbital signals, we excluded the effects of the irradiation of the secondary and the ellipsoidal modulation. However, the effect of hotspots on the intensity of QPOs needs to be investigated further.
SUPPORTING INFORMATION
Supplementary material.docx
Please note: Oxford University Press is not responsible for the content or functionality of any supporting materials supplied by the authors. Any queries (other than missing material) should be directed to the corresponding author for the article.
ACKNOWLEDGEMENTS
This work was supported by the National Natural Science Foundation of China (grant Nos 11933008, U1831120, U1731238). This work has made use of the data collected by the TESS mission, which is publicly available at the Mikulski Archive for Space Telescopes (MAST) and in the Transiting Exoplanet catalogue (TEPcat) data.
DATA AVAILABILITY
The TESS data used in this work can be obtained from the Mikulski Archive for Space Telescopes (MAST)1 and the ExoFOP-TESS webpage.2 We provide all mid-eclipse times of HS 2325+8205 from TESS online in the supplementary material. The corresponding author will share all other data underlying this article on reasonable request.
