-
PDF
- Split View
-
Views
-
Cite
Cite
Amit Seta, Christoph Federrath, Jack D Livingston, N M McClure-Griffiths, Rotation measure structure functions with higher-order stencils as a probe of small-scale magnetic fluctuations and its application to the Small and Large Magellanic Clouds, Monthly Notices of the Royal Astronomical Society, Volume 518, Issue 1, January 2023, Pages 919–944, https://doi.org/10.1093/mnras/stac2972
Close - Share Icon Share
ABSTRACT
Magnetic fields and turbulence are important components of the interstellar medium (ISM) of star-forming galaxies. It is challenging to measure the properties of the small-scale ISM magnetic fields (magnetic fields at scales smaller than the turbulence driving scale). Using numerical simulations, we demonstrate how the second-order rotation measure (RM, which depends on thermal electron density, ne, and magnetic field, b) structure function can probe the properties of small-scale b. We then apply our results to observations of the Small and Large Magellanic Clouds (SMC and LMC). First, using Gaussian random b, we show that the characteristic scale, where the RM structure function flattens is approximately equal to the correlation length of b. We also show that computing the RM structure function with a higher-order stencil (more than the commonly-used two-point stencil) is necessary to accurately estimate the slope of the structure function. Then, using Gaussian random b and lognormal ne with known power spectra, we derive an empirical relationship between the slope of the power spectrum of b, ne, and RM. We apply these results to the SMC and LMC and estimate the following properties of small-scale b: correlation length (160 ± 21 pc for the SMC and 87 ± 17 pc for the LMC), strength (14 ± 2 |$\mu {\rm G}$| for the SMC and 15 ± 3 |$\mu {\rm G}$| for the LMC), and slope of the magnetic power spectrum (−1.3 ± 0.4 for the SMC and −1.6 ± 0.1 for the LMC). We also find that ne is practically constant over the estimated b correlation scales.
1 INTRODUCTION
Magnetic fields play an important dynamical role in the interstellar medium (ISM) of star-forming galaxies. Locally, the magnetic field provides pressure support against gravity (Boulares & Cox 1990), reduces the star formation rate (Mestel & Spitzer 1956; Federrath 2015; Krumholz & Federrath 2019), controls the propagation of cosmic rays (Cesarsky 1980; Shukurov et al. 2017), heats up the ISM via magnetic reconnection (Raymond 1992), alters the gas flow morphology (Shetty & Ostriker 2006), and also suppresses galactic outflows (Evirgen et al. 2017). Globally, the role of magnetic fields in the formation and evolution of galaxies is still unknown but recent cosmological simulations suggest that they might be important (van de Voort et al. 2021). Thus, it is crucial to study the strength and structure of galactic magnetic fields, especially in different types of galaxies (such as spiral, elliptical, and irregular) and also in their different evolutionary stages.
Magnetic fields in galaxies can be probed by a variety of observational methods such as optical polarization, dust polarization, synchrotron emission, the Zeeman effect, and the Faraday rotation of the polarized light (see chapter 3 of Klein & Fletcher 2015). Except for the Zeeman effect, which is accessible only in the low-temperature and high-density regions of the ISM (Heiles & Troland 2004), usually one requires additional assumptions or other independent observations to extract magnetic field properties from these observations. For example, to infer magnetic field properties from the total synchrotron intensity (which is due to cosmic ray electrons and the magnetic field component perpendicular to the line of sight), one needs information about the cosmic ray electron number density. In the absence of such information, energy equipartition between cosmic rays and magnetic fields is usually assumed to extract the magnetic field strength from synchrotron observations. However, the energy equipartition assumption is not always applicable and might give erroneous results (Seta & Beck 2019). Similarly, to extract magnetic field information from Faraday rotation (which is due to the thermal electrons and the magnetic field component parallel to the line of sight), one requires an estimate of the thermal electron density. The thermal electron density can be inferred from Hα observations or dispersion measures in the case of pulsars, but in the absence of such observations, additional assumptions (e.g. a constant thermal electron density) are required. Such assumptions might give incorrect magnetic field information (Beck et al. 2003). In this paper, we study the impact of such assumptions on the estimated small-scale magnetic field properties, primarily using the structure function of rotation measure (RM) calibrated with numerical simulations. We then apply the structure function method to Faraday rotation observations of the Small and Large Magellanic Clouds (SMC and LMC).
Based on radio observations, magnetic fields in a typifcal spiral galaxy can be divided into fluctuating (or small-scale) and mean (or large-scale) components. The small-scale fields are correlated at scales less than the driving scale of turbulence (∼100 pc in spirals), and the large-scale fields are correlated over several kpcs. The linearly polarized and total synchrotron intensity traces the ordered field and total field components perpendicular to the line of sight, respectively. Information about small-scale fluctuating fields can be obtained from depolarization values (which refers to a decrease in the polarization fraction due to random magnetic fields along the path-length, see Sokoloff et al. 1998, for further details). The magnetic field component parallel to the line of sight can be studied using Faraday rotation measurements, where the mean and standard deviation of RM roughly probes the large- and small-scale components, respectively. Using these observations for the Milky Way and nearby spiral galaxies, the total field strength is estimated to be of the order of 5 |$\mu {\rm G}$| (Haverkorn 2015; Beck 2016). The small-scale field strength is found to be comparable to (or even slightly stronger than) the large-scale field strength. The large-scale field roughly follows the spiral arms (Fletcher et al. 2011; Beck 2016) and the small-scale random field has both Gaussian and non-Gaussian components (see appendix A in Seta et al. 2018, for further details). Physically, the strength and structure of magnetic fields in galaxies can be explained by the turbulent dynamo, which is a mechanism for the conversion of turbulent kinetic energy to magnetic energy (Brandenburg & Subramanian 2005; Federrath 2016; Rincon 2019). Motivated by the synchrotron and Faraday rotation observations, the dynamo theory can also be divided into a small-scale (fluctuation) and large-scale (mean-field) dynamo. The small-scale dynamo requires turbulence (see Seta et al. 2020; Seta & Federrath 2021a, for further details), whereas the large-scale dynamo, besides turbulence, also requires large-scale galaxy properties such as differential rotation and density stratification (see Shukurov & Sokoloff 2008, for a detailed description). Moreover, the small-scale random field can also be generated by the tangling of the large-scale field (section 4.1 in Seta & Federrath 2020).
Irregular galaxies, such as the SMC and LMC, also show synchrotron polarization (albeit weaker than that in spiral galaxies) and Faraday rotation (Gaensler et al. 2005; Mao et al. 2008, 2012; Livingston et al. 2022). This implies the presence of a small- and (a weaker) large-scale magnetic field. Also, for the SMC and LMC, a ‘Pan-Magellanic’ magnetic field, i.e. a large-scale field connecting the SMC and LMC is discussed (Kaczmarek et al. 2017; Livingston et al. 2022). Also, see Chyży et al. (2016) for a detailed investigation of magnetic fields in an irregular galaxy, IC 10.
In most of these different types of galaxies, except for the strength of the small-scale magnetic field (which can be obtained from depolarization observation, polarized synchrotron fluctuations, or RM variations), it is very difficult to estimate the other properties (such as the length scales and structure) of the small-scale random magnetic field. In external galaxies, this is because of limited resolution, with telescope beams often corresponding to hundreds of parsecs, which is larger than the expected correlation length of small-scale magnetic fields (for example, see Kierdorf et al. 2020). While resolution effects are less problematic for observations in the Milky Way, the main difficulty is confusion due to the observer being positioned inside the Galaxy and the influence of the Local Bubble (Alves et al. 2018; Pelgrims et al. 2020; West et al. 2021). Synchrotron polarization gradient techniques can also be used to study properties of small-scale magnetic fields (Gaensler et al. 2011; Burkhart, Lazarian & Gaensler 2012; Iacobelli et al. 2014; Herron et al. 2017; Lazarian & Yuen 2018). However, especially for external galaxies, these techniques are difficult to use due to a lack of resolution, missing pixels in the data due to an insufficient signal-to-noise ratio, and noise (these are common problems when taking a derivative of sparsely sampled data in observations).
Here, we start by using simple numerical experiments and magnetohydrodynamic (MHD) simulations to show that the second-order structure function of RM from point radio sources in the background of a magneto-ionic medium can be used to obtain the strength and important length scales of the small-scale fluctuating magnetic field. We also discuss the role of the thermal electron density in the analysis, which was previously either completely ignored or considered in a very simplified manner (for example, assuming a constant thermal electron density). Finally, we apply our methods to observations of RM from background polarized sources located behind the SMC and LMC to probe the small-scale magnetic fields in those systems.
We discuss our methods to compute and characterize the structure function of RM in Section 2. In Section 3, we demonstrate how the properties of the RM structure function can be translated to the properties of small-scale magnetic fields and thermal electron densities. For this, we use simple numerical experiments with a fixed distribution of random magnetic fields (Section 3.1) and thermal electron density (Section 3.2). Then, in Section 4, we use the results from Section 3 to probe the small-scale magnetic fields in the SMC and LMC. Finally, we summarize our results and conclusions in Section 5. In Table 1, we provide the notations used throughout the text with their descriptions.
| Notation . | Description . |
|---|---|
| ne | thermal electron density |
| 〈ne〉 | mean ne |
| |$\mathbf {b}$| | small-scale fluctuating magnetic field |
| brms | root mean square strength of |$\mathbf {b}$| |
| RM | rotation measure |
| σRM | standard deviation of RM |
| |$\mathcal {P}_{k}$|(variable) | power spectrum of the variable |
| β | slope of the RM power spectrum, |$\mathcal {P}_{k}(\text{RM}) \sim k^{-\beta }, \beta > 0$| |
| α | slope of the |$\mathbf {b}$| power spectrum, |$\mathcal {P}_{k}(\mathbf {b}) \sim k^{-\alpha}, \alpha > 0$| |
| γ | slope of the thermal electron density power spectrum, |$\mathcal {P}_{k}(n_{\rm e}) \sim k^{-\gamma }, \gamma > 0$| |
| |${{\rm SF}^{\rm ({\rm np}\, pts)}_2({\text{variable}})}$| | second-order structure function of the variable computed using |$\rm np$|-point stencil |
| ℓ(variable) | correlation length of the variable |
| L | size of the numerical domain |
| |$\rm PDF$| | probability distribution function |
2 METHODS: RM STRUCTURE FUNCTION COMPUTATION
Throughout the text, we consider RM sources as point sources, i.e. the projected size of these sources is much smaller than the typical ISM scales, because the angular size of these sources is of the order of 1–10 arcsec (Oort et al. 1987; Windhorst et al. 1993; Rudnick & Owen 2014), and we probe scales much larger than these scales. Moreover, we assume that the intrinsic RM fluctuations of sources are negligible in comparison to the RM due to the intervening medium (see Schnitzeler 2010; Shah & Seta 2021, and Section 4.2 for further details).
Some of the properties of a small-scale random magnetic field can be studied with power spectrum analysis, which can be further probed by the power spectrum of RM (knowing some properties of the thermal electron density distribution). However, it is usually very difficult to compute the power spectrum of RM from observations because the polarized sources are located at random positions and even for the diffuse polarization there can be gaps in the observational data. In such a situation, it is easier to compute the structure function of RM which in principle contains the same information as the RM power spectrum (e.g. Stutzki et al. 1998).
To study the slope of |$\mathcal {P}_{k}(\text{RM})$|, |${\rm SF}^{\rm (2\, pts)}_2({\rm RM})$| is only helpful when β < 3 (see equation 3). However, the slope of the RM power spectrum can well be steeper than 3, and in that case, to accurately capture the fluctuations at smaller scales, multiple points (or stencils) are required to compute the second-order structure function (Lazarian & Pogosyan 2008). The second-order RM structure function computed using three (|${\rm SF}^{\rm (3\, pts)}_2({\rm RM})$|), four (|${\rm SF}^{\rm (4\, pts)}_2({\rm RM})$|), and five (|${\rm SF}^{\rm (5\, pts)}_2({\rm RM})$|) points, and the corresponding expectation for |$\mathcal {P}_{k}(\text{RM}) \sim k^{-\beta }$| and at high values of r (assuming ℓ(RM) is smaller than the size of the region) is given below:
- The second-order RM structure function with a three-point stencil:(6)$$\begin{eqnarray} {\rm SF}^{\rm (3\, pts)}_2({\rm RM})= \langle | \text{RM}(\mathbf {x} + \mathbf {r}) - 2~\text{RM}(\mathbf {x}) + \text{RM}(\mathbf {x} - \mathbf {r}) |^{2} \rangle , \end{eqnarray}$$and(7)$$\begin{eqnarray} {\rm SF}^{\rm (3\, pts)}_2({\rm RM})\propto \left\lbrace \begin{array}{@{}l@{\quad }l@{}}r^{\beta - 1}, \quad & \text{if}\ \beta < 5 \\ r^{4}, \quad & {\rm if}\ \beta \ge 5\end{array}\right., \end{eqnarray}$$(8)$$\begin{eqnarray} {\rm SF}^{\rm (3\, pts)}_2({\rm RM})_{r \rightarrow \infty } = 6~\sigma _{\text{RM}}^{2}. \end{eqnarray}$$
- The second-order RM structure function with a four-point stencil:(9)$$\begin{eqnarray} {\rm SF}^{\rm (4\, pts)}_2({\rm RM}) &=& \langle | \text{RM}(\mathbf {x} + 3~\mathbf {r}) - 3~\text{RM}(\mathbf {x} + \mathbf {r}) \\ &&{+}\,3\ {\rm RM}(\mathbf {x} - \mathbf {r}) - \text{RM}(\mathbf {x} - 3~\mathbf {r}) |^{2} \rangle , \end{eqnarray}$$and(10)$$\begin{eqnarray} {\rm SF}^{\rm (4\, pts)}_2({\rm RM})\propto \left\lbrace \begin{array}{@{}l@{\quad }l@{}} r^{\beta - 1}, & {\rm if}\ \beta < 7 \\ r^{6}, \quad & {\rm if}\ \beta \ge 7 \end{array}\right. , \end{eqnarray}$$(11)$$\begin{eqnarray} {\rm SF}^{\rm (4\, pts)}_2({\rm RM})_{r \rightarrow \infty } = 20~\sigma _{\text{RM}}^{2}. \end{eqnarray}$$
- The second-order RM structure function with a five-point stencil:(12)$$\begin{eqnarray} {\rm SF}^{\rm (5\, pts)}_2({\rm RM}) &=& \langle | \text{RM}(\mathbf {x} + 2~\mathbf {r}) - 4~\text{RM}(\mathbf {x} + \mathbf {r}) + 6~\text{RM}(\mathbf {x}) \\ && {-}\,4~\text{RM}(\mathbf {x} - \mathbf {r}) + \text{RM}(\mathbf {x} - 2~\mathbf {r}) |^{2} \rangle , \end{eqnarray}$$and(13)$$\begin{eqnarray} {\rm SF}^{\rm (5\, pts)}_2({\rm RM})\propto \left\lbrace \begin{array}{@{}l@{\quad }l@{}} r^{\beta - 1}, & {\rm if}\ \beta < 9 \\ r^{8}, & {\rm if}\ \beta \ge 9 \end{array}\right. , \end{eqnarray}$$(14)$$\begin{eqnarray} {\rm SF}^{\rm (5\, pts)}_2({\rm RM})_{r \rightarrow \infty } = 70~\sigma _{\text{RM}}^{2}. \end{eqnarray}$$
Second-order structure functions must be computed with these higher-order stencils in case of very steep spectral slopes of the underlying fields. The computed RM structure function with a different number of points per stencil is also generally useful in order to study the convergence of the slope of the RM structure function.
In the next section, we apply these concepts to RM computed from magnetic field and thermal electron density distributions with known spectral properties, i.e. with a range of controlled spectral slopes, in order to determine how the properties of thermal electron density and magnetic fields are translated to the RM structure function. Throughout the next (numerical) section, we express quantities of interest in terms of normalized units, i.e. magnetic fields in terms of their root mean square (rms) value, thermal electron densities in terms of their mean value, and lengths in terms of the path-length. This keeps the analysis and results more generic and can be applied to a wide range of systems. For reference, the rms strength of small-scale random magnetic fields in the Milky Way and nearby galaxies is ≈10 |$\mu {\rm G}$| (Haverkorn 2015; Beck 2016), the mean thermal electron density is ≈0.02 cm−3 (Berkhuijsen & Müller 2008; Gaensler et al. 2008; Yao, Manchester & Wang 2017), and the path-length depends on the region probed (see Section 4 for specific cases of the SMC and LMC).
3 ROTATION MEASURE STRUCTURE FUNCTION FROM KNOWN MAGNETIC FIELDS AND THERMAL ELECTRON DENSITIES
3.1 Gaussian random magnetic fields and constant thermal electron density
First, we consider the simplest possible case of constant thermal electron density and Gaussian random magnetic fields (|$\mathbf {b}$|) with mean zero and a power-law spectrum with a controlled slope, α, i.e. |$\mathcal {P}_{k}(b) \sim k^{-\alpha }$| (where α is positive).1 The field is constructed on a three-dimensional cubic uniform triply-periodic grid with side length L and 5123 grid points. Fig. 1 shows the computed magnetic power spectrum and probability distribution function (PDF) from the constructed Gaussian random magnetic fields with α in the range [1, 4], and maximum power at k = 2 (see Appendix A for a discussion on the effects of varying this scale) for all values of α. As expected, the slope of the fitted power spectrum in Fig. 1(a) agrees well with the prescribed α, and the corresponding PDF for all α in Fig. 1(b) is very close to a Gaussian distribution. In Fig. 2, we show the magnetic strength, normalized to its corresponding rms, computed from the entire three-dimensional grid in a slice centred on the middle of the numerical domain for α = 4, 2, 5/3, and 1. We see that the relative size of magnetic structures decreases as the slope of the magnetic power spectrum becomes shallower.
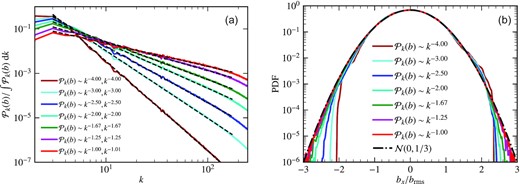
One-dimensional shell averaged power spectrum of three-dimensional magnetic fields (|$\mathbf {b}$|), |$\mathcal {P}_{k}(b)$|, normalized by its total power (a) and probability distribution functions (PDFs) of a single component, bx, normalized to the rms value, brms (b), for various slopes of the magnetic power spectrum (α). The fitted slope matches the input slope well and the PDFs for all slopes approximately follow a Gaussian distribution with mean zero and one-third standard deviation, |$\mathcal {N}(0, 1/3)$|.

Two-dimensional slices of the Gaussian random magnetic field strength, normalized to the corresponding rms values, for various slopes of the magnetic power spectrum. As the power spectrum becomes shallower, the magnetic field contains more power in small-scale structures.
Assuming a uniform density of background polarized sources (the path-length is the entire simulation domain, L), we compute RM due to these Gaussian random magnetic fields (ne is constant) using equation (1). Fig. 3 shows RM maps, normalized by the standard deviation in RM, σRM, for four different magnetic field power spectrum slopes (α = 4, 2, 1.67, and 1). Even though the RM structures at larger scales look similar between various cases, structures with smaller sizes are seen for shallower slopes. Fig. 4 shows the power spectrum of RM, |$\mathcal {P}_{k}(\text{RM})$|, and the PDF of RM/σRM for α = [1, 4]. We see that the power spectrum of RM is also a power law and for |$\mathcal {P}_{k}(b) \sim k^{-\alpha }$|, |$\mathcal {P}_{k}(\text{RM}) \sim k^{-\alpha -1}$|. This holds true for all α tested here. Thus, knowing the slope of the RM power spectrum, one can compute the slope of the magnetic field power spectrum (provided the electron density is constant). The PDF of RM roughly follows a Gaussian distribution with mean zero and standard deviation one. Since |$\mathcal {P}_{k}(\text{RM}) \sim k^{-\alpha - 1}$|, the slope of the second-order structure function (when it captures the fluctuations accurately, see equations 3, 7, 10, and 13), would be −(−α − 1) − 1 = α. Thus, for Gaussian random magnetic fields, |$\mathcal {P}_{k}(b) \sim k^{-\alpha }$| implies SF2(RM) ∼ rα.
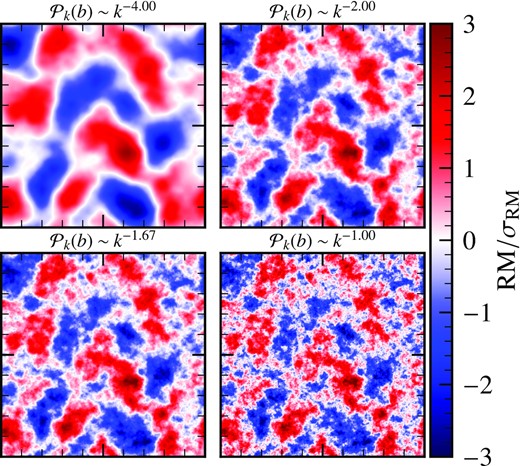
RM maps (computed by assuming ne = const.) for four different slopes of the magnetic field power spectrum, |$\mathcal {P}_{k}(b) \sim k^{-\alpha }, \alpha =4, 2, 1.67, 1$|. As the slope becomes shallower, the RM maps exhibit more small-scale structures, but the large-scale features remain roughly the same.
![One-dimensional shell averaged power spectrum of the two-dimensional RM maps from $\mathcal {P}_{k}(\text{RM})$, see Fig. 3 (assuming ne is constant), normalized by total power (a), and PDFs of RM normalized by its standard deviation σRM (b), for different magnetic field power spectrum slopes, $\mathcal {P}_{k}(b) \sim k^{-\alpha }, \alpha$ in [1,4]. We see that $\mathcal {P}_{k}(\text{RM})$ approximately follows a power law with slope −α − 1. The RM PDF is roughly Gaussian with mean zero and standard deviation one, $\mathcal {N}(0, 1)$, for all α.](https://oup.silverchair-cdn.com/oup/backfile/Content_public/Journal/mnras/518/1/10.1093_mnras_stac2972/1/m_stac2972fig4.jpeg?Expires=1750274799&Signature=uO~QKWYVasvVjNGTAEBGVvOHtFc3sWuxb15IdQVFUOuGzDvF1QvEM8sv0CcAe-wuqNf9p9Asnvyj32lr0ElsNZo05v07pftbzEYP0p~qOgnoI20-vdPm-j-vi6YizDcfFlNIfIlltBpq2wwhWShIcZdVqqD8IHavLPGlBdO4DAAJ-KrNT-j~HvjISA3d2lg2DevwVdYGKm6e4WsnoOW4mNZzqey~J9bepbc~6WZvoR7zDwBlAKEfRWmXASRjJt3VnBzEPL6BxpIRi3j3BsLI1azPWcUTOZyyckw9HtIlr3S8YugtRIeJ6TkGanGEWCwE8ygd2mJtpo3kX6flUoGkQQ__&Key-Pair-Id=APKAIE5G5CRDK6RD3PGA)
One-dimensional shell averaged power spectrum of the two-dimensional RM maps from |$\mathcal {P}_{k}(\text{RM})$|, see Fig. 3 (assuming ne is constant), normalized by total power (a), and PDFs of RM normalized by its standard deviation σRM (b), for different magnetic field power spectrum slopes, |$\mathcal {P}_{k}(b) \sim k^{-\alpha }, \alpha$| in [1,4]. We see that |$\mathcal {P}_{k}(\text{RM})$| approximately follows a power law with slope −α − 1. The RM PDF is roughly Gaussian with mean zero and standard deviation one, |$\mathcal {N}(0, 1)$|, for all α.
Fig. 5 shows the second-order RM structure function computed using a two-point (equation 2, Fig. 5a), three-point (equation 6, Fig. 5b), four-point (equation 9, Fig. 5c), or five-point (equation 12, Fig. 5d) stencil for different magnetic field power spectrum slopes in range α = [1, 4]. The level of fluctuation in the second-order RM structure function at each scale is computed by taking a standard deviation of values in that bin. For all four cases, the structure function first increases and then (statistically) saturates to a value (that varies with the number of points per stencil) at higher distances (r/L ≳ 0.2). This shows that the correlation length of RM is always less than L. The saturated values agree well with equation (5) (structure function with two-point stencil), equation (8) (structure function with three-point stencil), equation (11) (structure function with four-point stencil), and equation (14) (structure function with five-point stencil). For |${\rm SF}^{\rm (2\, pts)}_2({\rm RM})$|, the slope of the RM structure function roughly agrees with our expectation (SF2(RM) ∼ rα for |$\mathcal {P}_{k}(b) \sim k^{-\alpha }$|), only for shallower slopes (α = 1, 1.25, and 1.67, as also expected from equation 3). Using a higher number of points per stencil, the agreement with our expectations improves, with |${\rm SF}^{\rm (5\, pts)}_2({\rm RM})$| providing the best agreement, where the slope of |${\rm SF}^{\rm (5\, pts)}_2({\rm RM})$| is approximately equal to α (negative of the slope of the magnetic power spectrum). Thus, to correctly probe the magnetic power spectrum, especially with steeper slopes, one must compute the second-order RM structure function with a higher-order stencil, where the number of points per stencil must be greater than 2, depending on α. We also find that comparing structure functions computed with different stencils is useful in checking for convergence. After exploring RM structure functions with Gaussian random magnetic fields and constant thermal electron density, we now look at the effects of including a lognormal thermal electron density distribution in the next subsection.
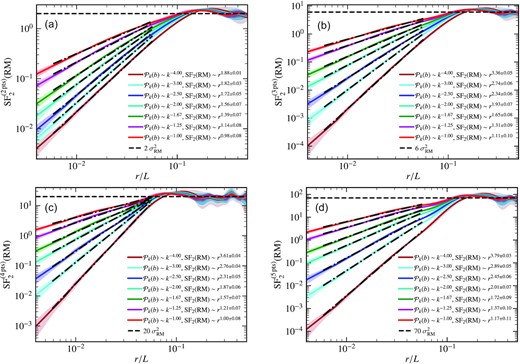
Second-order RM structure function computed using stencils with a different number of points: two (a), three (b), four (c), and five (d), for Gaussian random magnetic fields with different slopes of the magnetic field power spectrum (|$\mathcal {P}_{k}(b)$|) and a constant thermal electron density. The shaded region shows the corresponding one-sigma variation in each case. At higher values of r, the structure functions for all slopes tend to their expected values (|$2~\sigma _{\text{RM}}^{2}$| for the two-point stencil, |$6~\sigma _{\text{RM}}^{2}$| for the three-point stencil, |$20~\sigma _{\text{RM}}^{2}$| for the four-point stencil, and |$70~\sigma _{\text{RM}}^{2}$| for the five-point stencil). As the number of points per stencil increases, the agreement with our expectation, SF2(RM) ∼ rα for |$\mathcal {P}_{k}(b) \sim k^{-\alpha }$| over the entire range of αs, improves. Even for shallower slopes (e.g. for |$\mathcal {P}_{k}(b) \sim k^{-1}$|), the structure function remains roughly independent of the number of points per stencil, which is a sign of convergence.
3.2 Gaussian random magnetic fields and (uncorrelated) lognormal thermal electron density fields
With Gaussian random magnetic fields, we now also consider the contribution of the thermal electron density (ne) to RM and its effect on the computed RM structure function. Motivated by the studies of lognormal gas density PDFs in the ISM (Vazquez-Semadeni 1994; Federrath, Klessen & Schmidt 2008), we construct lognormal PDFs of ne with a power-law spectrum and a controlled slope, γ, i.e. |$\mathcal {P}_{k}(n_{\rm e}) \sim k^{-\gamma }$| (γ > 0).2 Like the magnetic field, ne is also constructed on a three-dimensional cubic uniform triply-periodic grid of side length L with 5123 points. The constructed thermal electron densities are uncorrelated with and independent of the Gaussian random magnetic fields. In Fig. 6, we show the power spectrum of ne (Fig. 6a) and the PDF of ln (ne/〈ne〉) (Fig. 6b) for γ = [1, 4]. The slope of the fitted power spectrum agrees with the input slope, and the PDF of ne/〈ne〉 follows a lognormal distribution. In Fig. 7, we show the normalized thermal electron density in a slice centred on the middle of the numerical domain. As the power spectrum of ne becomes shallower, smaller-scale structures are seen, while the large-scale structures remain roughly the same between various cases.
![One-dimensional shell-averaged power spectrum of the three-dimensional lognormal thermal electron density, $\mathcal {P}_{k}(n_{\rm e}) \sim k^{-\gamma }$ (with γ = [1, 4]) (a), and the corresponding PDF of ln (ne/〈ne〉) (b). The slope of the ne power spectra agrees well with the input slope and the PDF of ne/〈ne〉 follows a lognormal distribution for all slopes.](https://oup.silverchair-cdn.com/oup/backfile/Content_public/Journal/mnras/518/1/10.1093_mnras_stac2972/1/m_stac2972fig6.jpeg?Expires=1750274799&Signature=xYkpzafYVHCZx7U2p2odTdRnTBH2yOrxSOXFxTYH5ZSxUrCNi3~1qlzX5Eo~L-qkRx2wLCO6aI-dqzvS48STkb3hvHgmUqZk7m-7i7EZuBY9NkQYWroaR9JSxPMHdgc2fjxUnA0Rzue9OsejwKHfKGiupNA1NrC9T1pa7dJJ56dU2mJ7GFdJvTcUhHo01voJLZazWLgRiXqJhC1nrguc2I7H5-OQ2S9K5q9Xk6Ss7XFZz2-14GrbGChWwizVZZ4xJLkvdhVNd~j7rIzN4n9IUbGcdiCfpjLKAVCiozAk8-R0atg2~tnv6NpYtyKfuzpvawqQwQ8PeM1oVUBpXRkA7A__&Key-Pair-Id=APKAIE5G5CRDK6RD3PGA)
One-dimensional shell-averaged power spectrum of the three-dimensional lognormal thermal electron density, |$\mathcal {P}_{k}(n_{\rm e}) \sim k^{-\gamma }$| (with γ = [1, 4]) (a), and the corresponding PDF of ln (ne/〈ne〉) (b). The slope of the ne power spectra agrees well with the input slope and the PDF of ne/〈ne〉 follows a lognormal distribution for all slopes.
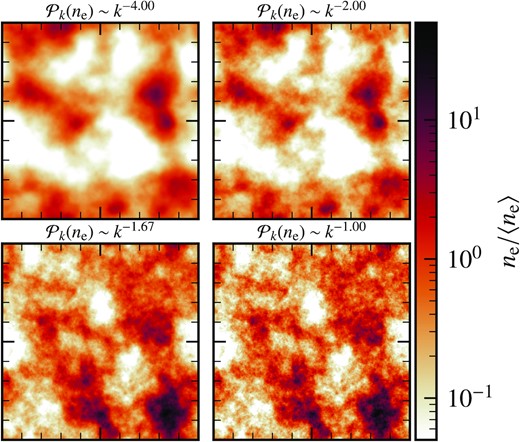
Two-dimensional slices of three-dimensional thermal electron density (ne), normalized by the mean value, for four different slopes (indicated at the top of each panel) of the thermal electron density power spectrum. Over larger scales, the structures are similar with smaller-scale structures emerging as the slope of ne becomes shallower.
Again, we use equation (1) to compute RM, but now we consider Gaussian random magnetic fields (|$\mathcal {P}_{k}(b) \sim k^{-\alpha }$| with α = [1, 4]) combined with lognormal thermal electron densities (|$\mathcal {P}_{k}(n_{\rm e}) \sim k^{-\gamma }$| with γ = [1, 4]). The computed RM depends now on both α and γ. Fig. 8 shows the RM maps for four combinations of the minimum and maximum of |$\alpha =1,\, 4$| and |$\gamma =1,\, 4$|. The RM maps have smaller fine-scale structures when either the magnetic field or thermal electron density power spectrum slopes are shallower, and show the smallest-scale structures when both of them are low (α = γ = 1). The structures, even at larger scales, are primarily controlled by the quantity with the shallower slope. We further investigate this using the power spectrum of RM for different values of α and γ.
![RM maps for different combinations of α = [1, 4] in $\mathcal {P}_{k}(b) \sim k^{-\alpha }$ and γ = [1, 4] in $\mathcal {P}_{k}(n_{\rm e}) \sim k^{-\gamma }$, as indicated at the top of each panel. Visually, it seems that the large-scale structures are more controlled by the steeper spectrum out of the two slopes and the smaller size structures by the shallower one (see Figs 2 and 7 for corresponding b and ne, respectively).](https://oup.silverchair-cdn.com/oup/backfile/Content_public/Journal/mnras/518/1/10.1093_mnras_stac2972/1/m_stac2972fig8.jpeg?Expires=1750274799&Signature=TjmUqitxBG6Ig7n348cJ~BlRdo3o~jbYBmYf7HSv-4MJZ~8KHLIJxv3gVviXEV6rnyDgxgeyTrYw8BQRG5TagepWwBQdDgjuqS8IaSEctseMH~nF834m93WSBKu66zEPG0FCHuXjxs4rQbNrrOrBf5H5dIVwNbjL9yCNs~D2QIu3uN5yh1iG1HlTM7gz5Izew9YC2a9YcSeFNeCuXMpzqlsOHH4xafghWJr24Eg8nIq-5jfxbUom6VyJFYqXYn3pBj~LhsI9rES7uaP7ThzUIYvlk6mwd1JvClXkCi0RnUNLPZ9XPpQxgK~Rydp17HPb3CRQV1oNB1-AqTymQs0~2Q__&Key-Pair-Id=APKAIE5G5CRDK6RD3PGA)
RM maps for different combinations of α = [1, 4] in |$\mathcal {P}_{k}(b) \sim k^{-\alpha }$| and γ = [1, 4] in |$\mathcal {P}_{k}(n_{\rm e}) \sim k^{-\gamma }$|, as indicated at the top of each panel. Visually, it seems that the large-scale structures are more controlled by the steeper spectrum out of the two slopes and the smaller size structures by the shallower one (see Figs 2 and 7 for corresponding b and ne, respectively).
For all combinations of α and γ, the RM power spectrum follows a power law with slope β, i.e. |$\mathcal {P}_{k}(\text{RM}) \sim k^{-\beta }$|. Here, we aim to find how β can be estimated from a given α and γ. In Fig. 9, we show the power spectrum of RM for a fixed γ = 4 in Fig. 9(a) and γ = 1 in Fig. 9(b) with α in the range [1, 4]. In Fig. 9(a), for shallower magnetic field power spectra (α = 1, 1.25, 1.67, 2), we find β ≈ −α − 1. On the other hand, for very shallow thermal electron density slope (γ = 1) in Fig. 9(b), for steeper magnetic field power spectrum slopes (α = 4, 3, 2.5, 2), we find β ≈ −γ − 1. Thus, if the slopes of the magnetic field power spectrum and the thermal electron density power spectrum are significantly different, the shallower of the two slopes have a larger influence on the slope of the RM power spectrum. However, when they are close, that need not be the case, and both the slope of the magnetic field and thermal electron density power spectra decide the slope of the RM power spectrum.
![One-dimensional shell-averaged power spectrum of RM for γ = 4 (a) and γ = 1 (b), for various magnetic field power spectrum slopes, α = [1, 4]. The slope of the RM power spectrum is more affected by the shallower of the two slopes (−α and −γ) and it roughly varies as α − 1 or γ − 1 (whichever is shallower).](https://oup.silverchair-cdn.com/oup/backfile/Content_public/Journal/mnras/518/1/10.1093_mnras_stac2972/1/m_stac2972fig9.jpeg?Expires=1750274799&Signature=DUfprR-~QSEWxtBz9fCpXS8H6lrRd3ftYY6mB4IRR7XbxC7rIx8Wiqwk4GAz5LN66Zh7~VTJQ-othK~ip5FUsmcbP1FUiMRQ7lxBCIM-JWaklw4R0e5mV8kPLG4EdJYKWM6gUBCf92evqVkOL0VZQ4KQWxrN6qcq-6haCCqp3efptuC3WDVFPNIrS8dO1-kvVioeUtDDJx7XPymWlt8yMOiz1-5lBSYXcy76Wn96~Sr835Rdjxo2BSjijB7tLnzM2MJ5lZDDg3wFHUTdZn6fm3dmzCs2MytgpEUYuQpwIdLK8zHl-d~C1la~1T~rDgAa1-NNyzkZWh6A0PiYgGgpDA__&Key-Pair-Id=APKAIE5G5CRDK6RD3PGA)
One-dimensional shell-averaged power spectrum of RM for γ = 4 (a) and γ = 1 (b), for various magnetic field power spectrum slopes, α = [1, 4]. The slope of the RM power spectrum is more affected by the shallower of the two slopes (−α and −γ) and it roughly varies as α − 1 or γ − 1 (whichever is shallower).
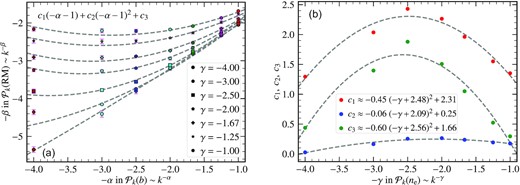
To estimate the slope of the RM power spectrum, β, from the slope of magnetic field power spectrum, α, and thermal electron density power spectrum, γ, we first fit the obtained values of β as a function of α (different colours) for different values of γ (different marker shapes) (a). We see that the function, c1(−α − 1) + c2(−α − 1)2 + c3, where c1, c2, and c3 are γ-dependent coefficients, fits the trends well for all α. Then we fit c1, c2, and c3 as a function of γ (b), and obtain the dependence of those coefficients on γ. A quadratic function of γ with different constants approximately fits c1, c2, and c3 (see the legend in (b)). This shows that β can be estimated for a given α and γ using the derived empirical relation given by equation (15).
![PDF of normalized RM for all values of α (magnetic field power spectrum slopes) in the range [1, 4], for two extreme values of γ (thermal electron density power spectrum slope), i.e. γ = 1 and 4. Unlike for purely Gaussian random magnetic fields in Fig. 4(b), the PDF of RM is non-Gaussian and this is further confirmed by the computed kurtosis values, $\mathcal {K}_{\text{RM}}$ (given in the legend). They are always greater than three (kurtosis of a Gaussian distribution).](https://oup.silverchair-cdn.com/oup/backfile/Content_public/Journal/mnras/518/1/10.1093_mnras_stac2972/1/m_stac2972fig11.jpeg?Expires=1750274799&Signature=tvTXwzy4FSVL2djKKmZlf7HlX4UY4Tre~8u40oq9-yt7CnkKK0PQ3ubt1LbSUOgsESfAfDLMSMluZsTqrswpefVwZVR5sTVh2HuKbqZQortGAfm2m9C52qSgrxPipo7b5McR0ShnB~IDAi1HIuZ8pP89-XlY0JBHa7yEVfJAGRX6UiNuwwUp-fS9BOtJwrwrjfhFMornFycXPeS55-ANvbp-SXS02-8SWzeJkoOR0YDACGNmNtGAADEipQ4qYuHdmoxRigT1RebvRIFTMMDRR6zh9QFGJGiE86h0Q-TK3y95ZZ4Vly-GvxEOKRtSyt4qK67GzK9etoiqwX0-1Y3IDA__&Key-Pair-Id=APKAIE5G5CRDK6RD3PGA)
PDF of normalized RM for all values of α (magnetic field power spectrum slopes) in the range [1, 4], for two extreme values of γ (thermal electron density power spectrum slope), i.e. γ = 1 and 4. Unlike for purely Gaussian random magnetic fields in Fig. 4(b), the PDF of RM is non-Gaussian and this is further confirmed by the computed kurtosis values, |$\mathcal {K}_{\text{RM}}$| (given in the legend). They are always greater than three (kurtosis of a Gaussian distribution).
Finally, we show the second-order structure function of RM computed with the five-point stencil (|${\rm SF}^{\rm (5\, pts)}_2({\rm RM})$|, equation 12) in Fig. 12 for two extreme values of γ (1 and 4) and all α = [1, 4]. The slope of the RM structure function is primarily controlled by the slope of the power spectrum of RM, β. Since, β is more affected by the shallower of the two spectra (magnetic fields, −α, and thermal electron density, −γ), the slope of the RM structure function is roughly either α or γ (depending on which one is shallower; see Fig. 12). More generally, given a value of α, γ, and β can be estimated using equation (15), and then the slope of the RM structure function would be β − 1 (provided the structure functions are converged). After studying the effect of Gaussian random magnetic fields and lognormal thermal electron densities (constructed independently of each other) on the RM power spectrum and structure function. In Appendix B, we explore the effect of uniform random magnetic fields and lognormal thermal electron density and in Appendix C, we study the properties of RM from MHD simulations, where the thermal electron density and magnetic fields can be correlated.
![Second-order RM structure function computed using the five-point stencil, ${\rm SF}^{\rm (5\, pts)}_2({\rm RM})$ (equation 12), for γ = 1 (a) and γ = 4 (b), and α = [1, 4]. The shaded region shows the corresponding one-sigma variation in each case. The slope of the second-order RM structure function is largely controlled by the shallower of the magnetic field and thermal electron density spectrum. Thus, for $\mathcal {P}_{k}(\text{RM}) \sim k^{-\beta }$, β ≈ α (if the magnetic field spectrum is shallower), or γ (if the electron density spectrum is shallower). More accurately, equation (15) should be used to calculate β from α and γ, and then the slope of the second-order RM structure function is approximately β − 1.](https://oup.silverchair-cdn.com/oup/backfile/Content_public/Journal/mnras/518/1/10.1093_mnras_stac2972/1/m_stac2972fig12.jpeg?Expires=1750274799&Signature=YW3oyS4NkZNDJgU9XsZ4gm1npFwoF0jtn22qR2nJ2jtJAqOQbJZJ2B6KmYmcCP2UqXkYRZp44~PpmFmIvJfPS1r4-PmycKp~zIs69lK~QQawtujaoODmc23lVz-Hw9yVYaMGBEfh-e~IbeW-RC4qxEPh2epDuM2RJtuNGLpDelbfJiTI7LAZlfMqzJMWRqSOEe8y0aWfdEkd~-x~eVbNYkLozUEQ0u5DH1x0muqKKkow0XDHTljpya0sN4hLCUW30c6EqHwICFgJkfzB5YSLgaVFZgxEjM-WRaCB-NZLJyGi~WnzmNH20W5R3-YEGAa-a0oEscAx3ACwO0GRSfVudg__&Key-Pair-Id=APKAIE5G5CRDK6RD3PGA)
Second-order RM structure function computed using the five-point stencil, |${\rm SF}^{\rm (5\, pts)}_2({\rm RM})$| (equation 12), for γ = 1 (a) and γ = 4 (b), and α = [1, 4]. The shaded region shows the corresponding one-sigma variation in each case. The slope of the second-order RM structure function is largely controlled by the shallower of the magnetic field and thermal electron density spectrum. Thus, for |$\mathcal {P}_{k}(\text{RM}) \sim k^{-\beta }$|, β ≈ α (if the magnetic field spectrum is shallower), or γ (if the electron density spectrum is shallower). More accurately, equation (15) should be used to calculate β from α and γ, and then the slope of the second-order RM structure function is approximately β − 1.
The main summary of the numerical section of the paper is as follows. Assuming a constant thermal electron density for Gaussian random magnetic fields with a power law spectrum with slope α, i.e. |$\mathcal {P}_{k}(b) \sim k^{-\alpha }$|, the slope of second-order structure function of RM is −α − 1. However, the second-order structure function computed using more than two points per stencil is required for accuracy and convergence (Section 3.1), depending on the underlying spectral slope of the quantity for which the structure function is computed. The RM PDFs follow a Gaussian distribution. Then for Gaussian random magnetic fields with |$\mathcal {P}_{k}(b) \sim k^{-\alpha }$| and lognormal thermal electron density with |$\mathcal {P}_{k}(n_{\rm e}) \sim k^{-\gamma }$|, the slope of the RM power spectrum can be computed (assuming no effect of any window or sampling function) using the empirically derived equation, equation (15) (Section 3.2). In the next section, we use these results and observations to study the properties of small-scale magnetic fields in the SMC and LMC.
4 RM STRUCTURE FUNCTION AND PROPERTIES OF SMALL-SCALE MAGNETIC FIELDS IN THE SMC AND LMC
Here we apply the ideas and results from Section 3 to study the properties of the small-scale magnetic fields in the Magellanic clouds. RM observations for the SMC (79 sources) are taken from Livingston et al. (2022) and for the LMC (250 sources) from Mao et al. (2012) and Livingston et al. (in preparation).3 These RM observations are due to polarized point sources behind (or within) the SMC and LMC. To estimate the thermal electron density contribution to these RMs, we use the Hα observations from Gaustad et al. (2001).
We remove the Milky Way RM contribution from the observed RMs by using analytical models, equation (5) in Mao et al. (2008) for the SMC, and equation (3) in Mao et al. (2012) for the LMC, at their location. In Appendix D, we discuss three models to account for the Milky Way RM contribution and our reasoning to choose these analytical models. Besides the thermal electrons in the medium, the Hα map also has contributions from the Milky Way and the Hα emission is also attenuated by dust in the Milky Way, SMC, and LMC. These contributions have been removed using the prescription in Smart et al. (2019) (see their section 3.4, where they estimate these contributions for the SMC and we assume the same prescription for the LMC). Furthermore, for both clouds, we chose only those RM for which Hα data is available and the error in RM is less than the RM value. This reduces the number of point sources to 65 for the SMC and 246 for the LMC. With this low number of sources, it would not be possible to study the PDF of RM, but we aim to explore small-scale magnetic field properties via the RM structure function.
Fig. 13 shows the RM (Milky Way corrected) as circles (red for positive RMs, blue for negative RMs, and the size of a circle is proportional to |RM|) and the intensity of Hα, IHα in the background for the SMC (Fig. 13a) and LMC (Fig. 13b). In both cases, it is clear that the sources are located at random positions with non-uniform distances between pairs of sources, and thus, it will be extremely difficult to compute the RM power spectrum. We, therefore, resort to RM structure functions to probe the properties of small-scale magnetic fields in the SMC and LMC. Before that, we first need to characterize and account for the contribution of the thermal electron density to the RM structure function.
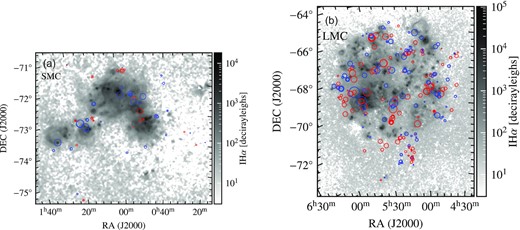
RM observations from background polarized sources after removing the Milky Way contribution (red circles show positive RM, blue circles show negative RM, and the size of the circle is proportional to the magnitude of RM) for the SMC ((a), 65 sources) and the LMC ((b), 246 sources). The background colour shows IHα (in decirayleighs) after removing the contribution from the Milky Way and dust in the medium for both cases. Pairs of sources have non-uniform separation, and thus, it would be very difficult to compute an RM power spectrum for them, so we resort to RM structure functions to study the small-scale magnetic field properties in the SMC and LMC.
In Fig. 14, we study the dependence of |RM| (with the Milky Way contribution removed) on IHα (contributions from the Milky Way and dust in the medium also removed) for the SMC (Fig. 14a) and LMC (Fig. 14b). Ideally, we would expect that since RM ∝ ne and |${\rm I_{H\alpha }}\propto n_{\rm e}^{2}$|, the slope of |RM| versus IHα line would be roughly 0.5 (this slope is approximately 0.43 when computed using pulsars in the Milky Way, see fig. 11e in Seta & Federrath 2021b). We find that the slope is approximately 0.55 for the SMC and 0.37 for the LMC. The deviation of this slope from the theoretical expectation of 0.5, especially for the LMC, is probably because of the following two reasons. First, the filling factor of ne affects IHα more than RM because of the quadratic dependence, and thus, a clumpy medium along the line of sight would lead to a deviation from the expected slope. Second and more importantly, the large-scale magnetic field in these clouds could vary along the path-length (and even change sign), and this would lead to cancellations (this also depends on the number and location of those reversals), which in turn would lower the RM values and give a slope <0.5 for the |RM| versus IHα line. The second point is further corroborated by the fact that the large-scale field in the LMC (∼1 |$\mu {\rm G}$|, see Mao et al. 2012) is stronger (enhanced cancellation) than that in the SMC (∼0.2 |$\mu {\rm G}$|, see Mao et al. 2008), and we find that the slope is smaller for the LMC (0.37) than the SMC (0.55). We use this relation to account for the contribution of ne while computing the RM structure function.
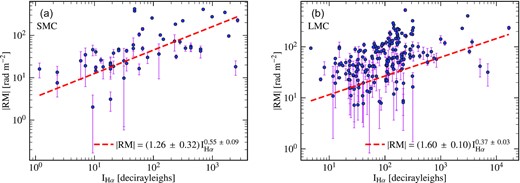
|RM| versus IHα (blue points with magenta lines showing the fluctuations in RM) and the best-fit relationship (obtained using the least-squares fitting procedure but also considering the errors in the fitting) between them (red, dashed line) for the SMC (a) and the LMC (b). The slope of the relationship for the LMC deviates significantly from the theoretically expected slope of 0.5. This might be because of the clumpy medium and/or large-scale magnetic field variations along the path-length. The slope is smaller for the LMC (≈0.37) than the SMC (≈0.55), and this is probably because the large-scale field (as reported in the literature) is stronger in the LMC (∼1 |$\mu {\rm G}$|, Mao et al. 2012) as compared to the SMC (∼0.2 |$\mu {\rm G}$|, Mao et al. 2008).
We compute the second-order structure functions with the two-point (|${\rm SF}^{\rm (2\, pts)}_2({\rm RM})$|) and the three-point stencil (|${\rm SF}^{\rm (3\, pts)}_2({\rm RM})$|), as a function of the angular separation δθ of RM, RM compensated by IHα as per the relationship from Fig. 14, and RM/IHα0.5 (theoretically expected slope) for the SMC and LMC. These are shown in Figs 15 and 16, respectively. For computing these structure functions, we make sure that there are at least 10 values for each δθ. The fluctuations in the structure functions are estimated by propagating errors in the observed RM and the Milky Way RM model. For both clouds and all three structure functions for each cloud at high values of δθ, |${\rm SF}^{\rm (2\, pts)}_2({\rm RM})$| is approximately equal to |$2~\sigma _{\text{RM}}^{2}$|, and |${\rm SF}^{\rm (3\, pts)}_2({\rm RM})$| is approximately equal to |$6~\sigma _{\text{RM}}^{2}$|, where the σRM denotes the standard deviation of RM in the sample. We also fit the second-order structure function from roughly a few times the minimum δθ to where the structure function starts to saturate (see also the RM structure functions from the simulations, for example in Fig. 5, for which we fit from a few times the spatial resolution, L/512, till the structure function starts to saturate). The details of the fit for each case are given in the legend of Figs 15 and 16. The slopes for |${\rm SF}^{\rm (2\, pts)}_2({\rm RM})$| and |${\rm SF}^{\rm (3\, pts)}_2({\rm RM})$| are roughly similar, indicating convergence. This is a benefit of computing RM structure function using multiple-point stencils. We now use the properties of these structure functions to estimate the following properties of the small-scale ISM in the SMC and LMC: the magnetic correlation length (Section 4.1), the field strength (Section 4.2), and the slope of the power spectrum of the magnetic field and thermal electron density (Section 4.3).

Second-order structure function of RM (blue), RM/IHα0.55 (using the relationship from Fig. 14a, magenta), and RM/IHα0.5 (red) computed with the two-point stencil (|${\rm SF}^{\rm (2\, pts)}_2({\rm RM})$|, (a)) and the three-point stencil (|${\rm SF}^{\rm (3\, pts)}_2({\rm RM})$|, (b)) for the SMC. The error in the second-order structure function of RM (both stencils) is computed as the one-sigma variation of values in each of the angular separation bin. We also provide the value of σRM and 〈IHα〉. The dashed lines show the corresponding asymptotic values, 2σ2 for |${\rm SF}^{\rm (2\, pts)}_2({\rm RM})$| and 6σ2 for |${\rm SF}^{\rm (3\, pts)}_2({\rm RM})$|, at high values of angular separation, δθ. The slope of the fitted line (dashed-dotted line, obtained using the least-squares fitting procedure, which also includes error bars) is given in the legends. These slopes are similar for both |${\rm SF}^{\rm (2\, pts)}_2({\rm RM})$| and |${\rm SF}^{\rm (3\, pts)}_2({\rm RM})$|, indicating convergence.
4.1 Correlation length of the small-scale magnetic fields
The correlation length of small-scale random magnetic fields is roughly equivalent to the turnover or break scale of the RM structure function (see Appendix A). The approximate turnover separation is 0.15° for the SMC (Figs 15a, b) and 0.1° for the LMC (Figs 16a, b). This separation remains the same for both |${\rm SF}^{\rm (2\, pts)}_2({\rm RM})$| and |${\rm SF}^{\rm (3\, pts)}_2({\rm RM})$|. Assuming the distance to the SMC and LMC at ≈61 and ≈50 kpc, respectively, these separations imply a scale of around 160 ± 21 pc for the SMC and 87 ± 17 pc for the LMC. Thus, these are roughly the correlation lengths of the magnetic fields, ℓ(b). The scale for the LMC is comparable to that obtained in Gaensler et al. (2005), which reports ≈90 pc, and that for the SMC is also comparable to that obtained in Burkhart et al. (2010), which reports ≈160 pc, albeit using a different method. In the next subsection, we use these scales to estimate the magnetic field strength from σRM and 〈IHα〉.
4.2 The small-scale magnetic field strengths
4.3 Slope of the small-scale magnetic field and thermal electron density power spectra
To estimate the slope of the magnetic field power spectrum (α), we use the second-order structure function of RM compensated by IHα according to the relationships derived in Fig. 14 (magenta points and dashed, dotted lines in Figs 15 and 16). The slopes of the second-order RM structure functions are very similar for the two- and three-point stencils and this shows convergence (we use the structure function computed with the three-point stencil for further calculations, because it is probably more accurate). Assuming Gaussian random magnetic fields for the SMC, |${\rm SF}^{\rm (3\, pts)}_2 (\text{RM}/{\rm I_{H\alpha }}^{0.55}) \sim r^{1.27 \pm 0.41}$| implies α ≈ 1.3 ± 0.4 in |$\mathcal {P}_{k}(b) \sim k^{-\alpha }$| (as demonstrated in Section 3.1). Similarly, for the LMC, |${\rm SF}^{\rm (3\, pts)}_2 (\text{RM}/{\rm I_{H\alpha }}^{0.37}) \sim r^{1.63 \pm 0.06}$| implies α ≈ 1.6 ± 0.1. We can use these values of α and estimated β (the slope of the RM power spectrum, |$\mathcal {P}_{k}(\text{RM}) \sim k^{-\beta }$|) to compute the slope of the thermal electron density power spectrum, γ in |$\mathcal {P}_{k}(\gamma) \sim k^{-\gamma }$|, using equation (15) (which assumes a lognormal thermal electron density distribution and no correlation between thermal electron density and magnetic fields). Since SF2(RM) ∼ rβ − 1, using |${\rm SF}^{\rm (3\, pts)}_2 (\text{RM})$| in Figs 15 and 16, we obtain β ≈ 2.4 and 2.5 for the SMC and LMC, respectively. Now, given α and β, we obtain γ from equation (15). This gives two solutions for γ as the equation is quadratic, and we choose the negative or smaller of the two solutions.4 We find that γ ≈ 0.002 (± 0.2) for the SMC and ≈−0.02 (±0.09) for the LMC. The uncertainty in the estimated slope of the thermal electron density power spectrum is high but the thermal electron density power spectrum has a slope ≈0, implying very small (or no) variations over these scales. Thus, the RM power spectrum is primarily determined by the magnetic field power spectrum and the contribution from the thermal electron density power spectrum is relatively small or negligible.
A summary of all the estimated parameters is given in Table 2. We find that the correlation length of the magnetic field is higher for the SMC by a factor roughly equal to two but the field strength and the slope of the magnetic field power spectrum are comparable for both the SMC and LMC.
Estimated properties of small-scale magnetic fields and thermal electron densities in the SMC and LMC. The columns are as follows: 1) cloud name, 2) correlation length of the small-scale magnetic field, ℓ(b), 3) average small-scale magnetic field strength, brms, 4) slope of the magnetic field power spectrum, α in |$\mathcal {P}_{k}(b) \sim k^{-\alpha }$|, and 5) slope of the thermal electron density power spectrum, γ in |$\mathcal {P}_{k}(n_{\rm e}) \sim k^{-\gamma }$|.
| Cloud . | ℓ(b) [pc] . | brms [|$\mu {\rm G}$|] . | α . | γ . |
|---|---|---|---|---|
| SMC | 160 ± 21 | 14 ± 2 | 1.3 ± 0.4 | 0.002 ± 0.2 |
| LMC | 87 ± 17 | 15 ± 3 | 1.6 ± 0.1 | −0.02 ± 0.09 |
| Cloud . | ℓ(b) [pc] . | brms [|$\mu {\rm G}$|] . | α . | γ . |
|---|---|---|---|---|
| SMC | 160 ± 21 | 14 ± 2 | 1.3 ± 0.4 | 0.002 ± 0.2 |
| LMC | 87 ± 17 | 15 ± 3 | 1.6 ± 0.1 | −0.02 ± 0.09 |
5 CONCLUSIONS
Using numerical simulations, we first comprehensively study the dependence of the RM structure function on the properties of small-scale random magnetic fields and thermal electron densities. We then use those results to study the properties of small-scale magnetic fields in the SMC and LMC. In particular, we discuss the effects of thermal electron density on the statistical properties of RM. For numerical simulations, we use Gaussian random magnetic fields and lognormal thermal electron densities (in Appendix C, we also explore magnetic fields and electron densities from MHD simulations, where the magnetic field-thermal electron density correlation is varied). Our results and conclusions are summarized below.
For Gaussian random magnetic fields with a power-law spectrum of slope α, i.e. |$\mathcal {P}_{k}(b) \sim k^{-\alpha }$|, the slope of the RM power spectrum is −α − 1 (assuming a constant thermal electron density). The corresponding slope of the second-order RM structure function is α (Section 3.1). This has to be confirmed by computing second-order structure functions with different numbers of points per stencil (Section 2). We compute the structure function with two-, three-, four-, and five-point stencils, and show that agreement with theoretical expectations is best for the five-point stencil. Thus, to accurately capture variations in the RM structure function, its computation with a high-point stencil (points greater than the two-point stencil) may be required. This is particularly crucial for observational data, where we usually have only one snapshot and a limited range in the probed scales. Furthermore, we show that the length scale around which the structure function approaches an asymptotic value (which depends on the number of points per stencil) is approximately equal to the correlation length of the random magnetic field (Appendix A). The PDF of RM also follows a Gaussian distribution.
With the Gaussian random magnetic fields, we consider lognormal thermal electron density PDFs with a power-law spectrum of slope γ, i.e. |$\mathcal {P}_{k}(n_{\rm e}) \sim k^{-\gamma }$|. The slope of the RM power spectrum, β, i.e. |$\mathcal {P}_{k}(\text{RM}) \sim k^{-\beta }$|, depends on both α and γ. We derive an empirical relationship, equation (15), to determine β, given α and γ (Section 3.2). Once β is known, the second-order structure function of RM, has a slope approximately equal to β − 1. The RM PDFs, when a lognormal thermal electron density is included, are non-Gaussian.
We use RM and Hα observations for the SMC and LMC to determine the fluctuating, small-scale magnetic field properties in the SMC and LMC (Section 4). From these observations, we remove the contribution of the Milky Way from RM and IHα, and also the contribution of dust in the SMC and LMC from IHα. First, we find the dependence of |RM| on IHα, |RM| ∝ IHα0.55 for the SMC, and |RM| ∝ IHα0.37 for the LMC. Any deviations from the theoretical expectation, |RM| ∝ IHα0.5, are probably because of the non-homogeneity of the interstellar medium and/or because of variations in the large-scale magnetic field along the path-length.
The number of RM sources for computing RM statistics is 65 for the SMC and 246 for the LMC. We study the properties of the RM power spectrum via the RM structure function (since the pair of sources have non-uniform separation). For the SMC, the low number of points means that there is a higher uncertainty in some of the results (especially the slope of the magnetic power spectrum; see Appendix F for further discussion on the effect of the number of sources on the properties of second-order RM structure functions) and might be biased towards a particular region. Future observations from the Polarization Sky Survey of the Universe’s Magnetism (POSSUM) survey (Gaensler et al. 2010) and eventually the Square Kilometre Array (SKA) (Heald et al. 2020) would provide data with higher sensitivity for a significantly larger number of sources, which would make it possible to study the RM spectra (probe of magnetic scales) and PDFs (probe of magnetic field structure, i.e. Gaussian versus non-Gaussian) in much greater detail. Using the data at hand for the Magellanic clouds, it is difficult to study RM PDFs and thus we cannot explore the magnetic field structure. However, we compute the second-order structure function of RM, RM compensated by IHα according to the derived relation, and the theoretical relation. We show that the slope of the RM structure functions for the two- and three-point stencils are roughly similar, for both the SMC (Fig. 15) and LMC (Fig. 16). This shows the convergence of the RM structure function. Based on the RM structure functions, we derive the following three properties of the magnetic fields in the SMC and LMC (assuming Gaussian random magnetic fields, lognormal thermal electron density, and no correlation between them): the correlation length (160 ± 21 pc for the SMC and 87 ± 17 pc for the LMC), the magnetic field strength (14 ± 2 |$\mu {\rm G}$| for the SMC and 15 ± 3 |$\mu {\rm G}$| for the LMC), and the slope of the magnetic power spectrum (−1.3 ± 0.4 for the SMC and −1.6 ± 0.1 for the LMC). Furthermore, we find that the thermal electron density is practically constant over the magnetic field correlation scales and the RM power spectrum is primarily decided by the magnetic field power spectrum.
ACKNOWLEDGEMENTS
C. F. acknowledges funding provided by the Australian Research Council (Future Fellowship FT180100495), and the Australia-Germany Joint Research Cooperation Scheme (UA-DAAD). We further acknowledge high-performance computing resources provided by the Leibniz Rechenzentrum and the Gauss Centre for Supercomputing (grants pr32lo, pn73fi, and GCS Large-scale project 22542), and the Australian National Computational Infrastructure (grant ek9) in the framework of the National Computational Merit Allocation Scheme and the ANU Merit Allocation Scheme.
DATA AVAILABILITY
The RM observations for the SMC are taken from Livingston et al. (2022) and that for the LMC are from Mao et al. (2012) and Livingston et al. (in preparation). The Hα map for the Magellanic clouds is taken from Gaustad et al. (2001). The Milky Way RM models are taken from Oppermann et al. (2015) and Hutschenreuter et al. (2021). The MHD simulation data and the data derived from the observations is available upon reasonable request to the corresponding author, Amit Seta ([email protected]).
Footnotes
While constructing the Gaussian random magnetic fields, we ensure that the divergence-free nature of magnetic fields is preserved. This is done via the Helmholtz decomposition, where we only keep the modes transverse to the wave vector and then normalize the field to have the desired brms.
For constructing the thermal electron density with a lognormal PDF, we use the module pyFC (https://bitbucket.org/pandante/pyfc).
We neglect the large-scale stratification and any radial dependence in the analysis. However, since we are mostly interested in small-scale magnetic field properties, we expect those to not make a significant difference in our results.
This is because we expect the slope of the power spectrum of the small-scale magnetic field and thermal electron density to be negative, i.e. their strength decreases with decreasing length scale. Given the turbulent nature of the ISM, this is a reasonable assumption due to the energy cascade (energy injected at larger scales, cascades to smaller scales, and ultimately dissipates).
REFERENCES
APPENDIX A: TURNOVER OR BREAK SCALE OF THE RM STRUCTURE FUNCTION
Here, we study how the turnover or break scale of RM structure function depends on the properties of the small-scale random magnetic fields. For a Gaussian random magnetic field with a power-law magnetic power spectrum of slope −1.67, we vary the minimum wavenumber, kmin (which corresponds to the largest scale in the random field), keeping the size of the numerical domain, L, and the number of grid points, 5123, same. The power spectrum, |$\mathcal {P}_{k}(b)$| for kmin = 2, 4, 8, and 16 is shown in Fig. A1(a). We calculate the correlation length of the small-scale magnetic field, ℓ(b), using equation (4) with |$\mathcal {P}_{k}(b)$| and the corresponding values are given in the legend of Fig. A1(a). In Fig. A1(b), we show the second-order structure function computed with two points for the magnetic field, and it shows that the scale at which the structure function turns over is approximately equal to ℓ(b). Figs A1(c) and (d) shows the RM power spectrum and second-order structure function computed with two points for different kmin. The corresponding correlation length of RM computed using equation (4) is given in the legend. The RM structure function roughly turns over at a scale that is approximately equal to the ℓ(RM), which in turn is roughly equal to ℓ(b). Thus, for a Gaussian random magnetic field, the turnover scale of RM structure function is approximately the correlation length of the magnetic field. If the scale of the region probed is smaller than the correlation length of the magnetic field, the RM structure function does not turn over and does not saturate at the expected value.

One-dimensional power spectrum ((a), (c)) and second-order structure function computed with two points ((b), (d)) for magnetic field ((a), (b)) and RM ((c), (d)) for a Gaussian random magnetic field with power spectrum, |$\mathcal {P}_{k}(b) \sim k^{-1.67}$|, and different kmin (largest scale of the magnetic field). The corresponding correlation length of magnetic fields, ℓ(b) and RM, ℓ(RM), is given in the legends. The slope of RM power spectrum is ≈2.7, as expected from Section 3.1. The turnover scale of RM structure function is approximately equal to ℓ(RM), which in turn is roughly equal to ℓ(b). This shows that the turnover scale of RM structure function probes the correlation length of the small-scale random magnetic fields.
APPENDIX B: ROTATION MEASURE STRUCTURE FUNCTION FOR UNIFORM RANDOM MAGNETIC FIELDS AND LOGNORMAL THERMAL ELECTRON DENSITY
Here, we explore RM structure functions for lognormal thermal electron densities with a power-law spectrum (|$\mathcal {P}_{k}(n_{\rm e}) \sim k^{-\gamma }$| with γ = [1, 4], normalized to the same 〈ne〉 for all γs) and for a random magnetic field drawn from a uniform distribution with no particular power spectrum (normalized to the same brms for all γs). Fig. B1 shows the corresponding RM power spectra and second-order structure functions (|${\rm SF}^{\rm (5\, pts)}_2({\rm RM})$|, calculated with the highest number of points for the stencil, see Section 3.1) for different values of γ. For all γ, the RM power spectrum follows a k1 power law and the RM structure function is flat (at |$70~\sigma ^{2}_{\text{RM}}$|; see Section 2). Thus, we do not get any RM fluctuations for a uniform random magnetic field, even on varying the slope of the thermal electron density power spectrum (unlike Section 3.2, where we get RM fluctuations even for a constant ne). This shows that the magnetic field spectrum and distribution are important for studying RM fluctuation scales (also see Appendix A).
![One-dimensional power spectrum (panel a) and second-order structure function (panel b), ${\rm SF}^{\rm (5\, pts)}_2({\rm RM})$, computed with five-point stencils, for a random magnetic field, b, drawn from a uniform distribution (no particular power spectrum), and lognormal thermal electron densities, ne, with a power-law spectrum and different values of the slope, γ, in the range [1, 4]. For all γ, the RM power spectrum follows a power law with slope 1 and the RM structure function is flat at $70~\sigma ^{2}_{\text{RM}}$. This further shows that the scales of RM fluctuations are primarily controlled by the magnetic field spectra.](https://oup.silverchair-cdn.com/oup/backfile/Content_public/Journal/mnras/518/1/10.1093_mnras_stac2972/1/m_stac2972figb1.jpeg?Expires=1750274799&Signature=Uh3TazY6ue3FN6POQxbXn8ubolbdPoctIljmUMzglTQ9NX9hYi2X0hERE1dfgAGt8O~ybb-RnoMKi6Q~jaOGaO2QEl6Cud8Yp3byFpb0u~HkzVyyiYB-CIrgM6o3C4uD-KefjJIC57cwQSYBiamlW1yKBmEAvyrmVGkGDfmDwQDc468TiV-JyK~eoINdx3xnkPIzyZxI-3uwFgYFhCY99UR7wT1g0i4XHxT4w-THj6HTLD404v2DzxtZ5S5YEVAt8qdzGVwe72P~Im~m87m6e-BCzHgXiTQ59dKTCxNkPmdceDiCZPIDV~o1FryNDHzmuST5NefJSVVHO6R313h3Sg__&Key-Pair-Id=APKAIE5G5CRDK6RD3PGA)
One-dimensional power spectrum (panel a) and second-order structure function (panel b), |${\rm SF}^{\rm (5\, pts)}_2({\rm RM})$|, computed with five-point stencils, for a random magnetic field, b, drawn from a uniform distribution (no particular power spectrum), and lognormal thermal electron densities, ne, with a power-law spectrum and different values of the slope, γ, in the range [1, 4]. For all γ, the RM power spectrum follows a power law with slope 1 and the RM structure function is flat at |$70~\sigma ^{2}_{\text{RM}}$|. This further shows that the scales of RM fluctuations are primarily controlled by the magnetic field spectra.
APPENDIX C: CORRELATED MAGNETIC FIELDS AND THERMAL ELECTRON DENSITY FROM COMPRESSIBLE MHD SIMULATIONS WITH ZERO MEAN FIELD AND WEAK RANDOM SEED FIELD
In this Appendix, we explore RM constructed from thermal electron densities and magnetic fields, which are numerical solutions of the MHD equations, not independent of each other, and can also be correlated. We use numerically driven MHD turbulence simulations, where we solve the continuity equation, induction equation, and Navier–Stokes equation with a prescribed forcing on a three-dimensional triply-periodic uniform grid consisting of 5123 grid points. We also consider explicit viscous and resistive terms. The flow is driven on the scale, L/2, where L is the side length of the cubic numerical domain. The simulation is initialized with a very weak random seed field (with mean zero) and undergoes small-scale dynamo action. Thus, the magnetic field first grows exponentially and then saturates once it becomes strong enough to react back on the turbulent flow. The full details of these numerical simulations are given in section 2 and section 3 of Seta & Federrath (2021b). The main parameter that controls the correlation between the thermal electron density and magnetic fields is the Mach number, |$\mathcal {M}$|, of the turbulent flow and the correlation increases with |$\mathcal {M}$|. In this paper, we use the thermal electron density and magnetic fields for four Mach numbers (|$\mathcal {M}=0.1, 2, 5,$| and 10) and all other parameters (such as viscosity, resistivity, solenoidal nature of the turbulent forcing, driving scale of turbulence, and length of the domain) remain the same across all Mach numbers. These simulations are labelled as |$\mathcal {M}0.1, \mathcal {M}2.0, \mathcal {M}5.0,$| and |$\mathcal {M}10.0$|. Moreover, for each |$\mathcal {M}$|, we take 10 statistically independent snapshots in time, once the field has saturated, for statistical averaging.
Figs C1 and C2 shows two-dimensional slices of normalized magnetic field strengths, b/brms, and thermal electron densities, ne/〈ne〉, centred on the middle of the three-dimensional numerical domain for different Mach numbers. The magnetic field is random but shows complex structures. It also spatially varies over a much larger range of magnetic field strengths than the Gaussian random magnetic fields in Fig. 2. The thermal electron density is practically constant for |$\mathcal {M}=0.1$| (subsonic case), but varies spatially as the Mach number increases. Even visually, the structures in thermal electron densities and magnetic fields seem correlated for |$\mathcal {M}=2, 5,$| and 10. The correlation and enhancement in correlation with |$\mathcal {M}$| is shown by two-dimensional PDFs of ne and b in Fig. C3. For |$\mathcal {M}=0.1$|, the thermal electron density does not change much but the magnetic field varies significantly (see Fig. C1), so both distributions are largely uncorrelated. However, as the Mach number increases, the correlation between ne and b is enhanced. The best-fitting line for |$\mathcal {M}=2, 5,$| and 10 (Fig. C3) approximately agrees with the relationship obtained from the flux-freezing constraint, |$b \propto n_{\rm e}^{2/3}$|, and more number of points tightly follow the relation for higher Mach numbers (compare the distribution of points for the |$\mathcal {M}2.0$| and |$\mathcal {M}10.0$| cases in Fig. C3).
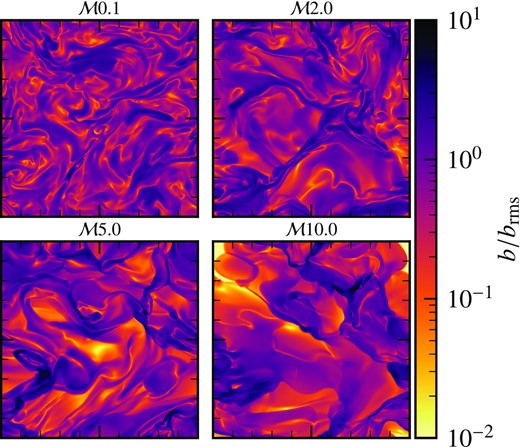
Two-dimensional slices of normalized magnetic field strengths, b/brms, obtained from the MHD simulations at various different Mach numbers, |$\mathcal {M}=0.1, 2, 5, 10$|. Magnetic fields have complex structures and spatially vary over many orders of magnitude in comparison to the Gaussian random magnetic fields explored in Section 3.1 (c.f. Fig. 2).
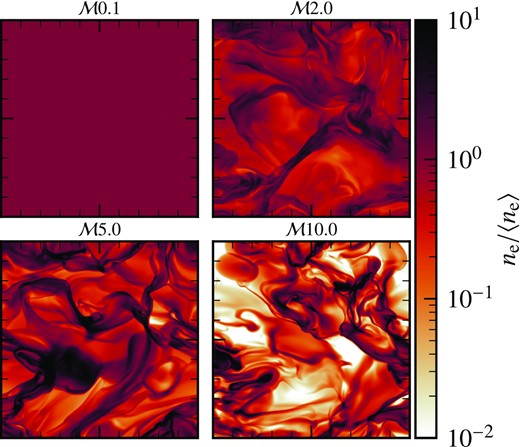
Two-dimensional slices of normalized thermal electron densities, ne/〈ne〉, obtained from the MHD simulations at various different Mach numbers, |$\mathcal {M}=0.1, 2, 5, 10$|. For |$\mathcal {M}0.1$|, the thermal electron density is practically constant. As the Mach number increases, the thermal electron densities spatially vary over a large range of scales and the structures show correlation with the magnetic structures in Fig. C1.
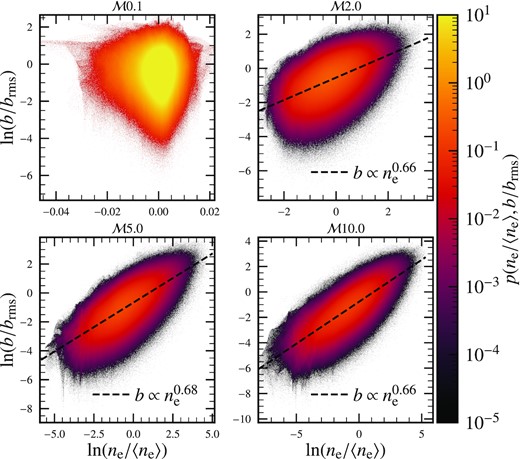
Two-dimensional PDF of normalized thermal electron density and magnetic fields for various Mach numbers. No significant correlation is seen for the |$\mathcal {M}0.1$| case, but as the Mach number increases, the correlation between the two quantities is enhanced. For |$\mathcal {M}=2, 5, 10$|, the best-fitting line (dashed, black line; obtained using the least-squares fitting procedure) approximately follows the flux freezing constraint, |$b \propto n_{\rm e}^{2/3}$|. However, as the Mach number increases, the points fit the constraint more tightly, which shows that the correlation increases with |$\mathcal {M}$|.
In Fig. C4, we show power spectra of the magnetic field and the thermal electron density for different Mach numbers. Unlike our numerical experiments in Section 3.1 and Section 3.2, the inertial range in these MHD simulations is quite small. The magnetic field spectra at larger scales have roughly the same slope across all Mach numbers. By contrast, the slope of the thermal electron density power spectrum becomes shallower as the Mach number increases. This shows that power at a smaller scale for the thermal electron density increases as the Mach number increases. This result agrees with previous studies of compressible hydrodynamic turbulence (Kim & Ryu 2005) and MHD turbulence with a mean field (Federrath & Klessen 2013).

One-dimensional shell-averaged power spectrum of magnetic fields (a) and thermal electron densities (b) for all Mach numbers (averaged over 10 statistically independent time snapshots). The spectral slope of the magnetic field is largely independent of the Mach number on larger scales (k ≲ 20), but the slope of the thermal electron density spectrum becomes shallower with increasing Mach number.
Fig. C5 shows the PDF of a single component of the magnetic fields, bx/brms, at different Mach numbers. The distribution is far from Gaussian (even for the |$\mathcal {M}0.1$| case), and this is also confirmed by the computed kurtosis (using equation 16 but for bx/brms), which is >3 (kurtosis of a Gaussian distribution is equal to 3) for all Mach number cases. The kurtosis increases with the Mach number and this shows that the non-Gaussianity in the magnetic field increases with increasing |$\mathcal {M}$|. Thus, the magnetic field PDFs in these MHD simulations are highly non-Gaussian; a characteristic of small-scale dynamo-generated magnetic fields (see Seta et al. 2020).
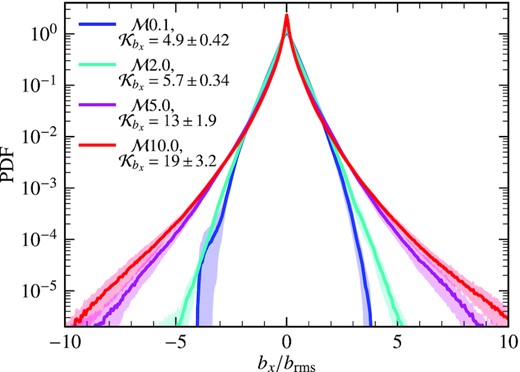
PDF of a single component of the magnetic field at |$\mathcal {M}=0.1, 2, 5,$| and 10. The lines and shaded regions show the mean and standard deviation obtained after averaging over 10 snapshots. The distributions are non-Gaussian and the computed kurtosis (given in the legend) increases with the Mach number. This shows that the magnetic field distribution becomes more non-Gaussian as the Mach number increases.
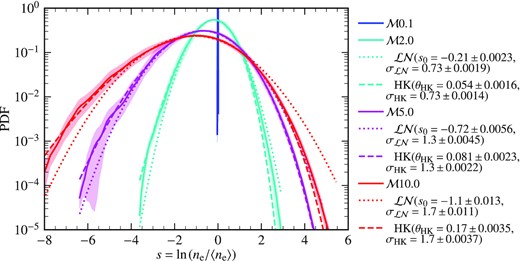
PDF of s = ln (ne/〈ne〉 for |$\mathcal {M}=0.1, 2, 5, 10$| (solid lines show the mean and the shaded region show the one-sigma fluctuations, when averaged over 10 statistically independent time snapshots). The thermal electron density is practically a delta function for the |$\mathcal {M}0.1$| case. For |$\mathcal {M}=2, 5, 10$|, ne/〈ne〉 varies by orders of magnitude. We fit the lognormal (equation C1, dotted line) and Hopkins PDF model (equation C2, dashed line), and show that the Hopkins PDF model provides a better fit, especially at higher Mach numbers and at higher values of s. The parameter, θHK, is a measure of the spatial intermittency of the thermal electron density and it increases with increasing Mach number.
In Fig. C6, we show the PDF of s of the simulations together with the fitted distributions for |$\mathcal {M}=2, 5,$| and 10. The best-fitting parameters for both fit models are given in Table C1. For the lognormal distribution, as expected, |$s_{0} \approx - {\sigma _{\mathcal {LN}}}^{2}/2$|. For the Hopkins PDF model, θHK increases as the Mach number increases. The Hopkins PDF model provides a better fit to ne than the lognormal distribution. This is especially true for higher values of ne/〈ne〉, where the lognormal PDF overestimates the data. Most of the previous simulations studied this in the absence of a magnetic field, or in the presence of a weak mean magnetic field (Hopkins 2013) (although see Beattie et al. 2021, which explores intermittency in the case of a strong mean field). We show that the statistics of the density field are similar to the cases studied in Hopkins (2013), but here in the absence of a mean field.
Fit parameters for the lognormal and Hopkins fits of the thermal electron density PDF (Fig. C6, except for the |$\mathcal {M}0.1$| case, where the thermal electron density is practically a delta function) and the computed kurtosis for the magnetic field PDF (Fig. C5). The columns are: 1) Mach number of the simulation, |$\mathcal {M}$|, 2) mean in the lognormal fit, s0, 3) variance in the lognormal fit, |$\sigma _{\mathcal {LN}}$|, 4) |$-\sigma _{\mathcal {LN}}^{2} / 2$|, which is roughly equivalent to column 2 due to the mass conservation constraint, 5) intermittency parameter in the Hopkins PDF model, θHK, 6) variance in the Hopkins PDF model, σHK, and 7) kurtosis of the x-component of the magnetic field, |$\mathcal {K}_{b_{x}}$| (the y- and z-components are very similar to the x-component, as the simulations analysed here do not have a mean field). Further in column 8) we provide the variance of s, σs, obtained using the analytical expression, equation (C3). The variance estimated from the fit (column 3) is close to that obtained using the analytical expression (column 8).
| |$\mathcal {M}$| . | s0 . | |$\sigma _{\mathcal {LN}}$| . | |$-\sigma _{\mathcal {LN}}^2/2$| . | θHK . | σHK . | |$\mathcal {K}_{b_x}$| . | σs . |
|---|---|---|---|---|---|---|---|
| 0.1 | – | – | – | – | – | 4.9 ± 0.42 | 0.03 |
| 2.0 | −0.21 ± 0.0023 | 0.73 ± 0.0019 | −0.27 | 0.054 ± 0.0016 | 0.73 ± 0.0014 | 5.7 ± 0.34 | 0.6 |
| 5.0 | −0.72 ± 0.0056 | 1.3 ± 0.0045 | −0.84 | 0.081 ± 0.0023 | 1.3 ± 0.0022 | 13 ± 1.9 | 1.2 |
| 10.0 | −1.1 ± 0.013 | 1.7 ± 0.011 | −1.4 | 0.17 ± 0.0035 | 1.7 ± 0.0037 | 19 ± 3.2 | 1.6 |
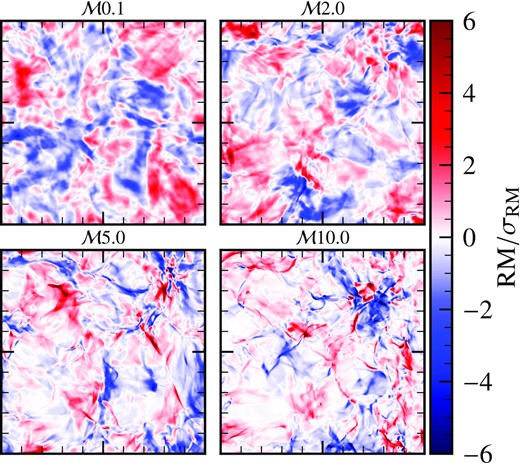
RM maps obtained using the thermal electron density and magnetic fields at four Mach numbers, |$\mathcal {M}=0.1, 2, 5,$| and 10. The RM structures look filamentary, especially for higher Mach numbers and at higher values of |RM|.
Fig. C8 shows the spectra and PDFs of RM and RMb for |$\mathcal {M}=0.1, 2, 5, 10$|. The spectrum for the |$\mathcal {M}0.1$| case is roughly the same for both RM and RMb. The power spectrum of RMb does not change much with the Mach number. This is because the magnetic field power spectra, at larger scales, have a very similar slope for all Mach numbers (Fig. C4a). For |$\mathcal {M}=2, 5, 10$|, the RMb power spectrum is different from the RM power spectrum, the slope for RM is shallower than RMb. Also, the RM power spectrum becomes shallower as the Mach number increases. This is because of the contribution of ne to RM (see Fig. C4b for the power spectrum of ne). Fig. C8(b) shows the PDF of RM and RMb for all Mach numbers. The PDF of RMb follows a near Gaussian distribution (|$\mathcal {K}_{\text{RM}_{b}} \approx 3$|) for all Mach numbers, whereas the PDF of RM is non-Gaussian and the level of non-Gaussianity increases with the Mach number (|$\mathcal {K}_{\text{RM}}$| increases with |$\mathcal {M}$|). Thus, even for a non-Gaussian magnetic field (see Fig. C5), the PDF of RM is approximately a Gaussian distribution if the thermal electron density is assumed to be a constant. The non-Gaussianity in the PDF of RM is primarily due to ne and correlated ne − b structures (also, see fig. 3a and table 2 in Seta & Federrath 2021b). Thus, the thermal electron density and its correlation with magnetic fields affect both the spectra (and by extension the structure function) and PDF of RM.
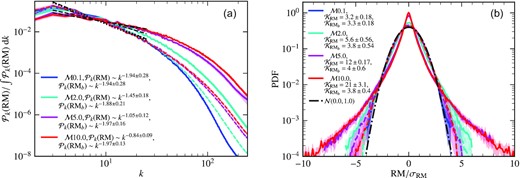
RM spectra (a) and PDFs (b) of RM (computed using equation 1, solid lines) and RMb (computed using equation C4, without considering ne, dashed lines) for MHD simulations with all four Mach numbers. For all Mach numbers, the slope of the spectra of RMb (at larger scales) is roughly the same as that of RM and the RMb PDF roughly follows a Gaussian distribution. On the other hand, for RM, the slope of the magnetic spectrum becomes shallower as the Mach number increases and also the non-Gaussianity of the RM PDF is enhanced.
APPENDIX D: MODELS FOR THE MILKY WAY RM CONTRIBUTION
We remove the RM contribution due to the Milky Way from the observed RMs using a known model. Here, we compare three different models for the Milky Way RM at sky positions where RM sources for the SMC and LMC are located. These models are following: analytical model from the literature (equation 5 in Mao et al. (2008) for the SMC and equation 3 in Mao et al. (2012) for the LMC), a Bayesian model by Oppermann et al. (2015), and a more recent Bayesian model by Hutschenreuter et al. (2021) (this model is referred as ‘Faraday 2020’). Fig. D1 shows the comparison between these three models and Table D1 summarizes the mean and standard deviation of |$\text{RM}(\rm MW)$| for each model. We find that the analytical models always give the highest |$\text{RM}(\rm MW)$| and also have a larger variation (the mean and standard deviation both are higher, see Table D1). The other two models give comparable results for the SMC and slightly different numbers for the LMC. Thus, these models can introduce differences in computed quantities and by extension to the estimates of small-scale magnetic field properties. For our work, we chose analytical models as the data from Mao et al. (2012) for the LMC, which we use, is also used to generate the Bayesian Milky Way RM models, and thus might show some correlation between the RM of the LMC and |$\text{RM}(\rm MW)$| (see section 4.2.2 in Hutschenreuter et al. 2021).
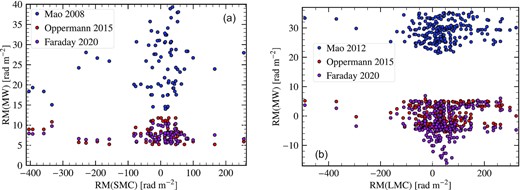
Comparison between the three different Milky Way RM models, analytical model (blue points, using Mao et al. (2008) for the SMC and Mao et al. (2012) for the LMC), Oppermann 2015 (red points, Oppermann et al. (2015)), and Faraday 2020 (magenta points, Hutschenreuter et al. (2021)) for the RMs observed from the SMC ((a), RMSMC) and LMC ((b), RMLMC). The RMMW predicted by the analytical model is always higher than the other two, which gives comparable numbers in that region of the sky. These differences in models might affect the estimated properties of small-scale magnetic fields.
Table showing the mean (μ) and standard deviation (σ) for |$\text{RM}(\rm MW)$| computed at locations of RMs for the SMC and LMC for each of the three different models: analytical (Mao et al. (2008) for the SMC and Mao et al. (2012) for the LMC), Oppermann 2015 (Oppermann et al. 2015), and Faraday 2020 (Hutschenreuter et al. 2021). All numerical values are in rad m−2.
| Cloud . | Analytical . | Oppermann 2015 . | Faraday 2020 . | |||
|---|---|---|---|---|---|---|
| . | |$\mu _{\text{RM}(\rm MW)}$| . | |$\sigma _{\text{RM}(\rm MW)}$| . | |$\mu _{\text{RM}(\rm MW)}$| . | |$\sigma _{\text{RM}(\rm MW)}$| . | |$\mu _{\text{RM}(\rm MW)}$| . | |$\sigma _{\text{RM}(\rm MW)}$| . |
| SMC | 25.1 | 6.6 | 7.7 | 1.9 | 7.5 | 1.3 |
| LMC | 28.8 | 3.5 | −0.043 | 3.4 | −2.0 | 4.7 |
APPENDIX E: EFFECT OF FLUCTUATIONS IN THE INTRINSIC RM DISTRIBUTION OF SOURCES
In principle, the background RM distribution can also have some dispersion, say |$\sigma _{\text{RM}_{\rm int}}$|, which is intrinsic to the source distribution. This |$\sigma _{\text{RM}_{\rm int}}$| is usually small compared to the RM due to the intervening medium, σRM. For the case of the SMC and LMC, |$\sigma _{\text{RM}_{\rm int}}$| is |${\lesssim}10\ \hbox{per cent}$| of the σRM (see Section 4.2). So, practically, its effect on the analysis is small and can be neglected. However, for completeness, here we show how varying |$\sigma _{\text{RM}_{\rm int}}$| affects the second-order RM structure function.
For a Gaussian random magnetic field with power spectrum, |$\mathcal {P}_{k}(b) \sim k^{-1.67}$|, in Fig. E1, we show the second-order RM structure function computed using stencils with two, three, four, and five points and varying levels of intrinsic RM fluctuations (in units of |$\sigma _{\text{RM}_{\rm int}}$|, ranging from 0 to 25 per cent). For higher |$\sigma _{\text{RM}_{\rm int}} / \sigma _{\text{RM}}$|, at smaller scales, the second-order RM structure function gets flatter and this affects the slope of the RM structure function. However, the slope, turnover scale, and the expected value at large length scales are not significantly affected. These conclusions hold true for any number of points in the stencil.
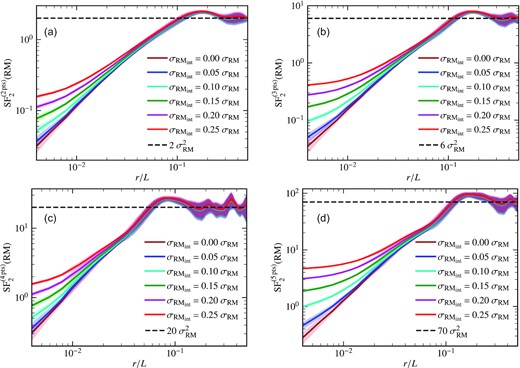
Second-order RM structure function computed using stencils with two (a), three (b), four (c), and five (d) points for a Gaussian random magnetic field with power spectrum, |$\mathcal {P}_{k}(b) \sim k^{-1.67}$| and different levels of intrinsic RM fluctuations (solid lines, corresponding values shown in the legend), |$\sigma _{\text{RM}_{\rm int}}$| in units of σRM (which is due to the intervening medium). The dashed, black line shows the expected values of the second-order RM structure function at large length scales (depends on the number of points in the stencil, see Section 2). For all the cases (i.e. different number of points in the stencil), the following properties of the second-order RM structure function: the slope at larger scales, the turnover scale, and the expected values at large length scales are unaffected by the intrinsic RM fluctuations. Only the slope of the second-order RM structure function at smaller scales is affected (the structure function at smaller scales becomes flatter) as |$\sigma _{\text{RM}_{\rm int}}$| increases.
APPENDIX F: EFFECT OF VARYING NUMBER OF SOURCES
Usually, RM observations have a much smaller sample size in comparison to numerical experiments. Here, we test how varying the number of samples affects the second-order RM structure function. In Fig. F1, we compare the second-order RM structure function obtained for the whole sample (using 5122 points, shown in solid, black line) and that computed for a random sample with varying sample size, nsamp (coloured lines). For a lower number of sources, the second-order RM structure function is severely affected at smaller scales. However, with a sample size of a few hundred sources, the slope on larger scales, the turnover scale, and the expected value at the large scales remain largely unaffected.
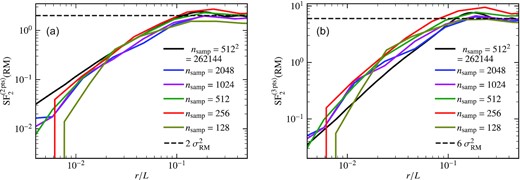
Second-order RM structure function computed using stencils with two (a) and three (b) points for a Gaussian random magnetic field with power spectrum, |$\mathcal {P}_{k}(b) \sim k^{-1.67}$| and varying number of RM sources in the sample, nsamp (motivated by Figs 15 and 16). The dashed, black line shows the expected values of the second-order RM structure function at large length scales. The solid, black line shows the entire sample (5122) and coloured lines show the different number of samples chosen randomly from the entire sample. The slope at smaller scales is severely affected by the number of samples. However, with a few hundred points, the slope of the second-order RM structure function at larger scales, the turnover scale, and the expected values at large length scales remain roughly the same.


