


ABSTRACT
We present a detailed study of a galaxy merger taking place at z = 1.89 in the GOODS-S field. Here, we analyse Keck/MOSFIRE spectroscopic observations from the MOSFIRE Deep Evolution Field (MOSDEF) survey along with multiwavelength photometry assembled by the 3D-HST survey. The combined data set is modelled to infer the past star formation histories (SFHs) of both merging galaxies. They are found to be massive, with log10(M*/M⊙) > 11, with a close mass ratio satisfying the typical major-merger definition. Additionally, in the context of delayed-τ models, GOODS-S 43114, and GOODS-S 43683 have similar SFHs and low star formation rates (log10(SFR(SED)/|${\rm M}_{\odot }\,\rm {yr}^{-1}$|) < 1.0) compared to their past averages. The best-fitting model SEDs show elevated H δA values for both galaxies, indicating that their stellar spectra are dominated by A-type stars, and that star formation peaked ∼0.5−1 Gyr ago and has recently declined. Additionally, based on SED fitting both merging galaxies turned on and shut off star formation within a few hundred Myr of each other, suggesting that their bursts of star formation may be linked. Combining the SFHs and H δA results with recent galaxy merger simulations, we infer that these galaxies have recently completed their first pericentric passage and are moving apart. Finally, the relatively low second velocity moment of GOODS-S 43114, given its stellar mass suggests a disc-like structure. However, including the geometry of the galaxy in the modelling does not completely resolve the discrepancy between the dynamical and stellar masses. Future work is needed to resolve this inconsistency in mass.
1 INTRODUCTION
Within the current Lambda cold dark matter (ΛCDM) cosmological framework, galaxies grow in mass through both merging events and the smooth accretion of baryons and dark matter. Mergers are an important component of galaxy formation models (e.g. Hopkins et al. 2010), and obtaining empirical constraints on merger rates as a function of galaxy mass and redshift is a current goal for observational galaxy evolution (e.g. Lotz et al. 2011; Cibinel et al. 2019; Duncan et al. 2019). Merging systems have been observed out to z ∼ 6 (Ventou et al. 2017), approximately ∼0.9 Gyr after the big bang.
Locally (i.e. z ∼ 0), the Sloan Digital Sky Survey (SDSS) has obtained large statistical samples of pre-coalescence galaxy pairs with projected separations of 30−80 kpc and radial velocity differences of 200−500 km s−1 (Ellison et al. 2008; Patton et al. 2011, 2013; Scudder et al. 2012, 2015). Compared to isolated galaxies at fixed stellar mass, these systems are identified as having gas-phase metallicity depressed by ∼0.02−0.05 dex and star formation rate (SFR) enhanced by |$\sim 60{{\ \rm per\ cent}}$| out to 30 kpc separation (Scudder et al. 2012). Merging systems at z > 1 are identified through a variety of methods including photometric pairs (e.g. Williams, Quadri & Franx 2011; Man et al. 2012; Man, Zirm & Toft 2016; Mantha et al. 2018), spectroscopic features (e.g. Tasca et al. 2014; Ventou et al. 2017; Dai et al. 2021), and visible morphological features such as tidal tails and double nuclei (e.g. Lofthouse et al. 2017; Kartaltepe et al. 2015).
Rest-optical spectroscopy provides a powerful probe of key galaxy properties such as SFR and metallicity, which register the effects of merging interactions. In the last decade, the commissioning of multiobject near-IR spectrographs on large ground-based telescopes has enabled us to obtain large samples of high S/N rest-optical emission-line spectra for galaxies at z ∼ 1.5−3.5. Utilizing the MultiObject Spectrometer For Infra-Red Exploration (MOSFIRE; McLean et al. 2012) instrument on the 10 m Keck I telescope, the MOSFIRE Deep Evolution Field (MOSDEF) survey (Kriek et al. 2015) has observed ∼1500 galaxies at 1.4 ≤ z ≤ 3.8 (roughly half of which are at z ∼ 2). Previous MOSDEF studies have identified high-redshift mergers using multiple methods. Horstman et al. (2021) identified 55 mergers at z ∼ 2 using the Cosmic Assembly Near-infrared Dark Energy Legacy Survey (CANDELS) morphology catalogue (Kartaltepe et al. 2015), and Wilson et al. (2019) spectroscopically identified 30 galaxy pairs at 1.5 ≲ z ≲ 3.5.
In this study, we present a merger at z = 1.89 between the galaxies GOODS-S 43114 and GOODS-S 43683, where galaxy IDs are drawn from the 3D-HST survey catalogues of Skelton et al. (2014). GOODS-S 43114 was targeted by the MOSDEF team, and high-quality J-, H-, and Ks-band Keck/MOSFIRE spectra were obtained. GOODS-S 43683 was not an MOSDEF target; however, it was serendipitously captured in the MOSFIRE slit given the mask position angle. This merger pair has been previously identified by van Dokkum & Brammer (2010) and is in the CANDELS morphology catalogue (Kartaltepe et al. 2015), though it has not been highlighted in previous MOSDEF merger analyses (e.g. Wilson et al. 2019; Horstman et al. 2021). van Dokkum & Brammer (2010) analyse the HST images and low-resolution WFC3 grism spectra of the merger pair, and, in addition, report that both galaxies contain an active galactic nucleus (AGN) based on X-ray luminosity data from Luo et al. (2008).
The goal of this study is to build on the earlier work of van Dokkum & Brammer (2010) by analysing the spectroscopic and host-galaxy properties of both galaxies using Keck/MOSFIRE spectra and emission-line corrected SED fitting and comparing with state-of-the-art galaxy merger simulations. Specifically, we aim to better understand the galaxy star formation histories (SFHs) and stellar population properties and the evolutionary stage of the merger, by fitting the Hδ absorption feature following the methodology from Zick et al. (2018) and using it to estimate the second velocity moment and dynamical mass of the system. Our analysis is enhanced relative to previous work on this merger pair based on both the inclusion of higher resolution rest-optical spectroscopy enabling a dynamical analysis of GOODS-S 43114, and also more systematic SED modelling of both members of the galaxy pair that folds in pan-chromatic observations extending through the mid- and far-IR. Section 2 provides an overview of the MOSDEF survey and presents the observations, the SED fitting methodology, and derived galaxy properties. Section 3 presents the results, while Section 4 provides a discussion of the key results in the context of current work with galaxy merger simulations. Finally, Section 5 summarizes the key results from this study.
All emission-line wavelengths are given in the vacuum frame. Throughout this paper, we adopt a Λ-CDM cosmology with H0 = 70 km s−1 Mpc−1, Ωm = 0.3, and |$\Omega _\Lambda$| = 0.7. Also, we assume the solar abundance pattern from Asplund et al. (2009).
2 OBSERVATIONS AND METHODS
2.1 The MOSDEF survey
Using the MOSFIRE instrument on the 10 m Keck I telescope, the MOSDEF survey has observed ∼1500 galaxies throughout its 48.5-night observing program between 2012 and 2016. MOSDEF galaxies were selected from five well-studied CANDELS and 3D-HST legacy fields (Grogin et al. 2011; Koekemoer et al. 2011; Momcheva et al. 2016) − AEGIS, COSMOS, GOODS-N, GOODS-S, and UDS − and were targeted in three distinct redshift ranges: 1.37 ≤ z ≤ 1.70, 2.09 ≤ z ≤ 2.61, and 2.95 ≤ z ≤ 3.80. These redshift bins were selected to optimise the detection of strong rest-optical emission-lines (e.g. [O ii]λλ3727,3730, H β, [O iii]λλ4960,5008, H α, [N ii]λ6585, and [S ii]λλ6718,6733) within windows of atmospheric transmission. Moderate spectral resolution (R = 3000–3650) was obtained, and the survey is H-band (rest-optical) magnitude-limited (HAB = 24.0, 24.5, and 25.0, respectively, in the low-, middle-, and high-redshift bins of the MOSDEF sample). We use an ABA ‘B’ (+ 1.5, 1.2, −1.2, −15 arcsec) dither pattern to account for detector defects, sky variations, and increase the S/N of the final spectra (Kriek et al. 2008). For additional MOSDEF observing details, see Kriek et al. (2015).
2.2 GOODS-S 43114 AND GOODS-S 43683 observations
GOODS-S 43114 was targeted for MOSDEF spectroscopic observations based on a catalogued spectrosopic redshift of z = 2.6087 from Balestra et al. (2010). In fact, this catalogued spectroscopic redshift is inconsistent with both the photometric redshift of z = 1.9135 listed in the 3D-HST catalogue (see also Schawinski et al. 2011), and the grism spectroscopic redshift presented in van Dokkum & Brammer (2010), the latter of which we were unaware of at the time of observation. The 3D-HST photometric redshift in fact places GOODS-S 43114 outside all of the nominal MOSDEF target ranges. However, within the MOSDEF targeting process, existing spectroscopic redshifts were given priority in the event that a discrepancy arose between spectroscopic and photometric redshift. Using the erroneous spectroscopic redshift for GOODS-S 43114 led to the fortuitous observation of the unique spectra described here.
GOODS-S 43114 was observed across two nights: 2016 January 1 and 2. The integration time was 2 h in each of the J, H, and Ks bands with seeing of 0.67, 0.86, and 0.65 arcsec, respectively. The spectroscopic redshift derived from our MOSFIRE observations is z = 1.8869, which is consistent with the photometric redshift in the 3D-HST catalogue (1.9135 ± 0.0395), and slightly lower than the redshift presented in van Dokkum & Brammer (2010) (1.902 ± 0.002). At this redshift, nebular emission lines such as [O ii]λλ3727,3730, H β, [O iii]λλ4960,5008, H α, [N ii]λ6585, and [S ii]λλ6718,6733 fall outside of the J, H, and Ks bands. However, we did observe the H γ and H δ Balmer absorption lines in the J band, from which we derived a spectroscopic redshift for GOODS-S 43114. The J-band MOSFIRE spectrum of GOODS-S 43114 is shown in Fig. 1. No discernible emission- or absorption-line features were captured in the H or Ks-bands. For the observation of this merger pair, the MOSFIRE slit width was 0.7 arcsec (5.89 kpc at z = 1.89) and the full width at half-maximum (FWHM) of the profile used for optimal extraction was 1.1 arcsec (9.26 kpc at z = 1.89).
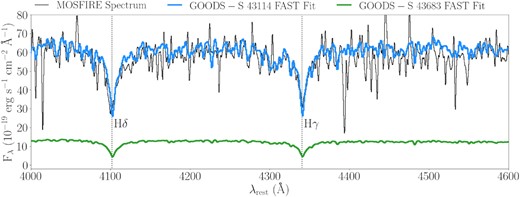
MOSFIRE J-band spectrum (black) for GOODS-S 43114 along with the section of the GOODS-S 43114 fast fit (blue) and GOODS-S 43683 fast fit (green) that overlaps with the spectra. The H δ and H γ stellar absorption features are labelled. The y-axis is given in units of 10−19 Fλ (i.e. erg s−1 cm−1 Å−1). The MOSFIRE spectrum has been smoothed to match the resolution of the best-fitting fast model.
Fig. 2 shows the HST WFC3 F160W 2D image of GOODS-S 43114 and GOODS-S 43683, including identifications of the ctraces the opacity of stellar entroids of the galaxies and the position of the MOSFIRE slit. We measure that the centroids of the two galaxies are 2.135 arcsec (18 kpc) apart, which agrees with van Dokkum & Brammer (2010). As previously stated, GOODS-S 43683 was not specifically targeted as part of the MOSDEF survey; however, as Fig. 2 shows, it was captured serendipitously in the MOSDEF slit with GOODS-S 43114 given the slit position angle of −40 deg E of N. Unfortunately, due to the adopted ABA'B' dither pattern and our method of using dithered exposures for sky subtraction (Kriek et al. 2015), we cannot detect the spectrum of GOODS-S 43683. Specifically, at a separation of 2.135 arcsec, the positive continuum of GOODS-S 43683 overlaps with the negative sky-subtraction residual of GOODS-S 43114 offset towards the top of the slit.
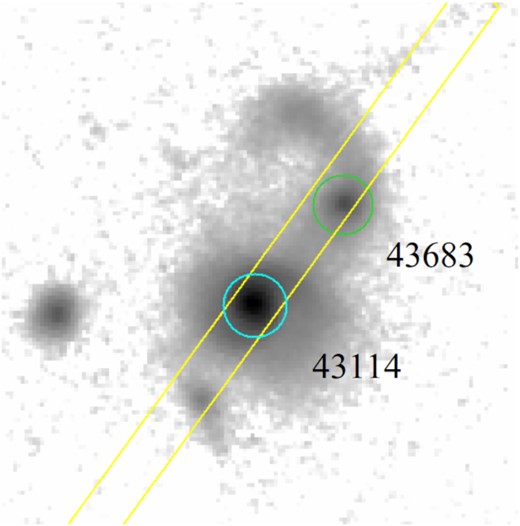
The HST WFC3 F160W image from the CANDELS survey with the MOSFIRE slit (yellow), GOODS-S 43114 centroid (blue) and GOODS-S 43683 centroid (green) identified. The image is shown with north up and east to the left.
GOODS-S 43114 and GOODS-S 43683 have been identified as a merger pair in van Dokkum & Brammer (2010) and the CANDELS morphology catalogue (Kartaltepe et al. 2015). The latter classifies mergers and other galaxy features based on the visual inspection. For GOODS-S 43114 (GOODS-S 43683), 100 per cent (66 per cent) of people classified it as having ‘any interaction’ while 66 per cent (100 per cent) claimed that tidal arms exist. GOODS-S 43114 is a class 4 merger, while GOODS-S 43683 is a class 3 merger, both of which are high confidence merger classifications. van Dokkum & Brammer (2010) also report this galaxy pair as having merger features such as diffuse, tidally-induced spiral arms and tails.
2.3 SED fitting and derived properties
We use the SED-fitting code fast1 (Kriek et al. 2009) to obtain best-fitting SEDs and estimates of key galaxy properties for GOODS-S 43114 and GOODS-S 43683. With fast, we adopt the Flexible Stellar Population Synthesis (FSPS) library from (Conroy & Gunn 2010) and assume a Chabrier (2003) stellar initial mass function (IMF), a Calzetti et al. (2000) dust attenuation curve, and delayed-τ SFHs where SFR(SED) |$\propto \, t \times {\rm e}^{-t/\tau }$|, where τ is the characteristic star formation time-scale and t is the time since the onset of star formation. We allow t, τ, the amount of interstellar extinction (AV), and stellar mass of the galaxy (M*) to vary within the models, while fixing the metallicity to 0.019 (defined to be solar metallicity in the Conroy & Gunn 2010 library). For the SED fitting, we fix GOODS-S 43114 and GOODS-S 43683 redshifts to the MOSFIRE spectroscopic redshift obtained for GOODS-S 43114. Given that these galaxies are in a merger with the centroids being only ∼18 kpc apart, this redshift assumption for GOODS-S 43683 seems reasonable. van Dokkum & Brammer (2010) validate our assumption, reporting z = 1.898 ± 0.003 for GOODS-S 43683 (they report z = 1.902 ± 0.002 for GOODS-S 43114). In addition, fitting the photometry with the code eazy2 (Brammer, van Dokkum & Coppi 2008) yields a photometric redshift of 1.899. Along with the best-fitting SED and an estimate of M*, SFR(SED), AV, and t/τ, we estimate sSFR(SED) from SFR(SED) and M*. UVJ colours are measured from the best-fitting SED using the iraf (Tody 1986, 1993) routine sbands.
We use broad-band photometry drawn from the 3D-HST v4.1 catalogues (Skelton et al. 2014) for both GOODS-S 43114 and GOODS-S 43683. A full description of the method used for multiwavelength photometric measurements is provided in Skelton et al. (2014). For GOODS-S 43114, we fit a combination of the broadband photometry and the J-band MOSFIRE spectra. Here, the MOSFIRE spectra are normalized to match the flux density corresponding to the photometric points in each band. Additionally, for the fitting, we ensure that the R = 3300 MOSFIRE J-band spectrum and fast models (with a native resolution of 2.5Å in the rest frame, Johnson et al. 2021a) are matched in spectral resolution. For GOODS-S 43 683, we only use the photometry in the fitting process because this target was not spectroscopically detected in the MOSFIRE observations.
The best-fitting SEDs and photometry are shown in Fig. 3. For GOODS-S 43683, there is an offset between the photometry (specifically IRAC channels 3 and 4) and best-fitting SED due to the contribution of the AGN. As a sanity check, we refit the photometry with fast without IRAC channels 2, 3, and 4, and find no significant difference in the estimated galaxy properties. Therefore, the presence of the AGN does not bias the SED fit. The portion of the best-fitting SEDs that overlaps with the MOSDEF J-band spectrum is shown in Fig. 1.
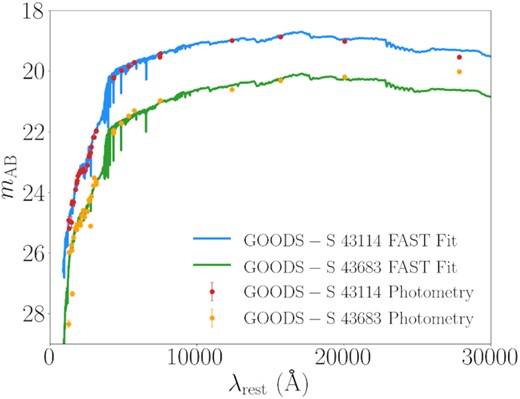
The best-fitting fast models and photometric data points for GOODS-S 43114 and GOODS-S 43683, shown in the rest frame. The best-fitting fast model and photometric data are indicated, respectively, with a blue curve and red points for GOODS-S 43114, and a green curve and orange points, respectively, for GOODS-S 43683. The y-axis is given in units of AB magnitude (mAB).
We estimate the 4000 Å break (Dn4000) and the H δ absorption-line feature (H δA), using the wavelength ranges from, respectively, Worthey & Ottaviani (1997) and Balogh et al. (1999). Dn4000 traces the opacity of stellar atmospheres and increases with metallicity and age. H δA peaks when A-type stars dominate the spectrum, which occurs when a short burst of star formation is followed by rapid quenching. Therefore, the combination of these features can reveal information about the star formation time-scale and evolutionary phase of a galaxy, as H δA is sensitive to recently quenched star formation while Dn4000 is sensitive to age. We utilize the best-fitting fast models to measure both quantities for both GOODS-S 43114 and GOODS-S 43683. For GOODS-S 43114, it is also possible to estimate H δA from the spectra; however, part of the Dn4000 feature is bluewards of the J-band spectrum, so we do not use the spectrum to estimate that quantity. The measurement of H δA from the model (i.e. 7.81Å) is consistent at the 1 − 2σ level with that estimated from direct integration of the J-band spectrum itself (H δA, spectrum = 8.42|$_{0.56}^{0.56}$| Å).
We adopt morphological properties and uncertainties from the F160W catalogue of van der Wel et al. (2014), in particular the half-light radius (Re), the Sérsic index (n), the axial ratio (q), and the luminosity estimated from the Sérsic fit (LSer). van der Wel et al. (2014) used a single-component Sérsic profile fit to the two-dimensional light distribution of the F160W band to estimate these properties. The associated methodology for estimating the associated uncertainties on morphological properties is described in detail in van der Wel et al. (2012).
2.4 SDSS comparison sample
In Section 3, we compare the Dn4000 and H δA values of GOODS-S 43114 and GOODS-S 43683 with those of local galaxies using archival data from SDSS Data Release 7 (DR7; Abazajian et al. 2009), specifically from the MPA-JHU DR7 release of spectrum measurements.4 We use the H δA and Dn4000 values from the catalogue where the measured continuum indices in the spectra have been corrected for sky-line contamination using the best-fitting model spectrum. We restrict the SDSS sample to a redshift range of 0.04 ≤ z ≤ 0.10. These criteria give us a final local sample of 305 005 galaxies.
3 RESULTS
3.1 Galaxy stellar populations
The galaxy properties discussed in Section 2.3 are shown in Table 1. The reported 1σ uncertainties for best-fitting galaxy properties [i.e. M*, SFR(SED), sSFR(SED), τ, t/τ, and AV] are estimated from perturbing the photometry and each wavelength element of the MOSFIRE J-band spectrum within their uncertainties and refitting 500 times. The same procedure was adopted to estimate uncertainties on properties obtained from the best-fitting SED (i.e. UVJ colours, Dn4000, and H δA). Specifically, for each random iteration, the best-fitting SEDs from the perturbed data are re-fit, and 1σ uncertainties (16th and 84th percentiles) for the parameters are estimated from the distributions of the fitted, perturbed quantities.
Column (1): Physical property of the galaxies in the sample. Column (2): Property value for GOODS-S 43114. Column (3): Property value for GOODS-S 43683. ‘N/A’ is listed for σe and log10(Mdyn) because we do not have MOSFIRE spectra for this galaxy. Additionally, ‘N/A’ is listed for the Sérsic index, axial ratio, and Re due to poor fits. As discussed, the negligible formal uncertainties in the stellar population properties reported here (i.e. M*, t, τ, SFR(SED), sSFR(SED), AV, U − V, V − J, and Dn4000) do not reflect the true systematic uncertainties in such quantities.
| GOODS-S 43114 & GOODS-S 43683 physical properties | ||
|---|---|---|
| Physical property | GOODS-S 43114 | GOODS-S 43683 |
| (1) | (2) | (3) |
| HAB | 19.843 ± 0.003 | 21.479 ± 0.011 |
| log10(M*/M⊙) | 11.64|$^{\lt +0.01}_{\lt -0.01}$| | 11.04|$^{\lt +0.01}_{\lt -0.01}$| |
| log10(t/τ) | 0.96|$^{\lt +0.01}_{\lt -0.01}$| | 0.88|$^{+0.01}_{\lt -0.01}$| |
| log10(τ/yr) | 8.00|$^{\lt +0.10}_{\lt -0.10}$| | 7.80|$^{\lt +0.10}_{\lt -0.10}$| |
| log10(SFR(SED)) (M⊙ yr−1) | 0.81|$^{\lt +0.01}_{\lt -0.01}$| | 0.97|$^{+0.01}_{-0.06}$| |
| log10(sSFR(SED)) (yr−1) | |$-10.83^{\lt +0.01}_{\lt -0.01}$| | |$-10.07^{\lt +0.01}_{-0.06}$| |
| AV | 0.46|$^{\lt +0.01}_{\lt -0.01}$| | 1.24|$^{+0.01}_{-0.02}$| |
| U − V | 1.50|$^{\lt +0.001}_{\lt -0.001}$| | 1.56|$^{+0.005}_{-0.005}$| |
| V − J | 0.82|$^{\lt +0.001}_{\lt -0.001}$| | 1.06|$^{+0.007}_{-0.001}$| |
| Dn4000 | 1.23|$^{\lt +0.001}_{\lt -0.001}$| | 1.16|$^{+0.004}_{-0.001}$| |
| H δA (Å) | 7.81|$^{\lt +0.01}_{\lt -0.01}$| | 10.17|$^{+0.06}_{-0.01}$| |
| σe (km s−1) | 166 ± 21 | N/A |
| log10(Mdyn/M⊙) | 11.16 ± 0.11 | N/A |
| Re (arcsec) | 0.366 ± 0.002 | N/A |
| Sérsic index | 5.26 ± 0.06 | N/A |
| Axis ratio | 0.865 ± 0.004 | N/A |
As discussed in Section 2.3, we obtain bootstrap uncertainties on σe by perturbing the MOSFIRE J-band spectrum within its error spectrum and randomly changing the polynomial degree of fit. The uncertainty on Mdyn was estimated by propagating the uncertainties on σe, Re, n, and LSer through equations (2) and (3). Finally, the derivation of the uncertainties for the morphological properties adopted from the van der Wel et al. (2014) catalogue (i.e. Re, n, and q) is described in van der Wel et al. (2012).
Note that many of the reported uncertainties are very small for properties estimated from the SED fitting, which results from both galaxies having both a very high number (39) of photometry points and small photometric error bars. In cases where we formally found zero uncertainty, we report upper limit in the magnitude of uncertainties based on either the smallest detected finite uncertainty for GOODS-S 43683 (e.g. U −V and V − J) or the parameter grid spacing (e.g. AV and τ). However, it is essential to note that the quoted errors do not reflect systematic uncertainties due to various assumptions inherent to SED fitting models (e.g. stellar IMF, treatment of late stages of stellar evolution, dust attenuation curve; Kriek et al. 2016). Muzzin et al. (2009) report that these systematic uncertainties are typically a few tenths of a dex, but the exact estimate varies for each measured property (e.g. M*, t, etc.).
GOODS-S 43114 is found to be more massive and less dusty with a slightly older stellar population, lower SFR(SED), sSFR(SED), H δA, larger Dn4000, and bluer UVJ colours compared to GOODS-S 43683. Note that the observed difference in sSFR(SED) can be mostly attributed to the difference in M*. According to standard classification (e.g. Cox et al. 2008), the close stellar mass ratio between GOODS-S 43114 and GOODS-S 43683 implies that this system is a ‘major merger.’ We note that van Dokkum & Brammer (2010) described the merger between GOODS-S 43114 and GOODS-S 43683 as a ‘minor merger,’ based on an approximate comparison of H-band brightnesses. However, based on both our updated comparison of H-band brightnesses and stellar masses from actual SED fits to both galaxies (indeed, van Dokkum & Brammer 2010 only modelled the stellar population of GOODS-S 43114), we find a significantly closer mass ratio between the two galaxies.
Recall from Section 2.3 that we fit a combination of the photometry and MOSFIRE spectra of GOODS-S 43114, while we only fit the photometry of GOODS-S 43683. The values presented in Table 1 do not change significantly if we fit GOODS-S 43114 using only the photometry, applying the same methodology as for GOODS-S 43683. In addition, the conclusions we derive from these results (see Section 4) are not dependent on whether we fit both the photometry and MOSFIRE spectra of GOODS-S 43114, or the photometry alone.
Based on rest-frame UVJ colours, Zick et al. (2018) group galaxies into five bins: quiescent (i), post-starburst (ii), dusty galaxies with lower sSFRs (iii), dusty star forming (iv), and non-dusty star forming (v). These bins were created based on known correlations between galaxy properties and UVJ colours. For star-forming galaxies, AV increases linearly with increasing U − V and V − J. sSFR(SED) decreases along a direction perpendicular to this AV sequence [i.e. U − V increases and V − J decreases as sSFR(SED) decreases; e.g. Yano et al. 2016]. These relationships motivate the creation of bins (iii), (iv), and (v). Once a galaxy has stopped forming stars its colours will evolve towards the quiescent box. As galaxies age away from their star-forming epochs, they move along the quiescent sequence in the UVJ diagram (i.e. increasing in U − V and V − J colour). Therefore, bins (i) and (ii) comprise an age gradient for galaxies no longer forming stars (e.g. Whitaker et al. 2012; Belli, Newman & Ellis 2019).
The left-hand panel of Fig. 4 gives the UVJ diagram with these galaxy bins from Zick et al. (2018) identified. The region occupied by quiescent galaxies following the definition from Williams et al. (2009) is also included. It can be seen that GOODS-S 43114 falls well within the post-starburst bin (i.e. bin (ii)), while GOODS-S 43683 falls at the intersection of bins (i), (ii), and (iii) – reflecting its redder V − J colour. The SFR(SED) and sSFR(SED) values in both galaxies indicate that these systems are not currently forming stars at a rapid rate relative to their past averages. In addition, the characteristic shapes of the SEDs in the right-hand panel of Fig. 1 (specifically, the steep decline in flux density bluewards of ∼4000 Å) suggests that both galaxies are in a post-starburst phase.
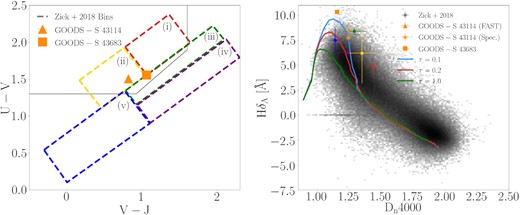
Left: UVJ diagram. GOODS-S 43114 and GOODS-S 43683 are shown by the orange triangle and square, respectively. The dashed boxes identify the five bins of galaxies from Zick et al. (2018): quiescent (red), post-starburst (yellow), dusty galaxies with lower sSFRs (green), dust star-forming (purple), and non-dusty star forming (blue). GOODS-S 43114 falls into the post-starburst bin (i.e. bin (ii)), while GOODS-S 43683 falls at the intersection of bins (i), (ii), and (iii). The black line identifies the quiescent box defined in Williams et al. (2009). Right: H δA versus Dn4000. The red, yellow, green, purple, and blue circles are colour matched to identify the five bins of galaxies shown in the UVJ diagram. The blue, red, and green lines identify three delayed-τ SFHs, where τ = 0.1, 0.2, and 1.0 Gyr, respectively. The greyscale 2D histogram indicates local SDSS galaxies. The orange star identifies the H δA value measured from the MOSFIRE J-band spectrum of GOODS-S 43114, while the orange triangle and square have the same meaning as in the left-hand panel. The Dn4000 values for both galaxies are taken from the best-fitting fast models.
Fig. 4 shows GOODS-S 43114 and GOODS-S 43683 on the H δA versus Dn4000 diagram. Also included are the five data points from Zick et al. (2018) representing stacks of galaxies in each of the five UVJ bins, and tracks of SFH with τ = 0.1, 0.2, and 1.0 Gyr. To create these tracks, we use the code python-fsps5 (Johnson et al. 2021a) that generates spectra for synthetic stellar populations using the FSPS library (Conroy & Gunn 2010). For these models, we make similar assumptions to those in our SED fitting (i.e. a Chabrier 2003 stellar IMF, a Calzetti et al. 2000 dust attenuation curve, and delayed-τ SFHs).
We find that both GOODS-S 43114 and GOODS-S 43683 fall within the uncertainties of bin (ii) on the H δA versus Dn4000 diagram. Based on the elevated H δA value found for both galaxies, it is likely that the spectra are dominated by A-type stars, which implies that star formation shut down in a time frame where the O- and B-type stars no longer exist but the A-type stars still remain. In addition, the fact that the Dn4000 feature and t/τ ratio are very similar for both galaxies indicates that both galaxies have similar stellar population ages, and therefore shut off star formation at roughly the same time.
This approximate synchronization is confirmed in Fig. 5, which shows the estimated SFHs for GOODS-S 43114 and GOODS-S 43683 obtained using the fast best-fitting SFR(SED), t, and τ values from Table 1. Also shown are the SFHs estimated using prospector6 (Johnson et al. 2021b), which utilizes ‘non-parametric’ SFHs (i.e. models that do not assume a functional form for SFR as a function of time). For the prospector modelling, we adopt the FSPS stellar library (Conroy & Gunn 2010) and assume a Chabrier (2003) IMF with a 300 M⊙ upper limit, a Calzetti et al. (2000) dust attenuation curve, and fix the metallicity to solar (0.019). We split the non-parametric SFH into eight time bins, assume constant star formation in each bin, and adopt a built-in continuity prior that weights against sharp variations in SFR between adjacent time bins (see Tacchella et al. 2022 for discussion on how non-parametric models are influenced by the choice in priors used). The first two age bins are fixed at 0–30 Myr and 30–100 Myr, with the remaining bins spaced logarithmically from 100 Myr to the age of the universe at z = 1.89. We include an additional prior placing an upper limit of 10 M⊙ yr−1 on the SFR in the earliest time bins (z > 4) and also the time bin closest to the epoch of observation, for consistency with the strong Balmer absorption observed in the J-band spectrum of GOODS-S 43114.
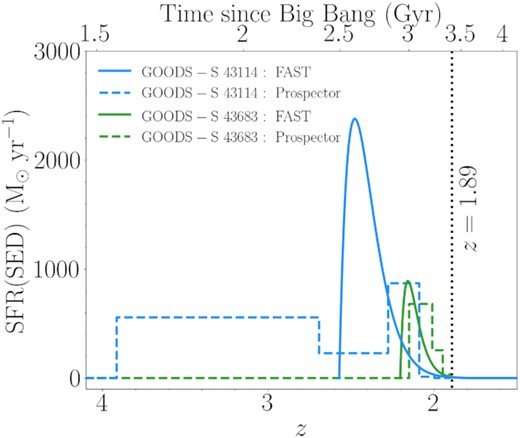
SFR(SED) versus z displaying the best-fitting SFHs assuming a delayed-τ model for GOODS-S 43114 (blue) and GOODS-S 43683 (green). The black dashed line identifies the epoch of observation (i.e. z = 1.89). The rapid burst of star formation followed by rapid quenching over the course of ∼500 Myr or less gives an approximation of when the first pericentric passage took place.
While there are differences between the inferred SFHs using fast and prospector in detail, in terms of the precise SFH shape and lookback time of peak star formation, we emphasize the qualitative similarities here. Both the fast delayed-τ and prospector non-parametric SFHs suggest that the onsets and peaks of the most recent bursts of star formation in these two galaxies are synchronized to within a few hundred Myrs of each other. There is uncertainty between the models on the exact timing of the onset and peak of the burst, as well as peak level of SFR; however, it is clear that the star-forming events in these two galaxies are linked. We note that van Dokkum & Brammer (2010) model the multiwavelength SED and rest-optical spectrum of GOODS-S 43114 using simple top-hat SFHs, also finding that star formation recently ceased and must have been significantly higher in the past. In Section 4.1, we discuss the impact of the galaxy interaction on the SFHs of GOODS-S 43114 and GOODS-S 43683.
3.2 Second velocity moment and dynamical mass of GOODS-S 43114
As discussed, the MOSFIRE J-band spectrum enables an estimate of the dynamical properties of GOODS-S 43114. Using ppxf, we find σe = 166 ± 21 km s−1. Combining equations (2) and (3) results in log10(Mdyn/M⊙) = 11.16 ± 0.11 for GOODS-S 43114. Fig. 6 shows the fit to the J-band spectrum with the residuals of the fit. The dynamical mass estimate is approximately a factor of 3 lower than the M* measurement, which raises concerns about the validity the method used to derive the dynamical mass. We discuss the discrepancy between the mass estimates in Section 4.2. Since we do not have MOSFIRE spectra of GOODS-S 43683, we cannot estimate σe and subsequently Mdyn for this galaxy.
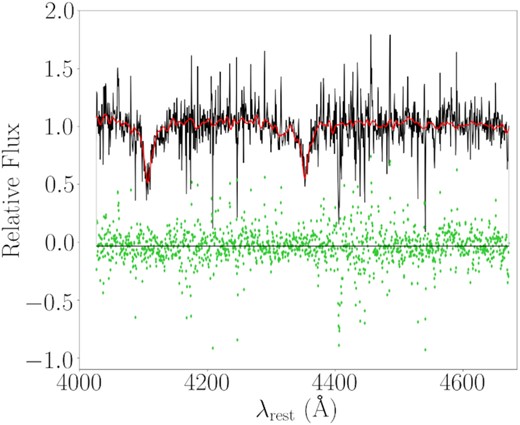
Fit to the MOSFIRE J-band spectrum of GOODS-S 43114, using ppxf to estimate σe. The MOSFIRE spectrum is shown in black while the fit is shown in red. The residuals to the fit are given as green points. The spectrum and fit are centred at a relative flux of 1, while the residuals are centred at a relative flux of 0.
4 DISCUSSION
4.1 State of the merger
Comparing observations to galaxy simulations is important for connecting isolated snapshots of galaxies with the larger evolutionary picture. Numerical simulations help improve our understanding of the both the merger process and the significance of mergers to galaxy formation (e.g. Barnes & Hernquist 1991, 1996; Di Matteo et al. 2007; Cox et al. 2008; Di Matteo et al. 2008; Moreno et al. 2015; Blumenthal & Barnes 2018). State-of-the-art galaxy formation simulations have the resolution to capture feedback-regulated star formation and multiphase structures within the interstellar medium (ISM; e.g. fire-1 and fire-2; Hopkins, Quataert & Murray 2011; Hopkins et al. 2014, 2018), and, therefore, how these galaxy processes and components will respond to a merger event. For example, recent merger modelling with fire-2 (Moreno et al. 2019) probes enhanced star formation and ISM gas content during the merger process. In this work, three key stages in a merger are identified: the first pericentric passage, the second pericentric passage, and coalescence. The time between the first and second pericentric passage is ∼2–2.5 Gyr while the time between the second pericentric passage and coalescence is ≲0.5 Gyr. In addition, Moreno et al. (2019) suggest that SFR spikes at each of these three events with a significant decrease in SFR during the large time gap between the pericentric passages. The SFR stays elevated in the short time between second pericentric passage and coalescence.
One important caveat to note is that Moreno et al. (2019) simulated mergers for local galaxies. Additionally, the masses of the galaxies in the Moreno et al. (2019) fiducial model are an order of magnitude lower than those of the galaxy pair in this study. Such differences (in addition to the detailed orbital configurations of the simulated and observed mergers) will likely result in different absolute timescales for the merger and the corresponding rise and fall in the SFRs of the merging galaxies. While the precise timescales between pericentric passages and the magnitude of the SFR spikes resulting from these events may be different for the high-mass z ∼ 2 galaxy pair investigated in this study, we assume that the basic pattern of galaxies having an elevation in SFR at each pericentric passage with a decrease in-between still applies (see also e.g. Cox et al. 2008; Hopkins et al. 2008). Therefore, we only make a qualitative comparison with the Moreno et al. (2019) fiducial model, focusing generally on the phase of the merging process in which GOODS-S 43114 and GOODS-S 43683 are observed based on their galaxy properties and recent SFHs at the epoch of observation.
For the merger analysed here, the low SFR(SED) and sSFR(SED) values of GOODS-S 43114 and GOODS-S 43683 compared to their past averages indicate that these galaxies are not observed during one of the merger phases corresponding to elevated star formation. Additionally, Fig. 5 indicates that both galaxies had much higher SFRs in the past. The tidal tail features exhibited by both galaxies suggest that this system has undergone at least one pericentric passage. Due to the depressed SFR at the date of observation, it is likely that the merger is observed between the first and second pericentric passages. Furthermore, the SFHs shown in Fig. 5 show that the recent burst of star formation began ∼0.5–1 Gyr (depending on the model) before the data of observation, suggesting that the first pericentric passage occurred around that time.
The elevated H δA values and SFHs shown in Fig. 5 for GOODS-S 43114 and GOODS-S 43683 suggest that both galaxies have recently shut off their star formation. The main sequence lifespan of O-, B-, and A-type stars are ∼0.01, ∼0.1, and ∼1 Gyr, respectively. A-type stars will dominate the stellar spectrum during their main sequence lifetime after the main sequence lifetimes of O- and B-type stars have passed. For both the fast and prospector models, the time since peak star formation is longer than the O- and B-star lifetime, corresponding to a phase when the light from A stars will contribute significantly to the rest-frame optical spectrum.
Combining all of the information gained from the SED fitting with inferences from the models indicates that these galaxies recently underwent their first pericentric passage and are moving away from each other. Detailed velocity mapping would be needed to confirm this theory, and such data currently do not exist for this merger.
As discussed earlier in this section, it is difficult to make direct comparisons with simulated mergers as a variety of parameters can alter the timescales and elevation/depression of star formation. Aside from galaxy mass and redshift, additional caveats are differences in other merger parameters relative to the Moreno et al. (2019) fiducial model. For example, different orientations and levels of gas content in the galaxies can affect the time between pericentric passages and the elevation in SFR. Fensch et al. (2017) show that mergers with 10 per cent gas fractions characteristic of z ∼ 0 galaxies undergo a larger increase in SFR compared to mergers of more gas-rich (60 per cent gas fraction) systems characteristic of z ∼ 2 galaxies. Along the same lines, Scudder et al. (2015) find an anticorrelation between SFR enhancement during the merger and the initial gas fraction. This dependence of SFR enhancement during the merger on gas content can be attributed to a correlation between ISM turbulence and central gas inflow during the merger. In the Fensch et al. (2017) models, both the local-analogue gas-poor mergers and z ∼ 2-analogue gas-rich mergers display similar peak gas inflow rates that fuel star formation. The difference in SFR enhancement between the two scenarios is therefore due to the fact that the z ∼ 2-analogue gas-rich galaxies begin the merging process with much higher gas reservoirs.
4.2 Implications of the apparent mass discrepancy
The large discrepancy between M* and Mdyn for GOODS-S 43114, in particular with Mdyn < M*, raises concerns about the accuracy of these measurements. As stated in Section 2.3, our methodology for estimating M* is robust. In Table 1, we list the M* estimated from the delayed-τ model. Note that we experimented with other parametric SFHs (constant, exponentially rising, and exponentially falling), as well as a prospector non-parametric model, and find similar M* to that inferred from the delayed-τ model (i.e. the choice of a different SFH does not resolve the tension between the inferred stellar and dynamical masses. The SED is fit assuming a realistic delayed-τ SFH and we use 39 photometry points to constrain the shape of the SED. Additionally, we not only find consistent results using non-parametric modelling with the prospector code, but also our estimate of M* agrees within uncertainties with past studies (van Dokkum & Brammer 2010).
Therefore, it is likely that the Mdyn measurement is significantly underestimated. There is a straightforward explanation for how such an underestimate can arise. The axial ratio of the galaxy obtained from the best-fitting Sérsic model is 0.865 ± 0.004. In one plausible scenario, this large axial ratio would result if GOODS-S 43114 is a roughly face-on disc. In such a geometry, the estimate of the second velocity moment (and subsequent Mdyn estimate) is biased low relative to the true value.
For a more in-depth estimate of Mdyn, we compute the dynamical mass of the galaxy by constructing a cylindrically aligned Jeans Anisotropic Model (JAMcyl; Cappellari 2008) of its Sérsic approximation. The advantage of this approach with respect to using a Sérsic-dependent virial equation is that JAM allows one to explore the effect of inclination as well as modelling the effect of the PSF and the kinematics extraction aperture. We first approximated a Sérsic profile with the index n = 5.26 given by van der Wel et al. (2014) with 30 Gaussians using the Multi-Gaussian Expansion (MGE) parametrization and the mge_fit_1d procedure7 of Cappellari (2002). Then we used the fitted MGE to compute the velocity second moment using the jam_axi_proj procedure in the Jeans Anisotropic Modelling (JAM) software package8 of Cappellari (2008). We also included a central black hole with a mass of 0.2 per cent of the total mass of the Sérsic model. This value is half of the expected value in the local Universe (Kormendy & Ho 2013) and has minimal effect on the result. We adopted a unitary mass for the Sérsic model, and assumed both that mass follows light and a typical anisotropy β = 0.2 (fig. 9 of Cappellari 2016) to compute the PSF-convolved JAM model predictions for the line-of-sight velocity second moments |$\overline{v^{2}_{\rm {los},j}}$| on a dense grid of values covering the observed rectangular aperture over which the MOSFIRE spectrum was extracted. The model is placed at the angular-size distance (DA) for the adopted standard cosmology. We then co-added these luminosity-weighted values inside the aperture as |$\overline{v^{2}_{\rm {los}}} = \Sigma _{j}I_{j}\overline{v^{2}_{\rm {los},j}}/\Sigma _{j}I_{j}$|, where Ij is the PSF-convolved galaxy surface brightness at the jth grid location.
As extreme cases, we obtained log10(MJAM/M⊙) = 11.19 ± 0.10 when assuming the galaxy has the intrinsic axial ratio qintr = 0.2 of a flat stellar disk, in which case it is seen at an inclination i = 31°, and log10(MJAM/M⊙) = 11.06 ± 0.10 when assuming the galaxy is edge-on (i = 90°) and has the same qintr = 0.87 as the observed isophotes. We obtained insignificant differences in the two extreme assumptions that the MOSFIRE slit was aligned with either the major or minor projected axis of the galaxy. As a final test, we disregard the observed axial ratio and assume as the most extreme case that the galaxy is perfectly face-on, still with qintr = 0.2 and anisotropy β = 0.2. This unrealistic scenario results in log10(MJAM/M⊙) = 11.44, still less than the measured M* from fast. Therefore, the discrepancy between M* and Mdyn cannot be resolved by simply taking into consideration the observed geometry of the galaxy. Further investigation into solving this mass inconsistency is outside the scope of this paper, but will likely need to incorporate the effect of the merger on the internal dynamics of GOODS-S 43114.
Better consistency between dynamical and stellar mass measurements has been found in other studies of high-redshift quiescent galaxies. For example, van de Sande et al. (2013) find dynamical masses ∼15 per cent larger than stellar masses for a sample of 5 massive (log10(M*/M⊙) > 11) quiescent z ∼ 2 galaxies. Additional studies of high-redshift, massive, quiescent galaxies find that M* and Mdyn are roughly consistent with each other (e.g. Belli, Newman & Ellis 2017; Tanaka et al. 2019; Esdaile et al. 2021). However, the majority of galaxies in these earlier works have structural properties consistent with a spheroidal geometry.
GOODS-S 43114 is not unique for appearing disc-like at z ∼ 2. For example, Newman et al. (2018a, b) identify four fast-rotating (v/σ ∼ 2), disc-dominated quiescent galaxies at z ∼ 2 with comparable stellar masses to those presented here (see also Toft et al. 2012, 2017). Newman et al. and Toft et al. argue that merger interactions will cause these massive galaxies evolve into the slow rotator ETGs that dominate above M* ≳ 2 × 10¹¹ M⊙ in the nearby Universe (see review by Cappellari 2016), given their already-extreme masses.
GOODS-S 43114 is undergoing a major merger interaction with GOODS-S 43683, which will likely have a significant impact on its structural properties. Its subsequent star-formation history to the present day will depend on the details of the merger interaction with GOODS-S 43683 as well as the cool gas content in both galaxies. Accordingly, both GOODS-S 43114 and GOODS-S 43683 comprise compelling targets for observations of molecular gas (e.g. CO), in order to understand the fuel available for subsequent star formation.
4.3 Constraints from far-IR and radio observations
Up until this point, the longest wavelength data analysed here has been the IRAC Channel 4 band at 8 |$\mu$|m (∼2.75 |$\mu$|m in the rest frame). In this section, we fold longer wavelength data into the discussion, specifically the 24 |$\mu$|m band from the Multiband Imaging Photometer for Spitzer (MIPS; Rieke et al. 2004) instrument on the Spitzer Space Telescope (Werner et al. 2004); the 70, 100, and 160 |$\mu$|m bands from the Photodetector Array Camera and Spectrometer (PACS; Poglitsch et al. 2010) and the 250, 350, and 500 |$\mu$|m bands from the Spectral and Photometric Imaging REceiver (SPIRE; Griffin et al. 2010) instruments on the Herschel Space Observatory; and the 1.4 GHz band from the Very Large Array (VLA; Perley et al. 2011; Miller et al. 2013; Biggs et al. 2011; Smail et al. private communication). We obtained MIPS data from Giavalisco et al. (2004), and PACS and SPIRE observations from Elbaz et al. (2011). These longer wavelength data points more directly trace the dust content of galaxies and can reveal star formation and AGN activity that is severely obscured by dust at rest-frame UV through rest-frame near-IR wavelengths. For example, Smail et al. (1999) show in a sample of z = 0.4 cluster galaxies that some galaxies previously classified as post-starbursts from rest-frame optical data alone contain radio-bright components revealing previously unaccounted-for, obscured star formation.
Long wavelength observations of the merger system in fact reveal detections at mid- and far-IR wavelengths, indicating the presence of dust emission. However, the angular resolution of MIPS, PACS, and SPIRE is not sufficient to secure spatially-distinct of GOODS-S 43114 and GOODS-S 43683 (i.e. the two galaxies are blended together). Therefore, in this analysis, we attempt to constrain the total dust-obscured SFR and AGN contribution associated with the combined 43114 + 43683 system (as opposed to estimating the dust-obscured SFR and AGN contribution in each galaxy individually). We can use this combined SFR estimate to test if both galaxies are found in a post-starburst phase, even when long-wavelength data is taken into account. The methodology adopted here avoids uncertain assumptions about the distribution of mid-IR and far-IR flux between the two galaxies. We use the code stardust (Kokorev et al. 2021) to model the observed mid- and far-IR SED of the 43114 + 43683 pair. The stardust code is ideal for this analysis, given the known AGN detections of GOODS-S 43114 and GOODS-S 43683, because stardust simultaneously accounts for the multiwavelength contributions from stars, AGN, and infrared dust emission. Furthermore, stardust does not require energy balance, thus allowing for additional star formation that is completely obscured at rest-frame UV through near-IR wavelengths (Kokorev et al. 2021). Note that we use the Mullaney et al. (2011) templates to fit the AGN component, the Draine & Li (2007), Draine et al. (2014) templates to fit the IR dust, and utilize Jin et al. (2018) for the deblending technique in the extraction of far-IR photometry.
Fig. 7 shows the mid- and far-IR SED for the 43114 + 43683 merger system, along with the best-fit multi-component stardust model. The blue-shaded region identifies the portion of the SED attributed to light from the AGN (LIR, AGN = (1.14 ± 0.02) × 1012 L⊙), while the red shaded region identifies the portion attributed to dust emission that has been heated by the stellar population (LIR, SF = (3.1 ± 0.6) × 1011 L⊙, with an associated Mdust = (2.8 ± 0.5) × 109 M⊙). The black curve represents the total AGN + dust SED. We find that the resultant SFR associated with the non-AGN portion of the IR SED is 31 ± 6 M⊙ yr−1, which is not significantly elevated compared with our fast estimate (∼16 M⊙ yr−1). We note that the inferred 1.4 GHz flux density of |$30 \pm 7\, \mu$|Jy (while not included in the stardust fitting) is entirely consistent with the best-fitting AGN + dust model fit to the combined mid- and far-IR SED following the LIR to radio correlation from Delhaize et al. (2017).
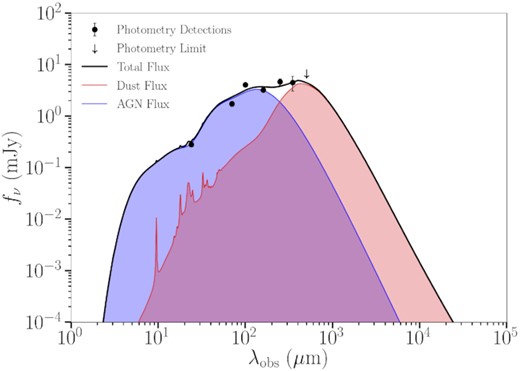
Fit to the Spitzer/MIPS 24 |$\mu$|m, Herschel/PACS 70, 100, and 160 |$\mu$|m, and Herschel/SPIRE 250, 350, and 500 |$\mu$|m far-IR flux measurements of the GOODS-S 43114 + GOODS-S 43683 merging system. The galaxy pair is unresolved at these wavelengths, so the MIPS, PACS, and SPIRE measurements represent the summed contributions from both galaxies. The SED-fitting code, stardust, is used to constrain the longer wavelength portion of the SED for the galaxy pair and estimate the AGN (blue) and dust (red) components of the total flux (black). The photometric data points and associated uncertainties are shown with black data points, except for the 500 |$\mu$|m SPIRE band which is given as an arrow because it is a limit.
The SFR estimate inferred from the fit to the long-wavelength data, while larger than that inferred from the SED at Spitzer/IRAC and shorter wavelengths, is also significantly lower than the peak SFRs inferred several hundred Myr in the past from both fast and prospector (see Fig. 5). Additionally, the higher SFR value from stardust could be due to a time lag, as the SFR estimated from long wavelengths is less responsive to recent changes in the SFR compared to the rest-optical regime. If the SFR of the system is actively decreasing, which is expected between the first and second pericentric passages (see Moreno et al. 2019), the SFR estimated from dust could easily be larger than the SFR inferred from the rest-optical regime. Therefore, we conclude that the inclusion of the mid- and far-IR data does not change the principal conclusions of this work: both galaxies still appear to be in a post-starburst phase, which is consistent with multiple pieces of evidence (i.e. strong Balmer absorption lines and SFHs fit to rest-frame UV through rest-frame near-IR SEDs) presented in this study.
As we look ahead, JWST and/or ALMA will be needed to obtain distinct observations of GOODS-S 43114 and GOODS-S 43683 (i.e. not blended together) at long wavelengths. Such data will enable more robust constraints on the dust content, AGN activity, and obscured star formation, individually, in each galaxy. We also note that van Dokkum & Brammer (2010) find evidence for faint spiral arms in the residuals of the F160W image of GOODS-S 43114, once the dominant compact core is subtracted off. The spatially resolved HST/WFC3 grism spectrum of GOODS-S 43114 may suggest a faint level of residual star formation associated with these spiral arms.
5 SUMMARY
In this study, we analyse high-quality Keck/MOSFIRE spectra and multiwavelength photometry of a merger at z = 1.89 between two galaxies that host AGN: GOODS-S 43114 and GOODS-S 43683. Stellar Balmer absorption lines (H γ and H δ) are detected in the MOSFIRE J band of GOODS-S 43114. Combining the high S/N spectra and broad-band SED-fitting with insights from realistic galaxy merger simulations enables us to obtain and study the physical properties and SFHs of both galaxies in the merger pair as well as the current phase of the merger process.
The main results are as follows:
Both merging galaxies have a close M* ratio, indicating that this is a major merger. In addition, both galaxies have recently shut off their star formation as shown by their SFR(SED) and strong Balmer absorption lines.
The depressed SFRs combined with the visible tidal tails imply that the galaxies have undergone their first pericentric passage. Modelling the SFHs suggests that the pericentric passage most likely happened ∼0.5–1 Gyr ago (approximately around the time of peak star formation of the system).
GOODS-S 43114 has a low inclination indicating that it is roughly a face-on disc based on its morphology and smaller than expected second velocity moment estimate. More robust modelling that takes into account the inclination and geometry of a face-on disc does not resolve the discrepancy between the dynamical and stellar masses. More work is needed to address this mass inconsistency. Galaxies that are massive (log10(M*/M⊙) > 11), disc-shaped, rotating, and quiescent at z ∼ 2 are likely the progenitors of the most massive, spheroidal and slow-rotating elliptical galaxies present in the local universe. However, they must undergo significant structural evolution over the intervening ∼10 Gyr.
Fitting the spatially unresolved mid- and far-IR SED of the combined GOODS-S 43114 and GOODS-S 43683 system yields consistent conclusions to those obtained by fitting the rest-frame UV through near-IR data of the individual merging galaxies. Specifically, we still find that the GOODS-S 43114 and GOODS-S 43683 system is in a post-starburst phase with ongoing AGN activity, and significantly lower star formation at the epoch of observation compared to the past peak. One limitation of the longer wavelength data is that the 2 arcsec separation between GOODS-S 43114 and GOODS-S 43683 is smaller than the angular resolution of Spitzer/MIPS, and Herschel/PACS and SPIRE. JWST and/or ALMA observations are needed to study these galaxies in this long-wavelength regime individually.
Understanding the rapid onset and shut-down of star formation during mergers, especially at z ∼ 2 (i.e. the peak epoch of star formation), is important for furthering our knowledge of how mergers affect the galactic baryon cycle. Comprehensive studies of individual mergers like the GOODS-S 43114/GOODS-S 43683 system can help further constrain simulations leading to a more accurate galaxy evolution models. For the merger pair analyzed in this work, space-based observations with the James Webb Space Telescope will enable us to observe the full range of rest-optical emission-lines (e.g. H α, H β, [O iii]λλ4960,5008, and [O ii]λλ3727,3730) that are currently hidden outside the windows of atmospheric transmission. Measurement of these emission-lines will greatly increase our knowledge of the merger, as they contain a wealth of information on AGN activity and gas outflows, as well as the physical properties of the ionized ISM.
ACKNOWLEDGEMENTS
This study is based on data obtained at the W.M. Keck Observatory, which is operated as a scientific partnership among the California Institute of Technology, the University of California, and the National Aeronautics and Space Administration, and was made possible by the generous financial support of the W.M. Keck Foundation. We acknowledge support from NSF AAG grants AST1312780, 1312547, 1312764, 1313171, 2009313, 2009085, 2009278, grant AR-13907 from the Space Telescope Science Institute, and grant NNX16AF54G from the NASA ADAP programme. We also acknowledge a NASA contract supporting the ‘WFIRST Extragalactic Potential Observations (EXPO) Science Investigation Team’ (15-WFIRST15-0004), administered by GSFC. Support for this work was also provided through the NASA Hubble Fellowship grant #HST-HF2-51469.001-A awarded by the Space Telescope Science Institute, which is operated by the Association of Universities for Research in Astronomy, Incorporated, under NASA contract NAS5-26555. We thank the 3D-HST collaboration, who provided spectroscopic and photometric catalogues used to select MOSDEF targets and to derive stellar population parameters. We acknowledge useful conversations with Ian Smail that benefited this work. This research made use of astropy,9 a community-developed core python package for Astronomy (Astropy Collaboration 2013, 2018). Finally, we wish to extend special thanks to those of Hawaiian ancestry on whose sacred mountain we are privileged to be guests.
DATA AVAILABILITY
The data underlying this article will be shared on reasonable request to the corresponding author.
Facilities: Keck/MOSFIRE, SDSS
Software: astropy (Astropy Collaboration 2013, 2018), eazy (Brammer et al. 2008), fast (Kriek et al. 2009), ipython (Perez & Granger 2007), jampy (Cappellari 2008), matplotlib (Hunter 2007), mgefit (Cappellari 2002), numpy (van der Walt, Colbert & Varoquaux 2011; Harris et al. 2020), pandas (Wes McKinney 2010; The pandas development team 2020), ppxf (Cappellari & Emsellem 2004; Cappellari 2017), prospector (Johnson et al. 2021b), python-fsps (Johnson et al. 2021a), scipy (Oliphant 2007; Millman & Aivazis 2011; Virtanen et al. 2020), starburst (Kokorev et al. 2021)
Footnotes
We used v5.0 of the MgeFit python package from https://pypi.org/project/mgefit/.
We used v6.3 of the JamPy python package from https://pypi.org/project/jampy/.
REFERENCES
Author notes
Hubble Fellow
