-
PDF
- Split View
-
Views
-
Cite
Cite
Chengdong Li, James Binney, Our Galaxy’s youngest disc, Monthly Notices of the Royal Astronomical Society, Volume 516, Issue 3, November 2022, Pages 3454–3469, https://doi.org/10.1093/mnras/stac1788
Close - Share Icon Share
ABSTRACT
We investigate the structure of our Galaxy’s young stellar disc by fitting the distribution functions (DFs) of a new family to 5D Gaia data for a sample of |$47\, 000$| OB stars. Tests of the fitting procedure show that the young disc’s DF would be strongly constrained by Gaia data if the distribution of Galactic dust were accurately known. The DF that best fits the real data accurately predicts the kinematics of stars at their observed locations, but it predicts the spatial distribution of stars poorly, almost certainly on account of errors in the best-available dust map. We argue that dust models could be greatly improved by modifying the dust model until the spatial distribution of stars predicted by a DF agreed with the data. The surface density of OB stars is predicted to peak at |$R\simeq 5.5\, \mathrm{kpc}$|, slightly outside the reported peak in the surface density of molecular gas; we suggest that the latter radius may have been underestimated through the use of poor kinematic distances. The velocity distributions predicted by the best-fitting DF for stars with measured line-of-sight velocities v∥ reveal that the outer disc is disturbed at the level of |$10\, \mathrm{km\, s}^{-1}$| in agreement with earlier studies, and that the measured values of v∥ have significant contributions from the orbital velocities of binaries. Hence the outer disc is colder than it is sometimes reported to be.
1 INTRODUCTION
Over the last two decades our Galaxy has been the target of intense observational activity not only on account of its interest as our home but also because of its cosmological significance: it is a uniquely accessible example of the type of galaxy that currently dominates the cosmic star-formation rate. Data from massive photometric (Schmidt et al. 2005; Skrutskie et al. 2006; Kaiser et al. 2010) spectroscopic (Steinmetz et al. 2006; De Silva et al. 2015; Majewski et al. 2017) and astrometric (Gaia Collaboration 2016) surveys are now in hand and we need to synthesize these data into a coherent physical picture of our archetypal Galaxy.
The stellar distribution of our Galaxy is dominated by the disc. Over the last half century, it has become conventional to decompose the disc into several components. On the largest scale, Gilmore & Reid (1983) pointed out that the disc is split into thin and thick components. More recently, in light of spectroscopic data rather than star-counts, the view is gaining ground that the fundamental division is between a disc of very old stars with [α/Fe] larger than the Sun and a continuously forming disc of stars with ‘normal’ values of [α/Fe] (Hayden et al. 2015; Bland-Hawthorn et al. 2019). The former, very old disc has a scale height |$z_0\gt 0.7\, \mathrm{kpc}$| at all radii, while the latter disc has a much smaller |$(\sim 0.3\, \mathrm{kpc}$|) scale height, except possibly beyond the solar radius R0, where it probably flares. The thin, or ‘α-normal’ disc is naturally divided into sub-discs comprising stars of similar ages because the α-normal disc has formed continuously over |$8-10\, \mathrm{Gyr}$| and older stellar cohorts now have larger random velocities and vertical scale heights. It is also thought that older cohorts have smaller radial scale lengths.
Recently (Li & Binney 2022), we investigated the structure of our Galaxy’s stellar halo by modelling the distribution of stars identified as RR-Lyrae variables in data from the Pan-STARRS survey (Kaiser et al. 2010). In that paper, we developed a technique for modelling a Galactic component using the 5D data for stars that is available in enormous quantities from the Gaia mission (Gaia Collaboration 2021, and references therein). In this paper, we apply this technique to objects that are likely OB stars, which may be considered tracers of the youngest cohort in the disc. The structure of this component is intrinsically of great interest, but modelling it forces one to engage with problems that do not arise when modelling the RR-Lyrae population.
We model a component by fitting to the data a parametrized distribution function (DF) f(J) that is a function of the action integrals within a given model of the Galaxy’s gravitational potential. This potential itself emerges from fitting DFs for several components, both stellar and dark, to 6D Gaia data (Binney & Vasiliev 2022, hereafter BV2022). The potential is that co-operatively generated by the DFs of dark matter and all the major stellar components together with a gas disc of pre-determined structure. The models are constructed and analysed using the agama software library (Vasiliev 2019).
When we lack data for one of the six phase-space coordinates, as we do for nearly all the ∼1.3 billion stars monitored by Gaia, fitting a DF to data is more computationally demanding because one has marginalize over the unknown line-of-sight velocity v∥ of each star. Against this significant disadvantage may be set two substantial advantages: (i) in the Early Third Data Release (EDR3) from Gaia (Gaia Collaboration 2021) contains ∼1.3 × 10⁹ stars whereas Gaia’s Radial Velocity Sample RVS (Gaia Collaboration 2018) contains only ∼7 × 10⁶ stars, and (ii) while the selection function (SF) relevant to 5D data is complex, it is much better known than that of the RVS (Boubert et al. 2021; Everall et al. 2021). Hence, when using 5D data significance can be attached to the density of stars in real space in a way that is not possible when using 6D data: in that case only densities in velocity space are significant.
The Galaxy’s young stellar disc is perhaps the hardest component to observe because it is largely confined to a thin layer around the Galactic plane and is therefore heavily obscured, even fairly close to the Sun. We will find that our limited knowledge of the distribution of dust through the disc severely limits our ability to determine the structure of the young disc.
This paper is structured as follows. Section 2 explains how we extracted a sample of OB stars from Gaia EDR3. In Section 3, we outline the approach to modelling 5D data that was explained in Li & Binney (2022); Appendix A gives greater detail. Section 4 specifies the structure of the DF f(J) that we fit to our tracers of the young disc. Section 5.1 outlines the self-consistent Galaxy model and the dust model in which we place models of the young disc. In Section 6, we use mock data to discover how accurately we can determine the structure of the young disc from a sample of OB stars. In Section 7 we fit DFs to our sample of OB stars and conclude that the limited spatial extent of the sample, combined with defects in dust models, severely limit our ability to determine the large-scale structure of the young disc. In Section 7.1, we investigate how well the best-fitting models account for the data. We find that while the models reproduce the observed kinematics well, defects of the dust models prevent the DFs reproducing the distribution of stars on the sky. In Section 7.2, we compare the predictions of our models to 6D data from the LAMOST spectroscopic survey. We confirm the conclusion of Eilers et al. (2020) that stars at |$R\sim 12\, \mathrm{kpc}$| in the anticentre direction are moving systematically outwards as a consequence of large-scale disturbance of the disc. We argue that the orbital velocities of binaries make a significant contribution to the measured line-of-sight velocities of OB stars, which is why several studies have found a puzzling increase with Galactocentric radius in the in-plane velocity dispersion of young stars. Section 8 sums up and identifies useful next steps.
2 A SAMPLE OF OB STARS
We selected OB stars from the intersection of three catalogues: Gaia’s (Gaia Collaboration 2016) early third data release (Gaia Collaboration 2021), the 2MASS infrared catalogue (Skrutskie et al. 2006), and the Starhorse catalogue (Anders et al. 2019, 2021),1 which provides Bayesian fits of distances and astrophysical parameters to all stars in EDR3 brighter than G = 18.5. EDR3, which was released in December of 2020, contains precision astrometry and photometry for 1.5 billion stars. Parallaxes and proper motions have typical uncertainties of |$0.07\,$|mas and |$0.07\,$|mas|$\, {\rm yr}^{-1}$| at |$G = 17\,$|mag and |$0.5\,$|mas and |$0.5\,$|mas|$\, {\rm yr}^{-1}$| at |$G = 20\,$| mag (Gaia Collaboration 2021). EDR3 gives magnitudes in red and blue passbands Grp and Gbp in addition to the broad-band G magnitudes.
Finally, we exclude stars lying within |$3\, \mathrm{kpc}$| of the Galactic centre to avoid the barred region of the Galaxy. However, on account of the high extinction towards the centre and the density profile of the young disc, few stars are picked even in the range |$R\in (3,5)\, \mathrm{kpc}$|. The final catalogue of OB stars comprises |$46\, 916$| stars. They all have apparent magnitudes brighter than G = 16.65. Fig. 1 shows their spatial distribution.
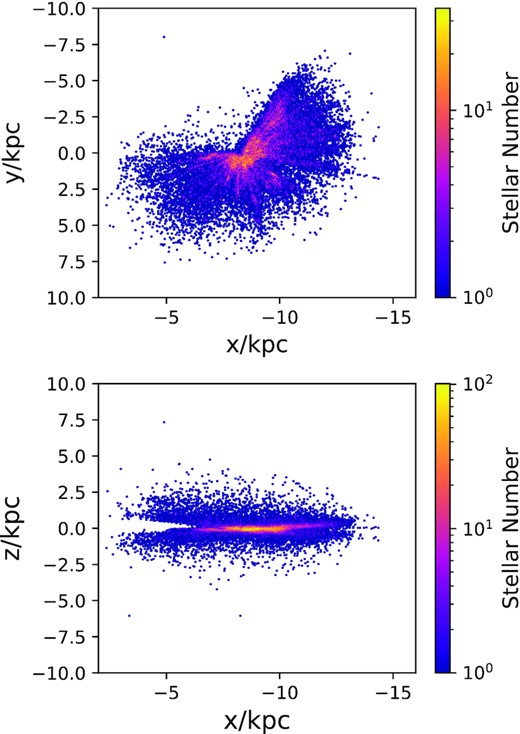
The spatial distribution of our sample of OB stars projected on to the xy plane (upper panel) and xz plane (lower panel).
2.1 Selecting OB stars from a model
Up to an overall normalization, the DF of the OB stars will differ negligibly from the DF of the young disc. So the sampling algorithm built into agama can be used to pick a sample of OB stars distributed throughout the Galaxy. Absolute magnitudes are assigned to these stars by sampling the luminosity function of OB stars, and using their locations x and a dust model, we compute their apparent magnitudes G. The red curve in Fig. 2 shows the G-band luminosity function that we have used. It was obtained from the PARSEC stellar evolutionary tracks (Bressan et al. 2012),2 which yield the number of stars expected in a given range of absolute magnitudes per unit mass of a population with a given star-formation history. We assumed a constant star-formation rate over the last Gyr. Using this procedure we obtained luminosity functions for the Grp, Gbp, J, H, and Ks bands in addition to the G band.
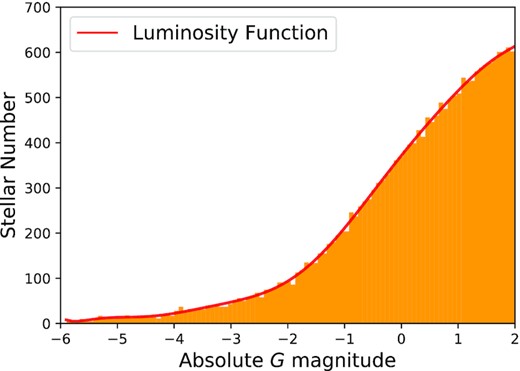
The G-band luminosity function for OB stars extracted from the PARSEC stellar evolutionary tracks.
3 FORMALISM
Our approach to model fitting is that developed in McMillan & Binney (2012, 2013) and implemented in the case of 5D data by Li & Binney (2022). It is based on an algorithm for determining the likelihood of data given a gravitational potential Φ(x) a DF f(J) and a selection function S(x, M) that gives the probability that a star with absolute magnitude M located at x will enter the catalogue that is being modelled. The likelihoods are used to drive a Markov-chain Monte Carlo (MCMC) exploration of the parameter space of DFs. Two aspects of the present problem require additions to the formulae in Li & Binney (2022): (i) whereas RR-Lyrae stars can be assumed to have a unique absolute magnitude, the absolute magnitudes of our OB stars span a non-negligible range (M−, M+), and (ii) each star has an extinction A derived from its location x. Appendix A derives the additional formulae.
4 DISTRIBUTION FUNCTION
We refer readers to BV2022 for more information on the physical significance of the DF’s parameters. Those that are of concern here are pr, pz, Jr0, Jz0, Jϕ0, Jtaper, and Jtrans. We fix |$J_{\rm v0}=10\, \mathrm{kpc}\, \mathrm{km\, s}^{-1}$| and |$J_{\rm d0}=20\, \mathrm{kpc}\, \mathrm{km\, s}^{-1}$|.
5 POTENTIAL AND DUST MODELS
Given a DF of the form f(J), any observable can be predicted once the Galaxy’s gravitational potential and its distribution of absorbing dust are specified.
5.1 The gravitational potential
The upper panel in Fig. 3 shows the circular speed of the gravitational potential that we have used. The blue dashed line represents all the spheroidal components including dark halo, bulge, and stellar halo. The black dotted line denotes the disc components. This potential was obtained by relaxing to self-consistency an axisymmetric model Galaxy that is defined by distribution functions for dark matter, a bulge, a stellar halo, four superposed stellar discs, and a gas disc. Table 1 lists key characteristics of this model. Further information for the parameters generating this model can be found in the online supplementary material. The lower panel in Fig. 3 shows the vertical density distributions of the components at the solar radius. The dot, dashed, and dash-dotted grey lines represent young, middle-age, and old components of the thin disc, respectively. The solid grey line shows the complete thin disc. The red and magenta lines denote thick disc and stellar halo, respectively. The dark magenta line shows the vertical density of the dark halo.
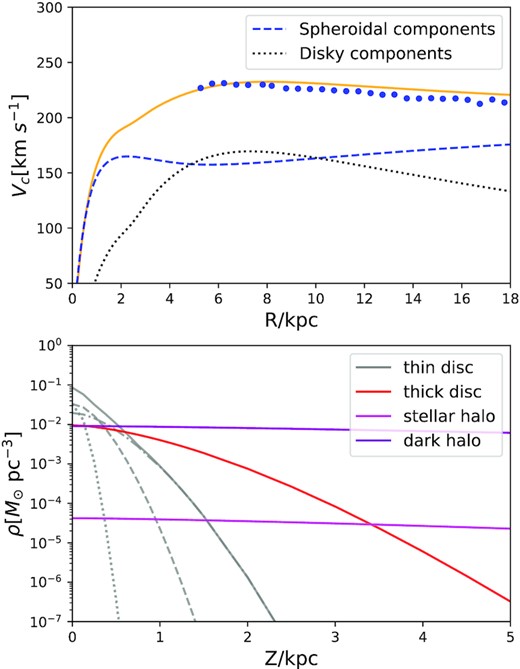
The upper panel shows the circular speed vc of the potential we use. The blue dots are observational estimates obtained by Eilers et al. (2019) from red giant stars. The lower panel shows the vertical density distributions at the solar radius for the components.
| Mdisc | 5.48 × 10¹⁰ M⊙ |
| ρ(R0, z = 0) | 0.095 M⊙pc−3 |
| ρ(R0, z = 1) | 0.005 M⊙pc−3 |
| Mdisc | 5.48 × 10¹⁰ M⊙ |
| ρ(R0, z = 0) | 0.095 M⊙pc−3 |
| ρ(R0, z = 1) | 0.005 M⊙pc−3 |
| Mdisc | 5.48 × 10¹⁰ M⊙ |
| ρ(R0, z = 0) | 0.095 M⊙pc−3 |
| ρ(R0, z = 1) | 0.005 M⊙pc−3 |
| Mdisc | 5.48 × 10¹⁰ M⊙ |
| ρ(R0, z = 0) | 0.095 M⊙pc−3 |
| ρ(R0, z = 1) | 0.005 M⊙pc−3 |
5.2 Observational dust model
Several groups have recently developed models of the Galactic distribution of dust (Sale & Magorrian 2014; Lenz, Hensley & Doré 2017; Green 2018; Green et al. 2019). The green curves in Figs 4 and 5 show extinction as a function of distance along eight lines of sight according to the Bayestar2019 model from the most recent of these studies. The left-hand panel of Fig. 4 shows the line of sight (ℓ = 0, b = 10) towards the Galactic centre and that (ℓ = 180, b = 10) towards the anticentre, while the right-hand panel shows the lines of sight vertically downwards and upwards. The upper panels of Fig. 5 are for lines of sight at |$45\,$|deg to the centre and anticentre directions while the bottom left-hand panel is for the direction that in an axisymmetric Galaxy would be equivalent to that of the middle right-hand panel. Actually, the asymptotic extinction is about six times larger at |$\ell =135\,$|deg than at |$\ell =225\,$|deg. In each panel, the cyan line shows the extinction towards extra-Galactic objects from Schlegel et al. (1998). Ideally, each green curve would asymptote at large distances to its cyan line. Unfortunately, the reality falls well short of this ideal with the value from Green et al. (2019) systematically smaller than that from Schlegel et al. (1998).
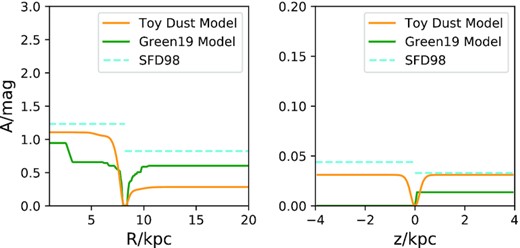
Estimates of extinction versus distance (i) in the centre and anticentre directions at |$b=10\,$| deg (left-hand panel) and vertically up or down (right-hand panel). The green and orange lines are from the Bayestar2019 (Green et al. 2019) and toy models, respectively. The dotted cyan lines show the asymptotic values from Schlegel, Finkbeiner & Davis (1998).
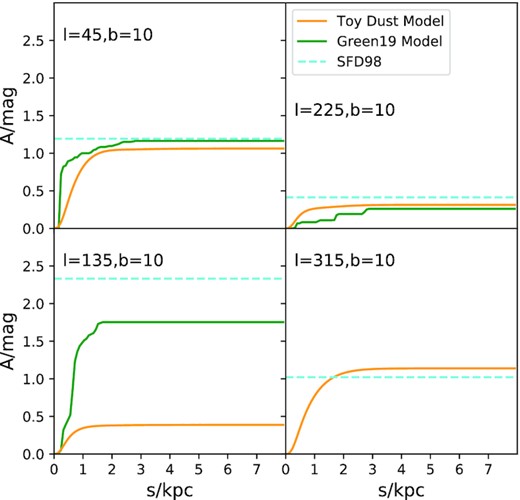
As Fig. 4 for lines of sight at |$b=10\,$| deg and various longitudes.
5.3 Toy dust model
The extinction is then the integral |$A=\int {\rm d}s\, \rho (R,z,\phi)$| of ρ(R, z, ϕ) along the line of sight and we use this extinction to assign apparent magnitudes to mock stars proposed by agama. When analysing the resulting mock catalogue, we use the dust model from Green et al. (2019), which is in this case inaccurate.
The orange curves in Figs 4 and 5 show an example of extinctions from this model alongside the empirical extinctions from Green et al. (2019) and Schlegel et al. (1998). The most serious defect of the toy model is a failure to generate radically different extinctions at the longitudes |$\ell =180\pm 45\,$| deg. This failure is attributable to its spherical local bubble rather than a cavity that is bounded by a very lumpy wall (Zucker et al. 2022). However, even a simplistic toy model of the dust enables us to probe the consequences of fitting data using a defective dust model.
6 TESTS
We generated ten mock catalogues as described in Section 2.1. The parameters used to generate these catalogues are given in the top row of Table 2. Then the computer explored the likelihood in the 7D parameter space with coordinates (Jr0, Jz0, ln Jϕ0, pr, pz, ln Jtapper, ln Jtrans). Thus we were holding fixed the parameters Jd0 and Jv0 that only affect a model in the region interior to all the data. In some runs these two parameters took the values used to generate the mock data, while in other runs they were fixed at values that differed from those that generated the data. These tests showed insensitivity of results to the values of these two parameters.
Summary of test results. Actions are given in |$\, \mathrm{kpc}\, \mathrm{km\, s}^{-1}$|.
| Parameters . | Jr0 . | Jz0 . | ln Jϕ0 . | pr . | pz . | ln Jtaper . | ln Jtrans . |
|---|---|---|---|---|---|---|---|
| Input values | 20 | 5 | 6.91 | 0.35 | 0.35 | 6.91 | 4.50 |
| Single catalogue | |$20.21^{+0.65}_{-0.66}$| | |$4.97^{+0.09}_{-0.09}$| | |$6.89^{+0.02}_{-0.01}$| | |$0.27^{+0.05}_{-0.05}$| | |$0.30^{+0.02}_{-0.03}$| | |$6.90^{+0.01}_{-0.01}$| | |$4.53^{+0.10}_{-0.12}$| |
| Mean of 10 catalogues | 19.07 ± 0.88 | 5.01 ± 0.10 | 6.91 ± 0.01 | 0.31 ± 0.06 | 0.33 ± 0.03 | 6.90 ± 0.01 | 4.42 ± 0.09 |
| Wrong dust model | |$16.87^{+1.15}_{-1.82}$| | |$4.18^{+0.13}_{-0.12}$| | |$6.76^{+0.03}_{-0.03}$| | |$0.48^{+0.14}_{-0.05}$| | |$0.39^{+0.04}_{-0.04}$| | |$7.01^{+0.02}_{-0.02}$| | |$5.11^{+0.12}_{-0.19}$| |
The SLSQP method in the scipy (Virtanen et al. 2020) package was first used to find the maximum of the likelihood and then the emcee package (Foreman-Mackey et al. 2013) was used to run a Markov Chain Monte Carlo exploration starting from the maximum likelihood. We used 35 walkers for each parameter over a total of 500 steps with the first 100 steps treated as burn-in.4 Fig. 6 shows a typical set of projections of the posterior probability distribution. The blue lines in each panel indicate the true parameter values while the dashed lines in the histograms show the 1-σ uncertainties from the 16th and 84th percentiles. The second row of Table 2 lists these uncertainties of the posterior distribution yielded by one catalogue, while the table’s third row gives the means and standard deviations of the means of the ten posterior distributions. The standard deviations are close to the 1-σ uncertainties from individual posterior distributions, but in most cases are slightly larger, as would be expected if the distributions had longer tails than a Gaussian.
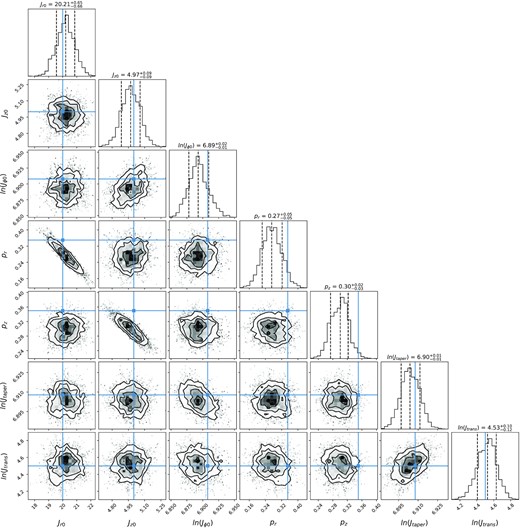
Only pr and pz have true values that lie outside the 1-σ range inferred from a single catalogue and even these true values lie within the 1-σ ranges inferred from ten catalogues. Thus the MCMC runs are delivering consistent results. Moreover, the precision with which parameters can be recovered is impressive – the uncertainty of the actions other than Jr0 is |$\lesssim 2$| per cent, while that of Jr0 is better than 4 per cent.
6.1 Correlations between parameters
Fig. 6 shows just two significant correlations between parameters, namely between Jr0 and pr and between Jz0 and pz. Jr0 sets the magnitude of the radial velocity dispersion σR, while pr sets the radial gradient of σR. Jz0 and pz similarly set the magnitude and radial gradient of σz. In the upper panel of Fig. 7 we plot σR versus R for three DFs. Also plotted as a chained black line is the radial density of mock stars in the catalogue. We see that very similar values of σR are obtained within the well sampled radial range using values of pr that range from 0 up to 0.6 by compensating for the change in pr by a change in Jr0. Interior to the well sampled range the three models predict very different values for σR, so they could be distinguished if the catalogue contained a significant number of stars at |$R\lt 3\, \mathrm{kpc}$|. The lower panel of Fig. 7 makes the same point in the context of σz. Hence the strong degeneracies evident in Fig. 6 reflect the lack of stars at |$R\lesssim 3\, \mathrm{kpc}$|.
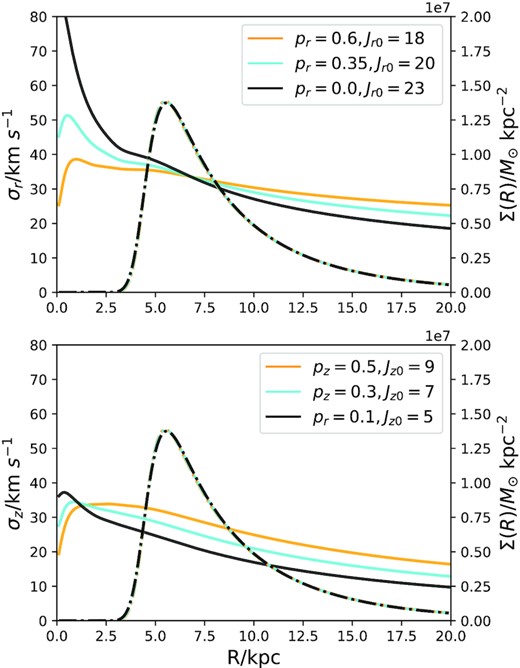
Full lines: the radial and vertical velocity dispersions σR and σz as functions of radius R in the Galactic plane for several models. Broken lines: the surface density Σ(R) of OB stars – the densities of all models considered are indistinguishable.
The uncertainties in Jz0 and pz are smaller than those in Jr0 and pr because the greatest differences in R are achieved towards the anticentre, where vR dominates v∥, which is not in the catalogue, while vz dominates vb, which is in the catalogue.
6.2 Impact of the dust model
Now we explore how using an incorrect dust model affects the posterior distribution of Jϕ0 and Jtaper. Fig. B1 shows the posterior probabilities obtained when a mock catalogue created using the toy dust model of Section 5.3 is analysed using the dust model of Green et al. (2019). The bottom row of Table 2 lists the corresponding statistics.
The formal uncertainties on the parameters, ln Jϕ0, ln Jtaper, and ln Jtrans that determine the stellar surface density increase only moderately but the true value of ln Jϕ0 now lies 0.12 above its 1-σ range, while the true values of ln Jtaper and ln Jtrans now lie 0.08 and 0.42 below their 1-σ ranges. The lower left-hand panel of Fig. 5 shows that around |$\ell =135\,$|deg, the toy model predicts much lower extinction than the Green et al. (2019) model. Low extinction enhances the number of mock stars, and to account for these stars in the presence of the larger observed extinction, the disc must be imagined more extended than it is. Hence, the recovered value of Jϕ0 should be larger than the true value. That this is not the case must be attributed to the unrealistically large values of Jtaper and Jtrans: increasing Jtaper pushes outwards the flat part of the surface density, and increasing Jtrans extends the flat section.
The formal uncertainties on Jr0,Jz0, pr, and pz all increase significantly and the true values of both Jr0 and Jz0 now lie above their 1-σ ranges, while the true values of pr and pz still lie within their 1-σ ranges.
This experiment strongly suggests (i) that the formal uncertainties on the recovered parameters of the DF materially underestimate the true uncertainties because the latter are dominated by the uncertain distribution of dust, and (ii) that degeneracies between the parameters make it hard to predict how recovered parameters will be affected by a change in the dust model.
7 FITS TO GAIA DATA
When the code was used for an MCMC search of fits to the real data, the chain showed a long-term drift towards larger Jr0 and smaller Jϕ0. In light of this drift, the MCMC chain was extended to 1500 steps, three times the number of steps used for the mock data, but without convincing evidence emerging that the chain’s long-term drift had ceased. As discussed below, we think this poor performance of the code on real data is a consequence of our use of an erroneous dust model. On account of the latter, no DF gives a convincing fit to all the data. Different DFs fit different parts of the data and the code wanders from one unsatisfactory DF to another without finding a convincing maximum in the data’s likelihood.
Here we present results from a near-converged section of ∼300 steps. These results illustrate the quality of fit to the data that can be achieved with the present dust model, and provide an indication of the parameter choices that might be found when a satisfactory dust model becomes available. Fig. 8 shows posterior distributions from the chosen section of the chain, while Table 3 gives the means and 1-σ uncertainties of these distributions. It should be borne in mind that the true uncertainties will be significantly larger than those quoted here on account of the premature truncation of the MCMC chain.

Statistics of the probability distributions from fits to Gaia OB stars. Jd0 and Jv0 are kept fixed at |$20\, \mathrm{km\, s}^{-1}$| and |$10\, \mathrm{km\, s}^{-1}$|, respectively.
| Parameters . | Jr0 . | Jz0 . | ln Jϕ0 . | pr . | pz . | ln Jtaper . | ln Jtrans . | Jd0 . | Jv0 . |
|---|---|---|---|---|---|---|---|---|---|
| Fitted result | |$47.09^{+0.77}_{-0.87}$| | |$5.90^{+0.03}_{-0.03}$| | |$6.77^{+0.01}_{-0.01}$| | |$-1.48^{+0.02}_{-0.02}$| | |$-1.40^{+0.03}_{-0.02}$| | |$7.05^{+0.03}_{-0.01}$| | |$6.74^{+0.02}_{-0.01}$| | 20 | 10 |
In Fig. 8, the histograms are less Gaussian than the corresponding histograms in Fig. 6, and in the off-diagonal panels the regions of high likelihood are typically much more elongated than the corresponding regions. We attribute both phenomena to the failure of the chain to converge on account of the poor dust model.
7.1 Fit quality
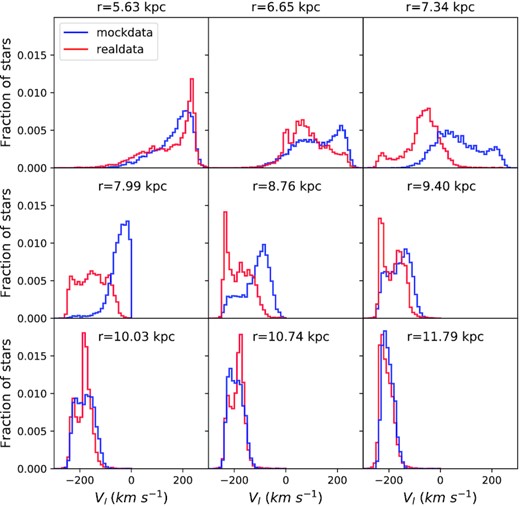
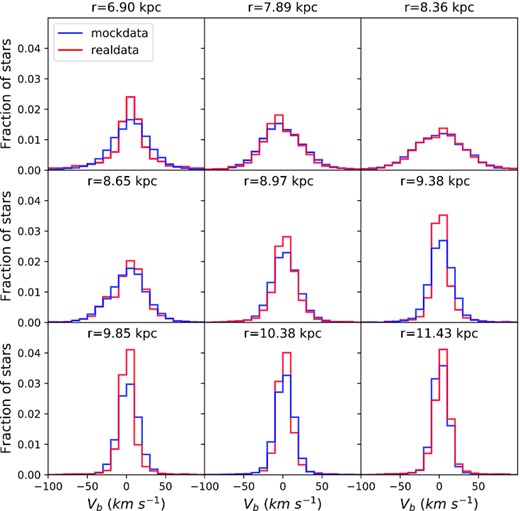
A natural first question is whether the models with the largest recovered likelihoods give an acceptable account of the data. Figs 9 and 10 are histograms of velocity in the b and ℓ directions, respectively for stars binned by radius. The red histograms are for real stars and the blue histograms are for a sample of mock stars drawn from the model that gives the real data the highest likelihood. While the red and blue histograms agree moderately well in Fig. 9 for vb, they are disturbingly different in Fig. 10 for vℓ. Figs 11 and 12 shed light on these differences by showing analogous histograms when we use the same model to choose a velocity for each real star. Now the real and mock distributions agree at least as well in vℓ as in vb. Evidently, the clash in Fig. 10 arises because the real and mock stars have systematically different locations; at a given place, the model predicts velocities accurately, but it makes poor choices for the locations of stars.
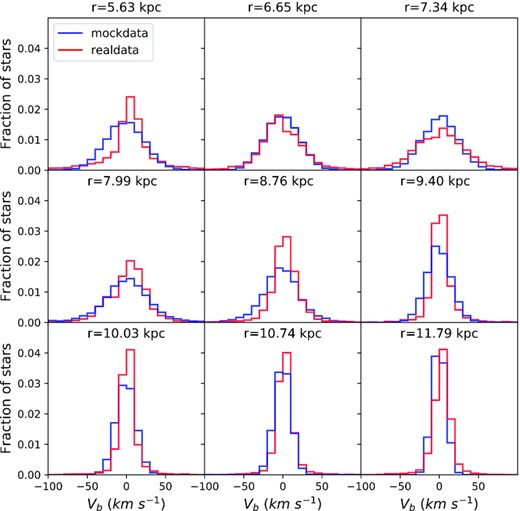
Histograms of vb for real data (red) and for mock stars drawn from the best-fitting model. For each bin we give the median R value of the mock stars.
As Fig. 9 except that the blue histogram is computed from velocities assigned by sampling the best-fitting model at the locations of real rather than mock stars.
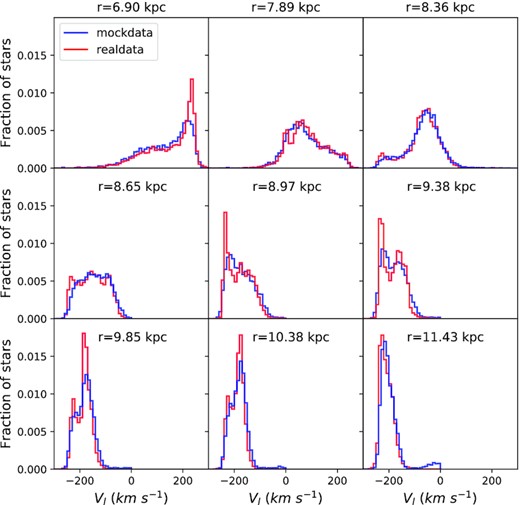
Fig. 13 drives this point home by showing the real and mock distributions of stars in the Galactocentric angle ϕ. In general, the real distribution is narrower and shifted to larger ϕ than the mock distribution. Since differential rotation of the disc makes vℓ a strong function of ϕ, different distributions in ϕ inevitably leads to a different distributions in vℓ.
The prime suspect for causing these differences in the distribution of ϕ between real and mock stars must be the dust model. Indeed, our axisymmetric DF has very little capacity to modify the distribution in ϕ. Figs 4 and 5 by contrast demonstrate that dust violently breaks the symmetry in ϕ. If the dust model breaks this symmetry incorrectly, the mock stars will not reproduce the observed bias in ϕ, and the predicted values of vℓ will be wrongly distributed.
Of course dust also has a strong influence on the radial distribution of catalogued stars. The red and blue histograms in Fig. 14 show the real and mock distributions in R. The mock distribution is broader than the real one because it extends to smaller radii. This finding suggests that the extinctions provided by the dust model tend to be too small in directions towards the Galactic Centre.
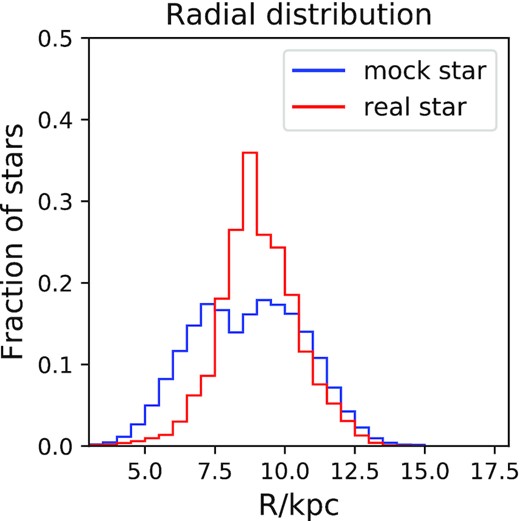
The distribution in R of the real stars (red) and mock stars (blue) drawn from the best-fitting model.
Changing the radial distribution of OB stars is very much within the scope of the DF, so it is perhaps puzzling that the best-fitting model does not reproduce the observed distribution in R better. The answer may be that when the DF changes the radial distribution of stars, for example by changing the value of Jtaper, it will also change the kinematics. So the need to fit the observed kinematics can push the DF to predict (correctly) an abundance of stars at small radii that do not feature in the data, but do in a mock catalogue drawn using extinctions that are too small.
The curve Fig. 15 shows the surface density of the best-fitting model. The density peaks at |$R\sim 5.5\, \mathrm{kpc}$|, which is now thought to be close to the bar’s corotation radius (Pérez-Villegas et al. 2017; Binney 2020; Chiba, Friske & Schönrich 2021). The density drops faster from the peak inwards than outwards. The blue dots in Fig. 15 show the surface density of the young disc estimated by Xiang et al. (2018) using a catalogue from the LAMOST survey. They found a significant peak at the solar radius which they suggests reflects the Local Arm but they were unable to probe the disc interior to the Sun on account of LAMOST’s bias towards the anticentre. Bovy et al. (2016) used red clump stars in APOGEE to assess the structure of mono-abundance populations (MAPs). The metal-rich, low-α population to which the OB stars belong, was found to have a ‘broken’ exponential radial profile, with the break at |$R=7\, \mathrm{kpc}$|. Mackereth et al. (2017), using red giants in APOGEE as the tracers, found that the youngest population has a break radius at |$R\simeq 8\, \mathrm{kpc}$|. The surface density of our best-fitting model shown in Fig. 15 is broadly in line with these earlier results, although its break radius is somewhat smaller.
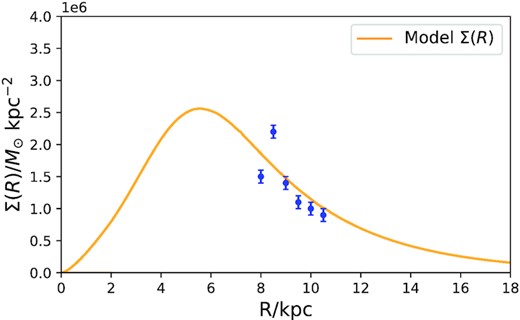
The curve shows the surface density of the best-fitting model of the young disc. The blue data points show the surface densities derived by Xiang et al. (2018) from LAMOST data. The normalization of the model is reduced by a factor 3 to facilitate the comparison of data and model.
The predicted peak in the surface density of OB stars at |$R\simeq 5.5\, \mathrm{kpc}$| falls outside the reported peak at |$R=4-5\, \mathrm{kpc}$| in the surface density of H2 (Heyer & Dame 2015). While studies of the stellar disc are liable to overestimate the radius of the peak stellar density because the innermost young disc is hidden behind the abundant dust near the plane at |$R\lesssim 6\, \mathrm{kpc}$|, the radius at which the density of H2 peaks may have been underestimated. Indeed, hydrodynamical models (e.g. Sormani, Binney & Magorrian 2015) predict the density of gas to be low inside the bar’s corotation radius, which is currently believed to be as large as |$6\, \mathrm{kpc}$| (Pérez-Villegas et al. 2017; Binney 2020; Chiba et al. 2021). A circular-speed curve is required to convert an observed distribution of emission-line intensity in longitude and velocity into a plot of surface density versus radius. Perhaps when the emission-line data are re-analysed using a circular-speed curve extracted from Gaia, the H2 distribution will be found to peak at a larger radius.
7.2 Comparison of the LAMOST
Our model predicts distributions of space velocities and in this section we compare these predictions with distributions inferred by combining spectroscopic measurements of v∥ with EDR3 astrometry. Specifically, many of the OB stars we have identified in the intersection of EDR3, 2MASS, and the Starhorse catalogue were observed by LAMOST (Xiang et al. 2021) so have measured values of v∥. We select stars within |$\left| b\right| \lt 5\,$| deg and |$\epsilon _v\lt 50\, \mathrm{km\, s}^{-1}$| to exclude stars with poorly determined v∥. We also shift the LAMOST values of v∥ by |$4.54\, \mathrm{km\, s}^{-1}$| as suggested by Schönrich & Aumer (2017), Anguiano et al. (2018). After such corrections, LAMOST’s values of v∥ agree well with the values measured for the same stars by APOGEE and Galah.
Fig. 16 shows the distributions of the corrected values of v∥ when the stars are divided into four bins in R with the distributions of v∥ obtained by sampling the best-fitting model at the locations of observed stars. The observed and mock distributions have similar shapes but are offset from one another by an amount that grows with R − R0. In principle, these offsets could arise through biased distances for the stars causing Galactic rotation to make erroneous contributions to the mock values of v∥. We found that systematically increasing distances by 10 per cent shifted even the mock histogram for the furthest bin by only |$\sim 1.5\, \mathrm{km\, s}^{-1}$|, so neither erroneous distances nor faulty data reduction can explain the measured offsets.
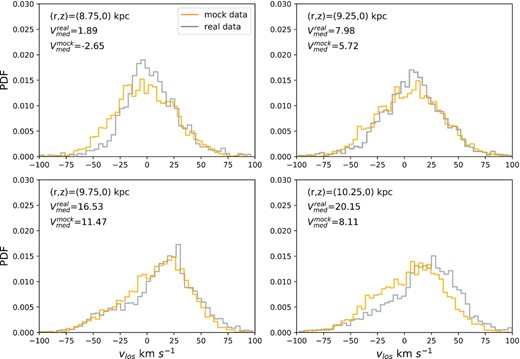
Fig. 17 compares observed and mock distributions of vR at the locations of LAMOST stars. This comparison is more sensitive to adopted distances than the above comparison of v∥ values because vR has contributions from vℓ and vb, which are proportional to distance. These contributions are small, however, because all stars lie near the anticentre. The mock distributions from our axisymmetric model are inevitably symmetric in vR, so the comparison highlights the asymmetry in the observed distributions. The asymmetry is negligible for the nearest sample because the U component of the solar velocity is chosen to eliminate this asymmetry in the wider populations of disc stars. The observed systematic increase in asymmetry with R − R0 must arise from some combination of spiral structure and large-scale distortion of the disc by the Sgr Dwarf galaxy, which has been extensively discussed in connection with the Galactic warp and the phase spiral (Jiang & Binney 2000; Antoja et al. 2018; Binney & Schönrich 2018; Bland-Hawthorn et al. 2019; Laporte et al. 2019). Fig. 17 is consistent with what one would expect from the map ov vR deduced by Eilers et al. (2020) from data for red giant stars.
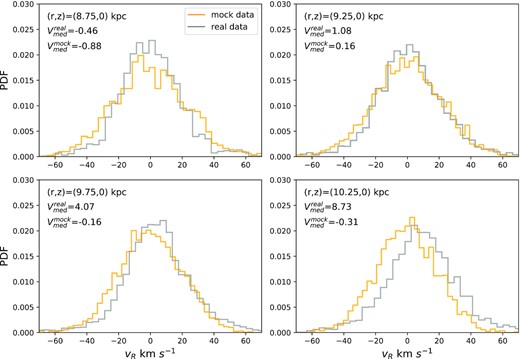
Orange histograms: the distributions of vR predicted by the best-fitting model in the plane at |$R=8.75,\, 9.25,\, 9.75,$| and |$10.25\, \mathrm{kpc}$|. Grey histograms: distributions of vR for the OB stars in the LAMOST catalogue that lie in these spatial bins. The number of stars in each bin is 2097, 3572, 4268, and 3215.
Fig. 18 compares our model’s predictions (curves) for the velocity dispersions σz and σR with results from OB stars in LAMOST. The data for σz (red line and points) are in reasonable concordance, although the LAMOST data show a weaker outward decline than the model predicts. Fig. 19 provides evidence that the steeper gradient of the model is required by the EDR3 data by comparing the model prediction (dashed line) with the dispersion in vb, which for these low-latitude stars differs little from vz.
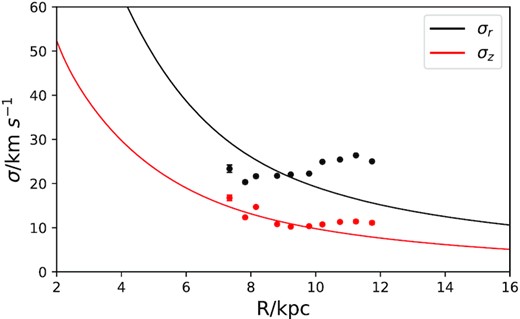
The curves show the profiles of the velocity dispersions σz (red) and σR (black) predicted by the best-fitting model. The dots show values derived from OB stars in LAMOST.
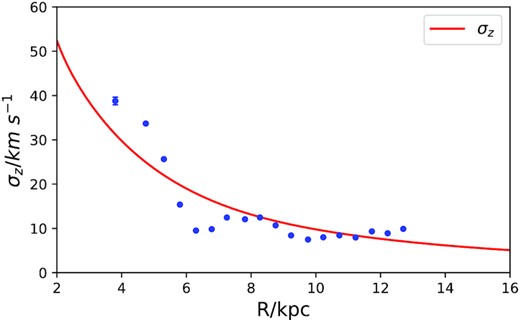
The curve shows σz as a function of R in the Galactic plane from the best-fitting model. The dots show vb for real stars in Gaia EDR3 with |$|b|\lt 5\,$| deg.
In Fig. 18, the black points and full curve for σR are starkly incompatible. This conflict signals that the vR distribution has been broadened as well as shifted to negative values. The points in the upper panel of Fig. 20 show the ratio σR/σϕ as a function of R for LAMOST stars, while the black line shows the prediction of the best-fitting model. The data points climb away from the model’s line as R − R0 grows. A classical result of stellar dynamics is that σR/σϕ is largely set by the shape of the circular-speed curve: when the latter is flat, any thin-disc population will have σR/σϕ ≃ √2 (e.g. Binney & Tremaine 2008). The LAMOST data imply values of σR/σϕ that reach well above 2. No equilibrium model could match these values.
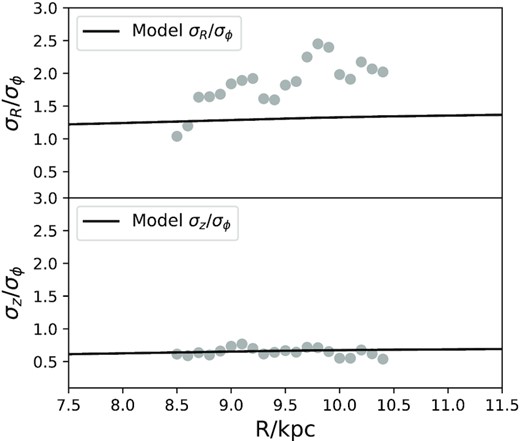
σR/σϕ and σz/σϕ plotted against R for OB stars in LAMOST using Starhorse distances.
7.3 Impact of binaries
We now ask whether binary stars can explain the anomalously large values of σR/σϕ plotted in Fig. 20.
8 CONCLUSIONS
We extracted a sample of |$\sim 47\, 000$| OB stars from the intersection of Gaia EDR3 with the 2MASS and Pan-STARRS surveys. For this sample, we have photometry plus 5D astrometry. We used the algorithm developed in Li & Binney (2022) in connection with similar data for a sample of RR-Lyrae stars to fit DFs of the form f(J) to the OB population. Since the surface density of the young disc is expected to peak at a radius of a few kpc, we introduced two new parameters to the disc DFs proposed by BV2022. Small extensions of the algorithm were required to deal with (i) the finite spread in luminosity of the sampled stars, and (ii) extinction by dust. Tests of the algorithm on similar pseudo-data showed that the parameters of the true DF can be recovered with remarkable precision when the distribution of dust is accurately known. When a significantly incorrect dust distribution is used to analyse the data, the true parameters can lie several sigmas above or below the probable range returned by the algorithm.
When the algorithm is run on the real data using the dust model of Green et al. (2019), the most probable DF yields pseudo-data that are not correctly distributed on the sky. The source of this discrepancy is almost certainly imperfections of the dust model used. Since the distribution of velocities depends quite strongly on location, discrepancies in the spatial distribution of stars automatically leads to discrepancies between the predicted and measured velocity distributions. When the most probable DF is used to sample velocities at the observed locations of stars rather than at the locations of pseudo-stars, the observed and predicted velocity distributions agree well. These tests show that a sample of OB stars like the present one would pin down the phase-space structure of the young stellar disc with impressive accuracy if the 3D distribution of dust were accurately known. The discrepancies between the distributions of pseudo-stars and real stars constitute clear evidence that the best current dust model is significantly flawed.
Although the functional form of the DF provides great flexibility in the radial distribution of stars, the best-fitting DF predicts a distribution of OB stars that extends to smaller radii than the observed sample. Since the kinematics of a stellar disc are not independent of its surface-density profile, the MCMC search may favour discs that extend unexpectedly far in because the kinematics of such discs may fit the data better. Moreover, a dust model that included more dust interior to the Sun would make the data consistent with more extended discs. Hence, we consider it likely that there is more dust at |$R\lesssim 7\, \mathrm{kpc}$| than the Bayestar2019 model envisages.
The most probable DF predicts the distributions of the space velocities of OB stars. We have compared these predictions with the distributions of the sub-sample of EDR3 OB stars that have measured line-of-sight velocities because they fell within the LAMOST survey. The predicted and measured dispersions σz agree fairly well, although the measured values of σz are flat beyond |$R\sim 10\, \mathrm{kpc}$| while the predicted values decrease monotonically outwards. The measured values of σR do not decrease outwards as the model predicts – they even increase slightly. Moreover, the median value of vR drifts upwards from near zero at R0 to |$\overline{v}_R\sim 10\, \mathrm{km\, s}^{-1}$| at |$R\sim 12\, \mathrm{kpc}$|. We concluded that this trend in |$\overline{v}_R$| is not an artefact induced by erroneous distances. In particular, it is associated with similar offsets between the measured line-of-sight velocities and those predicted by the model. It seems that some combination of spiral structure and disturbance by the gravitational field of the Sgr dwarf galaxy is changing velocities by |$\gtrsim 10\, \mathrm{km\, s}^{-1}$| between here and |$R\sim 12\, \mathrm{kpc}$|.
The ratio σR/σϕ, which is strongly constrained by the shape of the circular-speed curve, is unexpectedly large for the LAMOST stars. We argued that this result arises naturally from the majority of the stars being in binaries too tight for Gaia to resolve. The line-of-sight velocity of such a star will differ from its barycentric velocity by a fraction of the binary velocity because the LAMOST data for most stars are based on a single epoch. The EDR3 proper motion, by contrast, is obtained by fitting a curve through the star’s observed positions at ∼40 epochs, so will be barely affected by their binary nature. The line-of-sight velocity of distant LAMOST OB stars feeds strongly into vR rather than vϕ because they are located close towards the anticentre. Hence binaries will push σR/σϕ above the value predicted for single stars.
The key to improving our understanding of the Galaxy’s young disc is construction of a better map of the distribution of dust. Traditionally dust is mapped by measuring extinctions for stars with known distances and the advent of vast number of precise parallaxes for stars within a few kiloparsecs of the Sun has breathed new life into this field (Bailer-Jones 2011; Sale & Magorrian 2014; Green et al. 2019; Lallement et al. 2022). The major problems now are (i) the determination of extinctions for large numbers of stars, and (ii) synthesizing the extinction measures into a coherent picture of the dust distribution. This work suggests an approach to dust mapping that dispenses with extinctions measures of individual stars. The stars of a stellar populations that is more than |$\sim 200\, \mathrm{Myr}$| old have to be fairly smoothly distributed in phase space. Moreover, the population’s velocity distribution at one location strongly constrains the population’s DF, and therefore its spatial distribution. Moreover, the velocity distribution at a location can be determined without knowledge of the column of dust through which we see that location because obscuration is velocity-independent. Hence, an exercise along the present lines could yield fairly firm predictions for the spatial distribution of stars, and a dust model could be strongly constrained by comparing this predicted distribution in (ℓ, b, ϖ, μℓ, μb, G, colours) with the observed star density.
A great advantage of such an approach is that it could exploit all the |$\gt 1.3\,$| billion stars tracked by Gaia, and thus produce dust maps of unprecedented spatial resolution. To implement this idea, it is necessary both to confront the computational challenge of simultaneously exploring high-dimensional parameter spaces of DFs and dust models, and to obtain a good model of Gaia’s selection function. There is an excellent prospect that implementation will soon be feasible.
SUPPORTING INFORMATION
src.zip
Please note: Oxford University Press is not responsible for the content or functionality of any supporting materials supplied by the authors. Any queries (other than missing material) should be directed to the corresponding author for the article.
ACKNOWLEDGEMENTS
We thank the anonymous referee for the suggestions to improve this paper. CL and JB are supported by the UK Science and Technology Facilities Council under grant number ST/N000919/1. JB also acknowledges support from the Leverhulme Trust through an Emeritus Fellowship.
This work presents results from the European Space Agency (ESA) space mission Gaia. Gaia data are being processed by the Gaia Data Processing and Analysis Consortium (DPAC). Funding for the DPAC is provided by national institutions, in particular the institutions participating in the Gaia MultiLateral Agreement (MLA). The Gaia mission website is https://www.cosmos.esa.int/gaia. The Gaia archive website is https://archives.esac.esa.int/gaia.
This publication makes use of data products from the Two Micron All Sky Survey, which is a joint project of the University of Massachusetts and the Infrared Processing and Analysis Center/California Institute of Technology, funded by the National Aeronautics and Space Administration and the National Science Foundation.
DATA AVAILABILITY
The agama source codes and model parameter file are available in the online supplementary material. The data underlying this article will be shared on reasonable request to the corresponding author.
Footnotes
Gaia@AIP Services at https://gaia.aip.de/
In fact, this is not true especially for the proper motions because of the different celestial frames of Gaia bright and faint stars, respectively (Cantat-Gaudin & Brandt 2021). However, since the Astrometry Spread Function module in Gaia-verse package (Everall et al. 2021) only works for GaiaDR2 now, the simulated astrometric solutions are deviated from those in Gaia EDR3. As a result, we use some simple randomized errors based on apparent magnitudes instead.
The convergence was tested by computing the autocorrelation time recommended by emcee. The average autocorrelation time for all the parameters are about 25 which means the burn-in steps are reasonable. We also test a longer chain with N = 3000 which is more than 100 times the autocorrelation time. It yielded similar results to those obtained with N = 500 and in the interests of economy we use N = 500 here.
The overall count of 77 × 35 = 2695 evaluations of the DF for each star.
REFERENCES
APPENDIX A: FORMULAE FOR COMPUTING LIKELIHOODS
In practice S depends not on M but on the apparent magnitude m = M + μ + A, where |$\mu =5\log _{10}(s/10\, \mathrm{pc})$| is the distance modulus and A(x) is the extinction.
A1 Evaluating the probabilities
APPENDIX B: TEST RESULT FOR WRONG DUST MODEL
Fig. B1 shows the posterior distributions when the Green et al. (2019) dust model is used to analyse mock data produced using the toy dust model of Section 5.3.
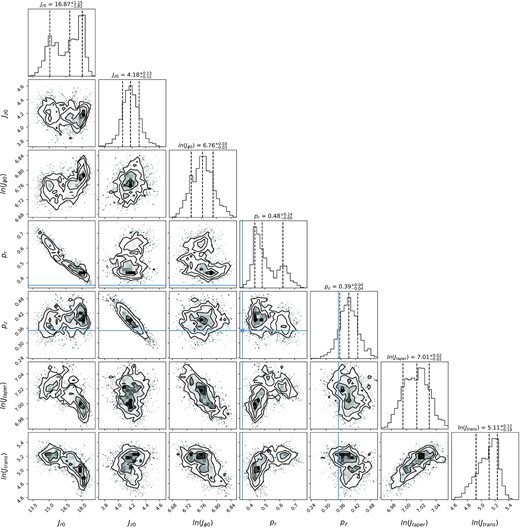
Posterior probability distributions obtained when a mock catalogue created using the toy dust model is analysed using the Bayestar2019 dust model.


