


ABSTRACT
We report on the nearly simultaneous NICER and NuSTAR observations of the known X-ray transient XTE J1739–285. These observations provide the first sensitive hard X-ray spectrum of this neutron star X-ray transient. The source was observed on 2020 February 19 in the hard spectral state with a luminosity of 0.007 of the Eddington limit. The broadband 1−70 keV NICER and NuSTAR observation clearly detects a cutoff of the hard spectral component around 34−40 keV when the continuum is fitted by a soft thermal component and a hard power-law component. This feature has been detected for the first time in this source. Moreover, the spectrum shows evidence for disc reflection – a relativistically broadened Fe K α line around 5−8 keV and a Compton hump in the 10−20 keV energy band. The accretion disc reflection features have not been identified before from this source. Through accretion disc reflection modelling, we constrain the radius of the inner disc to be |$R_{\rm in}=3.1_{-0.5}^{+1.8}R_{\rm ISCO}$| for the first time. In addition, we find a low inclination, i ∼ 33°. Assuming the magnetosphere is responsible for such truncation of the inner accretion disc above the stellar surface, we establish an upper limit of 6.2 × 10⁸ G on the magnetic field at the poles.
1 INTRODUCTION
Low-mass X-ray binaries (LMXBs) consist of a neutron star (NS) or a black hole (BH) accreting from a low-mass (≤1 M⊙) companion star via Roche lobe overflow. They may be classified into two categories, the persistent systems and the transient ones, based on their long-term X-ray behaviour. Persistent LMXBs are always actively accreting (can show X-ray variability in some cases) whereas transient LMXBs exhibit large swings in their X-ray luminosity. Persistent accretor may have an X-ray luminosity of LX ≥ 1036 erg s−1 (Ludlam et al. 2019, 2017) whereas, transient systems often undergo cycles of outburst and quiescence due to the modulation in the rate at which matter from the companion star accretes on to the compact object (either NS or BH). Transient LMXBs undergo recurrent bright (LX ≥ 1036 erg s−1) outbursts lasting from days to weeks and then return to long interval of X-ray quiescence (LX ≤ 1034 erg s−1) lasting from months to years (Degenaar & Wijnands 2010). The long-term average mass accretion rate of the transient systems are significantly lower than in the persistent systems.
XTE J1739–285 is a transient NS LMXB that was first discovered by the RXTE Proportional Counter Array (PCA) in 1999 October 19 (Markwardt et al. 1999). Since its discovery, the source has shown an irregular pattern of X-ray outbursts. Short outbursts from this source were observed in 2001 May and 2003 October (Kaaret et al. 2007). After 2 yr of quiescence, the source became active again in 2005 August (Bodaghee et al. 2005) and two type-I X-ray bursts were detected with the INTEGRAL/JEM-X instrument on 2005 September 30 and October 4 (Brandt et al. 2005). It confirms that the source harbours an NS as the compact component. The source was detected with INTEGRAL at a 3−10 keV flux of ∼2 × 10⁻⁹ erg s−1 cm−2 (Bodaghee et al. 2005). However, the flux dropped to ∼2 × 10⁻¹⁰ erg s−1 cm−2 nearly a month later (Shaw et al. 2005). RXTE further observed the source on many occasions between 2005 October 12 and November 16. During this period, the flux evolved between ∼4 × 10⁻¹⁰ and ∼1.5 × 10⁻⁹ erg s−1 cm−2. The source was found to be visible in the INTEGRAL Galactic Bulge monitoring observations on 2006 February 9 (Chenevez et al. 2006). Since then, outburst activity has been detected in 2012 (Sanchez-Fernandez et al. 2012) and 2019 (Bult et al. 2019). Once again, during observations of the Galactic Centre region, INTEGRAL has detected renewed activity of this source on 2020 February 8 (Sanchez-Fernandez et al. 2020). This new outburst cycle was quickly confirmed with a follow-up SWIFT/XRT observation performed on 2020 February 13 (Bozzo et al. 2020). In this outburst cycle, Neutron star Interior Composition ExploreR (NICER) observed the source on many occasions, and in particular, the observation performed on 2020 February 13 detected 32 X-ray bursts (Bult et al. 2021). Nuclear Spectroscopic Telescope ARray (NuSTAR) also observed the source on 2020 February 19, and the spectral analysis of the same is presented in this work.
From RXTE/PCA observations, Kaaret et al. (2007) detected six type-I X-ray bursts and also found the evidence for oscillation at ∼1122 Hz in the brightest X-ray burst. They claimed that this burst oscillation frequency would imply that the source contained the fastest spinning NS known at that time. However, other analyses of the same data found no significant burst oscillation signals (Galloway et al. 2008; Bilous & Watts 2019). Bult et al. (2021) did not find any evidence of variability ∼1122 Hz using a sample of NICER data and instead found that the 386.5-Hz oscillation was the more prominent signal. They concluded that it was unlikely that the source had a submillisecond rotation period. The source exhibits various outburst activities since its discovery, and the extensive timing/burst analysis had been performed in detail by different authors to constrain some crucial parameters of this source. But the spectral analysis has not been performed so far in detail. Therefore, much spectral information could not be extracted from the previous studies.
In this work, we present the broad-band spectral and variability analysis of nearly simultaneous NICER and NuSTAR observation of this well-known NS X-ray transient it has not been performed so far. We use the high-quality NICER and NuSTAR spectra to study different spectral signatures in detail for the first time. Moreover, we use the joint fit of NICER and NuSTAR data to constrain the hydrogen column density (NH) and the reflection composition separately. We focus on studying the accretion geometry for this source by modelling the reflection spectrum. In particular, we aim to constrain the inner disc radius of this LMXB. The paper is structured in the following format: Section 2 presents the observation and data reduction. Sections 3 and 4 represent the timing and spectral analysis, respectively. Section 4 provides a discussion of the results obtained from the analyses.
2 OBSERVATION AND DATA REDUCTION
The X-ray transient XTE J1739–285 was observed by both satellites the NICER (Gendreau et al. 2016) and the NuSTAR (Harrison et al. 2013) on 2020 February 19. The NuSTAR observed the source for 29 ks (Obs ID: 90601307002). Among many observations, NICER has only one observation on the same day with NuSTAR. We have selected this NICER observation (Obs ID: 2050280129) which is nearly simultaneous with the NuSTAR observation. This NICER observation had an exposure time of 6.7 ks.
2.1 NuSTAR data reduction
The NuSTAR data were collected using two co-aligned grazing incidence hard X-ray imaging focal plane module telescopes FPMA and FPMB. We processed the NuSTAR data using the NuSTAR data analysis software nustardas v2.0.0 for both data sets. During this, we have used the latest calibration file CALDB v20210524. We filtered the event lists using the nupipeline tool (v 0.4.8). The source events were extracted from a circular region with a radius 120 arcsec for both modules FPMA and FPMB centered on the source coordinates. For the background events, we used a circular region of the same radius but far away from the source position for both instruments. The tool nuproducts has been used to create the filtered event files, the background subtracted light curves, the spectra, and the arf and rmf files. During the run of the nuproducts tool, we have applied a GTI file which was created by FTOOLS maketime. We grouped the FPMA and FPMB spectral data with a minimum of 50 counts per bin. Finally, the spectra obtained with FPMA and FPMB are fitted simultaneously over the range 3.0−70.0 keV.
2.2 NICER data reduction
We have processed the NICER X-ray timing instrument (XTI) data following the standard steps using the latest CALDBv20210707. We have reprocessed the data using the nicerl2 tool, applying standard filtering criteria. Data products (spectra, light curves) have been extracted using the tool xselect from the cleaned and screened full array event files. We have used the tool nibackgen3C50 to extract the background spectrum (Remillard et al. 2022). The response matrix 20170601v004 and ancillary file 20170601v002 are used from CALDB. Finally, the command grppha has been used to produce the grouped spectrum with a minimum count of 20 per bin. The NICER/XTI spectrum is fitted over the energy band of 1−10 keV, considering the impact of low energy noise.
3 TEMPORAL ANALYSIS
The light curves for the NICER and the NuSTAR observations are shown in the left- and right-hand panel of Fig. 1, respectively. The 1−10 keV NICER light curve shows the average count rate of the source ∼37 counts s−1. That this source is known for X-ray bursts is corroborated by the NICER light curve showing the presence of six type-1 X-ray bursts, which have been excluded in this analysis. The 3−79 keV NuSTAR light curve shows an average count rate of 12 counts s−1. The NuSTAR light curve also detects two type-1 X-ray bursts, and we have excluded those from the present analysis. The light curves suggest that the source mean count rate gradually decreased from ∼37 to 12 counts s−1 within a few hours. Further, we run lcstats (an XRONOS task) on both light curves to calculate constant source probability through a Kolmogorov–Smirnov (KS) test. We found that, while for the NuSTAR light curve, the average value (taken over the time intervals) of the KS probability of consistency is ∼0.168, it is very small (<0.05) for the NICER light curve. It indicates that the NuSTAR light curve does not show significant variability in the count rate, while there can be some variability in the NICER light curve.
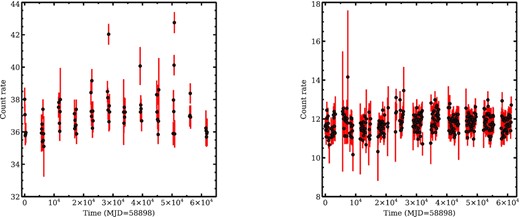
Left-hand panel: 1−10 keV NICER/XTI light curve of XTE J1739–285 with a binning of 100 s. Right-hand panel: 3−79 keV NuSTAR/FPMA light curve of the source with 100 s binning. Both light curves do not exhibit significant variability in the count rate.
4 SPECTRAL ANALYSIS
We have used the spectral analysis package xspecv12.11.1 (Arnaud 1996) to fit the NICER and NuSTAR spectra of this source between 1 and 70 keV. During the simultaneous fitting of NICER/XTI and NuSTAR FPMA/FPMB data, we have used a model constant which coordinates the calibration differences in different instruments in the process of joint fit. We mainly fix the constant of NuSTAR FPMA to 1 and allow the constant of NICER/XTI and NuSTAR FPMB to vary. We have modelled the Galactic interstellar medium absorption by the model TBabs with wilm abundances (Wilms, Allen & McCray 2000) and vern (Verner et al. 1996) cross-section. Spectral uncertainties are given at 90-percent confidence intervals, unless otherwise stated.
4.1 Continuum modelling
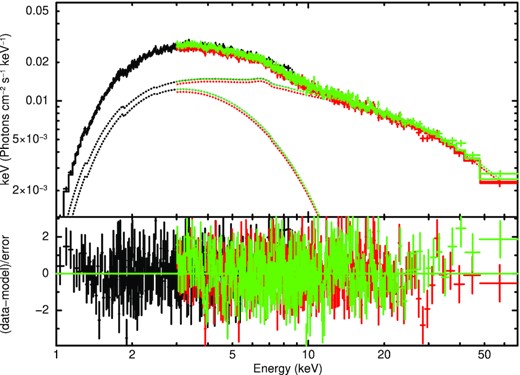
We initially tried to fit the joint NICER and NuSTAR spectrum by a multicolour disc blackbody component (diskbb) to account for the emission from the ion disc and a powerlaw component to account for Comptonization i.e. constant*TBabs*(diskbb+powerlaw). This model clearly shows the presence of a hard spectral cut-off ∼30−40 keV which is evident in Fig. 2. We therefore replaced the powerlaw component by a cutoff power-law model cutoffpl in XSPEC. The continuum is well-described by the combination of a diskbb and a cutoffpl model i.e. constant*TBabs*(diskbb+cutoffpl) with χ2/dof = 1999.6/1827. This model yielded a high energy cut-off of ∼37 keV which may reflect the electron temperature of the corona. Here, the power-law component, assumed to be due to the Comptonization process, takes a relatively hard index (Γ = 1.16 ± 0.04). For the hard power-law index (Γ < 2), it is well-known that the source is in the so-called hard spectral state. We found the absorption column density at NH = (1.52 ± 0.02) × 1022 cm−2 which is consistent with Bult et al. (2021).
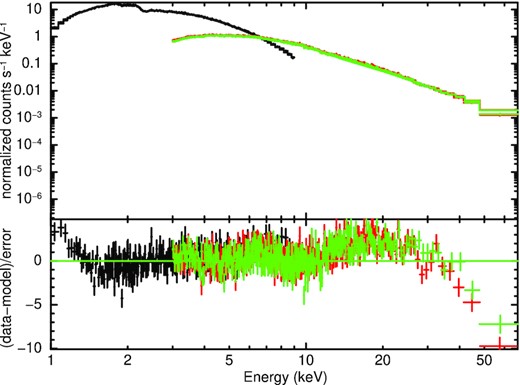
Joint fit for the NICER and NuSTAR observations of the source XTE J1739–285. The residual shows a clear spectral cut-off around 30−40 keV when the continuum emission is modelled with an absorbed disc blackbody (diskbb) and power-law (powerlaw) component. The black points are the NICER/XTI data. The red and green points are the NuSTAR FPMA and FPMB data, respectively. The data were rebinned for plotting purposes.
To describe the continuum more accurately, we replaced the exponentially cut-off power-law component by the nthcomp (Zdziarski, Johnson & Magdziarz 1996; Życki, Done & Smith 1999) component as it offers sharper high-energy cut-off and a more accurate low-energy rollover with similar parameters. We explored the possibility that the source of the seed photons in the nthcomp component is the disc. This combination constant*TBabs*(diskbb+nthcomp) provides a similar description compared to the previous continuum model with χ2/dof = 2043.3/1826. But statistically, an absorbed cutoffpl along with a diskbb component gives a better description of the continuum emission to this hard state spectrum. The nthcomp fit yields the power-law photon index (Γ), the temperature of the Comptonizing electrons (kTe), and the seed photon temperature (kTseed) of ∼1.72, 14.6−19.3, and 1.1−3.2 keV, respectively. The observed high-energy cutoff ∼37 keV and the kTe in the hard spectrum is consistent with the fact that Ecut ≃ (2−3) kTe. For both continuum model, we found the evidence for fluorescent Fe line emission in the spectrum. Both the continuum model shows similar positive residuals around 5−8 and 20−30 keV. These residuals suggest a possible emission line from Fe–K and Compton hump from the reflection of hard X-rays by the cool accretion disc. These features are evident in Fig. 3.
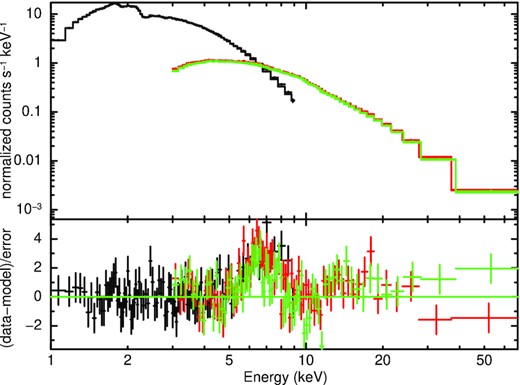
The continuum is fitted with the model consisting of a multicolour disc blackbody and a thermal Comptonization model. Model used: TBabs×(diskbb+nthcomp). It revealed un-modelled broad emission line ∼5−8 keV and a hump like feature ∼10−20 keV. The residuals can be identified as a broad Fe–K emission line and the corresponding Compton hump. The spectral data were rebinned for visual clarity.
4.2 Line modelling: the Fe line region
To fit the residual observed in the 5−8 keV band, we employed the line model relline (Dauser et al. 2010), which assumes an intrinsic zero width emission line transformed by the relevant relativistic effects. The rest energy of the emission is fitted freely within the limit 6.4−6.97 keV. During this fitting, we have fixed the emissivity index (Γ) and spin parameter (a) to r−3 and 0.18, respectively. The outer radius of the disc is fixed at 1000 rg. We adopt a = 0.18 since the source exhibits a spin frequency of ∼386 Hz (Bult et al. 2021; see below). We set the redshift parameter z = 0 as it is a Galactic source. The addition of this line model improved the fit significantly with χ2/dof = 1852/1823. The complete model we used here is constant*TBabs*(diskbb+cutoffpl+relline). The corresponding spectra, individual components, and residuals are shown in Fig. 4. We found the rest energy of the emission line to be |$6.57_{-0.10}^{+0.20}$| keV. It predicts that the disc is moderately ionized. Moreover, it predicts a truncated inner accretion disc of radius ∼3.7 RISCO, but the disc inclination is found to be pegged at a higher value.
The feature ∼6.5 keV is modelled with relline model. The overall model used here can be represented as TBabs×(diskbb+cutoffpl+relline). The individual model components are denoted by the dotted lines. Lower panel shows residuals in units of σ.
4.3 Self-consistent reflection fitting
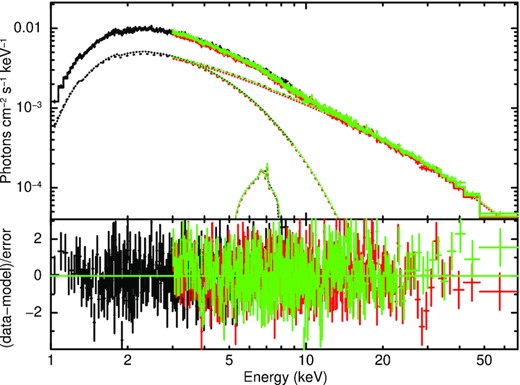
The consideration of reflection off the ion disc is important as the residuals of Fig. 3 show the presence of a broad iron line as well as a reflection hump at high energies. We therefore applied the self-consistent relativistic reflection model RELXILL (García et al. 2014) which describes not only the reflection part but also a direct power-law component. The overall model now becomes constant*TBabs*(diskbb+RELXILL). The parameters in the RELXILL model are the inner and outer emissivity indices, q1 and q2, respectively, the break radius, Rbreak, between two emissivity indices, the inner and outer radii of the disc, Rin and Rout, respectively, the inclination of the disc, i, the spin parameter, a, the redshift of the source, z, the photon index of the power-law, Γ, the cut-off energy of the power-law, Ecut, the ionization parameter, ξ, the iron abundance, AFe, the reflection fraction, rrefl, and the norm which represents the normalization of the model. We have used a single emissivity index q1 = q2 = 3. The burst oscillation frequency ∼386 Hz (Bult et al. 2021) implies the spin parameter, a = 0.18 as a ≃ 0.47/Pms (Braje, Romani & Rauch 2000) where Pms is the spin period in ms. The outer disc radius was fixed at 1000 Rg. The addition of RELXILL model improves the fit significantly to χ2/dof = 1833.12/1822 (Δχ2 = 166 for the addition of five parameters). The best-fitting parameters of this model are given in Table 1. The corresponding spectra, individual components, and the residuals are shown in Fig. 5.
Spectrum fitted with the model diskbb and RELXILL, the best-fitting model: TBabs×(diskbb+RELXILL). The individual model components are denoted by the dotted lines. Lower panel shows the ratio of the data to the model in units of σ. The data were rebinned for plotting purposes.
Best-fitting spectral parameters of the 2020 February 19 NICER and NuSTAR observations of the source XTE J11739–285 using model: TBabs×(diskbb+RELXILL).
| Component | Parameter (unit) | Value |
|---|---|---|
| tbabs | NH(× 1022 cm−2) | 1.52 ± 0.02 |
| diskbb | kTin(keV) | 1.73 ± 0.04 |
| norm | 0.74 ± 0.07 | |
| relxill | i (degrees) | ≤33 |
| Rin(× RISCO) | |$3.1_{-0.5}^{+1.8}$| | |
| log ξ (erg cm s−1) | |$3.54_{-0.30}^{+0.12}$| | |
| Γ | |$1.15_{-0.03}^{+0.06}$| | |
| AFe (× solar) | ≥4.9 | |
| Ecut(keV) | |$36.6_{-2.4}^{+3.6}$| | |
| frefl (× 10−2) | |$5.59_{-1.10}^{+1.61}$| | |
| norm (× 10−4) | 9.47 ± 0.36 | |
| |$F^{a}_{\rm total}$| (× 10−10 erg s−1 cm–2) | 6.4 ± 0.1 | |
| Fdiskbb (× 10−10 erg s−1 cm–2) | 1.3 ± 0.1 | |
| Frelxill (× 10−10 erg s−1 cm–2) | 5.1 ± 0.2 | |
| L1 − 70 keV (× 1036 erg s−1) | 1.21 ± 0.01 | |
| χ2/dof | 1833.12/1822 |
Notes. The outer radius of the RELXILL spectral component was fixed to 1000 Rg. We fixed emissivity index q = 3. The spin parameter (a) was fixed at 0.2.
aAll the unabsorbed fluxes are calculated in the energy band 1−70 keV using the cflux model component. Luminosity is calculated based upon a distance of 4 kpc (Bailer-Jones et al. 2018).
We found an inner disc radius to be |$3.1_{-0.5}^{+1.8}R_{\rm ISCO}$|, which implies a significant disc truncation. The inclination is found to be ≤33°. The power-law photon index, Γ, is |$1.15_{-0.03}^{+0.06}$| with a cut-off energy, Ecut, at |$36.6_{-2.4}^{+3.6} {\rm ~keV}{}$|. We found a moderate value |$3.54_{-0.30}^{+0.12}$| of the disc ionization parameter |$\rm {log}\xi$| which is consistent with the typical range observed in different NS LMXBs [|$\rm {log}\xi \sim (3-4)$|]. However, the iron abundance, AFe, is large. The value is greater than 4.9 times the solar value. We tried to perform the fit after fixing the AFe at twice the solar value. It did not improve the fit, rather it provided a large error on the position of the inner disc and a high disc inclination angle (≤86°). However, the other parameters are consistent with the fit that had a free AFe. The overabundance of iron could be indicative of a higher density disc than the hard coded value of |$10^{15} \,\, \rm {cm}^{-3}$| in RELXILL. A large iron abundance has already been reported for the LMXB 4U 1636–53 (Ludlam et al. 2017) and 4U 1702–429 (Ludlam et al. 2019) when the reflection component is modelled with RELXILL. In all the cases, the source was in the hard spectral state, and the continuum emission was well-explained with an absorbed cut-off power-law model. We have used command steppar in XSPEC to search the best fit for the inner disc radius and inclination for the best-fitting model. The left- and right-hand panels in Fig. 6 show the Δχ2 of the fit versus the inner disc radius and the disc inclination, respectively, for the best-fitting model constant*TBabs*(diskbb+RELXILL).
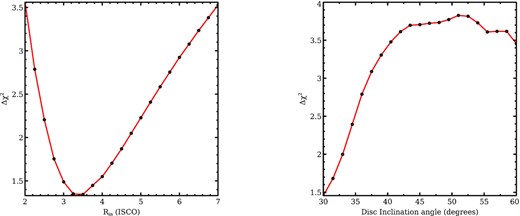
Shows change in goodness of fit with respect to the inner disc radius and disc inclination angle. The left-hand panel shows the variation of |$\Delta \chi ^{2}(=\chi ^{2}-\chi _{\rm min}^{2})$| as a function of inner disc radius obtained from the relativistic reflection model (RELXILL). The right-hand panel shows the variation of |$\Delta \chi ^{2}(=\chi ^{2}-\chi _{\rm min}^{2})$| as a function of disc inclination angle obtained from the relativistic reflection model. We varied the disc inclination angle between 30° and 60°.
Additionally, we tried to fit the spectrum with RELXILLCP, which allows for reflection from a Comptonized disc component. The model constant*TBabs*(diskbb+RELXILLCP) did not improve the fit. Moreover, we failed to constrain several important parameters which suggests that the model is not appropriate for this particular observation. Therefore, we do not comment on it further.
5 DISCUSSION
We performed a broad-band spectral study for this source with the NICER and NuSTAR observations for the first time. The joint fit of NICER and NuSTAR data allows us to constrain the hydrogen column density (NH) and the reflection composition separately. XTE J1739–285 was in the hard spectral state during these observations. The source was detected with a persistent X-ray flux of Fp = 6.4 × 10⁻¹⁰ erg s−1 cm−2 which is consistent with the other observations of 2020 outburst cycle (Bozzo et al. 2020; Bult et al. 2021). The 1−70 keV luminosity was 1.21 × 1036 erg s−1 (assuming a distance of 4 kpc following Bailer-Jones et al. 2018) which is |$0.7{\rm per\,cent}$| of the Eddington luminosity. We report, for the first time, different spectral features with NICER and NuSTAR that have not been reported earlier. The continuum emission is found to be well-described by a soft thermal component and a hard power-law component with a cut-off ∼37 keV which has not been detected so far. However, a combined fit of the current SWIFT/XRT and The INTEGRAL IBIS/ISGRI data (taken on 2020 February 13) showed the evidence of high energy spectral cut-off at |$17_{-7}^{+15}{\rm ~keV}{}$| (Bozzo et al. 2020). Our continuum fit either with the model cutoffpl or the nthcomp alongwith diskbb shows the evidence of Fe emission line ∼6.5 keV and a Compton hump ∼10−20 keV. Probably these features have been precisely detected for the first time in this source. However, the complex residuals ∼6.7 keV have been observed previously by Kaaret et al. (2007) using RXTE/PCA data and recently by Chakraborty & Banerjee (2020) and Bult et al. (2019) using the Astrosat/LAXPC and the NICER data performed on 2020 Ferruary 19–20 and 2019 September 27, respectively. We performed detailed analysis of the resulting reflection spectrum to further probe these features to launch into the following paragraph.
The reflection spectrum shows evidence of a significant disc truncation. We measured an inner disc radius of |$R_{\rm in}=3.1_{-0.5}^{+1.8} \times R_{\rm ISCO}=(13.1-24.7)R_{g}$| (where RISCO = 5.05Rg for a spinning NS) via disc reflection. In addition, the reflection fit yields a low inclination estimate of ∼33°. However, the bursting properties of this source suggest that XTE J1739–285 is a relatively high-inclination system, 65° < i < 90°, (Bult et al. 2021). The lack of dips or eclipses in the NICER and NuSTAR light curves further indicates that we are not viewing the system edge-on, allowing an upper limit on the inclination of i ≤ 75° (Frank, King & Lasota 1987). We note that the inclination obtained with reflection spectroscopy is for the inner accretion disc and can possibly be different from the binary inclination (Wang et al. 2020).
In this work, we have shown that the disc of XTE J1739–285 is truncated well above the stellar surface. A truncated disc has not been indicated for this source in the prior investigations. The sensitive and pile-up free NuSTAR spectrum of this source allows us to put such a strong radius constraint. The inferred inner disc radius seems consistent with the observed low luminosity (low/hard state). This kind of larger inner disc radius of ∼15−30 Rg has been observed before for a number of other moderate-luminosity, intermittent NS LMXBs (Miller et al. 2011; Papitto et al. 2013; Iaria et al. 2016; King et al. 2016; Pintore et al. 2016). Below, we discuss some of the possibilities leading to the disc truncation.
The disc truncation is likely the result of either a state transition associated with a receding disc, a boundary layer, or a magnetic field exerting pressure on the disc. Esin, McClintock & Narayan (1997) suggest that a receding disc from a state transition is typically associated with low-luminosity and a hard power-law dominated X-ray spectra. The XTE J1739–285 spectra presented here are observed in the hard, low-luminosity state (∼1.21 × 1036 erg s−1). The continuum emission at energies of >8 keV is strongly dominated by the hard power-law component. Thus, a state transition may play a significant role in the disc truncation as the source shows irregular pattern of X-ray outbursts, and its flux evolved considerably over time. To establish the state transitions in the system, multiple observations of the outburst cycle akin to the one observed in 2020 are required.
We have discussed some of the possibilities of disc truncation mechanism. We find that the radial extent of the boundary layer is smaller than the disc truncation radius. So, this possibility of disc truncation can be ruled out. Moreover, this single observation cannot confirm whether a state transition is responsible for the disc truncation. But truncation by the magnetosphere can not be ruled out as the position of the magnetospheric radius is consistent with the position of the inner disc. However, multiple observations of different mass accretion rates may be helpful in determining the definitive truncation mechanism for this system.
ACKNOWLEDGEMENTS
We thank the anonymous referee for the comments, which have improved this work much. This research has made use of data and/or software provided by the High Energy Astrophysics Science Archive Research Centre (HEASARC). This research also has made use of the NuSTAR data analysis software (NuSTARDAS) jointly developed by the ASI Science Center (ASDC, Italy) and the California Institute of Technology (Caltech, USA). This work is supported by NASA through the NICER mission. ASM and BR would like to thank Inter-University Centre for Astronomy and Astrophysics (IUCAA) for their facilities extended to them under their Visiting Associate Programme.
DATA AVAILABILITY
Both observational data sets with Obs IDs 90601307002 (NuSTAR) and 2050280129 (NICER) dated 2020 February 19 are in public domain put by NASA at their website https://heasarc.gsfc.nasa.gov.
