


ABSTRACT
Improving direct detection capability close to the star through improved star subtraction and post-processing techniques is vital for discovering new low-mass companions and characterizing known ones at longer wavelengths. We present results of 17 binary star systems observed with the Magellan adaptive optics system (MagAO) and the Clio infrared camera on the Magellan Clay Telescope using binary differential imaging (BDI). BDI is an application of reference differential imaging (RDI) and angular differential imaging (ADI) applied to wide binary star systems (2 arcsec <Δρ < 10 arcsec) within the isoplanatic patch in the infrared. Each star serves as the point spread function (PSF) reference for the other, and we performed PSF estimation and subtraction using principal component analysis. We report contrast and mass limits for the 35 stars in our initial survey using BDI with MagAO/Clio in L′ and 3.95 µm bands. Our achieved contrasts varied between systems, and spanned a range of contrasts from 3.0 to 7.5 magnitudes and a range of separations from 0.2 to 2 arcsec. Stars in our survey span a range of masses, and our achieved contrasts correspond to late-type M-dwarf masses down to ∼10 MJup. We also report detection of a candidate companion signal at 0.2 arcsec (18 au) around HIP 67506 A (SpT G5V, mass ∼1.2 M⊙), which we estimate to be |$\sim 60-90 \, \rm{M_{Jup}}$|. We found that the effectiveness of BDI is highest for approximately equal brightness binaries in high-Strehl conditions.
1 INTRODUCTION
Giant planets on wide enough orbits to be accessible by direct imaging are rare [occurrence rate |$9^{+5}_{-4}$| per cent for 5–13 MJup companions within 10–100 au in the recent results from the Gemini Planet Imager Exoplanet Survey (GPIES); Nielsen et al. 2019]. Brown dwarf companions appear to be even more rare, with an occurrence rate of |$\sim 0.8^{+0.8}_{-0.5}$| per cent for 13–80 MJup from GPIES. Yet radial velocity, transit, and microlensing surveys have found that giant planets close to their stars are common in regions promising for future direct imaging. Bryan et al. (2019) found an occurrence rate of 39 per cent ± 7 per cent for masses 0.5–20 MJup and separations 1–20 au from radial velocity surveys; Herman, Zhu & Wu (2019) found 0.7|$^{+0.40}_{-0.20}$| planets per solar-type star for radius 0.3–1 RJup and 2–10 yr periods from Kepler (Borucki et al. 2010); Poleski et al. (2021) observed 1.4|$^{+0.9}_{-0.6}$| ice giants per microlensing star with separations ≈5–15 au from 20 yr of the OGLE microlensing survey. Improving direct detection capability close to the star is of paramount importance for increasing the directly imaged companion sample size and inferring population property statistics.
In addition to building larger telescopes and better instruments for ground- and space-based direct imaging, improving on observational and data analysis techniques can push detection limits closer and deeper. Point spread function (PSF) subtraction via reference differential imaging (RDI; commonly used with space telescopes) images the science target and a PSF reference star, but is hindered by time-varying PSFs, and requires observing two stars to reduce one. An improvement on RDI utilizes a library of PSF reference images (e.g. Sanghi, Zhou & Bowler 2022) and a locally optimized combination of images (LOCI; Lafrenière et al. 2007) to optimally reconstruct the PSF, but is still susceptible to time variation between reference and science images. Spectral differential imaging (SDI; Racine et al. 1999; Marois et al. 2000), in which the science target is imaged simultaneously in multiple filter bands, does not obtain photon-noise limited PSF subtraction due to the chromatic variation in speckles that does not scale with wavelength (Rameau et al. 2015), suffers from a difference in Strehl ratios between images in different bands, and depends on spectral features like Methane in the companion’s atmosphere. With angular differential imaging (ADI; Marois et al. 2006), the star serves as its own PSF reference through sky rotation; however, it is susceptible to self-subtraction of candidate companion signals and requires significant sky rotation to avoid flux attenuation, especially close to the star. A way to avoid these various drawbacks is to simultaneously image a science and reference star in the same filter band.
Kasper et al. (2007) simultaneously imaged 22 young stars in the Tucana and β Pictoris moving groups in L′ (∼4 µm) band on NACO/VLT with adaptive optics, including two medium separation binaries (HIP 116748, ρ = 5.8 arcsec and GJ 799, ρ = 2.8 arcsec). For these systems, both target and reference star fit on the detector simultaneously, yet were separated such that their PSFs did not overlap. They used each star in the binary to subtract the starlight from the other, termed this binary differential imaging (BDI; in fig. 5 of their paper), and saw improved contrast at close separations compared to contemporaneously imaged single stars. Similarly, Heinze et al. (2010) applied ‘binary star subtraction’ to binaries in their L′ and M′ nearby star survey with MMT AO with the Clio instrument, in which the PSF of the secondary was scaled and subtracted from the primary and vice versa. They also saw improvement in achievable contrast with binary star subtraction compared to single stars in their survey.
Rodigas et al. (2015, hereafter R15) expanded on the BDI technique by combining the advantages of simultaneous imaging with advanced data analysis algorithms like Karhunen–Loéve Image Processing (KLIP; Soummer, Pueyo & Larkin 2012) – an application of principle component analysis (PCA) to image data – to better remove the speckle structure in the PSF. They compared the expected signal-to-noise ratio (S/N) for BDI to ADI and determined that BDI is advantageous close to the star, achieving ∼0.5 mag better contrast within ∼1 arcsec, which they estimate translates to ∼1 MJup improvement in sensitivity. They also note that observing binaries near 4 µm takes advantage of the large isoplanatic patch (∼10–30 arcsec), in addition to being where young substellar companions will be bright (Baraffe et al. 2015, hereafter BHAC15). They note that a limitation of BDI is the potential for companion flux around one star to be attenuated by flux from a companion around the other star, but that there is low probability of this (∼2 per cent at 0.15 arcsec, and even smaller farther out). Additionally, while coronagraphs employing a focal plane occulter cannot easily be used with BDI, pupil-plane only coronagraphs (such as apodizing phase plates, Kenworthy et al. 2007; Otten et al. 2014) that affect the PSFs of both stars could further increase sensitivity.
R15 identified a target list of ∼140 binary systems optimized for effective BDI. Targets are young (≲200 Myr) so that brown dwarf and planetary companions will be bright at near-infrared (NIR) wavelengths. Their binary separations are between 2 and 10 arcsec so that their PSFs do not overlap and are within the isoplanatic patch at L′, and their apparent magnitudes in L′ are similar to ≲2 mag, making their PSF features have similar S/N.
In this paper, we describe the results of our MagAO/Clio NIR survey of 17 of the R15 binary star target list. In Section 2, we review current relevant studies of substellar companions in binaries. In Section 3, we describe our survey sample, with detailed descriptions of each system in Appendix A. In Section 4, we describe our BDI observations and KLIP data reduction application. In Section 5, we show contrast limits for each binary system, discuss limitations on our achievable contrast, and discuss our detection of a candidate companion to HIP 67506 A.
2 MOTIVATION: SUBSTELLAR COMPANIONS IN WIDE BINARIES
The occurrence rate of planet and brown dwarf companions in binaries, and the influence the binary has on the formation and evolution of the planetary environment, is not well understood, and is hampered by small numbers of observed systems.
Circumstellar planets in wide binaries (S-type, in which the companions orbits one component of the binary) have been shown to be fully suppressed for close binaries [semimajor axis (sma) ≲ 1 au, Moe & Kratter 2021], an occurrence rate of ∼15 per cent at sma ∼10 au, and increasing with binary separation out to sma ∼ 100 au (Kraus et al. 2016; Ziegler et al. 2020; Moe & Kratter 2021). Several recent observational studies have found a higher fraction of close-in S-type companions in multiple systems compared to single stars. (Knutson et al. 2014; Ngo et al. 2015; Piskorz et al. 2015). Ngo et al. (2016) found a ∼3 × inflation in occurrence rate of hot Jupiters in multiple systems over single stars, and infer that stellar companions beyond 50 au might actually facilitate giant planet formation. Fontanive et al. (2019) found an inflated binary fraction of 80 per cent with separations from 20 to 10 000 au for stars hosting close in higher mass planetary and brown dwarf companions (7–60 MJup). Cadman et al. (2022) showed that the binary companions can trigger instability and fragmentation in gravitationally unstable discs, leading to formation of these giant planet and brown dwarf companions in outer regions of the disc, which somehow move to the close-in orbits currently observed. However, other studies have concluded that the frequency of planets in binaries is not statistically different from that of single stars (e.g. Bonavita & Desidera 2007; Harris et al. 2012). Deacon et al. (2016) found no evidence that binaries with ρ > 3000 au affected occurrence rate of Kepler planets with P < 300 d around FGK stars. Moe & Kratter (2021) found that for sma ≳ 100 au the binary does not suppress planet occurrence, and the apparent inflated occurrence is due to selection effects.
Although it is unclear if wide (≳100 au) stellar companions are consequential to the formation of planetary systems, it is likely to impact the evolution of a planetary system through gravitational scattering and migration. While the wide binary may be too wide to induce binary von Zeipel–Kozai–Lidov oscillations (von Zeipel 1910; Kozai 1962; Lidov 1962) on an S-type planet directly (Ngo et al. 2016), it could still induce chaos in the system. Mean motion resonance overlap from the companion star leads to regions of chaotic diffusion and eventual planet ejection even in circular binary orbits (Holman & Wiegert 1999; Mudryk & Wu 2006; Kratter & Perets 2012). Simulations by Kaib, Raymond & Duncan (2013) and Correa-Otto & Gil-Hutton (2017) showed the influence of the Galactic gravitational potential and stellar flybys perturbs the wide companion’s orbit over time, causing S-type companion orbits to be disrupted, pushed into high-eccentricity orbits, and potentially scattered (see also Hamers & Tremaine 2017). The presence of an additional giant planet can further induce secular resonances (Bazsó & Pilat-Lohinger 2020) or high-e migration (Hamers 2017; Hamers & Tremaine 2017) interior to the giant planet, planet–planet scattering, and push the surviving planet into high-eccentricity orbits which could be further boosted by Kozai–Lidov cycles from the stellar companion (Mustill et al. 2022). Wide-orbit stellar companion(s) can also be sufficient to explain stellar spin-planetary orbit misalignment even if the companion is orders of magnitude more distant, including inducing retrograde obliquities (Best & Petrovich 2022).
More population members at various stages of evolution are needed to better develop the picture observationally. In addition to the surveys of Kasper et al. (2007) and Heinze et al. (2010) discussed in the introduction, several other recent surveys have looked for companions in binaries using other starlight subtraction techniques. Hagelberg et al. (2020) targeted 26 visible binary and multiple star young moving group members with SPHERE on VLT (Beuzit et al. 2008) in dual-H band filters, with a Lyot coronagraph masking the brighter star, and used ADI to subtract the starlight. The SPOTS survey (Thalmann et al. 2014; Bonavita et al. 2016; Asensio-Torres et al. 2018) searched for wide circumbinary planets in the 30–300 au range. While neither survey detected new substellar companions, they placed upper limits on occurrence rates. Dupuy et al. (2022) found evidence for mutual alignment between S-type planet and binary orbits ≲30° for Kepler planet hosts in visual binaries. Additionally, the precise astrometry of Gaia (Gaia Collaboration 2016) enabled identification of 1.3 million spatially resolved binaries (El-Badry, Rix & Heintz 2021), and several recent studies utilized the Gaia astrometric information to examine the orbit of the wide stellar companion to transiting planet host stars (e.g. Newton et al. 2019, 2021; Venner, Vanderburg & Pearce 2021), search for new unresolved companions (e.g. Kervella et al. 2019; Currie et al. ), refine the masses of known companions (e.g. Brandt, Dupuy & Bowler 2019; Brandt et al. 2021), and observe an overabundance of alignments between planet and wide binary orbits for binaries with semimajor axis < 700 au (Christian et al. 2022). Orbital obliquity alignment studies such as Bryan et al. (2020) and Xuan et al. (2020) are important probes of the angular momentum evolution of planetary systems and the influence of scattering and/or Kozai–Lidov mechanisms (Mustill et al. 2022), especially in the presence of a wide stellar companion (Hjorth et al. 2021). Future Gaia data releases will contain improved astrometry and acceleration information for hundreds of millions of sources,1 making new companion identification through astrometry common place, and promising to deliver numerous planets and brown dwarf companions in wide binaries
Multiple star systems should be prioritized as prime direct imaging targets for probing planetary system formation and evolution, population statistics, and planet characterization studies.
3 BINARY SYSTEMS IN OUR SURVEY
We observed 17 binary star systems between 2014 and 2017, chosen for their utility for BDI data reduction, to span a range of spectral types, and their availability between other observing programs. Table 1 summarizes the properties of each young binary system observed. Binary separation, distance, and the primary’s G-band magnitude were taken from Gaia EDR3 (Gaia Collaboration 2021); age and spectral type were taken from literature values; group membership is from literature and/or Banyan Σ membership probabilities (Gagné et al. 2018). Our observations were conducted in MKO L′ and the narrow-band 3.95 µm (Δλeff = 0.08 µm, λ0 = 3.95 µm; hereafter [3.95])2 filters, so we have included the primary’s WISE W1 and W2 magnitudes for reference (Cutri et al. 2012). A subset of systems were unresolved in WISE, so the photometry includes flux from both members, and are indicated with a dagger in Table 1.
Summary of binary systems.
| HD name | Alt name | Separationa, * | Distancea, ** | Age | SpT | Group | RUWEa | G maga | WISE W1 Mag | WISE W2 Mag |
|---|---|---|---|---|---|---|---|---|---|---|
| (arcsec) | (pc) | (Myr) | Membership§; | A / B | A / B | (3.35 µm) | (4.6 µm) | |||
| HD 36705 | AB Dor | 8.8609 ± 50 | 14.93 ± 0.02 | 100b | K0V + M5-6c | AB Dor | 25.13 / 3.52 | 6.69 / 11.35 | 4.598 ± 0.121† | 4.189 ± 0.057† |
| HD 37551 | WX Col | 4.00175 ± 1 | 80.45 ± 0.07 | 130 ± 20d | G7V + K1Vc | AB Dore | 0.96 / 0.97 | 9.45 / 10.35 | 7.284 ± 0.027† | 7.385 ± 0.019† |
| HD 47787 | HIP 31821 | 2.15685 ± 2 | 47.83 ± 0.04 | 16.5 ± 6.5f | K1IV + K1IVc | Fieldj | 1.11 / 1.11 | 8.91 / 9.01 | 6.348 ± 0.042† | 6.457 ± 0.042† |
| HD 76534 | OU Vel | 2.06874 ± 2 | 869 ± 14 | 0.27h | B2Vni | Fieldj | 1.53 / 0.89 | 8.25 / 9.42 | 7.271 ± 0.029† | 7.066 ± 0.020† |
| HD 82984 | HIP 46914 | 2.0041 ± 30 | 274 ± 7 | 53.4 ± 15.1f | B4IVf | Fieldj | 1.09 / 0.89 | 5.53 / 6.26 | 5.346 ± 0.064† | 5.202 ± 0.030† |
| HD 104231 | HIP 58528 | 4.45718 ± 5 | 102.7 ± 0.5 | 21k | F5Vl | LCCm | 0.83 / 2.29 | 8.45 / 13.43 | A: 7.198 ± 0.028 | 7.248 ± 0.020 |
| B: 9.499 ± 0.228 | 9.338 ± 0.119 | |||||||||
| HD 118072 | HIP 66273 | 2.27647 ± 7 | 79.5 ± 0.4 | 40-50n | G3Vc | 90% ARGj | 1.20 / 1.20 | 9.02 / 9.14 | 6.875 ± 0.034† | 6.941 ± 0.020† |
| HD 118991 | Q Cen | 5.56444 ± 6 | 88.3 ± 0.3 | 130-140p | B8.5 + A2.5q | Sco-Cenj | 1.11 / 1.07 | 5.24 / 6.60 | 4.975 ± 0.070† | 4.629 ± 0.036† |
| HD 137727 | HIP 75769 | 2.20358 ± 3 | 111.7 ± 0.3 | 8.2 ± 0.6f | G9III + G6IVc | Fieldj | 1.42 / 0.88 | 9.16 / 9.66 | 6.739 ± 0.038† | 6.815 ± 0.020† |
| HD 147553 | HIP 80324 | 6.23216 ± 7 | 138.2 ± 1.3 | 16 ± 1k | B9.5V + A1Vs | UCLj | 0.93 / 0.89 | 7.00 / 7.46 | A: 7.039 ± 0.116 | 7.055 ± 0.026 |
| B: 7.219 ± 0.112 | 7.283 ± 0.037 | |||||||||
| HD 151771 | HIP 82453 | 6.8957 ± 3 | 270 ± 2 | 200-300t | B8III + B9.5u | Fieldj | 1.22 / 0.80 | 6.19 / 8.46 | A: 5.802 ± 0.069 | 5.696 ± 0.033 |
| B: 7.412 ± 0.302 | 7.536 ± 0.157 | |||||||||
| HD 164249 | HIP 88399 | 6.49406 ± 2 | 49.30 ± 0.06 | 25 ± 3v | F6V + M2Vc | Beta Picw, x | 1.09 / 1.23 | 6.91 / 12.31 | 5.882 ± 0.057† | 5.841 ± 0.021† |
| HD 201247 | HIP 104526 | 4.17040 ± 3 | 33.20 ± 0.04 | 200-300y | G5V + G7Vz | Fieldj | 0.96 / 0.89 | 7.53 / 7.71 | 5.211 ± 0.0657† | 5.055 ± 0.041† |
| HD 222259 | DS Tuc | 5.36461 ± 3 | 44.12 ± 0.07 | 45 ± 4α | G6V + K3Vc | Tuc-Horg | 0.91 / 0.95 | 8.34 / 9.41 | A: 7.062 ± 0.068 | 7.072 ± 0.030 |
| B: 7.089 ± 0.179 | 7.140 ± 0.056 | |||||||||
| – | HIP 67506‡ | 9.38117 ± 9 | 220 ± 2 | 210 ± 5t | G5β | Fieldj | 2.01 | 10.67 | 9.189 ± 0.021 | 9.242 ± 0.023 |
| – | TYC 7797-34-2‡ | 1700 ± 100 | – | – | Fieldj | 1.73 | 11.99 | 9.475 ± 0.023 | 9.561 ± 0.021 | |
| – | TWA 13 | 5.06925 ± 3 | 59.9 ± 0.1 | 10|$^{+10}_{-7}{}^{\rm {\gamma }}$| | M1Ve + M1Vec | TW Hydraδ | 1.25 / 1.27 | 10.89 / 10.91 | A: 7.635 ± 0.052 | 7.545 ± 0.030 |
| B: 7.408 ± 0.087 | 7.470 ± 0.030 | |||||||||
| – | 2MASS J01535076- | 2.8543 ± 10 | 33.85 ± 0.09 | 25 ± 3v | M3ϵ | Beta Picw | 1.36 / 1.38 | 11.49 / 11.52 | 6.810 ± 0.028† | 6.729 ± 0.014† |
| 1459503 |
Notes. *Uncertainties in units of 10−5 arcsec.
**Distances and uncertainties are were computed using the method of Bailer-Jones et al. (2018) and Gaia EDR3 parallaxes.
§;Sco-Cen: Scorpius-Centaurus Association, UCL: Upper Centaurs Lupis association, Tuc-Hor: Tucana-Horologium Young Moving Group, ARG: Argus Association, Beta Pic: Beta Pictoris Moving Group, AB Dor: AB Doradus Moving Group, LCC: Lower Centaurus-Crux.
†Binary is unresolved in WISE photometry.
‡HIP 67506 and TYC 7797-34-2 (WDS J13500-4303 AB) were believed to be a 9 arcsec binary at the time of the survey, but we show in this work that they are an unassociated pair. This has no impact on the BDI reduction of both stars. See Appendix A. There are no age or spectral type estimates in literature for TYC 7797-34-2.
(a) Gaia EDR3, Gaia Collaboration 2021, (b) Mamajek & Hillenbrand 2008, (c) Torres et al. 2006, (d) Binks, Jeffries & Wright 2020; Barrado y Navascués, Stauffer & Jayawardhana 2004, (e) McCarthy & White 2012, (f) Tetzlaff, Neuhäuser & Hohle 2011, (g) Kraus et al. 2014, (h) Arun et al. 2019, (i) Houk 1978, (j) Gagné et al. 2018, (k) Pecaut, Mamajek & Bubar 2012, (l) Houk & Cowley 1975, (m) Hoogerwerf 2000, (n) Zuckerman et al. 2019, (p) David & Hillenbrand 2015, (q) Gray & Garrison 1987, (s) Corbally 1984, (t) This work, Section 3, (u) Corbally 1984, (v) Messina et al. 2016, (w) Messina et al. 2017, (x) Deacon & Kraus 2020, (y) Zuckerman et al. 2013, (z) Gray et al. 2006, (α) Bell, Mamajek & Naylor 2015, (β) Spencer Jones & Jackson 1939, (γ) Barrado Y Navascués 2006, (δ) Schneider, Melis & Song 2012, (ϵ) Riaz, Gizis & Harvin 2006.
We have made use of literature ages for the estimation of mass limits in Section 5. Age estimates we adopted were derived using a variety of methods; specifics for each binary system are noted in Table 1 and described in Appendix A. We used the most-recent and lowest-uncertainty age estimate for an individual star where available; most were derived using isochrone model fitting to photometry, lithium equivalent widths, or chromospheric and coronal activity. Where individual age estimates were not available we adopted the average age and uncertainty for the associated moving group. Two systems in our survey did not have literature ages or moving group membership (HIP 67506/TYC 7797-34-2 and HD 151771), and we estimated age using isochrone fitting (see Appendix A for details). In Section 5, we discuss the impact the estimated age of the star has on our results.
4 METHODS
4.1 Observations
Observations for this survey were carried out between 2014 and 2017 with MagAO (Close et al. 2013) and Clio science camera on the 6.5 m Magellan Clay telescope at Las Campanas Observatory, Chile. All images were obtained in [3.95] or MKO L′ observing bands with the narrow camera (plate scale = 15.9 mas pixel−1, field of view = 16 × 18 arcsec; Morzinski et al. 2015) in full frame mode (512 × 1024 pixels), and with the telescope rotator off. Observation parameters varied between data sets and are documented in Table 2. There were two observing modes: ABBA Nod mode, in which two nod positions (A and B) with both stars on the detector, 10 frames each, were alternated in an ABBA pattern during the observations; and ‘Sky’ mode, where science frames were observed in a single nod and the telescope was offset to get starless ‘sky frames’.
Summary of observations and results by binary system.
| System | Obs. | Obs. | Nimages | Filter | Tint | Ncoadds | Obs. | Binary | Inner | Outer | NKLIP | Best | Mass | ||
|---|---|---|---|---|---|---|---|---|---|---|---|---|---|---|---|
| date | mode* | (s) | Δmag | Sep (arcsec) | sep† | sep | modes | contrast | limit | ||||||
| PA (deg) | (au) | (Δmag) | (M⊙) | ||||||||||||
| HD 36705 | 2017-02-18 | ABBA | 28 | [3.95] | 5 | 6 | 2.0 | 8.881 ± 0.003″ | 4 | 1.5″ | A | 20 | 5.3 | 0.07 | at 0.9″, 10 AU |
| 347.57 ± 0.05° | 22 AU | B | 20 | 6.8 | 0.01 | at 1.5″, 20 AU | |||||||||
| HD 37551 | 2014-11-26 | Sky | 167 | [3.95] | 5 | 2 | 0.4 | 4.0165 ± 0.0006″ | 17 | 1.5″ | A | 15 | 7.8 | 0.02 | at 1.3″, 110 AU |
| 115.167 ± 0.007° | 120 AU | B | 15 | 7.5 | 0.02 | at 1.3″, 110 AU | |||||||||
| HD 47787 | 2017-02-11 | ABBA | 10 | [3.95] | 3 | 20 | 0.1 | 2.178 ± 0.003″ | 10 | 1.6″ | A | 9 | 6.0 | 0.01 | at 1.0″, 50 AU |
| 201.46 ± 0.07° | 72 AU | B | 9 | 5.75 | 0.01 | at 1.1″, 50 AU | |||||||||
| HD 76534 | 2017-02-18 | ABBA | 63 | [3.95] | 5 | 6 | 2.1 | 2.0794 ± 0.0009″ | 190 | 1.2″ | A | 10 | 5.0 | 0.39** | at 1.0″, 860 AU |
| 303.94 ± 0.04° | 970 AU | B | 10 | 3.0 | 0.39** | at 1.0″, 860 AU | |||||||||
| HD 82984 | 2015-05-29 | ABBA | 16 | [3.95] | 4 | 5 | 0.7 | 2.018 ± 0.006″ | 60 | 1.2″ | A | 15 | 6.5 | 0.47 | at 0.5″, 140 AU |
| 220.69 ± 0.03° | 300 AU | B | 15 | 6.5 | 0.31 | at 0.8″, 200 AU | |||||||||
| HD 104231 | 2017-02-18 | Sky | 49 | [3.95] | 5 | 6 | 1.7 | 4.479 ± 0.001″ | 22 | 2.4″ | A | 30 | 5.5 | 0.04 | at 1.9″, 1.9 AU |
| 161.45 ± 0.01° | 240 AU | B | 30 | 6.0 | 0.009 | at 1.1″, 110AU | |||||||||
| HD 118072 | 2015-05-29 | Sky | 10 | [3.95] | 3 | 5 | 0.06 | 2.28 ± 0.03″ | 18 | 1.6″ | A | 7 | 5.0 | 0.06 | at 1.0″, 80 AU |
| 80.7 ± 0.9° | 120 AU | B | 15 | 6.3 | 0.02 | at 1.3″, 100 AU | |||||||||
| 2017-02-19 | Sky | 35 | [3.95] | 5 | 6 | 0.06 | 2.290 ± 0.002″ | 18 | 1.6″ | A | 30 | 4.0 | 0.12 | at 1.1″, 90 AU | |
| 79.49 ± 0.05° | 120 AU | B | 10 | 4.0 | 0.13 | at 0.4″, 30 AU | |||||||||
| HD 118991 | 2015-05-30 | ABBA | 16 | [3.95] | 4 | 5 | 0.8 | 2.29 ± 0.03″ | 20 | 1.2″ | A | 15 | 5.5 | 0.40 | at 0.7″, 60 AU |
| 162.91 ± 0.01° | 100 AU | B | 15 | 5.5 | 0.27 | at 0.6″, 55 AU | |||||||||
| HD 137727 | 2017-02-20 | ABBA | 18 | [3.95] | 3 | 10 | 1.0 | 2.2108 ± 0.0006″ | 25 | 1.2″ | A | 17 | 4.5 | 0.09 | at 1.1″, 120 AU |
| 185.3 ± 0.1° | 150 AU | B | 17 | 4.5 | 0.04 | at 0.6″, 70 AU | |||||||||
| HD 147553 | 2015-05-24 | Sky | 52 | [3.95] | 4 | 3 | 0.2 | 6.274 ± 0.004″ | 30 | 0.8″ | A | 15 | 5.8 | 0.04 | at 0.5″, 70 AU |
| 152.48 ± 0.04° | 110 AU | B | 3 | 6.3 | 0.02 | at 0.5″, 70 AU | |||||||||
| 2015-06-02 | ABBA | 31 | [3.95] | 4 | 10 | 0.2 | 6.259 ± 0.002″ | 30 | 0.8″ | A | 30 | 5.8 | 0.04 | at 0.8″, 100 AU | |
| 152.478 ± 0.008° | 110 AU | B | 30 | 5.5 | 0.04 | at 0.7″, 100 AU | |||||||||
| HD 151771 | 2017-09-05 | ABBA | 25 | [3.95] | 5 | 1 | 1.3 | 6.79 ± 0.01″ | 55 | 1.2″ | A | 20 | 6.3 | 0.66 | at 0.6″, 170 AU |
| 4.8 ± 0.2° | 300 AU | B | 20 | 6.0 | 0.43 | at 0.6″, 170 AU | |||||||||
| HD 164249 | 2017-09-04 | ABBA | 54 | [3.95] | 3.5 | 1 | 2.3 | 6.547 ± 0.007″ | 10 | 1.2″ | A | 30 | 4.5 | 0.08 | at 0.7″, 40 AU |
| 89.52 ± 0.03° | 75 AU | B | 30 | 3.0 | 0.04 | at 0.6″, 30 AU | |||||||||
| HD 201247 | 2015-05-24 | ABBA | 34 | [3.95] | 4 | 3 | 0.1 | 4.190 ± 0.003″ | 6 | 1.2″ | A | 5 | 7.5 | 0.03 | at 0.9″, 30 AU |
| 132.31 ± 0.02° | 37 AU | B | 30 | 7.3 | 0.03 | at 0.9″, 30 AU | |||||||||
| 2017-09-02 | ABBA | 30 | [3.95] | 5 | 6 | 0.1 | 4.216 ± 0.003″ | 6 | 1.6″ | A | 3 | 5.5 | 0.09 | at 0.5″, 20 AU | |
| 132.61 ± 0.03° | 50 AU | B | 5 | 6.0 | 0.06 | at 1.0″, 35 AU | |||||||||
| HD 222259 | 2015-06-03 | Sky | 25 | [3.95] | 4 | 10 | 0.4 | 5.388 ± 0.002″ | 10 | 1.8″ | A | 24 | 6.5 | 0.01 | at 1.1″, 50 AU |
| 347.76 ± 0.01° | 82 AU | B | 24 | 6.5 | 0.01 | at 1.1″, 50 AU | |||||||||
| 2017-09-05 | ABBA | 32 | [3.95] | 5 | 1 | 0.4 | 5.391 ± 0.005″ | 10 | 0.8″ | A | 10 | 5.0 | 0.04 | at 0.5″, 20 AU | |
| 347.82 ± 0.04° | 33 AU | B | 10 | 5.0 | 0.03 | at 0.5″, 20 AU | |||||||||
| HIP 67506 | 2015-05-31 | Sky | 44 | MKO L′ | 0.6 | 20 | 0.4 | 9.424 ± 0.004″ | 50 | 1.43″ | 30 | 6.5 | 0.03 | at 0.8″, 90 AU | |
| TYC 7797-34-2 | 326.92 ± 0.02° | 140 AU | 30 | 6.5 | 0.02 | at 0.8″, 1500 AU | |||||||||
| / 2600 AU | |||||||||||||||
| TWA 13 | 2015-05-23 | ABBA | 27 | MKO L′ | 0.5 | 200 | 0.05 | 5.080 ± 0.007″ | 15 | 1.6″ | A | 10 | 4.8 | 0.02 | at 0.5″, 30 AU |
| 327.27 ± 0.09° | 90 AU | B | 25 | 4.8 | 0.02 | at 0.5″, 30 AU | |||||||||
| 2MASS J01535076- | 2017-09-05 | ABBA | 132 | [3.95] | 4 | 1 | 0.1 | 2.875 ± 0.006″ | 8 | 1.6″ | A | 10 | 6.0 | 0.01 | at 1.2″, 40 AU |
| 1459503 | 291.1 ± 0.1° | 50 AU | B | 3 | 5.8 | 0.01 | at 0.6″, 20 AU |
Notes. *Two observing modes: ABBA – two nods, A and B, 10 frames each, alternating in an ABBA pattern throughout observation; Sky: one nod position and a set of ‘sky’ frames without stars in the frame.
**The age of HD 76534 is < 1Myr below the age range of most isochrone models.
†All systems used inner working angle of 1.7 λD−1 = 0.2 arcsec.
Nimages is the number of images used in the KLIP reduction; Ncoadds is the number of coadded frames per image; Observed Δmag is the contrast in magnitudes measured in our survey between components A and B; Binary separation (sep) and position angle (PA) are the mean and standard deviation of position measurements of images in each data set; Inner/outer sep are the inner and outer radius of working mask for BDI reduction; NKLIP modes records the number of basis modes used in the KLIP reduction of the star.
4.2 Data reduction
Due to the difficulty of flat-fielding Clio images (see Morzinski et al. 2015, Appendix B.3), we performed sky subtraction using KLIP (Soummer et al. 2012), an implementation of PCA applied to image data. To sky subtract a science image from Nod A (in ABBA observing mode) with KLIP, we:
masked the stars in every Nod B image in the data set to a radius of 8 λ/D to capture variation in the sky alone,
constructed a PCA eigenimage basis set from the Nod B images in the data set, following the prescription of Soummer et al. (2012) Section 2.2 step 2,
projected the Nod A target image on to the eigenbasis constructed from Nod B up to a desired number of basis modes Kklip (Soummer et al. 2012, Section 2.2 step 4), to create a sky estimator,
subtracted the sky estimator from the Nod A image.
We repeated this process for Nod B images using a basis constructed from all Nod A images in the data set. For data sets observed in ‘Sky’ mode, we constructed the basis set from the sky frames. All data sets were sky subtracted with Kklip ≤ 5. We then corrected bad pixels using the bad pixel maps of Morzinski et al. (2015); we also used a high-pass filter and flagged pixels with excessive variation during the course of the data set to identify and correct additional bad pixels. Bad pixels within star PSFs were identified by eye and corrected. Finally, images were inspected for quality by eye, and sharpest images were kept for use in starlight subtraction. None of the images in our survey fell outside the linear regime and did not require linearity correction.
4.3 KLIP PSF subtraction
As with sky subtraction, we subtracted the star’s PSF using a custom implementation of KLIP PSF subtraction. Our algorithm, illustrated in Fig. 1, proceeds in the following way:

Illustration of our BDI implementation of the KLIP methodology. This process is repeated for Star B using Star A as the eigenbasis.
Each star is cut out of each cleaned and sky-subtracted full frame image into a ‘postage stamp’ and assembled into a cube of all images of Star A and another cube of Star B.
Each image in each cube is registered (PSF core centred in frame), normalized (entire frame is divided by the sum of all pixels in the frame so that the pixel values all now sum to one), and the inner core of the PSF is masked to avoid fitting the PSF core and prioritize fitting the PSF wings. We determined a radius of 1λ/D for the inner core mask was optimal for our data by inspection. We did not have any saturated stars in our data sets.
For the Star A cube, a PCA eigenbasis set is constructed from the Star B cube, following the prescription of Soummer et al. (2012) Section 2.2 as before.
Each image in the Star A cube is projected on to the Star B basis set up to specified number of modes Kklip to create a PSF estimator, then the PSF estimator is subtracted from the Star A image.
Each image is rotated to North up/East left, then a sigma-clipped mean image of the cube is created as the final reduced image. PSF estimation via ADI was not employed in our analysis.
Repeat 3–5 for the Star B cube using Star A to create eigenbasis.
Postage stamp size varied by data set due to the binary separation (star PSFs must be able to be isolated), proximity to glints and detector defects, and proximity to the edge of the frame. One system in our initial survey, 53 Aquarii, is a 1.2 arcsec binary, which ended up being too close to effectively separate the PSFs to serve as references for KLIP and was excluded. Another system, WDS J00304−6236, is a triple system, with WDS J00304−6236 Aa,Ab separated by 0.1 arcsec, enough to cause elongation of Star A’s PSF and disqualifying it from serving as a PSF reference to WDS J00304−6236 B and was excluded.
4.4 Contrast and mass limits
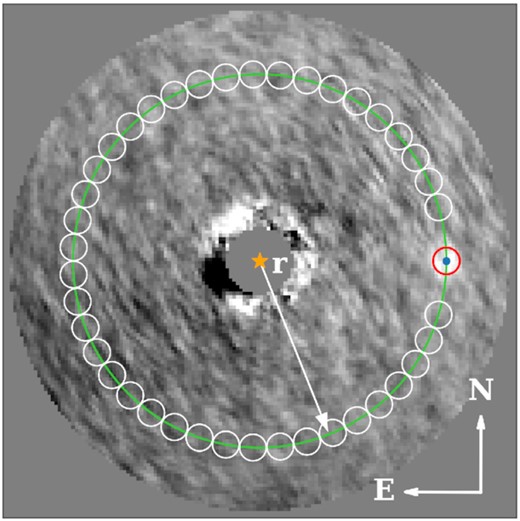
Illustration of our method for determining signal to noise ratio (S/N) based on Mawet et al. (2014). The image is a post-BDI reduction of HD 82984 A with a fake signal injected right at the 5σ S/N limit at separation r = 7λ/D and position angle 270° East of North. HD 82984 A is behind the mask and marked with an orange star. The sum of the pixels within the red aperture, with diameter = 1λ/D, is |$\bar{x}_1$| in equation (1); the mean and standard deviation of the sum of the pixels in the white apertures are |$\bar{x}_2$| and s2 respectively; n2 is the number of white apertures. This computation was repeated for all N = 2πr apertures along the ring of radius r, and for rings of radius r = nλ/D, where n is an integer.
For each system, we determined an apparent L′ or [3.95], as appropriate to the observation, magnitude for the primary star by retrieving the WISE W1 (λcentral = 3.35 µm) and W2 (λcentral = 4.6 µm) and interpolating an apparent magnitude at L′ or [3.95] using spectral type models from CALSPEC (HST flux standard spectra, Bohlin, Gordon & Tremblay 2014). We converted the apparent 5σ contrast limits to absolute magnitudes using the distances in Table 1. We determined an age for each system from literature, and used the age and contrast limit absolute magnitude as constraints to interpolate a mass from evolutionary models. For mass limits in the stellar regime, we used isochrones from the BHAC15 evolutionary models; for substellar regime, we used the Marley et al. (2021) evolutionary models. For observations in [3.95] filter, we re-interpreted for the [3.95] filter in Clio by computing synthetic photometry for each isochrone point under the assumption of a 2.3 mm PWV atmospheric transmission model (ATRAN, Lord 1992) and airmass of 1.0. As noted in Section 3, we were unable to determine a literature age for two systems, HIP 67506 and HD 151771, and used BHAC15 and SYCLIST isochrones, respectively, to interpolate an estimated age, which we then used with BHAC15 to convert contrast limits to mass estimates in the same manner.
5 RESULTS
We report in Table 2 a summary of the deepest contrast achieved for each binary system as a function of number of KLIP modes (NKLIP) and separation in arcseconds and au. Contrast is reported in units of Δlog10(flux) between injected companion signal and host star at the 5σ level, with corresponding mass in M⊙. Fig. 3 displays the results of our pipeline for HD 37551. Fig. 3 (top) shows the reduced images of HD 37551 A (left) and B (right), with the inner 1 λ/D and outer ring masked. Fig. 3 (bottom) shows the 5σ flux contrast limits (left) and mass limits (right) for A (purple) and B (red) as a function of separation in au and arcseconds. Similar plots for all stars in our survey are included in the supplementary material and are available online.
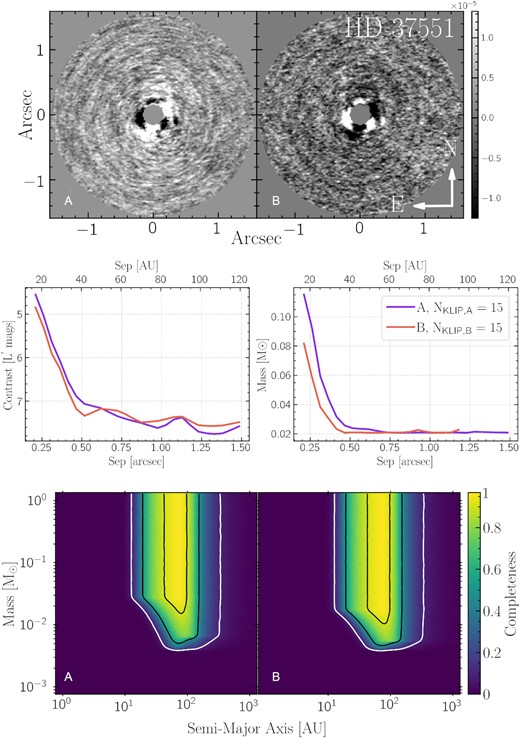
Results of BDI-KLIP reduction of HD 37551. Top: reduced image of HD 37551 A reduced with HD 37551 B as reference (left) and vice versa (right) using 15 KLIP modes. North is up and East is to the left in both images. Middle: Contrast limits (left) and mass limits (right) as a function of separation for HD 37551 A (purple) and HD 37551 B (red). These are the deepest contrast and mass limits in our survey, reaching as low as 5 MJup in to 40 au for both A and B. Bottom: Survey completeness maps for both stars for a grid of (semimajor axis, mass) pairs. Colour map indicates fraction of simulated companions which would have been detected at each grid point. Contours indicate 10 per cent (white), 50 per cent, and 90 per cent (inner-most contour) of simulated companions detected.
5.1 Factors affecting contrast and mass limits
Variable conditions. We found that variable conditions during the observations dramatically affected achievable contrast. Similarly, bad pixels, poor pixel correction, a high background level relative to star peak also decreased achievable contrast. We found that limiting the data sets to only the very best quality images achieved deeper contrast limits compared to having more lower quality images in the basis set. For each data set, we inspected by eye and retained only the sharpest images. In Table 2, we report the number of images used in the final reduction for each data set (Nimages). The varying levels of contrast achieved from data set to data set is mostly a function of the image quality of that particular observation; i.e. the highest Strehl images achieved the deepest contrast limits.
Number of KLIP basis modes. We also found that the optimal number of KLIP modes to obtain the deepest contrast varied between data sets. Fig. 4 displays an example of contrast limits as a function of KLIP modes for TWA 13 A. In this example, there is dramatic improvement in contrast for NKLIP > 7, and the deepest contrast is achieved at NKLIP = 10 at 0.5 arcsec (4 λ/D). The optimal NKLIP for each system is reported in Table 2.
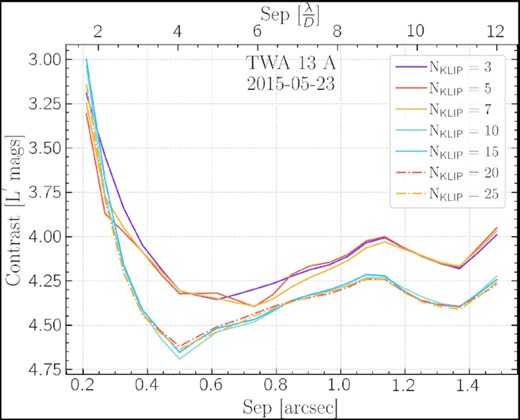
Contrast for TWA 13 A as a function of number of basis modes (NKLIP). The deepest contrast is achieved at NKLIP = 10 for this system. Optimal number of basis modes varies between data sets and is reported in Table 2.
Binary contrast. The binary stars’ contrast, reported as ΔMag in Table 2, also affected the depth of the companion search. The strength of BDI relies on achieving identical PSF signal-to-noise between reference and target star, which will vary inversely with flux ratio between the two stars. In our survey, achieved contrast was generally poorer for systems with higher binary contrast.
Age. Finally, the assumed age for the system affects the final mass limits we derived from our measured contrast limits. As discussed in Sections 3 and 4.4, we made use of literature ages to derive mass limits corresponding to our contrast limits for each system. For limits in the substellar regime, this introduces some uncertainty that is not captured in the reported mass limits, as luminosity in the infrared depends on age for substellar objects. For some systems in our survey there were several discrepant ages in the literature; for others, there was no independent age for the system, and we assumed the average age of the associated moving group, which has a range of possible ages of members. For systems with literature age estimates, they were typically derived from model fitting, which can vary with the assumptions underlying the model. Details of the age we used for each system are described in Appendix A. Substellar objects cool with age, so for two hypothetical objects with the same properties but different ages, the younger one will appear brighter than the older one in observations. So if the actual age of our system were younger than the age we assumed, our contrast limits would correspond to lower mass limits, and vice versa. In most cases, the effect on limits would be minimal. For example, 2MASS J01535076−1459503 is a Beta Pictoris Moving Group member (Messina et al. 2017), and we adopted the moving group age of 25 ± 3 Myr (Messina et al. 2016). Computing corresponding mass limits for ages 2σ younger (19 Myr) and 2σ older (31 Myr) results in a difference of ∼0.05 MJup at the highest contrast. However in some cases there are widely discrepant ages in literature, such as for AB Dor AB, which has age estimates spanning 5–240 Myr. This results in a ∼15 MJup difference in the mass limits at the highest contrast between the youngest and oldest ages estimates. Our reported mass limits and completeness estimates assume the age given in Table 1 for each system, and the variation induced by differing ages in not captured in those limits.
5.2 Notable system results
Here, we discuss some notable results of select binary systems in our sample. The results for the remaining objects in our survey are available digitally.3
5.2.1 HD 37551 – the deepest contrast
HD 37551 achieved the deepest contrast limits in our sample (Δ[3.95] = 7.8 and 7.6 mag) at the deepest points for A and B, respectively. This data set also retained the highest number of high-quality images in the final BDI reduction, due to the stable seeing conditions and AO correction throughout the observation. We did not identify any candidate companion signals in the reduced images. Fig. 3 displays the reduced images and corresponding contrast and mass limits for HD 37551.
5.2.2 HD 36705 – the effect of binary contrast
HD 36705 is the most extreme case of the effect of binary contrast on the reduction in our sample. HD 36705 A is a nearby (15 pc) bright (Gaia G mag = 6.7) K0V type star with an M5-6 binary companion. We observed Δ[3.95] ≈ 2. Fig. 5 displays a single image from the HD 36705 data set with a ZScale stretch to emphasize faint PSF features.
![Top: A selected image of HD 36705 A (left) and HD 36705 B (right) from our 2017 data set, shown with a ZScale stretch to emphasize the faint PSF features, with grey scale showing pixel counts. The image of the two stars appear significantly different due to their large relative contrast (Δmag ≈ 2) and the brightness of HD 36705 A in the MagAO [3.95] filter, with many features visible on A lost in the noise for B. This resulted in contrast limits when used to perform BDI due to insufficient starlight subtraction. Bottom: A selected image from the 2015 epoch HD 222259 observation, shown with a ZScale stretch. The HD 222259 A PSF (left) contains a glint (bottom left corner), HD 222259 B (right) contains a different glint (bottom of frame); both PSF cores are elongated. These features show up prominently in the BDI reduction.](https://oup.silverchair-cdn.com/oup/backfile/Content_public/Journal/mnras/515/3/10.1093_mnras_stac2056/1/m_stac2056fig5.jpeg?Expires=1750340183&Signature=xld6GOF3nO3pJipWcbzSUpXp9jB6zN2W13bq216VwHSK-PZOmBcGivJDNQqU1J63~5mpdtcqjxmRwK69kuKxkpLZbtOslJFnXylgWlSdLb5hx5Bjluy5EdfR4MCqbhqG2ye7b2OCmKQgC0VbtU7zP~qqo7E9aG5EwYRH38iXiSZLCLPFnvXuyezxSrLGFF1mXbNmYoIPE1OBnDEKanUx87qjEgNrkXNG~eusPdk~ziknAT4TL-NxoGF-bcqCccbhLZYKLaJIg5Ip4dHSNvJnU3Lp5jyWtXGIxeNnMMmlP7DaAyvdtH-oy3pGY8vJxxKIOO7SyK9JQoxspmFcqJzK6w__&Key-Pair-Id=APKAIE5G5CRDK6RD3PGA)
Top: A selected image of HD 36705 A (left) and HD 36705 B (right) from our 2017 data set, shown with a ZScale stretch to emphasize the faint PSF features, with grey scale showing pixel counts. The image of the two stars appear significantly different due to their large relative contrast (Δmag ≈ 2) and the brightness of HD 36705 A in the MagAO [3.95] filter, with many features visible on A lost in the noise for B. This resulted in contrast limits when used to perform BDI due to insufficient starlight subtraction. Bottom: A selected image from the 2015 epoch HD 222259 observation, shown with a ZScale stretch. The HD 222259 A PSF (left) contains a glint (bottom left corner), HD 222259 B (right) contains a different glint (bottom of frame); both PSF cores are elongated. These features show up prominently in the BDI reduction.
The image for HD 36705 A (left) is bright with many features apparent with strong signal-to-noise. Several rings of the Airy pattern and a second set of diffraction spikes (oriented left-right) visible for A which are lost in the noise for B. Fig. 6 (top) shows the reduced image for HD 36705 A (left), in which both sets of diffraction spikes are visible in the residuals, showing incomplete starlight subtraction. The resulting contrast limits are poor, especially for A, due to the residual starlight.
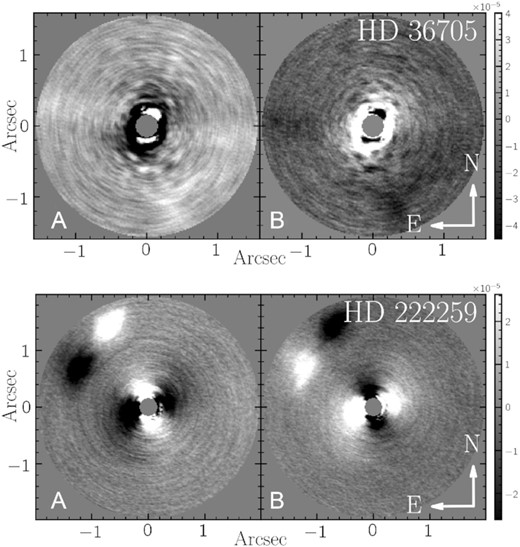
Top: BDI reduction of HD 36705 using 20 KLIP modes. North is up and East is to the left in both images. HD 36705 A is significantly brighter than HD 36705 B, and PSF features visible in A are lost to noise in B, resulting in poor starlight subtraction and contrast limits, particularly for A. Bottom: BDI reduction of HD 222259 using 24 KLIP modes. North is up and East is to the left in both images. Regions of bright and dark pixels in the upper northeast corner are due to the ghosts visible in Fig. 5, as are bright and dark areas in the central regions.
As there was no infrared excess observed for this system (see Appendix A), we interpret the apparent ‘fuzziness’ of the residuals near the core of HD 36705 B to be due to incomplete starlight subtraction and not physical features. We do not expect either of the known stellar companions to be visible in our reduction as they both have separations <0.2 arcsec.
5.2.3 HD 222259 – the effect of instrument ghosts
The 2015 observation of HD 222259 contained an elongated PSF core shape due to residual vibrations from suboptimal tip/tilt gain setting, as well as different optical ghosts to the lower left of each star, shown in Fig. 5 (bottom). These features show up clearly in the BDI reduction in Fig. 6 (bottom) as positive and negative valued areas to the north-east and around the centre masked region in both reduced images, and degraded the achieved contrast. Neither of these features are present in the 2017 epoch observation of HD 222259.
5.2.4 HIP 67506 – a candidate companion signal
The BDI reduction of HIP 67506 contains a promising candidate companion signal, marked with a red circle in Fig. 7, which shows the BDI reduction of HIP 67506 and TYC 7797-34-2 (labelled A and B) in MKO L′ reduced with 30 KLIP modes. The candidate signal, located at separation ≈1.3 λ/D (≈0.2 arcsec) and position angle ≈ 90°, is more similar to a PSF shape than any other features in reduced images in our survey, although it is distorted due to its proximity to the star core. The candidate signal rotated with the sky and did not smear azimuthally like the other features at similar separation.
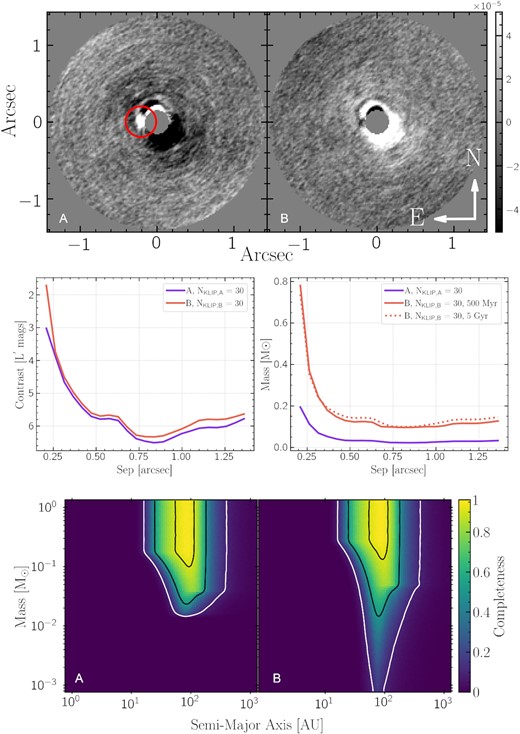
Top: BDI reduction of HIP 67506 (labelled A) and TYC 7797-34-2 (labelled B) using 30 KLIP modes. North is up and East is to the left in both images. The candidate companion signal is located ∼0.2 arcsec (∼2λ/D) to the east of HIP 67506 (behind mask), indicated by the red circle. The candidate signal rotated with the sky rotation, unlike the azimuthally broadened features at similar separation. Middle: contrast curves for HIP 65706 and TYC 7797-34-2. We show mass limits for TYC 7797-34-2 using a young age (500 Myr) and a field age (5 Gyr). Bottom: Completeness map for HIP 65706 and TYC 7797-34-2. Contours show 10 per cent, 50 per cent, and 90 per cent completeness.
Other lines of evidence. HIP 67506 has an elevated RUWE in EDR3 (RUWE = 2.02; see Appendix A), indicating the possible presence of a companion unresolved in Gaia that caused it to deviate from the assumed single-star model (Lindegren 2018). RUWE has been shown to be highly sensitive to the presence of unresolved subsystems (Belokurov et al. 2020; Penoyre et al. 2020; Stassun & Torres 2021). Additionally, HIP 67506 has a statistically significant acceleration (χ2 = 24) in the Hipparcos-Gaia Catalog of Accelerating Stars (HGCA, Brandt 2018). Kervella et al. (2019) computed a statistically significant (S/N = 5) proper motion anomaly in the Gaia DR2 epoch which could be caused by a ∼230 MJup object at the candidate signal separation of 18 au (0.2 arcsec). Similarly, the Kervella, Arenou & Thévenin (2022) PMa catalogue for Gaia EDR3 astrometry measured a PMa which could be caused by a ∼200–300 MJup object at 18 au.
While RUWE is the most complete and easy to interpret metric (Lindegren 2018), other metrics in Gaia can probe multiplicity. Perturbations of the source photocentre (caused by orbiting unresolved objects) compared to the centre-of-mass motion (which moves as a single star) will cause the observations to be a poor match to the fitting model, which registers as excess noise via the astrometric_excess_noise parameter, and whose significance is captured in the astrometric_excess_noise_sig parameter (>2 indicates significant excess noise). The astrometric_chi2_al term reports the χ2 value of the observations to the fitting model. From the image parameter determination (IPD) phase, ipd_gof_harmonic_amplitude is sensitive to elongated PSF shapes relative to the scan direction (larger values indicate more elongation), and ipd_frac_multi_peak reports the percentage of observations which contained more than one peak in the windows.4
Table 3 shows values of these metrics for HIP 67506. The IPD parameters are small, suggesting that there are no marginally resolved sources (separation larger than the resolution limit but smaller than the confusion limit, ∼0.1–1.2 arcsec, Gaia Collaboration 2021) present in the images, however, the astrometric noise parameters are large and significant, affirming the presence of subsystems. It appears possible that the subsystem(s) affecting the astrometry are closer than 0.1 arcsec, however, the candidate signal’s position of ≈0.2 arcsec is near the resolution limit so it is not ruled out as a genuine signal by these metrics.
Gaia EDR3 multiplicity metrics for HIP 67506.
| Metric | Value |
|---|---|
| RUWE | 2.02 |
| astrometric_excess_noise | 0.22 |
| astrometric_excess_noise_sig | 75.2 |
| astrometric_chi2_al | 2277.97 |
| ipd_gof_harmonic_amplitude | 0.0099 |
| ipd_frac_multi_peak | 0 |
| Metric | Value |
|---|---|
| RUWE | 2.02 |
| astrometric_excess_noise | 0.22 |
| astrometric_excess_noise_sig | 75.2 |
| astrometric_chi2_al | 2277.97 |
| ipd_gof_harmonic_amplitude | 0.0099 |
| ipd_frac_multi_peak | 0 |
Candidate signal properties. Treating this candidate signal as a genuine companion, we estimated the mass by injecting a negative template PSF in the same manner as Section 4.4. We varied the separation, position angle, and relative contrast of the negative signal to minimize the residual root-mean-square value of pixels within a diameter = 1λ/D aperture centred on the injected signal. We estimated the contrast between star and candidate companion to be ΔL′ ≈ 5–5.5 magnitudes. We used the age of the system (≈200 Myr) and L′ magnitude to interpolate a mass estimate using BHAC15 evolutionary atmosphere models, and estimated a corresponding mass of ≈60–90 MJup, which spans the divide between high-mass brown dwarf and low-mass M-dwarf regimes. This is, however, smaller than the mass estimates derived from the PMa. Given the proximity to the star’s core, at separation ≈1.3 λ/D, it is possible that some of the companion flux was subtracted in the reduction. However, the smaller mass estimate places the candidate companion in an (age, luminosity, mass) regime with few other detected young high-mass brown dwarf companions (see Faherty et al. 2016, fig. 34), so if the small-mass estimate is valid this will be an interesting benchmark object. This makes HIP 67506 a good target for follow-up observations to confirm the companion, obtain spectral type, Teff, and log(g) estimates, and potentially a dynamical mass measurement.
5.3 Completeness
We determined the survey completeness to stellar and substellar companions using a Monte Carlo approach. Over a grid that is uniform in log(mass) ∈ [−3,0]M⊙ and log(semimajor axis) ∈ [0,3]-au we generated 5 × 10³ simulated companions for each grid point, randomly assigned orbital parameters from priors,5 and computed the projected separation. A companion was considered detectable if it fell above the contrast curve and undetectable if below. We determined completeness as the fraction of simulated companions at each grid point that would have been detected at at least SNR = 5, with 1.0 corresponding to detecting every simulated companion, and 0.0 detecting none. We computed survey completeness for each star in our survey, with contours at 10 per cent, 50 per cent, and 90 per cent of simulated companions detected.
Fig. 8 displays completeness for the entire survey, made by summing completeness maps for every star in the survey (Lunine et al. 2008; Nielsen et al. 2019). Contours and colourmap give number of stars for which the survey is complete for a given (sma, mass) pair. Stars in our survey cover a variety of separation regimes, and so individual completeness plots do not line up; additionally individual completeness plots never reach 100 per cent as some simulated planets fall outside the inner or outer working angles when projected, and become undetectable. Thus the maximum value in composite completeness plot is ∼14 stars, even though all stars have some fractional sensitivity to companions.
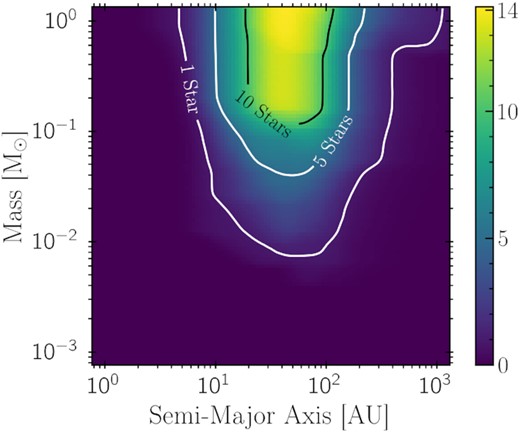
Completeness map for every star in our survey as a function of mass and semimajor axis. Colourmap and contours give the number of stars for which a given (sma, mass) pair is complete.
6 DISCUSSION
6.1 BDI performance compared to other observing modes.
R15 described several advantages to BDI over ADI or ‘classical’ RDI: (1) PA rotation is not a consideration when planning and executing observations, (2) BDI allows reducing two stars with 1 observation (2× more efficient than ADI, 4× more efficient than RDI), and (3) it targets stars often excluded from large direct imaging surveys (wide binaries). They used simulated companion injections into a single MagAO/Clio [3.95] data set of HD 37551 to determine that BDI performed ∼0.5 mag better than ADI at small separations (∼1 arcsec).
We did not explicitly test only-BDI versus only-ADI in our survey – some amount of rotation was included with each BDI data set but was not the source of diversity used to reconstruct the stellar PSF. We found that the effectiveness of our reduction depends highly on the observing conditions and image/detector quality, but these are factors which would affect both ADI and BDI equally. However, ADI is not susceptible to the contrast between the two binary components, as discussed in Section 5. R15 selected binaries with NIR Δm ≲ 2, but state this was not a strict requirement based on their analysis. We found that for systems in the regime ΔmIR ∼ 1–2, 5σ contrast limits were shallower for higher ΔmIR, as PSF features visible in the bright star do not have sufficient signal-to-noise in the fainter star to be fully subtracted. BDI is also susceptible to variation due to anisotropy, unlike ADI and SDI, and the separation between the stars should be designed to fall within the isoplanatic patch for the observing wavelength.
6.2 The scientific context of our survey
The small number of stars in our survey and their diversity of characteristics does not allow us to make meaningful contributions to the occurrence rates discussed in Section 2. The 35 stars in our survey to date span a range of spectral types, ages, (lack of) group membership, and binary separations, and were chosen for their utility in the BDI technique. This initial survey represents a contribution to probes of (sub)stellar companions in wide binaries; further observations of wide binary systems are needed to continue to fill in the picture of brown dwarfs and giant planets in wide stellar binaries.
7 CONCLUSION
We have presented the results of 17 binary star systems imaged in NIR with MagAO/Clio and reduced using BDI and PCA techniques. Our achieved contrast was limited by image quality, observing conditions, and binary star contrast. We detected a candidate companion signal around HIP 67506 A which is near the stellar-substellar boundary, and merits follow-up to confirm companion status and characterize the companion.
Targeting young wide multiple star systems with direct imaging surveys is advantageous from both a technical and astrophysical perspective. Simultaneously imaging the science and reference star in the same filter within the same isoplanatic patch should provide superior PSF matching for starlight subtraction, particularly when combined with PCA for building a PSF model. This promises to be an even more powerful technique for space-based observations, including JWST, as the PSF is much more stable and is not subject to anisoplanatism. Brown dwarf and giant planet formation and dynamical evolution in binaries is a data-starved problem with many unanswered questions, and is an important piece of the star and planet formation picture.
SUPPORTING INFORMATION
Figure S1 Top: BDI reduction of HD 36705 using 20 KLIP modes.
Figure S2 Top: BDI reduction of HD 337551 using 15 KLIP modes.
Figure S3 Top: BDI reduction of HD 47787 using 9 KLIP modes.
Figure S4 Top: BDI reduction of HD 76534 using 10 KLIP modes.
Figure S5 Top: BDI reduction of HD 82984 using 15 KLIP modes.
Figure S6 Top: BDI reduction of HD 104231 using 30 KLIP modes.
Figure S7 Top: BDI reduction of the 2015 epoch of HD 118072 using 7 KLIP modes for A and 15 KLIP modes for B.
Figure S8 Top: BDI reduction of the 2017 epoch of HD 118072 using 30 KLIP modes for A and 10 KLIP modes for B.
Figure S9 Top: BDI reduction of HD 118991 using 15 KLIP modes.
Figure S10 Top: BDI reduction of HD 137727 using 17 KLIP modes.
Figure S11 Top: BDI reduction of the 2015-05-24 epoch of HD 147553 using 15 KLIP modes for A and 3 KLIP modes for B.
Figure S12 Top: BDI reduction of the 2015-06-02 epoch of HD 147553 using 30 KLIP modes.
Figure S13 Top: BDI reduction of HD 222259 using 24 KLIP modes.
Figure S14 Top: BDI reduction of the 2017 epoch of HD 222259 using 10 KLIP modes.
Figure S15 Top: BDI reduction of HIP 67506 using 30 KLIP modes.
Figure S16 Top: BDI reduction of TWA 13 using 10 KLIP modes for A and 25 KLIP modes for B.
Figure S17 Top: BDI reduction of 2MASS J01535076-1459503 using 10 KLIP modes for A and 3 KLIP modes for B.
Please note: Oxford University Press is not responsible for the content or functionality of any supporting materials supplied by the authors. Any queries (other than missing material) should be directed to the corresponding author for the article.
ACKNOWLEDGEMENTS
The authors thank the referee for helpful and constructive comments that improved the quality of this manuscript.
The authors wish to thank T. J. Rodigas for designing the MagAO/Clio BDI survey and contributing to the collection of the data used in this work.
LAP acknowledges research support from the National Science Foundation (NSF) Graduate Research Fellowship. This material is based upon work supported by the National Science Foundation Graduate Research Fellowship Program under Grant No. DGE-1746060. JDL thanks the Heising-Simons Foundation (Grant #2020-1824) and NSF AST (#1625441, MagAO-X).
MagAO was developed with support from the National Science Foundation (#0321312, #1206422, #1506818, #9618852). We thank the LCO and Magellan staffs for their outstanding assistance throughout our commissioning runs. We also thank the teams at the Steward Observatory Mirror Lab/CAAO (University of Arizona), Microgate (Italy), and ADS (Italy) for their contributions to the ASM.
This work used High Performance Computing (HPC) resources supported by the University of Arizona TRIF, UITS, and the Office for Research, Innovation, and Impact (RII) and maintained by the UArizona Research Technologies department.
This work has made use of data from the European Space Agency (ESA) mission Gaia (https://www.cosmos.esa.int/gaia), processed by the Gaia Data Processing and Analysis Consortium (DPAC, https://www.cosmos.esa.int/web/gaia/dpac/consortium). Funding for the DPAC has been provided by national institutions, in particular the institutions participating in the Gaia Multilateral Agreement.
This publication makes use of data products from the Wide-field Infrared Survey Explorer, which is a joint project of the University of California, Los Angeles, and the Jet Propulsion Laboratory/California Institute of Technology, funded by the National Aeronautics and Space Administration.
This research has made use of the NASA Exoplanet Archive, which is operated by the California Institute of Technology, under contract with the National Aeronautics and Space Administration under the Exoplanet Exploration Program.
This research has made use of ATRAN sky transmission files generated at the international Gemini Observatory, a program of NSF’s NOIRLab, which is managed by the Association of Universities for Research in Astronomy (AURA) under a cooperative agreement with the National Science Foundation on behalf of the Gemini Observatory partnership: the National Science Foundation (United States), National Research Council (Canada), Agencia Nacional de Investigación y Desarrollo (Chile), Ministerio de Ciencia, Tecnología e Innovación (Argentina), Ministério da Ciência, Tecnologia, Inovações e Comunicações (Brazil), and Korea Astronomy and Space Science Institute (Republic of Korea).
Facilities: Las Campanas Observatory, Magellan:Clay (MagAO + Clio)
Software:numpy (Harris et al. 2020), astropy (Price-Whelan et al. 2018), matplotlib (Hunter 2007), scipy (Virtanen et al. 2020), opencv (Bradski 2000), photutils (Bradley et al. 2020).
DATA AVAILABILITY
The data underlying this article are available in at https://github.com/logan-pearce/Pearce2022-BDI-Public-Data-Release and at DOI: 10.5281/zenodo.6111597. Additional figures for each star in the survey are available online in the supplementary material.
Footnotes
Previous papers have called it the [3.9] filter, we here refer to it as [3.95] for clarity
See https://gea.esac.esa.int/archive/documentation/GEDR3/Gaia_archive/chap_datamodel/sec_dm_main_tables/ssec_dm_gaia_source.html for complete description of Gaia catalog contents
eccentricity (e): P(e) = 2.1 - 2.2×e, e ∈ [0,0.95], following Nielsen et al. 2019; inclination (i): cos (i) ∈ Unif[-1,1]; argument of periastron (ω): ω ∈ Unif[0,2π]; mean anomaly (M): M ∈ Unif[0,2π]; since contrast curves are one-dimensional we did not simulate longitude of nodes
REFERENCES
APPENDIX A: BINARY SYSTEM DETAILS
Here, we present details of each binary system in our survey. In the following discussion, we have made use of the Gaia EDR3 Renormalized Unit Weight Error (RUWE) metric as a signpost for the (non-)existence of unresolved c ompanions. RUWE encapsulates all sources of error in the fit to the assumed single star astrometric model, corrected for correlation with source colour and magnitude. RUWE ≈ 1 is expected for a well-behaved solution (Lindegren 2018).6 RUWE has been shown to be sensitive to companions on separations from ∼0.2 to 1.2 arcsec (Kervella et al. 2022), periods of months ≲ P ≲ 10 yr, and mass and luminosity ratios <1, for which photocentre motion is perturbed from motion of a single star model (Penoyre, Belokurov & Evans 2022). RUWE 1–1.4 has been shown to be very strongly correlated with photocentre perturbation from an unresolved companion (Belokurov et al. 2020; Stassun & Torres 2021); RUWE 1.4–2 indicates deviation from a single star model but the astrometry may still be reliable (Maíz Apellániz, Pantaleoni González & Barbá 2021); RUWE >2 indicates signficant devation from a single star model. Elevated RUWE in young sources (τ ≲ 10 Myr) may also be attributed to the presence of a disc (Fitton, Tofflemire & Kraus 2022).
Additionally, we have made use of the Hipparcos–Gaia Catalog of Accelerations (Brandt 2021) as a signpost for unresolved companions on wider orbits for which RUWE is less sensitive. Significant difference between the long-baseline proper motion vector and the instantaneous PM vectors in Hipparcos and Gaia observation epochs (proper motion anomaly, PMa) can indicate the presence of an unresolved companion causing acceleration. We made use of the Kervella et al. 2019 (for DR2) and Kervella et al. 2022 (for EDR3) PMa catalogues to indicate the (non-)existence of significant PMa; S/N > 3 is considered significant in Kervella et al. 2019. We note that PMa sensitivity depends on mass, distance, and orbital period, and use it as a indicator only and not a tool for prediction of companion properties.
HD 36705 – HD 36705 (AB Dor) is a nearby (15 pc), K0V + M5-6 (Torres et al. 2006), 9″ T-Tauri type binary in the AB Doradus moving group with masses 0.865 ± 0.034 M⊙ (Close et al. 2005) and 0.37 M⊙ (Sebastian et al. 2021), respectively. AB Dor A is an ultrafast rotator that is chromospherically active (Lalitha et al. 2013). AB Dor B (RST 137B, HBC 434) was first detected by Vilhu & Linsky (1987) in X-ray emission. Close et al. (2005) placed the age of AB Dor A at 50|$^{+50}_{-20}$| Myr due to lithium (Mewe et al. 1996), X-ray activity, and rotation rate, younger than the average age of 149|$^{+51}_{-19}$| for the AB Dor moving group (Bell et al. 2015). A wide variety of ages have been estimated for AB Dor spanning 5–240 Myr (75–150 Myr – Luhman, Stauffer & Mamajek 2005; 100 Myr – Mamajek & Hillenbrand 2008; 70 Myr – Chauvin et al. 2010; 240 Myr – Vican 2012; 10 Myr – Gáspár, Rieke & Balog 2013; 150 Myr – Richey-Yowell et al. 2019; 5.6 Myr – Binks et al. 2020). We adopted the average age of 100 Myr for our analysis.
Both stars have their own subsystems. Close et al. (2005) detected a significantly redder companion to AB Dor A, which they named AB Dor C, at 0.156 ± 0.010 arcsec and position angle 127 ± 1°, with a dynamical mass of 0.090 ± 0.008 M⊙ (Azulay et al. 2017). Climent et al. (2019) inferred the presence of a companion to AB Dor C in VLTI/AMBER J, H, K band, with 38 ± 1 mas separation and masses of 0.072 ± 0.013 and 0.013 ± 0.01 M⊙ for AB Dor Ca, Cb, respectively. Close et al. (2005) also detected a 0.070 arcsec companion to AB Dor B (AB Dor Ba, Bb) at position angle 238.6 ± 0.38°. AB Dor A and B are resolved in Gaia EDR3, both with large RUWE values (A: RUWE = 25.13; B: RUWE = 3.52), nevertheless uncertainties of astrometric quantities are small, the parallaxes are consistent with Hipparcos (van Leeuwen 2007), and separation/PA is consistent with the Washington Double Star catalogue (WDS; Mason et al. 2001). No significant IR excess was detected by McDonald, Zijlstra & Boyer (2012) (average excess infrared (EIR) = 1.108 for 4.2–25 μm, where EIR = 1 indicates no excess).
HD 37551 – HD 37551 (WX Col) is a young, 4 arcsec binary at a distance of 80 pc. HD 37551 A and B have a mass of 0.93 and 0.80 M⊙, respectively (Anders et al. 2019), and spectral type G7V and K1V (Torres et al. 2006). Both stars have RUWE values ∼1 (A: RUWE = 0.97; B: RUWE = 0.96), indicating that unresolved companions are unlikely (Lindegren et al. 2018).
Rodigas et al. (2015) used this system as a test case in their BDI paper. They noted that it had previously been identified as an AB Dor member (Torres et al. 2006; Elliott et al. 2014), and that low-mass AB Dor members have Li-depletion boundary ages indistinguishable from that of the Pleiades, i.e. 130 ± 20 Myr (Barrado y Navascués et al. 2004), and adopted this age for the system. Binks et al. (2020) retained it as an AB Dor member, and BANYAN Σ (Gagné et al. 2018) gives 86.7 per cent AB Dor membership probability. However, Binks et al. (2020) determined ages of 18.3|$^{+3.6}_{-4.1}$| and 11.6|$^{+4.1}_{-5.1}$| via SED fitting for A and B respectfully. We adopted an age of 130 ± 20 Myr for our analysis. The younger age of Binks et al. (2020) would result in mass limits ∼15 MJup smaller.
HD 47787 – HD 47787 is a young (16.5 ± 6.5 Myr derived from evolutionary models, Tetzlaff et al. 2011) 2 arcsec binary of roughly equal brightness at 48 pc. It is not a member of a known young moving group (99.9 per cent field in Banyan Σ). A second possible companion is seen at 12.2 arcsec (Dommanget & Nys 2000; Fabricius et al. 2002), however, the Gaia EDR3 parallax is significantly different from HD 47787 A, suggesting they may not be associated. A and B are both spectral type K1IV (Torres et al. 2006), and have mass 0.85 and 0.89 M⊙, respectively (Anders et al. 2019). Both have RUWE = 1.1, suggesting any unresolved companions are unlikely to be resolvable in imaging if present.
HD 76534 – HD 76534 (OU Vel) is a very young Herbig Be star with spectral type B2Vn (Houk 1978) in a 2 arcsec binary at 869 pc with associated nebulosity. The age is 0.27 ± 0.01 Myr, derived from MESA Isochrones and Stellar Tracks (Choi et al. 2016) and Gaia DR2 colours, in Arun et al. (2019). Finkenzeller & Mundt (1984) observed a double peaked H α emission line with an unshifted absorption line; Berrilli et al. (1992) confirmed dust structures around this and other Herbig Ae/Be stars with optical and mid- to far IR luminosities. HD 76534 A has a mass of 6.31 ±0.05 M⊙ (Arun et al. 2019), HD 76534 B has a mass of ∼2 M⊙ (Anders et al. 2019). HD 76534 A has an elevated RUWE (RUWE = 1.53), suggesting a possible unresolved companion, however, RUWE can also be elevated for highly variable stars (Belokurov et al. 2020). HD 76534 B has RUWE = 0.88, making a companion unlikely.
HD 104231 – HD 104231 is a 4.5 arcsec binary at 100 pc in Lower Centaurs Crux (Hoogerwerf 2000) with an age of 21 Myr (derived from isochrone model fitting, Pecaut et al. 2012). HD 104231 A has spectral type F5V (Houk & Cowley 1975) and mass 1.33 M⊙; HD 104231 B has mass 0.30 M⊙ (Hagelberg et al. 2020). HD 104231 AB have RUWE = 0.82 and 2.29, suggesting a possible unresolved companion around B, although there is no significant PMa in Kervella et al. (2019). Mittal et al. (2015) observed statistically significant infrared excess luminosity for HD 104231 A in Spitzer 10 μm (S/N = 6.85) and 20 μm (S/N = 12.82) bands, corresponding to silicate emission-line features. Tobal (2000) reported astrometry for a companion at 7.7 arcsec observed in 1997, labelled HD 104231 B in the Washington Double Star catalogue (WDS), however, no further observations of this companion are reported, nor is there a corresponding source in Gaia EDR3. We conclude this is spurious and adopt the 4.5 arcsec companion (labelled HD 104231 C in WDS) to be HD 104231 B.
HD 118072 – HD 118072 (V347 Hya) is a G-type 2.3 arcsec binary at 80 pc in the Argus Association (89.2 per cent Banyan Σ probability). We adopted the mean age of 40–50 Myr for the Argus Association (Zuckerman 2019). HD 118072 A has a spectral type G3V (Torres et al. 2000) and mass 1.11 M⊙ (Chandler, McDonald & Kane 2016). Both have RUWE close to one (A: RUWE = 1.027, B: RUWE = 0.962) and no significant PMa.
HD 118991 – HD 118991 (Q Cen) is a SpT B8.5 + A2.5 (Gray & Garrison 1987), 5.6 arcsec binary at 88 pc in the Scorpius–Centaurus Association (76.7 per cent Lower Centaurus-Crux, 21.5 per cent Upper Centaurus-Lupus, 1.8 per cent Field Banyan Σ probabilities), with an age of 130–140 Myr (derived from isochrone fitting of Strömgren photometry, David & Hillenbrand 2015). HD 118991 A has a mass of 3.6–3.7 M⊙ (David & Hillenbrand 2015). Both have RUWE close to one (A: RUWE = 1.108, B: RUWE = 1.065) and no significant PMa.
HD 137727 – HD 137727 contains a pair of G-type stars (G9III + G6IV, Torres et al. 2000) in a 2.2 arcsec binary at 112 pc, with an age of 8 Myr (Tetzlaff et al. 2011). HD 137727 A has a mass of 0.88 M⊙ (Chandler et al. 2016). HD 137727 A has RUWE = 1.416, but Kervella et al. (2019) did not detect a significant PMa. HD 137727 B has RUWE = 0.88 and no significant PMa.
HD 147553 – HD 147553 is a 6 arcsec B9.5V + A1V (Corbally 1984) binary in Upper Centaurus-Lupus (Banyan Σ: 90.7 per cent probability UCL, 9.0 per cent USco) at a distance of 138 pc. We adopted the median age of UCL 16 ± 1 Myr derived from isochrone fitting (Pecaut et al. 2012). HD 147553 A has a mass of 2.7 M⊙ (Hernández et al. 2005). Both have RUWE close to one (A: RUWE = 0.927, B: RUWE = 1.017) and no significant PMa.
HD 151771 – HD 151771 contains a pair of late B-type (B8III + B9.5, Corbally 1984) field stars with separation 7 arcsec at 270 pc. Kervella et al. (2019) found a slightly significant (S/N = 3.79) proper motion anomaly on the Gaia DR2 epoch only for HD 151771 A, which at the current separation of the binary (∼1890 au) would result from an object of mass 3.5 M⊙, and so is likely explained by the influence of the secondary star. HD 151771 A and B have RUWE = 1.22 and 0.797, respectively, in Gaia EDR3.
We could not find an age in the literature for either star. We used SYCLIST isochrones for B-type stars computed in Georgy et al. 2013, which used the geneva stellar evolution code (Ekström et al. 2012) to compute grids from 1.7 to 15 M⊙ for three metalicities (Z = 0.014 (solar), Z = 0.006, and Z = 0.002) and a range of rotation rates (Ω) from zero to critical velocity (Ωcrit). We used the stellar luminosity estimate of McDonald et al. 2012 (L = 311.76 L⊙) and the 2MASS J − K colour (J − K = 0.08) to interpolate age from the Georgy et al. (2013) isochrones. We estimated ages for all three metalicities and for three rotation rate values (Ω/Ωcrit = 0.0, 0.5, 0.9), which returned age estimates spanning 200–300 Myr. We performed our analysis for all nine estimated ages.
HD 164249 – HD 164249 is a 6 arcsec binary at 50 pc in the β Pic moving group (Messina et al. 2017). We adopted the average age of the β Pictoris moving group of 25 ± 3 Myr, derived from lithium depletion boundary modelling (Messina et al. 2016). HD 164249 AB have masses 1.29 and 0.54 M⊙ (Zúñiga-Fernández et al. 2021) and SpT F6V + M2V (Torres et al. 2006), respectively. HD 164249 AB have RUWE = 1.09 and 1.22. HD 164249 A does not have a significant PMa value.
HD 201247 – HD 201247 is a pair of G-type stars (G5V + G7V; Gray et al. 2006) at 33 pc with separation 4 arcsec and age of 200–300 Myr (derived from chromospheric and coronal X-ray activity and Li EW, Zuckerman et al. 2013). HD 201247 A has mass 0.94 M⊙ and HD 201247 B has mass 0.89 M⊙ (Osborn et al. 2020). Both have RUWE close to one (A: RUWE = 1.064, B: RUWE = 1.002) and no significant PMa (S/N < 3).
HD 222259 – HD 222259 (DS Tuc) is a 5 arcsec binary of SpT G6V + K3V (Torres et al. 2000) at 44 pc in the Tucana–Horologium Moving Group. We adopted the average age of 45 Myr derived from isochrone fitting of moving group members (Bell et al. 2015). DS Tuc A and B have masses 1.01 ± 0.06 and 0.84 ± 0.06 M⊙ (Newton et al. 2019). Both have RUWE close to one (A: RUWE = 0.95, B: RUWE = 0.91) and no significant PMa (S/N < 3). Newton et al. (2019) detected a transiting planet around DS Tuc A with the Transiting Exoplanet Survey Satellite (TESS; Ricker et al. 2015) with an 8 d period whose orbit is likely aligned with the binary orbit. They did not find additional companions using the Gemini Planet Imager (GPI; Macintosh et al. 2014) integral field spectroscopy in H band or in the TESS photometry.
HIP 67506 and TYC 7797-34-2 – HIP 67506 is a field star (99.9 per cent probability in Banyan Σ). It was identified as a wide binary in the Hipparcos and Tycho Doubles and Multiples Catalog (ESA 1997) with another star (TYC 7797-34-2) with separation 9 arcsec and dubbed HIP 67506 A and B. HIP 67506 has a distance 89.5 ± 30 pc according to the Hipparcos catalogue (van Leeuwen 2007). HIP 67506 is identified as type G5 (Spencer Jones & Jackson 1939) and mass 1.2 M⊙ (Chandler et al. 2016). Both stars have Gaia ERD3 RUWE > 1.4 (A: RUWE = 2.02; B: RUWE = 1.73).
There is no age in the literature for these stars. To estimate the age of HIP 67506, we used the luminosity and effective temperature estimates of McDonald et al. (2012) for the primary (Teff = 6077 ± 150 K; L = 0.37 ± 0.07 L⊙) to interpolate an age of ≈ 200 Myr using BHAC15 isochrones. There is no literature age nor stellar parameter estimates for TYC 7797-34-2, so we performed our analysis assuming a range of ages from 200 Myr to 10 Gyr.
Status as gravitationally bound binary. Gaia EDR3 shows two sources corresponding to the expected separation and position angle given by Hipparcos, yet differing parallax solutions (A: source id = 6109011780753115776, π = 4.51 mas; B: source id = 6109011742094383744, π = 0.55 mas). The dramatically different Gaia parallaxes for A and B question if the two stars are actually a gravitationally bound pair versus a chance alignment of unassociated stars at different distances.
We conducted a common proper motion analysis using Washington Double Star Catalog astrometry of the pair (WDS J13500−4303A and B) and determined the previously identified HIP 67506 B (TYC 7797-34-2) is in fact an unassociated star that is much further distant. This analysis will be presented in a forthcoming follow-up paper on this system (Pearce et al., in preparation). This has no impact on the utility of the pair for BDI, however, it does impact the contrast and mass limits we are able to achieve for the much further distant star.
TWA 13 – TWA 13 is a pair of M1Ve (Torres et al. 2006) T-Tauri stars (Schneider et al. 2012) at 60 pc and 5 arcsec separation in the TW Hydra Association (Schneider et al. 2012). We adopted the mean age of TW Hydra (10|$^{+10}_{-7}$| Myr, from isochrone fitting, lithium equivalent width, and H α emission in Herczeg & Hillenbrand 2014. Both have mass of 0.57 M⊙ (Herczeg & Hillenbrand 2014). TWA 13 A has RUWE = 1.085 while TWA 13 B has a slightly elevated RUWE = 1.266.
2MASS J01535076−1459503 – 2MASS J01535076−1459503 is a 3 arcsec young (25 ± 3 Myr, Messina et al. 2016) binary in the β Pictoris Moving Group (Messina et al. 2017) at 33 pc. We adopted the mean age of β Pictoris Moving Group (25 ± 3 Myr, Messina et al. 2016). 2MASS J01535076−1459503 A has a mass of 0.34 M⊙ (Osborn et al. 2020) and SpT M3 (Riaz et al. 2006). 2MASS J01535076−1459503 A has a slightly elevated RUWE while 2MASS J01535076−1459503 B has an RUWE close to one (A: RUWE = 1.220, B: RUWE = 1.089).
Author notes
NSF Graduate Research Fellow.
