


ABSTRACT
Early-type galaxies (ETGs) possess total density profiles close to isothermal, which can lead to non-Gaussian line-of-sight velocity dispersion (LOSVD) under anisotropic stellar orbits. However, recent observations of local ETGs in the MASSIVE Survey reveal outer kinematic structures at 1.5Reff (effective radius) that are inconsistent with fixed isothermal density profiles; the authors proposed varying density profiles as an explanation. We aim to verify this conjecture and understand the influence of stellar assembly on these kinematic features through mock ETGs in IllustrisTNG. We create mock Integral-Field-Unit observations to extract projected stellar kinematic features for 207 ETGs with stellar mass |$M_{\ast }\geqslant 10^{11} \, \mathrm{M_{\odot}}$| in TNG100-1. The mock observations reproduce the key outer (1.5Reff) kinematic structures in the MASSIVE ETGs, including the puzzling positive correlation between velocity dispersion profile outer slope γouter and the kurtosis h4’s gradient. We find that h4 is uncorrelated with stellar orbital anisotropy beyond Reff; instead, we find that the variations in γouter and outer h4 (a good proxy for h4 gradient) are both driven by variations of the density profile at the outskirts across different ETGs. These findings corroborate the proposed conjecture and rule out velocity anisotropy as the origin of non-Gaussian outer kinematic structure in ETGs. We also find that the outer kurtosis and anisotropy correlate with different stellar assembly components, with the former related to minor mergers or flyby interactions while the latter is mainly driven by major mergers, suggesting distinct stellar assembly origins that decorrelates the two quantities.
1 INTRODUCTION
Early-type galaxies (ETGs; Dressler 1980; Djorgovski & Davis 1987) are recognized as the ‘red and dead’ end products of hierarchical galaxy formation (Cole et al. 2000; Springel et al. 2001; De Lucia et al. 2006; De Lucia & Blaizot 2007). Numerical simulations over the past decade have shown that the formation path of early-type galaxies is well represented by a two-phase scenario (Naab et al. 2007; Guo & White 2008; Oser et al. 2010; Johansson, Naab & Ostriker 2012; Moster, Naab & White 2013; Rodriguez-Gomez et al. 2016), comprising an active phase (z ≳ 2) dominated by gas-rich mergers and bursty in situ star formation (Hopkins et al. 2006, 2008a, b, 2009c, d; Wellons et al. 2015), as well as a passive phase (z ≲ 2) dominated by dry mergers and accretion of ex situ formed stars (Nipoti, Treu & Bolton 2009a; Nipoti et al. 2009b; Remus et al. 2013; Wellons et al. 2016), as well as quenching by active galactic nucleus (AGN) feedback (Silk & Rees 1998; King 2003; Wyithe & Loeb 2003; Di Matteo, Springel & Hernquist 2005; Springel, Di Matteo & Hernquist 2005; Fabian 2012; Kormendy & Ho 2013).
However, in the presence of a radial or tangential stellar orbital anisotropy, the projected stellar velocity dispersion can also vary with radius even when γ′ = 2 and vc remains constant with radius. As the anisotropy cannot be measured directly in observations, neither the 3D velocity dispersion profile (Binney & Mamon 1982) nor the density profile logarithmic slope (Cappellari 2008; Xu et al. 2017) can be determined in an unbiased manner without an assumed velocity anisotropy. This causes a degeneracy in the derived mass profile/velocity dispersion profile and the assumed velocity anisotropy. None the less, if higher order velocity moments are measured, which provides non-Gaussian information (especially the kurtosis h4, which is the fourth velocity moment) of the LOSVD, this degeneracy can in theory be broken through the opposite behaviour of h4 under radial and tangential velocity anisotropy (Dejonghe & Merritt 1992; Gerhard 1993; Merritt & Saha 1993; Read & Steger 2017).
Recent results from the MASSIVE Survey (Ma et al. 2014) found that massive local ETGs with stellar mass ≳ 1011.5M⊙ that have rising velocity dispersion profiles towards their outskirts tend to have positive h4 and positive h4 gradient (Veale et al. 2017, 2018). Ene et al. (2019) also found that most of MASSIVE ETGs have dropping inner velocity dispersion profiles and increasing h4 towards the Galactic Centre. These trends are in contradiction to the theoretical expectations that under a fixed total density profile, radial velocity anisotropy induces a more positive h4 accompanied by a decreasing LOSVD towards the outskirts of a galaxy (vice versa towards the centre). To explain this observed tension, Veale et al. (2018) proposed that the presence of circular velocity gradients could be the cause, and galaxy-to-galaxy variations of the total density profile slope (γ′) could be present in ETGs. Therefore, we aim to verify this conjecture using simulated ETGs from the state-of-the-art cosmological hydrodynamic simulation IllustrisTNG (Marinacci et al. 2018; Naiman et al. 2018; Nelson et al. 2018; Pillepich et al. 2018b; Springel et al. 2018), which possesses a well-studied ETG sample with near-isothermal total density profiles that are broadly consistent with their observed counterparts (Wang et al. 2020,Paper I).
If the outer kinematic structures of ETGs are indeed influenced by the variations in their density profiles, we expect to see a correlation of their outer kinematic structures with minor mergers. This is due to the fact that the evolution of the ETG total density profile at z < 0.5 is mainly driven by minor mergers as found in Wang et al. (2019, Paper II) and similarly in earlier works (Johansson et al. 2012; Hilz, Naab & Ostriker 2013; Remus et al. 2013; Sonnenfeld, Nipoti & Treu 2014). Interestingly, Greene et al. (2019) found strong correlations between h4 and stellar population probes (i.e. metallicity and metallicity gradients) and suggested cumulative minor mergers might have led to the old-aged, radially anisotropic ETGs having positive h4 at the outskirts. Since galaxy mergers also affect the velocity dispersion profile (Bender, Burstein & Faber 1992; Schauer et al. 2014; Nipoti et al. 2020) and tend to induce radial velocity anisotropy (Romanowsky et al. 2003; Hilz et al. 2012), we will also investigate the role of minor mergers in the co-evolution of ETG outer kinematic structure and their density profile using the merger histories of the simulated ETGs.
This paper is organized as follows. In Section 2, we introduce the simulation and selection criteria through which we select our ETG catalogue, as well as the methods to mimic observations for extracting kinematic structure information out of the ETGs; in Section 3, we present the results for the kinematic properties of our selected ETG sample along with comparisons to observations; in Section 4, we further explore the physical interpretation for the formation of outer kinematic structure in ETGs relating to their total density profiles, stellar assembly histories, and environment; in Section 5, we summarize our main conclusions and provide an outlook for future directions of work. In the following analysis, we assume the Planck-2016 flat-ΛCDM cosmology (Planck Collaboration 2016) parameters used by the IllustrisTNG simulations: h = 0.6774, Ωm = 0.3089, Ωb = 0.0486, ΩΛ = 0.6911, and σ8 = 0.8159.
2 METHODOLOGY
2.1 IllustrisTNG simulations
Cosmological simulations have tremendously improved our understanding of galaxy formation and cosmology over the past few decades (see Vogelsberger et al. 2020a for a recent review). The Next Generation Illustris Simulations1 (Marinacci et al. 2018; Naiman et al. 2018; Nelson et al. 2018; Pillepich et al. 2018b; Springel et al. 2018), IllustrisTNG for short, is a recent set of cosmo-magneto hydrodynamic simulations evolved with the state-of-the-art moving mesh hydrodynamics code arepo (Springel 2010). They advance the merits of the Illustris Simulations (Vogelsberger et al. 2013; Torrey et al. 2014), and improve the Illustris models (Genel et al. 2014; Vogelsberger et al. 2014a, b; Nelson et al. 2015; Sijacki et al. 2015) in terms of AGN and stellar feedback physics (Weinberger et al. 2017; Pillepich et al. 2018a).
The full physics IllustrisTNG simulation suite reproduces many key relations in observed galaxies, including the galaxy–colour bimodality in the Sloan Digital Sky Survey (SDSS; Nelson et al. 2018), the fraction of dark matter within galaxies at z = 0 (Lovell et al. 2018), the galaxy mass–metallicity relation (Torrey et al. 2018, 2019) and the intracluster metal distribution (Vogelsberger et al. 2018), the galaxy size–mass relation evolution (Genel et al. 2018), galaxy morphology transition (Tacchella et al. 2019) and stellar orbital fraction (Xu et al. 2019), early-type galaxy total density profiles (Wang et al. 2020), molecular and atomic hydrogen content in low redshift galaxies (Diemer et al. 2019; Stevens et al. 2019), star formation activities and quenched fractions (Donnari et al. 2019), ram-pressure stripping in dense environments (Yun et al. 2019), gas-phase metallicity gradients in star-forming galaxies (Hemler et al. 2020), as well as AGN galaxy occupation and X-ray luminosities (Weinberger et al. 2018; Habouzit et al. 2019; Terrazas et al. 2020). Although some facets of these comparisons still exhibit discrepancies with observations to different levels, the significant improvements over Illustris and the multitude of agreement in galaxy and cluster level properties with observations demonstrates the predictive power of IllustrisTNG (e.g. predictions of JWST observation for high-redshift galaxies Vogelsberger et al. 2020b). Therefore, we use ETGs selected from IllustrisTNG to gain insights on the origin of their outer kinematic structure as seen in the MASSIVE Survey.
The simulation suite of IllustrisTNG comprises three cubic boxes with periodic boundary conditions, i.e. TNG100 (side length |$75\, \mathrm{Mpc}\,h^{-1}$|, same as original Illustris), TNG300 (side length |$205\, \mathrm{Mpc}\,h^{-1}$|), and TNG50 (side length |$35\, \mathrm{Mpc}\,h^{-1}$|), with overall higher resolution in smaller boxes and each box contains several runs with different numerical resolutions. In this paper, we select galaxies from the highest resolution run of the TNG100 box, which is best for our purpose of studying ETGs with stellar mass ≳ 1011M⊙, since it provides a substantial sample size of ETGs in this mass range with reasonable mass resolution. TNG100 has a baryonic matter mass resolution of |$m_{\mathrm{baryon}} = 1.4\times 10^{6} \, \mathrm{M}_{\mathrm{\odot}}$| and a dark matter mass resolution of |$m_{\mathrm{DM}} = 8.9\times 10^{6} \, \mathrm{M}_{\mathrm{\odot}}$|, each with 18203 resolution elements. The softening length scale of dark matter and stellar particles is |$\epsilon = 0.74\, \mathrm{kpc}$| [valid for z ≤ 1, scales as (1 + z)−1ϵ at z > 1], whereas the gravitational softening of the gas cells is adaptive and has a minimum length scale of 0.19 comoving kpc. The simulation runs of TNG50, TNG100, and TNG300 boxes are now available for public data access (Nelson et al. 2019).
2.2 Sample selection
Galaxies in IllustrisTNG are identified as gravitationally bound structures (subhaloes) by Subfind (Springel et al. 2001; Dolag et al. 2009) win haloes found using the Friends-of-Friends (FoF) algorithm based on mean particle separation length. The largest subhalo in a halo together with its baryonic component is defined as the central galaxy, and all other subhaloes in the halo are defined as satellite galaxies. We select central galaxies in TNG100 with total stellar masses of M* ≥ 1011M⊙ (≳ 7 × 10⁴ resolution elements), which covers the stellar mass range of the MASSIVE ETGs (M* ≥ 3 × 10¹¹M⊙, Veale et al. 2018). Merger trees that trace the comprehensive assembly histories of galaxies and dark matter haloes are constructed using the algorithm Sublink (Rodriguez-Gomez et al. 2015).
We follow Papers I and II for galaxy morphology classification, which is based on the optical luminosity reconstruction approach detailed in Xu et al. (2017). The optical light of a galaxy is derived using the Stellar Population Synthesis (SPS) model (Bruzual & Charlot 2003) based on the metallicity and age of its stellar particles that are treated as coeval stellar populations with Chabrier initial mass function (Chabrier 2003). A projection dependent dust attenuation is then applied to the galaxy luminosity and we take the SDSS r-band luminosity after dust processing to calculate azimuthally averaged galaxy luminosity radial profiles for morphological classification. We fit single-component models, i.e. the de Vaucouleurs profile (Sérsic n = 4) and the exponential profile (Sérsic n = 1), as well as a combined two-component model of exponential and de Vaucouleurs profiles to the projected radial luminosity profiles of galaxies. If a galaxy is better fit (lower minimum χ2) by the de Vaucouleurs profile, and demonstrates bulge dominance in the two-component fit (bulge-to-total ratio >0.5) in all three independent projections (along the x, y, and z axes of the simulation box), then it is considered as early type.
To make our ETG classification more robust according to Integral Field Unit (IFU) observations (Li et al. 2018a), we fit a single Sérsic profile to the projected luminosity profiles of the selected ETGs, and keep only those with Sérsic indices satisfying nx ≥ 2.5, ny ≥ 2.5, and nz ≥ 2.5 in all three projections simultaneously (Li et al. 2018a selected ETGs based on n ≥ 2.5). For the MASSIVE ETGs (Ma et al. 2014), they were selected based on morphology (E and S0 types from Paturel et al. 2003) without any specific Sérsic index cut applied, and 77 out of 105 galaxies have n ranging from 2 to 6 cross-referencing the NSA catalogue. Therefore, we consider our generic ETG selection criteria a reasonable choice when comparing to MASSIVE ETGs and we arrive at a sample of 221 well-resolved ETGs after the above-mentioned photometric selections. This will be further reduced to a final sample of 207 ETGs after removing galaxies that have been through recent major mergers (see Section 3.1).
2.3 Mock observations
We summarize the main steps in post-processing simulation particle and catalogue data to retrieve kinematic properties of our mock ETG sample that mimics kinematic properties from the observational IFU spectroscopic surveys. Our pipeline is largely based upon the public code |${\small ILLUSTRIS-TOOLS}$|2 (Li et al. 2016) to make mock IFU observations, with edits for our IllustrisTNG ETG sample applied. Fig. 1 shows the work flow of our post-processing pipeline.
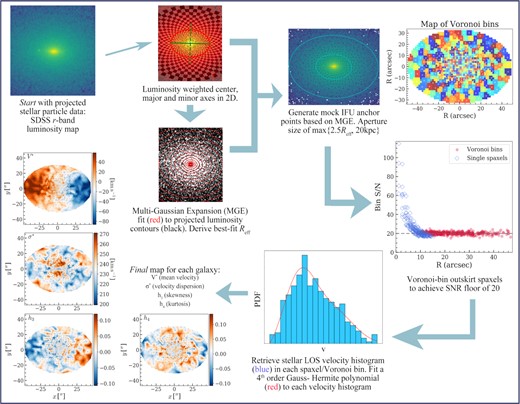
Schematic flow chart of the main steps for our mock-IFU post-processing pipeline. The input starts from the projected stellar luminosity map from particle data, and the output is the 2D kinematic structure maps for each galaxy, i.e. mock IFU data products. The example galaxy (Subfind ID = 257302) shown has typical elliptical geometry in its luminosity map. The central projected region is well resolved with a large number of high SNR spaxels, and there are increasing fractions of Voronoi bins towards the outskirts. The velocity histogram indicates one of the spaxel/Voronoi bin demonstrating a significant non-Gaussian LOS velocity profile. Comparing the mean velocity and dispersion maps shows that the galaxy is dominated by randomized stellar motion, while its skewness h3 distribution is anticorrelated with the mean velocity distribution, and kurtosis h4 is generally positive for most of the spaxels/Voronoi bins in the map.
We find the centre of the stellar component of the galaxy by comparing the centre of mass for all stellar particles in the galaxy and its central 20|${{\ \rm per\ cent}}$| of particles (in 3D radial distance). We do this recursively by setting the central 20 |${{\ \rm per\ cent}}$| as the total region considered to be the total region in the next step, and compare its centre of mass to the 20 |${{\ \rm per\ cent}}^2$| particles centre of mass, until the difference between the two centre of masses in a step drops below 0.01 kpc. This centre for the stellar component is within ∼0.05 kpc of the minimum gravitational potential point defined by Subfind for our ETG sample. We assume the mean velocity of the stellar particles to be the mass-weighted average of particle velocities within 15 kpc of the stellar component centre found as above. We calibrate coordinates and velocities of stellar particles with respect to the stellar component centre and mean velocity of their galaxy.
Afterwards, we make 2D projections of the stellar particles in random directions (along the z-axis of the simulation box) to mimic realistic observational conditions (we have also tried random projections in the x and y axes, as well as along the edge-on direction of the galaxy, which all largely preserve the main findings of this paper). We pixelize the SDSS r-band luminosities of the projected stellar particles on to an |$80\, \mathrm{kpc}\times 80\, \mathrm{kpc}$| square aperture centred on the stellar component centre. We set our pixel size to |$0.5\, \mathrm{kpc}\times 0.5\, \mathrm{kpc}$|, imitating the local ETG population of the MASSIVE survey, and we place our fiducial ETGs at z = 0.03 (angular diameter distance 128 Mpc) for our mock observations. The angular resolution of our mock luminosity map is 0.806 arcsec at that redshift, while the MASSIVE galaxies were observed using the Hobby-Eberly Telescope (HET; Hill et al. 2008) at the McDonald Observatory, where its operational seeing has a full width at half-maximum (FWHM) of 1.5 arcsec (σPSF = 0.64 arcsec). If we convolve a Gaussian PSF kernel matching the HET seeing, which has a Gaussian scatter than our mock pixel size, the PSF normalization will boost each pixel’s value by itself and does not smear out its flux to other neighbouring pixels. As such, we consider our pixelization has effectively accounted for the seeing with it being marginally coarser than the expected PSF.
The luminosity profile is then sampled in equal angular bins and logarithmic radial bins to perform the MGE fit. The result of this step produces an analytical best-fitting description of the galaxy surface brightness map with 2D Gaussians, and also provides realistic effective radius (half-light radius) of our mock ETGs that mimics observations by integrating the best-fitting surface brightness profiles. A comparison between the MGE-derived effective radius |$R_{\mathrm{eff}}^{\mathrm{MGE}}$| and the effective radius obtained by directly projecting all stellar particles assigned to the galaxy by Subfind (Reff) is shown in Appendix A, which shows that |$R_{\mathrm{eff}}^{\mathrm{MGE}}$| gives a more realistic description of galaxy sizes removing much of the intracluster light especially in more massive ETGs. This choice of effective radius is also more flexible to capture different distinct components in the ETG luminosity profile compared to simpler half-light-ellipse or single Sérsic fits often adopted in observations (see section 3.2 in Ma et al. 2014). In the rest of this paper, we refer to |$R_{\mathrm{eff}}^{\mathrm{MGE}}$| when we mention the effective radius of our simulated ETGs.
3 RESULTS OF KINEMATIC FEATURES
3.1 The galaxy sample
In this section, we present the fundamental properties of our selected ETG sample. Fig. 2 shows the stellar mass (M*), the effective radius derived with the best-fitting MGE model (|$R_{\mathrm{eff}}^{\mathrm{MGE}}$|), and the mass-weighted average LOS velocity dispersion (|$\sigma _{\mathrm{eff}}^{\mathrm{MGE}}$|) within |$R_{\mathrm{eff}}^{\mathrm{MGE}}$|. The sample is a typical massive (median stellar mass log10(M*/M⊙) = 11.18) ETG sample with well-resolved spatial extent (median effective radius of 7 kpc), and dynamically hot with significant velocity dispersion (median velocity dispersion |$162\, \mathrm{km\, s^{-1}}$|). The LOS velocity dispersion within the effective radius positively correlates with stellar mass following the Tully–Fisher relation M* ∝ σ4 (McGaugh et al. 2000; Bell & de Jong 2001; Williams, Bureau & Cappellari 2010). It also correlates with the effective radius, which is observed to roughly follow |$R_{\mathrm{eff}} \propto M_{\ast }^{0.5}$| in the local universe (Cassata et al. 2013; Huertas-Company et al. 2013; Xie et al. 2015), and leads to a scaling with the LOS stellar velocity dispersion in the form of Reff ∝ σ2. We fit these two scaling relations to our IllustrisTNG ETG sample with fixed power-law slopes and free intercepts (shown as dashed lines in Fig. 2). We also plot in Fig. 2 the stellar masses, effective radii, and the average LOS stellar velocity dispersion for MASSIVE galaxies in Veale et al. (2018). The M*–σ scaling of MASSIVE galaxies is rather consistent with the IllustrisTNG ETGs, although IllustrisTNG approaches the volume limit for massive galaxies (only 18 galaxies with log10(M*/M⊙) ≥ 11.6) versus the MASSIVE Survey (89 galaxies with log10(M*/M⊙) ≥ 11.6). The effective sizes quoted in the right-hand panel of Fig. 2 are from the 2MASS catalogue which covers essentially all MASSIVE ETGs. However, due to the shallower survey depth of 2MASS, galaxy sizes are underestimated by a factor of ∼2 due to insufficient sensitivity to galaxy outskirts compared to sizes from the NSA catalogue which is based on SDSS DR8 photometry (see section 3.2 in Ma et al. 2014). We also plot a scaling relation that shifts the IllustrisTNG ETG Reff–σ scaling by half the effective radii in Fig. 2 that coincides well with the MASSIVE ETGs.
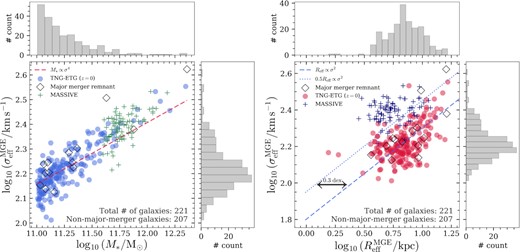
The distribution of stellar mass (left-hand panel) and effective radius (right-hand panel) versus the velocity dispersion measured within the effective radius. The open markers indicate those ETGs that are either undergoing major mergers found via their kinematic maps, or that have been through a recent one (mass ratio >1/3) in the previous snapshot recorded in the merger tree. We remove them in the following analysis and figures following Veale et al. (2018), and only include the filled marker points in our samples below (207 galaxies remaining out of 221). The histograms at the sides in each subplot show the marginalized distributions of these three quantities (histograms include the major merger galaxies). Dashed lines in both panels indicate scaling relations (fixed slope and fitted intercept) for ETGs as expected from observations. ‘Plus’ markers in both panels indicate the MASSIVE sample in Veale et al. (2018). Our simulated ETG sample has only 18 galaxies with log10(M*/M⊙) ≥ 11.6) versus 89 in MASSIVE, owing to the volume limit of the simulation. The effective radius for MASSIVE ETGs quoted here are from the 2MASS catalogue (which underestimates galaxy sizes by a factor ∼2 (0.3 dex) compared to the NSA catalogue, but covers the entire MASSIVE sample) as summarized in Ma et al. (2014). We also show a dotted line in the right-hand panel that indicates a scaling relation with half the effect radius of the fitted IllustrisTNG ETG scaling that coincides well with the MASSIVE galaxies.
Before diving in to the results, we would like to point out that the selection of galaxy samples in the MASSIVE Survey (Ma et al. 2014; Veale et al. 2018) has deliberately removed galaxies in ongoing mergers or show complex merger remnant structures. We therefore also remove such out-of-equilibrium galaxies from our sample to further make fair comparisons with the observations. First, we remove galaxies at z = 0 that are currently going through major mergers apparent from their kinematic structure (mainly LOS mean velocity) and luminosity maps. Secondly, we also trace every ETG in our sample back one snapshot from z = 0 to z ≈ 0.01 (140 Myr ago) along their main progenitor branch, and remove all galaxies that are remnants of recent major mergers in that snapshot with merger stellar mass ratio μ* ≥ 1/3. Combining these two removal criteria, our original 221 ETG sample reduces to 207 galaxies, and the removed galaxies are indicated by empty diamonds in Fig. 2. We proceed with our analysis in the following with the final 207 galaxies without significant perturbation.
In Fig. 3, we show the projected profiles of the mean velocity (〈vLOS〉), the stellar velocity dispersion (σLOS), the skewness (h3), and kurtosis (h4) of our 207 ETGs sample. We bin the spaxels/Voronoi bins of the projected map radially for each galaxy in 20 equal-number bins, and calculate the flux-weighted (SDSS r-band) value of the four quantities in each bin to represent the value for the average velocity profile in that radial bin. The left column has the projected physical distance R as the x-axis, while the right column has the scaled projected distance in units of |$R_{\mathrm{eff}}^{\mathrm{MGE}}$| as x-axis. We can see that in both radial scalings the mean velocity and the skewness profiles are largely flat, while the LOS velocity dispersion profile takes the form of a variety of shapes, and that the h4 profiles show a mildly increasing trend towards larger radii.
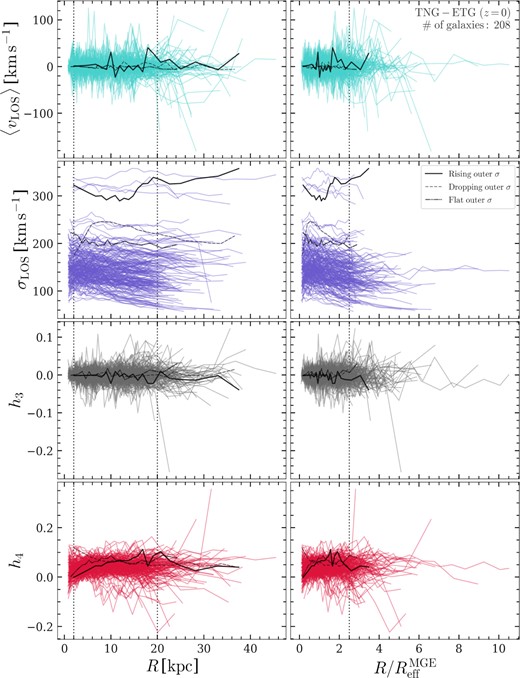
From top to bottom, the profiles of the line-of-sight mean velocity (〈vLOS〉), velocity dispersion σLOS, skewness (h3), and kurtosis (h4) are shown for each individual galaxy in our ETG sample. Each curve represents one galaxy’s flux-weighted radial profile of the four kinematic quantities. The left row shows the profile with respect to the projected physical distance to the galaxy centre, while the right row shows the results w.r.t. the projected distance in units of the effective radius |$R_{\mathrm{eff}}^{\mathrm{MGE}}$| for each individual galaxy. The vertical dotted lines in the left column indicate the location of R = 2 kpc and R = 20 kpc, while the vertical dotted lines in the right column indicate the location of |$R = 2.5 R_{\mathrm{eff}}^{\mathrm{MGE}}$|. We select three individual galaxies that have rising (solid), flat (dot–dashed), dropping (dashed) outer velocity dispersion profiles at 20 kpc (see Section 3.2 for definitions), and highlight their kinematic profiles in each panel.
3.2 Inner and outer slopes of the velocity dispersion profile
The distribution of the inner and outer slopes (along with their uncertainties) of the dispersion profiles of our ETG sample are shown in Fig. 4. Galaxies with flat, rising, or dropping outer dispersion profiles are indicated with differently coloured markers, and we also overplot the best-fitting values of the observed MASSIVE ETGs from Veale et al. (2018). From the figure, we see that the γouter of the IllustrisTNG ETGs generally agree with the range of outer slopes in the observations. The simulation also has similar levels of uncertainties in the slopes (∼0.1, not shown for the observed values) as the observations. The range of γinner < 0 values for our ETGs is also very similar to observations; however, it is noticeable that there are apparently more galaxies having γinner > 0 within the uncertainties in our sample, which could be produced by systematic underestimation of the central stellar velocity dispersion. Since we mainly focus on the behaviour of γouter in this work, the discrepancy in γinner with observations does not affect our findings below. Nevertheless, this systematic underestimation of the central stellar velocity dispersion again points to the fact that IllustrisTNG galaxies are subject to higher central dark matter fractions (Lovell et al. 2018) and halo contraction (Wang et al. 2020), which adds another galaxy property that needs to be anchored by future improvements of the underlying feedback physics model of the simulation.
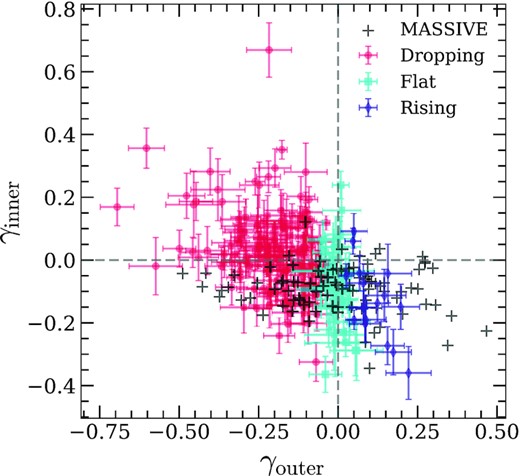
The distribution of the inner and outer slopes of the velocity distribution profile. The point (0, 0) indicates the case for a single-power-law isothermal density profile. The coloured points indicate simulated ETGs with rising (blue), flat (green), and dropping (red) outer velocity dispersion profile slopes (γouter). The error bars of the points are the combined fitting errors of the velocity dispersion profile for the inner and outer slopes. Observation values from the MASSIVE Survey (Veale et al. 2018) are shown for comparison with plus sign markers.
3.3 Higher order velocity moments h3 and h4
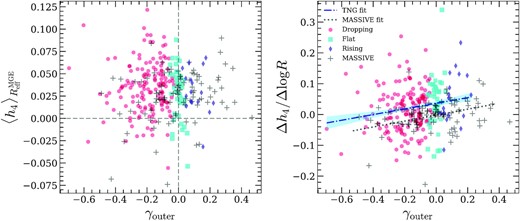
The average kurtosis (left-hand panel, measured within the effective radius) and kurtosis gradient (right-hand panel, measured within |$0.5R_{\mathrm{eff}}^{\mathrm{MGE}} \lt R \lt 1.5R_{\mathrm{eff}}^{\mathrm{MGE}}$|) versus the velocity dispersion profile outer slope γouter. The coloured dots indicate the three types of simulated ETGs with different outer slopes of their velocity dispersion profiles, while the open markers are observations from the MASSIVE Survey. The point (0, 0) in the left-hand panel indicates the point where the line-of-sight velocity distribution is a perfect Gaussian and independent of the projected radius. In the right-hand panel, the dotted line indicates the best linear fit for the MASSIVE ETGs (from fig. 6 in Veale et al. 2018, slope b = 0.096 ± 0.037, p = 0.012), and the blue dot–dashed line indicates the best linear fit for the IllustrisTNG ETGs (slope b = 0.092 ± 0.035, p = 0.009, shaded region stands for |$68{{\ \rm per\ cent}}$| confidence interval). Clearly, the IllustrisTNG ETGs also show positive correlation between the kurtosis gradient and outer slope of the velocity dispersion profile, but there is larger scatter in the h4 gradient compared to observations. The TNG ETGs extend not as far as their MASSIVE Survey counterparts in the Δh4(R)/ΔlogR–γouter relation due to the less abundant sampling of the galaxy (Fig. 3) and halo (Fig. 9) masses in TNG100.
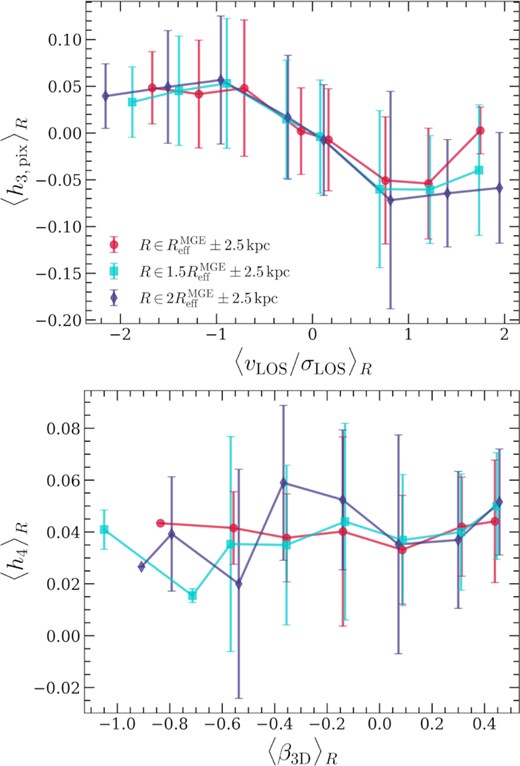
Upper panel: The correlation between the skewness h3 and the rotation to dispersion ratio v/σ at the pixel level measured around three different radii. Lower panel: The correlation between the average kurtosis h4 and the spherical velocity anisotropy parameter β3D measured in 3D apertures of different radii. Solid curves indicate the mean while the shaded regions/error bars represent the 1σ confidence intervals in both panels.
In the left-hand panel of Fig. 5, the IllustrisTNG ETGs’ average kurtosis are consistent with the range of h4 values from observations. In the right-hand panel of Fig. 5, although the kurtosis gradients of the simulated ETGs have larger scatter than the observed ETGs, it is remarkable that the simulation reproduces the key positive correlation between Δh4(R)/ΔlogR and γouter as in fig. 6 of Veale et al. (2018). The dot–dashed blue line represents the best linear fit to the IllustrisTNG ETGs (slope b = 0.092 ± 0.035, p = 0.009, shaded region stands for 1σ confidence interval), and the dotted black line indicates the best linear fit to the MASSIVE ETGs (slope b = 0.096 ± 0.037, p = 0.012, see fig. 6 in Veale et al. 2018). Thus, both the slope and correlation significance for IllustrisTNG ETGs are statistically consistent with the MASSIVE ETGs, which justifies the use of our mock ETG sample as a benchmark for understanding the origin of Δh4(R)/ΔlogR–γouter correlation in the outer kinematic structure of ETGs.
To further check the consistency of higher order kinematic properties of our simulated ETGs with observations (e.g. fig. 10 in Veale et al. 2017), we show the relation of the skewness h3 versus the rotation to dispersion ratio 〈vLOS〉/σLOS in the upper panel of Fig. 6. Values of h3 and v/σ for individual spaxels/Voronoi bins from the different radial apertures (scaled to |$R_{\mathrm{eff}}^{\mathrm{MGE}}$|) in different galaxies are stacked together. Unlike h4 which is the fourth velocity moment and has even parity, the reason why we keep track of the individual spaxel/Voronoi bin level h3 information is due to its odd parity, otherwise projection in circular apertures would average out any underlying signal. The anticorrelation between h3 and v/σ seen for the simulated ETGs is consistent with the theoretical expectation that galaxies with substantial rotation (large |v/σ|) will have a large low velocity tail due to the projection effect of distant background and foreground stars along the line of sight, especially when the galaxy is viewed edge-on. The magnitude of |h3| ∼ 0.1 is prevalent from small (|$\sim 1 R_{\mathrm{eff}}^{\mathrm{MGE}}$|) to large (|$\sim 2 R_{\mathrm{eff}}^{\mathrm{MGE}}$|) radii, which also shows consistency with observations (Krajnović et al. 2011; Veale et al. 2017). Thus, both h3 and h4 measurements of the IllustrisTNG ETG sample from our mock IFU pipeline resembles that of the observed MASSIVE sample, indicating that physical interpretations (Section 4) of these kinematic structures analysed from the simulation can be confidently applied to understanding the formation process of these features in real world ETGs.
3.4 De-correlated outer kurtosis and velocity anisotropy
The core puzzle in Veale et al. (2018) that sparked the current study is the positive correlation between Δh4(R)/ΔlogR and γouter. If an intrinsically flat velocity dispersion profile (assuming no ordered rotation in an ideal ETG, v/σ = 0) is affected by the projection effects of velocity anisotropy at the outskirts, we expect to find radial anisotropy driving positive h4 and ‘dropping’ γouter (vice versa for the tangential case), producing an anticorrelation of Δh4(R)/ΔlogR and γouter (Gerhard et al. 1998). This theoretical expectation is exactly opposite to what was observed in Veale et al. (2018). A crucial assumption of this prediction is that they were evaluated under fixed density profiles (Gerhard 1993), typically comprising a SIS halo potential (fixed γ′ = 2) and a spherical stellar distribution that have a steeper density profile (fixed γ′ = 3 or 4), which naturally leads to Veale et al. (2018) proposing variations in the total density profile as an explanation.
In concordance with the conjecture in Veale et al. (2018), we elaborate in Section 4.1 that the positive Δh4(R)/ΔlogR–γouter correlation is in fact driven by the variation of their total density profiles across our ETG sample. The variations in the outer kurtosis and velocity anisotropy also show hints to be driven by different routes of stellar assembly (Section 4.2). The de-correlated behaviour between the outer h4 and β3D (|$R \geqslant R_{\mathrm{eff}}^{\mathrm{MGE}}$|) shown in Fig. 6 can then be accounted for by the dominant effect from gradients in circular velocity (Gerhard 1993; Baes, Dejonghe & Buyle 2005), where the effect of varying density profiles can overwhelm and randomize the rather weak correlation between h4 and velocity anisotropy.
4 LINKING KINEMATIC STRUCTURE WITH DENSITY PROFILE, ASSEMBLY HISTORY, AND ENVIRONMENT
As shown in the previous section, the IllustrisTNG ETGs have consistent outer slopes of the velocity dispersion profile (γouter) and higher order velocity moments (h3, h4) compared to observations. The simulated ETGs also reproduce the observed positive correlation between Δh4(R)/ΔlogR and γouter, and that velocity anisotropy is insufficient to explain the formation of this trend. In this section, we explore the validity of circular velocity gradients as a driving factor of this trend of following the hypothesis in Veale et al. (2018). We also explore the connection of their kinematic structure to their stellar assembly and environment.
4.1 Correlation with density profile
Before proceeding into the details of exploring the density profiles, we make a change in the quantity characterizing the non-Gaussian outer kinematic structure from the kurtosis gradient Δh4(R)/ΔlogR to the outer kurtosis 〈h4〉 (measured at |$1.5 R_{\mathrm{eff}}^{\mathrm{MGE}} \pm 2.5\, \mathrm{kpc}$|), which is the luminosity-weighted h4 for spaxels/Voronoi bins within a 5 kpc annulus around |$1.5 R_{\mathrm{eff}}^{\mathrm{MGE}}$|. The motivation for our choice is twofold: on the one hand, since we focus on the correlation with γouter, we would prefer to isolate the contribution from outer h4 alone; on the other hand, this change of variable can also avoid the systematics in the stellar velocity distribution at small radii pertinent to resolution effects (core softening) and feedback physics (dark matter fraction) as discussed in Section 3.2. In the upper left panel of Fig. 7, we show Δh4(R)/ΔlogR versus the outer h4 for the IllustrisTNG ETGs. The best linear fit of the correlation has slope b = 0.159 ± 0.022, p = 5.12 × 10⁻¹², and Pearson correlation coefficient r = 0.456, justifying that the outer h4 is a decent representative of the kurtosis gradient. Following that, we show in the upper right panel of Fig. 7 that a positive correlation (slope b = 0.020 ± 0.012, p = 0.104) also exists between the outer h4 and the outer velocity dispersion profile slope γouter. Combining these two panels, we anchor our following discussion regarding the link to density profiles and assembly history on the outer h4.
![Upper left: the relation between the h4 gradient and the outer h4 values measure at around $1.5R_{\mathrm{eff}}^{\mathrm{MGE}}$. Upper right: The relation between the outer h4 values and the outer velocity dispersion profile slopes γouter. Lower left: the relation between outer h4 and the mass-weighted density profile slope $\gamma ^{\prime }_{\mathrm{m}}$ (equation 11) measured at $1.5R_{\mathrm{eff}}^{\mathrm{MGE}}$. Lower right: The relation between the velocity dispersion profile outer slope and the density profile slope. In all panels, The different ETGs with rising, flat, and dropping γouter are indicated by the different-coloured scattered dots, following Fig. 4. The blue dot–dashed lines and shaded regions stand for the best linear fit and their [$16{{\ \rm per\ cent}}$, $84{{\ \rm per\ cent}}$] confidence intervals for each of the correlations.](https://oup.silverchair-cdn.com/oup/backfile/Content_public/Journal/mnras/513/4/10.1093_mnras_stac1375/1/m_stac1375fig7.jpeg?Expires=1750228238&Signature=LLfCKcR7uoT~-hwPvM7SvZj1mSTLRXuDnTGRy2EAhDgLnBRBF-g3o6mXNj33fbIHbEpEeUmt5fBtan3gdZrQ~7UPefNY67mDWnrxCVVwiwiZJInHQ2ufPFqmD9jJ6gZvB65UUrT0rlt0U~8HG9Lqg4z8ziSeUp8FDojKepNXNG4gT1usXgXHZQML00kFQcgYP0JHNP2VFvfQNP7KJzihMLUqNTLKOsB1fjjPN6m4fReKl-Q4avFyE052~YXwKXBwU7nVPV7g8wJRG1NNZ7gi6hmQe~6BGjbxu6yO8fUg4RRSuYQ8eEcd3FlrdLCLmmfZBgiN-BRH-J6spqqAOuuoSw__&Key-Pair-Id=APKAIE5G5CRDK6RD3PGA)
Upper left: the relation between the h4 gradient and the outer h4 values measure at around |$1.5R_{\mathrm{eff}}^{\mathrm{MGE}}$|. Upper right: The relation between the outer h4 values and the outer velocity dispersion profile slopes γouter. Lower left: the relation between outer h4 and the mass-weighted density profile slope |$\gamma ^{\prime }_{\mathrm{m}}$| (equation 11) measured at |$1.5R_{\mathrm{eff}}^{\mathrm{MGE}}$|. Lower right: The relation between the velocity dispersion profile outer slope and the density profile slope. In all panels, The different ETGs with rising, flat, and dropping γouter are indicated by the different-coloured scattered dots, following Fig. 4. The blue dot–dashed lines and shaded regions stand for the best linear fit and their [|$16{{\ \rm per\ cent}}$|, |$84{{\ \rm per\ cent}}$|] confidence intervals for each of the correlations.
Intriguingly, both the outer h4 (bottom left-hand panel) and the velocity dispersion profile outer slope γouter (bottom right-hand panel) are anticorrelated with the outer mass-weighted density profile slope at |$1.5R_{\mathrm{eff}}^{\mathrm{MGE}}$|. Apparently, there is noticeable scatter in both relations which lead to the scatter seen in the Δh4(R)/ΔlogR-γouter correlation in Fig. 5. Nevertheless, both of these negative correlations are statistically significant, with p = 0.028 for the outer h4–|$\gamma ^{\prime }_{\mathrm{m}}$| correlation (slope b = −0.031 ± 0.014) and p = 0.027 for the γouter–|$\gamma ^{\prime }_{\mathrm{m}}$| correlation (slope b = −0.177 ± 0.079). With the velocity anisotropy ruled out as a plausible explanation as discussed in Section 3.4, these two correlations suggest that it is indeed the systematic variation of the total density profile being shallower than isothermal (|$\gamma ^{\prime }_{\mathrm{m}}\lt 2$|) that leads to ‘rising’ gradients in the velocity dispersion profiles (γouter > 0) and produces positive outer h4 in these ETGs (vice versa for the steeper than isothermal case where |$\gamma ^{\prime }_{\mathrm{m}}\gt 2$|), giving rise to an overall positive correlation between Δh4(R)/ΔlogR and γouter. The physical interpretation behind this correlation is that ongoing or past remnants of minor mergers producing positive outer h4 while simultaneously driving the total density profile shallower than isothermal (Section 4.2). Moreover, combined with our finding in Paper I that there is no significant correlation between the density profile slope and velocity anisotropy (see fig. 8 in Wang et al. 2020), having the main driving factor of a non-zero h4 being a deviation from an isothermal density profile allows for randomness between h4 and β3D, leading to the de-correlated h4–β3D trend as seen in the bottom panel of Fig. 6.
![Left column: The relation between the outer h4 values and stellar assembly contributions. Major (minor) mergers are defined as mergers having stellar mass ratio larger (smaller) than 0.25. Right column: The relation between the outer β3D and stellar assembly contributions. In each column, the upper panel shows the link to the fraction of stellar mass accreted in major mergers, while the lower panel shows the link to the fraction of stellar mass accreted in minor perturbations, i.e. minor mergers and flyby interactions. The key takeaway is that the outer 〈h4〉 correlates with minor perturbations but not major mergers, while the velocity anisotropy 〈β3D〉 correlates more strongly with major mergers. The three types of ETGs with rising, flat, and dropping outer velocity dispersion profiles are shown by the scattered dots. The open markers with solid lines (dashed lines) denote the median ($68{{\ \rm per\ cent}}$ scatter) of the rising, dropping, and flat γouter ETGs combined. The blue dot–dashed lines and shaded regions stand for the best linear fit and their [$16{{\ \rm per\ cent}}$, $84{{\ \rm per\ cent}}$] confidence intervals (see the text in Section 4.2 for best-fitting slopes and p-values).](https://oup.silverchair-cdn.com/oup/backfile/Content_public/Journal/mnras/513/4/10.1093_mnras_stac1375/1/m_stac1375fig8.jpeg?Expires=1750228238&Signature=Vy-B5-V5kCC9cQ794y6GCqLb1eIRvSzJ3QuX2iZFpGXVV3uZmQx4gCPuzqooWo~cO0~EEtTzzdiVSghAv8N5Ezf3Y1hVjUWbFXx2La-3HPVLhKmQyQfLcmzn5KuV8epOR3alWPEjI0SSidzehZl~vk5e4wFF3UHLJAbQehjM00O8hZ0D1xEHW6BDxzvRfbYSGZgR5mKiOcPCI8SJWICEpLwxc8gD8pz8rcbwRBpPsLH8-IAVE32-59sfv89mB639a99olVxKU1i~MuhkvoVABbf2azKg-Sy~jbo-Jp-AAQVzR9rSRUrQrk~kSu~lERLx7avqTfdyhT0CYBBdziGHsA__&Key-Pair-Id=APKAIE5G5CRDK6RD3PGA)
Left column: The relation between the outer h4 values and stellar assembly contributions. Major (minor) mergers are defined as mergers having stellar mass ratio larger (smaller) than 0.25. Right column: The relation between the outer β3D and stellar assembly contributions. In each column, the upper panel shows the link to the fraction of stellar mass accreted in major mergers, while the lower panel shows the link to the fraction of stellar mass accreted in minor perturbations, i.e. minor mergers and flyby interactions. The key takeaway is that the outer 〈h4〉 correlates with minor perturbations but not major mergers, while the velocity anisotropy 〈β3D〉 correlates more strongly with major mergers. The three types of ETGs with rising, flat, and dropping outer velocity dispersion profiles are shown by the scattered dots. The open markers with solid lines (dashed lines) denote the median (|$68{{\ \rm per\ cent}}$| scatter) of the rising, dropping, and flat γouter ETGs combined. The blue dot–dashed lines and shaded regions stand for the best linear fit and their [|$16{{\ \rm per\ cent}}$|, |$84{{\ \rm per\ cent}}$|] confidence intervals (see the text in Section 4.2 for best-fitting slopes and p-values).
4.2 Correlation with stellar assembly history
Galaxy mergers play an important role in the non-dissipative (dry) evolution of ETGs at low redshift (Nipoti et al. 2009a, b; Remus et al. 2013; Wellons et al. 2016). In Paper I, we demonstrated that the stellar assembly history of ETGs parametrized by the fraction of in situ formed stars (fin situ) positively correlates with the total density profile power-law slope within 4Reff (see fig. 10 in Wang et al. 2020). In Paper II, we have shown that gas-poor mergers at low redshift (z ≲ 0.5), both major and minor mergers alike, work in coordination to reduce γ′ of the total density profile and establish the positive fin situ−γ′ correlation (see fig. 7 in Wang et al. 2019). Motivated by these finding and the positive relation of h4 at |$1.5R_{\mathrm{eff}}^{\mathrm{MGE}}$| and |$\gamma ^{\prime }_{\mathrm{m}}$| as shown above in Fig. 7, we expect to also find a correlation between the outer h4 and the stellar assembly history of these ETGs.
In Fig. 8, we present the relations between the outer h4 (left column) and outer β3D (right column) measured at |$1.5R_{\mathrm{eff}}^{\mathrm{MGE}}$| as a function of the mass fraction of stars in these ETGs accreted either from major mergers (upper row) or minor perturbations combining the contribution from minor mergers and flyby interactions (lower row). Major (minor) mergers are defined as mergers into the main progenitors of our z = 0 ETGs having stellar mass ratios larger (smaller) than 1/4. The solid line and open markers denote the median of the combined sample including the rising, dropping, and flat outer velocity dispersion profile ETGs, while the dashed lines represent the [|$16{{\ \rm per\ cent}}$|, |$84{{\ \rm per\ cent}}$|] range (|$1\, \sigma$|) of the distributions. The outer h4 shows almost no correlation with the stellar constituent from major mergers (best linear fit slope b = −0.0006 ± 0.0103, p = 0.9545, statistically insignificant). Intriguingly, the outer h4 demonstrates a positive correlation (best linear fit slope b = 0.0254 ± 0.0128, p = 0.0474, statistically significant) with the stellar assembly contribution from minor perturbations at fminor merger⊕flyby ≲ 0.3. This correlation is shaped by the majority of galaxies in our sample that demonstrates consistent increase in the median as well as the |$1\, \sigma$| region. We also notice that there is a slight decrease in outer h4 at fminor merger⊕flyby ∼ 0.4, beyond which h4 remains largely constant. This fluctuation in the outer h4 at high minor perturbation fractions could be due to the limited sample size at the massive end.
Nevertheless, the outer 3D velocity anisotropy shows positive correlations with stellar assembly through both major mergers and minor perturbations, with both relations having large scatter as well. The main difference regarding these two correlations is that major mergers seem to drive a more significant (∼0.4 versus ∼0.1) and steady (monotonic versus fluctuating) increase in the outer β3D compared to minor perturbations. This is also evident from the steeper slope of the linear fit between 〈β3D〉 and fmajor merger (slope b = 0.702 ± 0.115, p = 5.83 × 10⁻⁹, very significant) versus fminor merger⊕flyby (slope b = 0.196 ± 0.157, p = 0.213, poor statistical significance). Hence, the positive outer h4 in ETGs tends to be built up by minor mergers and galaxy interactions (at least for the majority of galaxies with fminor merger⊕flyby ≲ 0.4), but the radial anisotropy of stars (β3D) at the galaxy outskirts is mainly driven by major mergers, resulting in an almost decoupled h4–β3D relation as seen in Fig. 6.
Although the four sets of relations shown above all possess scatter, their differences hint that the seemingly decoupled outer h4 and β3D (Fig. 6) trends originate from the different impacts of major and minor perturbations during the formation process of ETGs. Major mergers can create cuspy (wet merger) or cored (dry merger) central stellar densities depending on the gas fraction of the merger (Hopkins et al. 2008c, 2009a, b, d; Kormendy et al. 2009; Tacchella et al. 2019), modifying the central density profile. Major mergers can also drastically change the morphology and dynamics of a massive galaxy from being tangentially biased disc galaxies (late-type) to radial-orbit-dominated ETGs (Kormendy et al. 2009; Kormendy & Bender 2012; Rodriguez-Gomez et al. 2017), which explains the positive correlation between β3D and fmajor-merger. Although in isolated galaxy merger simulations, a bump in the velocity dispersion profile can also be created at radii >Reff via major mergers (Schauer et al. 2014), simultaneous minor mergers could counter-act that effect in a cosmological setting (1 ≤ z ≤ 2, Wang et al. 2019). In addition, minor mergers contribute significantly to the growth of ETGs compared to major mergers (Guo & White 2008), perpetuate the inside–out growth of extensive stellar haloes and modify stellar velocity distributions of ETGs at large radii (Murante et al. 2007; Bernardi 2009; Khochfar et al. 2011; Hilz et al. 2012, 2013; Pulsoni et al. 2021; Dolfi et al. 2021).
By visually inspecting the kinematic maps of h3 and h4 for individual galaxies, we find that at the locations where h3 and h4 locally peak, it is also a common location to find a coinciding overdensity in the projected luminosity map (see Appendix B for examples). These overdensities reflect the transient infall phases of accreted satellite galaxies on to the host ETGs, before they are tidally disrupted and identified as minor mergers by Sublink. The corresponding LOS velocity profile in the spaxels/Voronoi-bins that cut through these satellites show peaks that are phase from the mean velocity of the galaxy, which leads to large h3 and h4 values in those spaxels/Voronoi-bins. Eventually, the cumulative effect of these minor perturbations (which are predominantly dry mergers at low redshift, see fig. 7 of Wang et al. 2019 for simulation evidence and Derkenne et al. 2021 for latest dynamical modeling constraints from VLT-MUSE) not only leads to positive outer h4 but also drives the outer density profile to be shallower than isothermal (|$\gamma ^{\prime }_{\mathrm{m}}$|), establishing the positive correlation between Δh4(R)/ΔlogR and γouter. Combined with the aforementioned impact of minor mergers on the formation of ETGs, the formation of the non-Gaussian outer kinematic structure in early-type galaxies is a natural consequence of hierarchical structure formation, and it co-evolves with the outer density profile mainly via contributions from minor perturbations. As we will discuss in the following, these trends are also consistent with the results from the probes of galaxy (halo) environment.
4.3 Correlation with environment
Another interesting feature related to the Δh4(R)/ΔlogR–γouter found in Veale et al. (2018) is that there is an increasing fraction of ETGs with ‘rising’ outer velocity dispersion profiles living in denser environments and more massive haloes. Again, the authors speculate that this is also induced by the systematic variation of density profiles instead of velocity anisotropy across different ETGs. Since the environmental measures ν10 and δg in Veale et al. (2017, 2018) are based on the galaxy K-band luminosity weighted on the MASSIVE Survey limiting magnitude and completeness, we do not attempt to perform mock observations of our simulated ETGs based on raw SDSS K-band magnitude output by IllustrisTNG. Hence, we focus on comparing the total stellar (M*) and host dark matter halo masses (M200, mass contained in the radius where the mean density is 200 × the universal critical density) of our ETG sample to the trends observed in the MASSIVE Survey. The stellar and halo masses serve as sensible proxies of the ETG environment as all targets in MASSIVE are central galaxies and we follow the same selection for our mock IllustrisTNG ETGs.
In Fig. 9, we show γouter, as well as the fraction of ETGs having ‘rising’, ‘flat’, or ‘dropping’ velocity dispersion profile outer slopes, against their stellar (left-hand panel) and halo masses (right-hand panel). The scattered dots are individual galaxies coloured by their outer h4 values, the solid curve with diamond markers denotes the binned median, and the dashed lines represent the [|$16{{\ \rm per\ cent}}$|, |$84{{\ \rm per\ cent}}$|] interval of the distribution within each mass bin. We see that γouter increases with both increasing stellar and halo masses in agreement with the trend of MASSIVE median values (red crosses). We notice that the MASSIVE ETGs (89 galaxies, Veale et al. 2018, also see their figs 7, 8, and 9 which also shows large scatter in γouter) have a slightly steeper relation with M*, possibly due to a more complete sample of heavy galaxies with log10(M*/M⊙) ≥ 11.6 compared to the IllustrisTNG ETG sample (18 galaxies). The same trend is reflected in the upper side plots for the fraction of galaxies with different velocity dispersion profile outer slopes. The general trend in both columns indicate that higher fractions of galaxies will have ‘rising’ γouter with increasing galaxy and halo mass (the error bars in the upper panels are the Wilson score |$68{{\ \rm per\ cent}}$| confidence intervals, Wilson 1927).
![Left-hand panel: The correlation between the outer velocity dispersion profile slope (γouter) and the total stellar mass (M*) of our simulated ETGs, colour-coded by their outer h4 values measured at around $1.5 R_{\mathrm{eff}}^{\mathrm{MGE}}$. Right-hand panel: The correlation between γouter and the host halo mass (M200) of our simulated ETGs, colour-coded by their outer h4 values measured at around $1.5 R_{\mathrm{eff}}^{\mathrm{MGE}}$. The open markers with solid lines in both panels denote the median, while the dashed lines represent the [$16{{\ \rm per\ cent}}$, $84{{\ \rm per\ cent}}$] of the distribution for γouter in different stellar mass and halo mass bins. The red crossed with dot–dashed lines are median values for the same correlations from Veale et al. (2018). The upper side plots show the fraction of galaxies with rising (blue), flat (grey), and dropping (red) outer dispersion profiles in each stellar/halo mass bin. The error bars in each bin stand for the $68{{\ \rm per\ cent}}$ Wilson score confidence intervals.](https://oup.silverchair-cdn.com/oup/backfile/Content_public/Journal/mnras/513/4/10.1093_mnras_stac1375/1/m_stac1375fig9.jpeg?Expires=1750228238&Signature=xxyyD4GkB26z0o7Bxvl6hYyEEXPg5JBKTArfUaQlUKco8Kt~K3Ik5v9sKEOZHiy9asXXy3a1jmFqFOUKB46N7PcosI28QyVYNyl5jUHETcMDFi877bEHfBc5EoZc56M6b020Jns5asDYHIp7TwwVpKK3e5Egl9Kq4NkZ4CPKHI2wcIgAbB~iSbGscVwory~eYRXjW5QhaibpC0RC4iH8~C1QXQwPCeNRF-PSi28O06UFg93~cRy4PuloaVoHs6h2FJ7POIW~3vXGzgj5CDR-QEqOHdxfGREHqiZIAcuCZAWQH25866UZXIXEWwJbQljW42u4ULc2zw4XYOEiY-NOkg__&Key-Pair-Id=APKAIE5G5CRDK6RD3PGA)
Left-hand panel: The correlation between the outer velocity dispersion profile slope (γouter) and the total stellar mass (M*) of our simulated ETGs, colour-coded by their outer h4 values measured at around |$1.5 R_{\mathrm{eff}}^{\mathrm{MGE}}$|. Right-hand panel: The correlation between γouter and the host halo mass (M200) of our simulated ETGs, colour-coded by their outer h4 values measured at around |$1.5 R_{\mathrm{eff}}^{\mathrm{MGE}}$|. The open markers with solid lines in both panels denote the median, while the dashed lines represent the [|$16{{\ \rm per\ cent}}$|, |$84{{\ \rm per\ cent}}$|] of the distribution for γouter in different stellar mass and halo mass bins. The red crossed with dot–dashed lines are median values for the same correlations from Veale et al. (2018). The upper side plots show the fraction of galaxies with rising (blue), flat (grey), and dropping (red) outer dispersion profiles in each stellar/halo mass bin. The error bars in each bin stand for the |$68{{\ \rm per\ cent}}$| Wilson score confidence intervals.
Recasting on the findings in Paper I (Wang et al. 2020), the power-law slope of the total density profile anticorrelating with the total stellar mass (fig. 4) is driven by the variation in the inner dark matter density profile (fig. 17), and hence anticorrelating with the halo mass (fig. 15). Given that the variation in γouter is mainly driven by a negative correlation with the density profile (lower right-hand panel in Fig. 7), the findings in Paper I self-consistently predict the trends seen in Fig. 9, once again confirming the conjecture for the observed phenomena in Veale et al. (2018). The colour index in the figure shows that the outer h4 also tend to be higher in ETGs with higher stellar and halo mass, consistent with the positive Δh4(R)/ΔlogR–γouter relation.
The physical interpretation for the emergence of the γouter–mass correlation also fits in to the multiphase formation path of near-isothermal ETG density profiles in Paper II (Wang et al. 2019): heavier ETGs are quenched earlier by AGN feedback (figs 4 and 8) and enter earlier into the non-dissipative evolution phase dominated by gas-poor mergers at lower redshift z ≲ 2 (fig. 7), where the total density profile progressively evolves shallower, and more massive galaxies living in more massive haloes (denser environments) experience more mergers. Although ETGs go through both major and minor mergers, with previous studies suggesting that major mergers start to dominate the ex situ stellar population at stellar masses log10(M*/M⊙) ≳ 11.2 (e.g. fig. 10 in Tacchella et al. 2019), which is also the case for our ETG sample with median fmajor merger = 0.31 and median fminor merger⊕flyby = 0.12, the stellar mass fraction from both minor and major mergers increase with M*. Since the outer h4 is mainly driven by minor perturbations instead of major mergers (Section 4.2, lower left-hand panel in Fig. 8), the mass trend of fminor merger⊕flyby alone dictates the mass trend of γouter and outer h4. This eventually creates the positive correlation between γouter and the kurtosis gradient through the mass-dependent variation of the total density profile, indicating that the formation of the outer (non-Gaussian) kinematic structure in ETGs stands as a natural consequence of hierarchical galaxy–halo assembly.
5 CONCLUSIONS AND OUTLOOK
We study the relation between the kinematic structure and density profiles of 207 massive (log10(M*/M⊙) ∈ [11.0, 12.4], non-major-merger, Fig. 2) early-type galaxies selected from the IllustrisTNG Simulations (Marinacci et al. 2018; Naiman et al. 2018; Nelson et al. 2018; Pillepich et al. 2018b; Springel et al. 2018). We produce mock IFU spectroscopic observations (Fig. 1) for these ETGs in random projections and compute the second (velocity dispersion σ), third (skewness h3), and fourth (kurtosis h4) velocity moments of the projected stellar velocity profiles (Fig. 3). The outer slope (γouter) of the LOSVD profiles (Fig. 4) and the key positive correlation between γouter and the kurtosis gradient (Δh4(R)/ΔlogR, Fig. 5) for the simulated ETGs are consistent with that found in the MASSIVE Survey (Ma et al. 2014; Veale et al. 2017, 2018). This realistic mock ETG sample serves as a benchmark for disentangling the correlation between the outer non-Gaussian kinematic features and velocity dispersion profiles in observed ETGs from the MASSIVE Survey (Veale et al. 2018). In particular, we find the following:
The average velocity anisotropy and h4 show almost no correlation with the 3D velocity anisotropy β3D at radii |$\geqslant R_{\mathrm{eff}}^{\mathrm{MGE}}$| (Fig. 6, lower panel), indicating that positive outer h4 values is unlikely to be produced by stellar velocity anisotropy under fixed density profiles (Gerhard 1993).
The outer h4 measured at |$\sim 1.5 R_{\mathrm{eff}}^{\mathrm{MGE}}$| is a good proxy for the kurtosis gradient and also positively correlates with γouter (Fig. 7, upper row). The mass-weighted slope of the total density profile at that radius negatively correlates with both the outer h4 and γouter (Fig. 7, lower row). This justifies the conjecture (Veale et al. 2018) that systematic variations around an exact isothermal profile drive the positive correlation between Δh4(R)/ΔlogR and γouter.
The outer h4 positively correlates with the mass fraction of stars accreted via minor perturbations (minor mergers and flyby interactions), while the outer velocity anisotropy correlates more significantly with the stellar mass fraction from major mergers (Fig. 8), resulting in a seemingly decoupled h4–β3D relation at the ETG outskirts (Fig. 6).
The values of γouter, outer h4, and the fraction of ETGs with ‘rising’ outer velocity dispersion profiles increase with increasing stellar and halo masses. This is mainly driven by the increase in minor merger fractions with increasing ETG stellar mass affecting the outer kinematic structure and density profile simultaneously (Fig. 9).
As an augmentation to the detailed studies of the ETG density profiles in Papers I and II, this work generalizes those findings and links them with the outer kinematic structure in these galaxies. Our finding that the outer h4 correlates with minor mergers and the density profile, while the outer β3D correlates with major mergers, also explains the apparent stochasticity between the total density profile and stellar velocity anisotropy of ETGs found in fig. 8 of Paper I. The outer h4–minor merger correlation is also consistent with our previous finding: in systems where the stellar assembly in ETGs is dominated by minor perturbations at low redshift (z < 0.5), a higher accreted stellar fraction leads to steeper density profile slopes (fig. 10, Paper I). The dependence of γouter and outer h4 with environment is consistent with the previous findings that both stellar and halo masses anticorrelate with the steepness of the total density profile (figs 4, 15, and 17 in Paper I), and fits in smoothly to the low-redshift (z < 0.5) minor-merger-driven evolution phase of the ETG density profiles as discussed in Paper II (figs 4, 7, 8). Combining the effects of stellar assembly on outer h4, we conclude that the outer kinematic structure of ETGs co-evolves with their total density profiles, which is a natural consequence of hierarchical assembly in cosmological structure formation. The broad agreement of our results with the MASSIVE Survey ETGs also highlights the power of IllustrisTNG to elucidate the underlying correlations in a realistic formation scenario, that could not otherwise be discerned from observations alone.
Apart from the many aspects of our findings that do reproduce and explain the observed ETG kinematic features, we highlight that there are important systematics involving the central stellar velocity dispersion of the IllustrisTNG galaxies. We observe more galaxies with positive γinner compared to MASSIVE ETGs (Fig. 4) indicating underestimation of the central stellar velocity dispersion, which is consistent with the tendency of over-predicting central dark matter fraction (producing halo contraction) in IllustrisTNG galaxies (Lovell et al. 2018; Wang et al. 2020). This is also related to the negative h4–β3D correlation within |$0.5 R_{\mathrm{eff}}^{\mathrm{MGE}}$| as seen in Fig. 6. These limitations pave a way forward for better understanding the interplay between dark matter and baryons, as well as for future improvements of the simulation subgrid physics model (especially related to AGN feedback), which could be better constrained by refined kinematic features at both large and small galactic radii.
Another interesting feature is that the presence of infalling substructures can significantly boost h3 and h4 along the line of sight at the outskirts of ETGs (Appendix B). Although quantifying the impact of mergers and their remnants on the kinematic structure of ETGs is beyond the scope of this work, this finding ties in neatly to our finding of the ETG outer kinematic structure by the fraction of stars acquired through minor perturbations. With ultra-high resolution IFU spectroscopy from MUSE (Bacon et al. 2010) on the Very Large Telescope (VLT) or KCWI (Morrissey et al. 2018) on the Keck Telescope, non-Gaussian kinematic features could potentially provide a novel approach for discovering faint satellites around ETG hosts. Combined with upcoming photometric campaigns such as the Vera C. Rubin Observatory (LSST, Ivezić et al. 2019), the Nancy Grace Roman Space Telescope (WFIRST, Spergel et al. 2015), and Euclid (Amiaux et al. 2012) that advance in survey depth and field of view, we will soon be able to establish a more profound understanding of the co-evolution between the kinematic structure, density profile, and even the build-up of the stellar halo around ETGs in the broad context of hierarchical structure formation.
ACKNOWLEDGEMENTS
We thank Dandan Xu, Ethan O. Nadler, Philip Mansfield, and Shengdong Lu for helpful discussions and support during the preparation of this paper. We thank the anonymous referee for insightful comments that helped to improve the draft. YW acknowledges the past support from the Tsinghua Xuetang Talents Programme and current support from a Stanford-KIPAC Chabolla Fellowship. This work is partly supported by the National Key Basic Research and Development Programme of China (No. 2018YFA0404501 to SM), and by the National Science Foundation of China (grant no. 11821303 and 11761131004 to SM). MV acknowledges support through an MIT RSC award, a Kavli Research Investment Fund, NASA ATP grant NNX17AG29G, and NSF grants AST-1814053 and AST-1814259. VS acknowledges support by the Deutsche Forschungsgemeinschaft through project SP 709/5-1. This research made use of computational resources at the MIT/Harvard computing facilities supported by FAS and MIT MKI; the authors are thankful for the support from the FAS Research Computing team. The flagship simulations of the IllustrisTNG project used in this work have been run on the HazelHen Cray XC40-system at the High Performance Computing Center Stuttgart as part of project GCS-ILLU of the Gauss Centre for Supercomputing (GCS). This research made extensive use of arXiv.org and NASA’s Astrophysics Data System for bibliographic information.
DATA AVAILABILITY
The IllustrisTNG public data can be accessed at https://www.tng-project.org/data/. The data in this article that are not part of the IllustrisTNG data release will be shared upon reasonable request to the corresponding author.
Footnotes
REFERENCES
APPENDIX A: THE EFFECTIVE RADIUS
In this section, we show the differences between the projected 2D effective radius (|$R_{\mathrm{eff}}^{\mathrm{2D, proj}}$|) and |$R_{\mathrm{eff}}^{\mathrm{MGE}}$| of galaxies given by the best MGE fit. |$R_{\mathrm{eff}}^{\mathrm{2D, proj}}$| is measured by projecting galaxies in random directions (along the z-axis of the simulation box) and searching for the radius at which the enclosed projected stellar mass is half of the total stellar mass. However, this procedure includes all stellar particles assigned to galaxies by Subfind, and includes large contributions from the intra-cluster light (ICL) component around the massive ETGs that we selected. Another approach is to first model the galaxy’s projected luminosity distribution in its central region (square aperture with 80 kpc side length) using Multi-Gaussian Expansion (Emsellem et al. 1994), and calculate the half-light radius using the set of analytic best-fitting 2D Gaussians which eventually removes most of the ICL. It also has the advantage over simpler effective radius definitions in 2MASS (semimajor axis length of an ellipse enclosing half the total galaxy luminosity) and the NSA catalogue (half light radius from a single Sérsic fit) to flexibly preserve information of the spatial distribution for different components in the galaxy luminosity profile.
The comparison between the effective radii derived using these two methods is shown in Fig. A1. For smaller galaxies (Reff ≲ 10 kpc), the two definitions yield consistent size measurements, while for larger galaxies the MGE effective radii are significantly smaller than the 2D projected effective radii, which is due to the removal of the ICL. We adopt |$R_{\mathrm{eff}}^{\mathrm{MGE}}$| in our comparison with observational data.
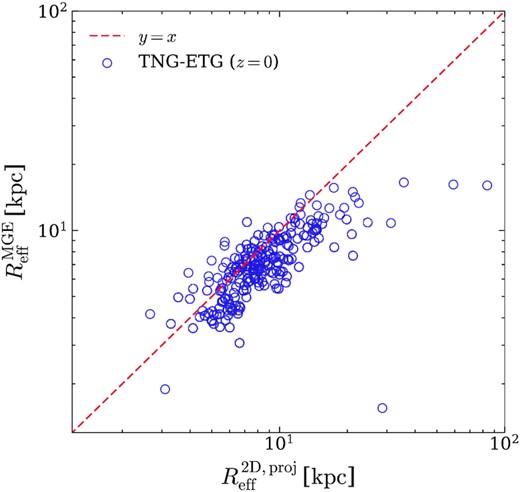
The comparison between the projected 2D effective radius calculated with all stellar particles assigned to the galaxy determined by Subfind, versus the MGE effective radius output by our mock observation pipeline. The MGE effective radii closely follow the 2D projected effective radii for galaxies with small sizes (Reff ≲ 10 kpc). For the larger galaxies, the MGE effective radii are significantly smaller than the projected effective radii, which results from the MGE approach removing most of the diffuse intracluster light component assigned to the galaxy by Subfind, giving more realistic estimates of the effective radii for larger galaxies.
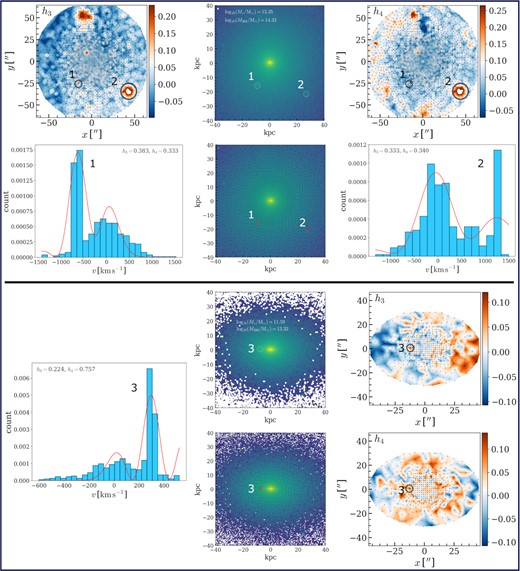
Three examples of spaxels/Voronoi bins cutting through infalling satellite galaxies around two different host galaxies that introduces large h3 and h4. Upper panel: Host Subfind ID 69507, with stellar mass 1012.35M⊙ and halo mass 1014.32M⊙. Lower panel: Host Subfind ID 257302, with stellar mass 1011.59M⊙ and halo mass 1013.32M⊙. The dashed circles in the luminosity maps indicate the location of these satellites, while the red crosses indicate the location of the spaxels/Voronoi bins covering them. Blue histograms show the LOS stellar velocity distribution in those bins (centred on the mean velocity, v = 0, large peak offsets from the zero-point indicate satellite stars), whereas the red curves indicate the fourth-order Gauss–Hermite function fit. Their corresponding locations in the h3 and h4 maps are also marked by black circles.
APPENDIX B: EXAMPLES OF MINOR MERGERS IMPACTING THE OUTER KINEMATIC STRUCTURE
In this section, we showcase three examples of ongoing minor mergers introducing large non-Gaussian moments to the outer kinematic structure of ETGs. In Fig. A2, we mark out three infalling satellites (overdensities in the luminosity maps) around two different host ETGs, with spaxels/Voronoi bins cutting through them along the line of sight, and resulting in significant h3 and h4 values. Clearly, these three pixels all demonstrate large peak offsets from the mean velocity (centred on v = 0). While h3 produced in this manner may diminish over time as the satellite orbits around the host due to its odd parity, a positive h4 can be preserved over time due to its even parity. The cumulative effect of such in many minor mergers (along with flyby interactions that tidally heat galaxies, accelerating stars into the tails of the LOS velocity distribution) can gradually build up a global positive h4 in the outskirts (|$\gtrsim 1.5 R_{\mathrm{eff}}^{\mathrm{MGE}}$|) of ETGs, leading to the positive correlation of the outer h4 and stellar mass fraction from minor perturbations (minor mergers plus flyby interactions) as seen in Fig. 7.
