


ABSTRACT
Characterizing the predicted environments of dwarf galaxies like the Large Magellanic Cloud (LMC) is becoming increasingly important as next-generation surveys push sensitivity limits into this low-mass regime at cosmological distances. We study the environmental effects of LMC-mass haloes (M200m ∼ 1011 M⊙) on their populations of satellites (M⋆ ≥ 104 M⊙) using a suite of zoom-in simulations from the Feedback In Realistic Environments (FIRE) project. Our simulations predict significant hot coronas with T ∼ 105 K and Mgas ∼ 109.5 M⊙. We identify signatures of environmental quenching in dwarf satellite galaxies, particularly for satellites with intermediate mass (M⋆ = 106–107 M⊙). The gas content of such objects indicates ram pressure as the likely quenching mechanism, sometimes aided by star formation feedback. Satellites of LMC-mass hosts replicate the stellar mass dependence of the quiescent fraction found in satellites of Milky Way-mass hosts (i.e. that the quiescent fraction increases as stellar mass decreases). Satellites of LMC-mass hosts have a wider variety of quenching times when compared to the strongly bimodal distribution of quenching times of nearby centrals. Finally, we identify significant tidal stellar structures around four of our six LMC analogues, suggesting that stellar streams may be common. These tidal features originated from satellites on close orbits, extend to ∼80 kpc from the central galaxy, and contain ∼106–107 M⊙ of stars.
1 INTRODUCTION
Dwarf galaxies, due to their shallow potentials and low baryon fractions, represent ideal laboratories within which to study both galaxy formation and dark matter (DM). Understanding the effects of the environments they evolved in is important to producing accurate constraints on such physics. Present-day sensitivity limits have restricted the observational study of dwarf galaxies, especially the faintest ones, to the Local Group [LG; the Milky Way (MW), Andromeda, and all galaxies within ∼2 Mpc of each]. Therefore, much effort has been put to studying MW-mass haloes or LG-like pairs (e.g. Klypin et al. 1999; Springel et al. 2008; Sawala et al. 2016; Applebaum et al. 2021) and the formation of dwarf galaxies within such environments (Brooks & Zolotov 2014; Garrison-Kimmel et al. 2014; Wetzel et al. 2016; Garrison-Kimmel et al. 2017, 2019a; Simpson et al. 2018; Buck et al. 2019; Akins et al. 2021).
Λ cold dark matter (ΛCDM) predicts the presence of DM structure and substructure at all scales, with galaxies populating haloes down to a certain limit (White & Rees 1978; Moster et al. 2010; Jethwa, Erkal & Belokurov 2018). Dwarf galaxies often exist within substructure of larger haloes as well as being hosts to their own sub-substructure (Sales et al. 2013; Wheeler et al. 2015), with the Large Magellanic Cloud (LMC; the MW’s largest satellite) as a well-studied example of this intermediate scale. Recent works investigating the observed and predicted satellite population of the LMC have revealed that these environments, while less disruptive than MW-like centrals (Jahn et al. 2019), can be host to significant populations of dwarf galaxies (D’Onghia & Lake 2008; Sales et al. 2011; Deason et al. 2015; Wetzel, Deason & Garrison-Kimmel 2015a; Jethwa, Erkal & Belokurov 2016; Dooley et al. 2017; Sales et al. 2017; Kallivayalil et al. 2018; Erkal & Belokurov 2020; Pardy et al. 2020; Santos-Santos et al. 2021).
Environment – the relative proximity to higher-mass structures – has been repeatedly shown to correlate with morphology, colour, and star formation rate in dwarf galaxies (Balogh et al. 2004; Kauffmann et al. 2004; Baldry et al. 2006; Cooper et al. 2006; Lisker et al. 2007; Bamford et al. 2009; Wang et al. 2014), though the majority of such surveys are limited to relatively massive environments and satellite galaxies with M⋆ ≳ 108 M⊙. Studies of LG and near-field dwarf galaxies have further corroborated this trend by demonstrating the dependence of H i abundance and star formation history (SFH) on environment (Grebel, Gallagher & Harbeck 2003; Grcevich & Putman 2009; Weisz et al. 2011). More detailed studies of the LG have shown that a majority of satellite dwarf galaxies in the LG are quenched at stellar masses below 108 M⊙ (Weisz et al. 2015; Wetzel, Tollerud & Weisz 2015b), while field dwarfs remain star-forming (Geha et al. 2012, though this work is mostly limited to bright dwarf galaxies with M⋆ ≳ 107 M⊙). In contrast to the universally high quenching fractions found around the LG, Mao et al. (2021) showed via the Satellites Around Galactic Analogs survey that MW-mass systems outside the LG may have systematically lower quenched fractions, even at lower masses. This suggests that the SFHs of LG satellites might not be typical of MW-mass hosts.
Plausible physical mechanisms for the quenching of star formation have been identified. Small-scale hydrodynamic effects are known to either remove gas from a star-forming galaxy via ram-pressure stripping (Gunn & Gott 1972; Abadi, Moore & Bower 1999), prevent the infall of cold gas that fuels star formation leading to ‘starvation’ (Larson, Tinsley & Caldwell 1980), and/or disrupt the structure of the galaxy during close interactions with other galaxies (Moore et al. 1996; Pearson et al. 2016).
Since dwarf galaxies have shallow potentials and massive hosts such as the MW are known to host hot gaseous haloes (Gupta et al. 2012), much attention has been given to the effects of ram-pressure stripping in low-mass satellites. For example, Fillingham et al. (2015) and Wetzel et al. (2015b) demonstrated a mass-dependent quenching model in which satellites with M⋆ = 106–108 M⊙ have short quenching time-scales consistent with ram-pressure stripping, while the longer quenching time-scales of higher-mass satellites (M⋆ ≳ 108 M⊙) are consistent with starvation. Fillingham et al. (2016) further showed that a clumpy gaseous halo with local densities ∼2–20 times the mean gas density increases the efficacy of ram-pressure stripping and reproduces the high quenched fraction of MW satellites. This model breaks down at the lowest galaxy masses (M⋆ ≲ 105 M⊙), where ram pressure and starvation have been shown to be unable to reproduce the universally early quenching times (Emerick et al. 2016; Rodriguez Wimberly et al. 2019), thus pointing to heating from the ionizing ultraviolet (UV) background as the quenching mechanism at such scales.
While the quenching fraction of LG satellites is known to rise as satellite mass falls (Weisz et al. 2011; McConnachie 2012; Wetzel et al. 2015b), high-resolution studies of nearby satellites and simulated LG-like environments have enabled the characterization of the full SFHs of dwarf galaxies, and the study of their dependence on both satellite mass and environment. Weisz et al. (2015) characterized a bimodal mass dependence for quenched fraction, with the highest (M⋆ ∼ 1011.5 M⊙) and lowest (M⋆ < 105 M⊙) mass galaxies holding high quenched fractions, and galaxies with M⋆ = 108–1010 M⊙ having the lowest, suggesting that this mass range may be the most difficult to quench. Comparing to infall time estimates from Rocha, Peter & Bullock (2012), they also find that higher-mass satellites tend to quench 1–4 Gyr after infall, while lower-mass satellites quench prior to infall. Wetzel et al. (2016) used FIRE-2 simulations (Hopkins et al. 2018b) to reproduce properties of satellites around MW-like hosts, in particular, the wide scatter in SFHs and the stellar mass dependence thereof. Garrison-Kimmel et al. (2019b) looked at a sample of ∼500 dwarf galaxies from the FIRE suite to investigate the effect of various environments (LG versus MW versus centrals thereof versus highly isolated centrals), finding that LG- and MW-like environments quench similarly, and form their stars earlier than dwarf centrals, supporting the host–satellite interaction model for quenching. They also find that higher-mass dwarf galaxies are more likely to form a higher fraction of their stars at later times, in agreement with observed LG SFHs.
Other simulations of MW- and LG-like environments, such as APOSTLE (Digby et al. 2019), Auriga (Simpson et al. 2018), and NIHAO (Buck et al. 2019), have demonstrated consistent findings, particularly that satellites form earlier than centrals. Recently, Akins et al. (2021) used the DC Justice League simulation suite to show that ram pressure is the source of short quenching time-scales for satellites of intermediate mass (M⋆ = 106–108 M⊙), as well as the diversity of satellite SFHs and the trend of increasing quenched fraction with decreased M⋆.
While interactions with the host environment are known to affect satellite star formation, it can also affect morphology through gravitational interactions. Such interactions can be strong enough, depending on the satellite’s physical size, proximity of the host, and the mass of the host, to produce observable stellar features known as tidal streams. Tidal streams around our Galaxy have been studied extensively, starting with the Sagittarius dSph tidal stream (Ibata, Gilmore & Irwin 1994; Belokurov et al. 2006), and with dynamical models of stream kinematics revealing multiple close encounters of satellites with the MW (Johnston, Spergel & Hernquist 1995; Majewski, Munn & Hawley 1996; Helmi & White 2001; Peñarrubia et al. 2005). Such features have also been observationally identified in galaxies beyond the LG (e.g. Malin & Hadley 1997; Martínez-Delgado et al. 2008, 2010). Stellar streams give insight and evidence to the hierarchical nature of galaxy assembly. Given this hierarchical nature and the confirmation of a population of satellites around the LMC, tidal streams should presumably be detectable around galaxies of lower mass than the MW. A handful of tidal streams have indeed been discovered around dwarf galaxies (Martínez-Delgado et al. 2012; Carlin et al. 2019; Garling et al. 2021), but their cosmological frequency remains unknown.
Much of the literature on satellites and the interactions with their host environments is confined to the scale of the MW/LG. This is because our highest resolution observations of dwarf galaxies exist within this volume. As next-generation surveys such as DELVE (Drlica-Wagner et al. 2021), MADCASH (Carlin et al. 2016), and LBT-SONG (Davis et al. 2021) come online, it will be important to characterize the environments of lower-mass systems. We aim to extend the analysis of previous works listed above to the scale of the LMC, about an order of magnitude smaller than the MW. For example, Carlin et al. (2021) recently discovered two ultrafaint (UF) dwarf satellites of LMC-mass hosts approximately 3 Mpc from the MW. Previous works have characterized properties of LMC analogues (Chan et al. 2015, 2018; El-Badry et al. 2018) or the predicted satellite population (Jethwa et al. 2016; Sales et al. 2017; Kallivayalil et al. 2018; Jahn et al. 2019; Erkal & Belokurov 2020; Pardy et al. 2020; Santos-Santos et al. 2021), but limited work has been done on characterizing the influence such environments have on observable properties of the satellite population, in particular their SFHs, quenched fractions, and tidal structures.
This paper is organized as follows: The simulations and sample are presented in Section 2; overall trends in satellite quenching are investigated in Section 3.1, while we investigate the environmental quenching of individual satellites in Section 3.3; tidal features around our LMC-mass hosts are presented in Section 4.
2 SIMULATIONS
We analyse six cosmological zoom-in simulations of isolated LMC-mass haloes from the Feedback In Realistic Environments (FIRE) project1. These runs used the FIRE-2 model (Hopkins et al. 2018b) via the cosmological hydrodynamics code gizmo2 (Hopkins 2015), a multimethod gravity plus hydrodynamics code, in its meshless finite-mass mode. gizmo implements an improved version of the Tree-PM solver from gadget-2 (Springel 2005) with fully adaptive conservative gravitational force softenings for gas (Price & Monaghan 2007).
Simulations are initialized3 with second-order Lagrangian perturbation theory at z = 99 using the music code (Hahn & Abel 2011) and evolved within a low-resolution cosmological box. The intended ‘zoom-in’ (Katz & White 1993; Oñorbe et al. 2015) volume is selected as a convex Lagrangian region containing all particles within |${\sim }5\,$|R200m at z = 0 with no similar- or higher-mass haloes as the primary, and is then reinitialized with higher resolution. This procedure is iterated until convergence at the intended resolution, with a buffer of low-resolution particles surrounding the main volume. The simulation is then evolved until z = 0. Since our hosts are isolated LMC-mass haloes that are not embedded within the environment of the LG, small deviations in the assembly history and satellite population may be expected in comparison to the real LMC. However, the physical mechanisms explored here, in particular the environmental effects of LMC-mass hosts, are expected to apply in the case of the real LMC in addition to influence from its evolution in proximity to the LG environment.
The FIRE-2 code calculates heating and cooling rates from 10 to 1010 K, using cloudy ionization states for free–free, photoionization and recombination, Compton scattering, photoelectric, metal-line, molecular, fine structure, dust collisional, uniform cosmic ray heating, against a spatially uniform, redshift-dependent UV background (Faucher-Giguère et al. 2009; Oñorbe, Hennawi & Lukić 2017) occurring at z ∼ 10. The modelling of reionization also includes approximations for self-shielding of dense gas (via the Sobolev approximation) and radiation from local sources based on the Locally Extincted Background Radiation in Optically-thin Networks scheme, accounting for absorbed photon momentum, photoionization, and photoelectric heating (Hopkins et al. 2020).
Star particles are formed in gas that is required to be locally self-gravitating, self-shielded, Jeans unstable, and with density nH > ncrit = 1000 cm−3, inheriting mass and metallicity from their progenitor gas particles. To calculate stellar feedback, a Kroupa (2001) initial mass function is assumed in each star particle, with feedback quantities tabulated from the starburst99 stellar population model (Leitherer et al. 1999), including Type Ia and Type II supernova, and stellar winds, as detailed in Hopkins et al. (2018a,b).
DM particles are assigned to haloes and subhaloes through (6 + 1)-dimensional phase-space analysis via the rockstar halo finder (Behroozi, Wechsler & Wu 2013a), which determines gravitationally bound particles and assigns mass through a spherical overdensity calculation relative to a threshold, such as the critical density of the universe. Stellar properties are computed for each subhalo during an iterative post-processing procedure in which star particles within 80 per cent of a halo’s radius and slower than 2×Vmax with respect to the halo centre are selected and refined until the stellar mass converges to <1 per cent. More details on this process can be found in Samuel et al. (2020). Progenitors of z = 0 haloes are traced through time using consistent-trees (Behroozi et al. 2013b) to construct merger trees. We use properties generated by the above methods to initially determine the stellar mass and SFHs of dwarf galaxies, but we make further cuts on resolution as described below.
2.1 Selecting the sample
Table 1 lists the simulations used in our sample, including the resolution, the halo and stellar masses of the host galaxies, as well as the number of satellites and centrals identified within each simulation volume. Satellites are identified as being within R200m of the main host halo at z = 0, where R200m is defined as the radius within which the mean DM density is equal to 200 times the average matter density of the Universe. We classify centrals as any galaxy that falls outside R200m but within the high-resolution region of each simulation. Well-resolved centrals are further selected as having a maximum contamination of low-resolution particles at 3 per cent of their z = 0 halo mass. This cut is unnecessary for satellites, because they naturally fall within the high-resolution region.
Properties of the host halo of all FIRE simulations analysed.
| Simulation | mbary | M200m | M⋆ | R200m | R50⋆ | Mgas, halo | min. M⋆ | Nsatellite | Ncentral | Reference |
|---|---|---|---|---|---|---|---|---|---|---|
| (M⊙) | (M⊙) | (M⊙) | (kpc) | (kpc) | (M⊙) | (M⊙) | ||||
| m11c | 2100 | 1.5e11 | 8.2e8 | 167.4 | 2.80 | 6.19e9 | 5.89e4 | 2 | 10 | 1 |
| m11d | 7070 | 2.8e11 | 4.1e9 | 203.9 | 6.75 | 1.64e10 | 2.29e5 | 6 | 1 | 2 |
| m11e | 7070 | 1.5e11 | 1.4e9 | 166.0 | 3.31 | 4.62e9 | 2.46e5 | 3 | 1 | 2 |
| m11h | 880 | 1.8e11 | 1.1e8 | 174.0 | 1.44 | 3.15e9 | 1.25e4 | 10 | 5 | 2 |
| m11q | 880 | 1.5e11 | 3.4e8 | 168.7 | 2.71 | 6.18e9 | 1.23e4 | 5 | 9 | 1 |
| m11v | 7070 | 2.9e11 | 2.4e9 | 210.5 | 2.61 | 1.68e10 | 1.39e5 | 4 | 5 | 1 |
| total | 30 | 31 |
Column 1 is the name of each run; column 2 is the minimum baryonic particle mass; column 3 (M200m) is the mass of DM contained within R200m; column 4 (M⋆) is the stellar mass of the primary central of each zoom-in region; column 5 (R200m) is the radius at which the mean interior DM density is equal to 200 times the average matter density of the universe; column 6 (R50⋆) is the stellar half-mass radius in the primary central galaxy; column 7 (Mgas, halo) is the mass of gas contained within 2R50⋆ < rgas < R200m and outside 2R50⋆ of luminous satellites; column 8 (min M⋆) is the minimum stellar mass of any object examined in each run (an effective resolution limit); column 9 is the number of satellites around the primary central; column 10 is the number of resolved galaxies outside R200m of the primary central; and column 11 is the reference in which the simulation was first presented. The total count for satellites and centrals analysed herein is shown in the bottom row. Satellites are luminous (sub)haloes located within the host R200m at z = 0, while centrals are located outside the host halo. We make further resolution cuts on contamination by low-resolution particles (Mlowres/M200m < 3 per cent) and a minimum of 20 star particles formed within the progenitor halo of each object. Naturally, the runs with higher particle mass are less capable of resolving low-mass galaxies, leading to incompleteness of the faint end. Note that m11d, m11e, and m11v are unable to resolve UFs (M⋆ < 105 M⊙) when applying our resolution criteria. References: [1] Hopkins et al. (2018b); [2] El-Badry et al. (2018).
To study the SFHs and to remove spuriously assigned particles, we track the location of star particles assigned to each (sub)halo and select only the ones that were formed within half of the halo’s radius (of bound DM particles, as determined by rockstar). We place a minimum cutoff of 20 such star particles for each galaxy analysed. In some cases, merger events led to large amounts of stars formed outside the halo being assigned at later times, but as these are physically meaningful associations, they were retained.
We have explicitly checked for splashback galaxies – those that entered R200m of the primary central at some point, but exited at a later time – and find that all but one such objects are satellites at present day. Note that this is in contrast with the splashback population of MW-mass hosts, which tend to be significant outside R200m at z = 0 (Sales et al. 2007; Garrison-Kimmel et al. 2014; Fillingham et al. 2018), an effect that is likely due to the difference in halo mass and infall rates of low-mass galaxies. The splashback process can potentially affect the evolution of the object and contaminate the sample of centrals, which are intended to represent the evolution of similarly massed galaxies in FIRE that are not affected by the host (or at least affected to a substantially smaller degree). The individual splashback central is a low-mass galaxy (M⋆ ≈ 3 × 10⁵ M⊙) that was quenched at t ≈ 1.2 Gyr while it was ∼1000 kpc from the central, first entering the primary halo at t ≈ 11 Gyr, suggesting that its quenching was not environmentally induced. Our entire population of centrals is therefore unlikely to have been directly influenced by the environment of the primary LMC-mass halo.
We note that the following predictions are limited by both resolution and sample size. Only three of the runs are able to resolve galaxies with M⋆ < 105 M⊙, leading to a limited variety of cosmological volumes being sampled at this mass scale. Indeed, at all resolved scales, six zoom-in hosts are not a sufficient sample size to make statistically robust predictions, especially due to the relatively small number of predicted satellites of LMC-mass haloes compared to that found around MW/LG-mass hosts. We consider this to be a case study in the formation of LMC satellites, rather than a statistically complete cosmological prediction.
As a note of clarification, we use the terminology of ‘later-forming’ galaxies to refer to those that formed stars until more recent cosmological epochs. That is, a galaxy that stopped forming stars at t = 2 Gyr would have formed earlier in the lifetime of the universe than a galaxy that stopped forming stars at t = 13 Gyr.
3 SATELLITE QUENCHING
3.1 Comparison to centrals
Fig. 1 shows the SFHs of dwarf galaxies separated by association (satellites of an LMC-mass host versus nearby centrals) as well as separated by stellar mass bins. All simulated data are shown as solid lines, while observed data for satellites of the MW/M31 are shown via dashed lines (these objects are shown for comparison, and are not direct analogues of our simulated satellites of LMC-mass hosts). We highlight LMC satellites that have been identified as environmentally quenched (see Section 3.3) in a thicker line. In this subsection, we examine only the objects from our sample of LMC-mass hosts, with individual SFHs shown as solid coloured lines. Satellites are defined as being located within its host virial radius at z = 0, while centrals are defined as being located outside this radius at z = 0 but within the high-resolution region of the simulated zoom-in volume. We combine the M⋆ = 107–108 and 108–109 M⊙ bins due to the low number count, late quenching times, and general similarity of SFHs of galaxies in these bins.
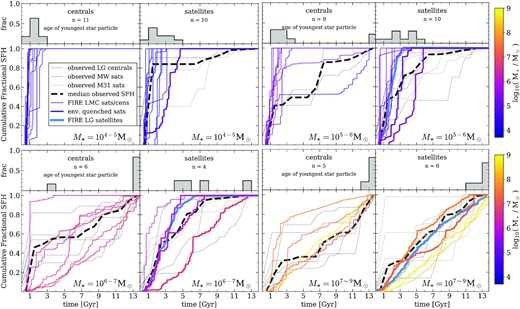
SFHs of simulated LMC satellites (right-hand subpanels) and centrals (left-hand subpanels), coloured and separated according to stellar mass. Satellites identified as being environmentally quenched (see Section 3.3) have been highlighted with thicker line styles. All coloured lines are simulated data, while black/grey lines are observational data. Note that all observed data are for LG satellites/centrals. Individual observed SFHs of satellites of the MW/M31 (Weisz et al. 2014; Skillman et al. 2017) are shown as faint dashed lines (style according to legend), with medians in each bin shown as thicker dashed black lines. Blue lines represent the median SFHs of satellites of LG-like hosts simulated using the FIRE-2 code, and as presented in Garrison-Kimmel et al. (2019b, see Table 1 therein for more information, including resolution). Histograms on the top of each panel represent the formation time of the youngest star particle for simulated LMC satellites or nearby centrals (i.e. they do not include observed satellites of the MW/M31, nor simulated FIRE satellites of LG-like hosts). The majority of centrals are quenched prior to t = 4 Gyr if they are not presently star-forming. Satellites, however, are more prone to influence by the environment of their LMC-mass hosts, and exhibit a greater diversity of quenching times. Overall, the SFHs of LMC satellites do not differ substantially from the SFHs of LG satellites. This is perhaps a counter-intuitive result given the reduced stellar mass-to-halo mass ratio of LMC-mass haloes, and their less disruptive nature (Jahn et al. 2019).
In every mass bin, satellites (right-hand panels) exhibit a wider range in quenching times than do centrals (left-hand panels). We find that all UF (M⋆ ≈ 104–105 M⊙) galaxies quench early on, as expected from the heating effects of the ionizing UV background, preventing the accretion and subsequent cooling of gas in low-mass haloes. The FIRE-2 simulations implement a spatially uniform UV background, so such effects would not be due to patchy reionization (Hopkins et al. 2018b). The latest forming UF satellite (tquench ∼ 4.7 Gyr; halo ID 44820) has been identified as environmentally quenched, and inhabiting a more massive halo than other satellites (when comparing the highest mass ever achieved by each halo to account for mass-loss due to tidal stripping). This galaxy would have likely continued forming stars and be included in a higher stellar mass bin if star formation were not shut off due to environmental effects. Excluding this object, we find that UF satellites quench at t = 2.0 ± 0.8 Gyr, and centrals quench at t = 1.3 ± 0.6 Gyr, using the age of the last star particle formed as quenching time. When looking at the 90 per cent star formation time-scale, we find that satellites (again excluding those that are environmentally quenched) have τ90 = 1.8 ± 0.7, and centrals have τ90 = 1.3 ± 0.5. We therefore find the distribution in quenching times between UF satellites and centrals to be statistically indistinguishable. We also note that UF dwarf galaxies are only present in the three highest resolution runs: m11c, m11h, and m11q.
In the next mass bin, we find that satellites with M⋆ = 105–106 M⊙ also exhibit a wider range of quenching times than their predominantly early-quenched central counterparts. Notably, there are two late-quenching centrals, which formed stars until t ≈ 13 Gyr. These galaxies (halo IDs 82233 and 4448) inhabit somewhat larger DM haloes, with M200m ≈ 5.5 × 10⁹ M⊙, than most other galaxies in this stellar mass range, with the average halo mass excluding these two objects being M200m ≈ 2 × 10⁹ M⊙. This difference might seem small, but leads to a factor of 2 difference in their virial temperatures (4.6 × 10⁴ K versus 2.3 × 10⁴ K), increasing the temperature limit of gas that will remain bound to the haloes during heating due to reionization and star formation feedback.
Moving up in stellar mass to M⋆ = 106–107 M⊙, we now find that the majority of centrals are star-forming (the exception again being an outlier in halo mass, this time much lower than average), while all satellites are quenched at various intermediate times, tquench ≈ 4.5–12.5 Gyr. This is a strong indication that the environment of LMC-mass hosts is able to quench star formation in its dwarf companions.
In our first three stellar mass bins, encompassing M⋆ = 104–107 M⊙, we find that higher-than-average halo mass is an indicator of later-than-average quenching times. Average halo masses, both at z = 0 and peak mass ever attained, are listed in Table 2 (see also Fig. A1 in Appendix A for more detail). For example, the latest forming satellites in the M⋆ = 105–106 M⊙ bin, as in the prior mass bin, were identified as environmentally quenched and as inhabiting more massive DM haloes than the rest of the satellites in this bin. Therefore, these objects are likely more akin to failed versions of galaxies that otherwise could have attained stellar masses in the next higher bin had their gas not been removed by environmental factors. Higher halo masses feature steeper gravitational potential wells, which are able to trap faster moving and hotter gas than lower-mass haloes. Higher-than-average halo mass results in an increased resistance to quenching via reionization heating, which predominantly affects the lowest mass dwarf galaxies, resulting in the retention of gas that can later be affected by environmental factors, such as ram-pressure stripping.
Average z = 0 and all-time peak halo masses for satellites in our sample.
| log10(M⋆/M⊙) | |$\bar{M}_{200m}(z=0)$|(sat) | |$\bar{M}_\text{peak}$|(sat) |
|---|---|---|
| 4–5 | 2.90e8 M⊙ | 9.94e8 M⊙ |
| 5–6 | 6.10e8 M⊙ | 1.65e9 M⊙ |
| 6–7 | 7.70e8 M⊙ | 7.53e9 M⊙ |
| 7–9 | 2.72e10 M⊙ | 4.05e10 M⊙ |
| log10(M⋆/M⊙) | |$\bar{M}_{200m}(z=0)$|(sat) | |$\bar{M}_\text{peak}$|(sat) |
|---|---|---|
| 4–5 | 2.90e8 M⊙ | 9.94e8 M⊙ |
| 5–6 | 6.10e8 M⊙ | 1.65e9 M⊙ |
| 6–7 | 7.70e8 M⊙ | 7.53e9 M⊙ |
| 7–9 | 2.72e10 M⊙ | 4.05e10 M⊙ |
The difference between these two figures points to tidal stripping, discussed in Section 4. We find that higher-than-average halo mass at fixed stellar mass is an indicator of later quenching times, due to the deeper potential well of higher-mass haloes being more effective at retaining gas that has been kinematically disrupted or heated.
In contrast with early-quenching low stellar mass satellites, the highest mass dwarf satellites (M⋆ = 107–109 M⊙) form universally late, with all centrals and four of six satellites remaining star-forming at z = 0. The two quenched satellites ceased forming stars at t ≈ 11–12 Gyr, and have stellar masses of M⋆ = 107–108 M⊙. All galaxies with M⋆ > 108 M⊙ are star-forming, regardless of environment, further supporting the claim that such galaxies are the most resilient to quenching (Wheeler et al. 2014; Fillingham et al. 2015; Weisz et al. 2015; Wetzel et al. 2015b).
Fig. 2 shows the histogram of quenching times for all satellites and centrals. We define star-forming galaxies as those that have formed at least one star particle in the last ∼500 Myr, while quenched galaxies did not form any star particles in the same time interval. Quenching times for such objects are defined as the formation time of their youngest associated star particle. We include the count of star-forming galaxies in the t = 14–15 Gyr bin to differentiate this population from those that formed their last star particle between t = 13 and 13.2 Gyr. We find that centrals demonstrate strongly bimodal quenching behaviour, either halting their star formation by t = 4 Gyr or continuing until z = 0. In contrast, satellites exhibit a wider variety of quenching times, with eight having clear signs of environmental quenching (highlighted in yellow). These galaxies were selected with 4 < tquench < 13.2 Gyr, and dhost(t = tquench) < 2R200m(t). That is, they are selected as having quenched late enough that reionization heating is unlikely to be the culprit, and close enough to their host halo to be influenced by its circumgalactic medium (CGM). We investigate these objects further in Section 3.3.
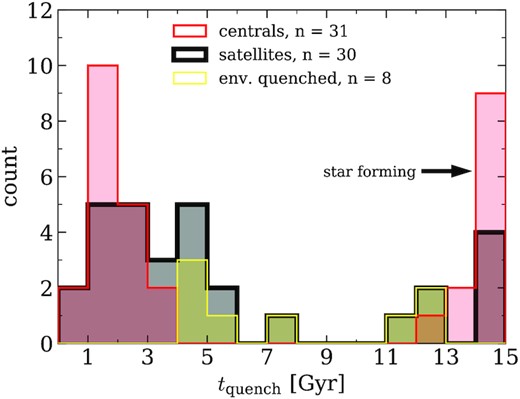
Histogram of quenching times for all centrals and z = 0 satellites of LMC-mass hosts. Here, we define tquench as the formation time of the youngest star particle associated with the galaxy. Environmentally quenched satellites (EQSs) are highlighted in yellow and selected as having 4 < tquench< 13.2 Gyr, as well as quenched within twice the virial radius of their host. To distinguish galaxies that were recently quenched from those that are actively star-forming, we have placed galaxies that formed a star particle within the last 500 Myr in the 14–15 Gyr bin, labelled ‘star-forming’. While both centrals and satellites follow bimodal distributions, centrals exhibit clearly defined peaks and low scatter, and satellites exhibit a wider distribution. This indicates that the environments of LMC-mass hosts are the source of additional quenching mechanism(s), which we investigate in Section 3.3.
In summary, we predict that isolated LMC-mass galaxies should host a population of mostly quenched low-mass dwarf galaxies. More specifically, these galaxies should be host to approximately three or more UF (M⋆ = 104–105 M⊙) satellites with ancient stellar populations, one to four intermediate-mass (M⋆ = 105–107.5 M⊙) dwarf satellites with a variety of quenching times, some of which may have been environmentally quenched by the host, and lastly, one bright star-forming companion of M⋆ ≳ 107.5 M⊙, though not all simulations contain such an object. These figures are simply representative of the range of satellite populations found in our sample of hosts. That is, no hosts have fewer than one intermediate-mass dwarf satellite, and none have more than four. The number and mass distribution is in agreement with recent predictions of the LMC satellite population (Jethwa et al. 2016; Sales et al. 2017; Kallivayalil et al. 2018; Jahn et al. 2019; Erkal & Belokurov 2020; Pardy et al. 2020).
3.2 Comparison to LG environments
We find that LMC-mass hosts quench their satellites similarly to the LG, with simulated data from the FIRE simulations for such objects from fig. 4 of Garrison-Kimmel et al. (2019b) shown as the blue line in the right-hand panel for each mass bin of Fig. 1 (where M⋆ = 104–105 M⊙ is not included due to resolution limits). These simulations of LG-like environments include two MW-mass (∼1012 M⊙) haloes, and satellites are defined as being with 300 kpc of one of those MW-like haloes. For our M⋆ = 107–109 M⊙ bin, we show the mean reported SFH for the bins M⋆ = 107–108 and 108–109 M⊙. In each mass bin where simulated LG satellites are available, the overall shape of SFHs for such objects is consistent with LMC satellites.
We also compare to observed SFHs for satellites of the MW or M31 (Weisz et al. 2014; Skillman et al. 2017), with individual SFHs in each mass bin shown as thin dashed/dotted lines, while the median is shown as a thicker black dashed line. We find that our simulated LMC satellites have SFHs that are broadly consistent with observed MW/M31 satellites at fixed stellar mass, especially in the two highest mass bins. The observed galaxies in the lowest bins tend to form later than their simulated counterparts. This is perhaps due to observational uncertainty, since the majority of stars in each observed galaxy are formed in early times, consistent with our simulated galaxies. Constraining the exact time of quenching can be a challenge with observational data. For example, see Weisz et al. (2015) for a discussion of the impact of blue straggler stars on the estimation of SFHs via colour–magnitude diagram fitting.
It is also worth noting that cosmological simulations are not without their biases. As discussed in Garrison-Kimmel et al. (2019b), the FIRE model is subject to the influence of the resolution at which it is run. In particular, the SFH of a given object can be shifted towards later-forming when run at increased resolution. Also mentioned in Garrison-Kimmel et al. (2019b) is the effect of different reionization models. An earlier reionization can produce a smaller overall population of low-mass galaxies; however, the limiting of early-time star formation increases the fraction of stars that are produced at later times, resulting in overall later SFHs.
The similarity of SFHs between observed and simulated LG/MW/M31 satellites and our simulated LMC satellites suggests that quenching of satellites may not be restricted to high-mass systems, and that dwarf–dwarf quenching could proceed likewise to quenching in LG-type environments, an effect that may be impactful on the interpretation of future observational missions categorizing satellites of LMC-mass hosts. There is evidence that the CGM of the MW is dense and structured enough to affect the evolution of its intermediate-mass dwarf satellites (e.g. Grcevich & Putman 2009; Peek et al. 2009; Nakashima et al. 2018). The apparent similarity in SFHs between LG and LMC satellites suggests that this may be true of LMC-like environments as well.
Fig. 3 shows the quiescent fraction (i.e. the portion of galaxies that have not formed a star particle within the last 500 Myr) versus stellar mass of LMC satellites and centrals along with additional observed and simulated LG satellites. For simulations from the FIRE project, ‘m11’ refers to the LMC-mass haloes analysed in this run, and ‘m12’ refers to the MW-mass haloes from Samuel et al. (2022). Due to the fact that not all of our simulated LMC-mass systems contain satellites in each mass bin, our error bars are derived from Poisson scatter. Error bars on W15 were calculated from the difference in reported quenching fractions when considering morphological dTrans galaxies as either star-forming or quiescent.
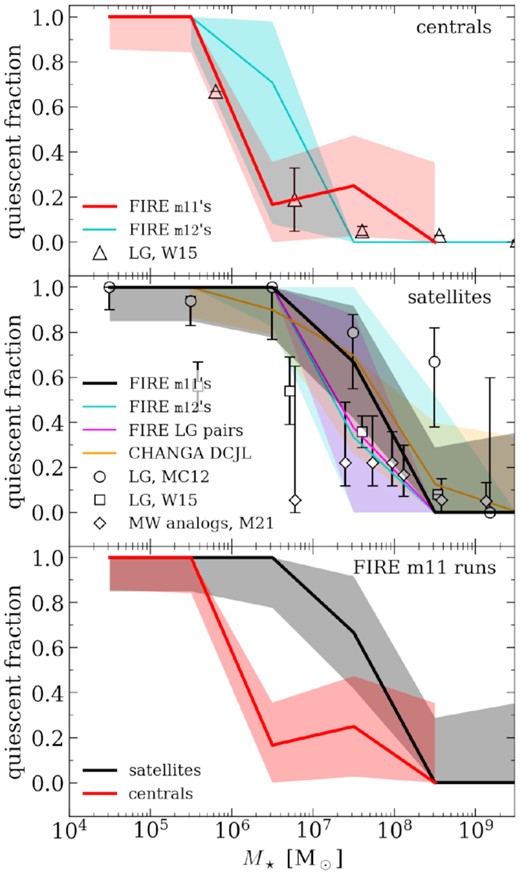
Stellar mass versus quiescent fraction in our simulations of LMC-mass hosts versus observed (points) LG galaxies and simulated (shaded regions) LG- or MW-like haloes. MC12 (McConnachie 2012) and W15 (Weisz et al. 2015) report data for the LG itself, while M21 (Mao et al. 2021) report data for observed MW analogues. We define the quiescent fraction as the number of galaxies in each mass bin that have tquench < 13.2 Gyr (i.e. selecting all galaxies that have not formed a star particle within the last 500 Myr) to allow for variations that may arise from finite time-steps and star particle mass limits. We find that LMC-mass hosts are able to quench their satellite population to nearly the same degree as MW- or LG-like hosts, perhaps a surprising result given their significantly smaller halo masses and baryonic content. References: FIRE MW + LG – Samuel et al. (2022); CHANGA – Akins et al. (2021); MC12 – McConnachie (2012) (as compiled by Wetzel et al. 2015b); W15 – Weisz et al. (2015); M21 – Mao et al. (2021).
Largely, our population of LMC satellites quenches similarly to LG satellites. Consistent with observations of satellites within the LG (McConnachie 2012; Wetzel et al. 2015b) as well as with simulated MW/LG satellites (in FIRE-2 – Samuel et al. (2022); and CHANGA – Akins et al. 2021), we find that LMC satellites with M⋆ < 107 M⊙ are universally quenched, and satellites with M⋆ ≳ 108 M⊙ are predominantly star-forming. This is also in agreement with semi-analytical models of the LG population (Fillingham et al. 2016, 2019). The interim region of 107<M⋆ < 108 M⊙ consists of satellites that are either presently star-forming or quenched within the last ∼2 Gyr. In contrast, we find that 90 per cent of nearby centrals are quenched below M⋆ < 106 M⊙, while 91 per cent of centrals with M⋆ > 106 M⊙ are star-forming by z = 0, with outliers in quenching status also being outliers in halo mass. This indicates that satellites of M⋆ = 106–107 M⊙ are ideal probes of environmental quenching, while satellites with M⋆ > 108 M⊙ are difficult to quench, in agreement with previous work on the quenching of satellites of higher-mass hosts (Wheeler et al. 2014; Fillingham et al. 2015; Weisz et al. 2015; Wetzel et al. 2015b). We therefore find that LMC-mass hosts, though they possess a reduced amount of substructure, may in fact be able to quench their satellites in a similar manner as MW/LG-like environments.
Fig. 4 shows the stellar mass and 90 per cent quenching time-scale (τ90) for our simulated centrals and satellites, as well as observed LG satellites as reported by Weisz et al. (2015). The highlighted region indicates the τ90 range of environmentally quenched satellites (EQSs; see Section 3.3). Note that τ90 and tquench are not identical quantities; tquench indicates the formation time of the youngest star particle, while τ90 represents the time at which 90 per cent of the z = 0 stellar mass was formed. The EQSs of LMC-mass hosts are consistent with the trend of observed LG satellites in their stellar masses and τ90, further supporting the case that isolated LMC-mass hosts can environmentally influence their satellites similarly to the LG. The bottom panel of Fig. 4 shows the z = 0 distance to the primary central normalized to its R200m versus stellar mass for both satellites and centrals, also marking their star-forming state. Note that there are far fewer star-forming satellites than centrals. Consistent with Fig. 3, we define quenched satellites as those with tquench< 13.2 Gyr (i.e. not having formed a star particle in the last ∼500 Myr).
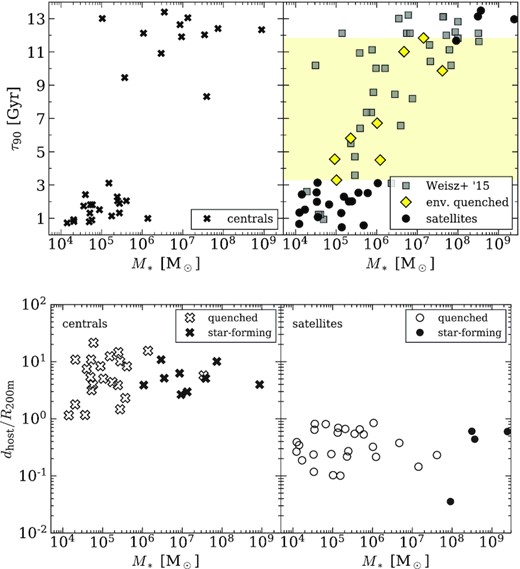
Top panels: stellar mass versus the 90 per cent star formation time-scale (τ90) for simulated satellites and field galaxies, including observed LG dwarf galaxies from Weisz et al. (2015). We use τ90 here as a comparable analogue to the observational data, representing the cosmic time at which 90 per cent of the present-day stellar mass was formed. The yellow shaded region denotes the range in τ90 for EQSs, which are plotted as yellow diamonds (see text for identification criteria). We find that our simulated EQSs fall within the distribution of observed galaxies in the LG. We find fewer low-mass late-forming satellites, though that could be due to the high variance of quenching times and our small sample size. Bottom panels: stellar mass versus z = 0 distance to the host galaxy, normalized by R200m. Star-forming galaxies are shown as solid markers, while quenched galaxies are shown as open markers.
In Fig. 2, three centrals can be identified as having quenching times consistent with environmental quenching, i.e. 4 < tquench < 13.2 Gyr. Meanwhile, Fig. 4 shows a similar number of centrals with τ90 values in the range consistent with EQSs. We have checked the centrals individually and found that none are within 1 Mpc of the primary central LMC-mass galaxy at or near the time of quenching. In our sample, there are no centrals consistent with environmental quenching.
3.3 A closer look at environmental quenching
Here, we investigate the specific circumstances of quenching for the eight identified EQSs. Satellites were identified as being environmentally quenched by requiring intermediate to late quenching times such that 4 < tquench < 13.2 Gyr, and proximity to the host halo dhost(tquench) < 2R200m(tquench). We allow for objects to be located outside the host virial radius at quenching time due to previous works highlighting the consistency of galaxies within 2R200m of the MW with environmental quenching (Fillingham et al. 2018), indicating that the sphere of influence of the primary central is not strictly limited to such a radius. Three satellites quench outside their host R200m: 44820 at 1.7R200m, 56887 at 1.06R200m, and 82233 at 1.05R200m.
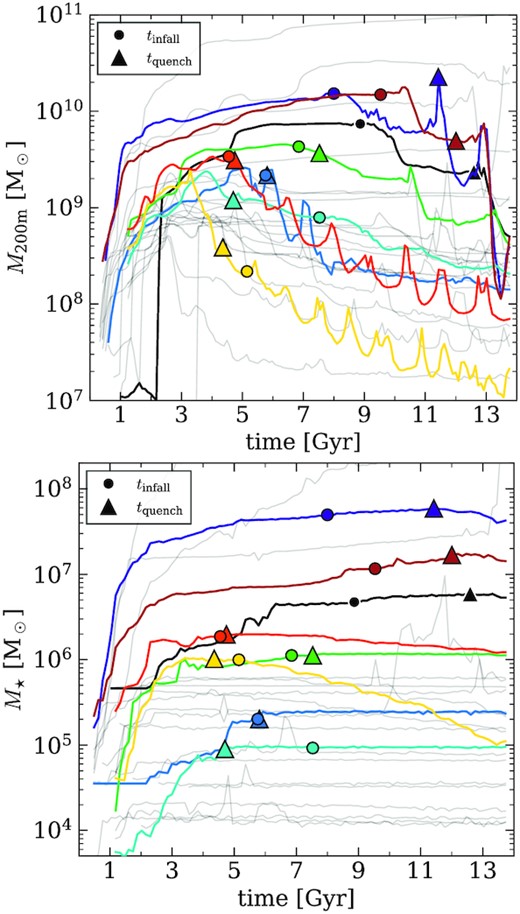
Fig. 5 shows the orbits of these objects, as well as the evolution of the host virial radius, whose intersection with each orbit defines the infall times (marked as circles). Halo ID numbers are shown in the figure in corresponding colours, and consistent colouring will be used in further plots that highlight this sample. Each host contains satellites whose orbits are not depicted in this figure for visual clarity. Rapid fluctuations in the orbits shown suggest that satellite–satellite interactions may be present. This is discussed further near the end of Section 3.3.2. Five of the eight EQSs were quenched at or near the host virial radius, often with infall times shortly before or after their quenching times, suggesting that the CGM of the hosts are dense enough to influence satellites of this mass. These galaxies are lower mass, with stellar masses of M⋆ ≈ 105–106 M⊙ and peak halo masses of Mhalo, peak ≈ 2 × 10⁹ M⊙. The other three EQSs are more massive, with M⋆ ≈ 107 M⊙, and Mhalo, peak ≈ 1010 M⊙. These satellites fell into their host haloes later, and quenched after first pericentre.

Top panels: orbits of EQSs, with the virial radius of the host shown as a red dashed line, infall times marked as circles, and quenching times (i.e. the formation time of the youngest star particle) marked as triangles. This population of satellites was selected as having been quenched between 4 and 13 Gyr, and that were quenched at a distance of less than twice the virial radius of their host at that time. Five of the eight galaxies were quenched before their first pericentre, suggesting that the gaseous haloes of these simulated LMC-mass hosts are rich enough to affect satellite evolution as far away as their virial radii. Bottom panel: quenching time-scales for EQSs, defined as tquench − tinfall such that galaxies that were quenched after infall appear above the horizontal line. The grey bar indicates the quenching time-scale due to stripping and feedback predicted for satellites of MW-like hosts (Fillingham et al. 2016). In addition, we plot the time-scales corresponding to the time of closest approach for subhaloes 44820 and 82233 (partially transparent cyan and yellow markers) of m11h due to the fact that they come within the vicinity of the host halo around their respective quenching time, but splash back on wider orbits before later falling into the host halo.
This trend can be seen in the bottom panel of Fig. 5, which shows the stellar mass of EQSs compared to their quenching time-scales, defined as τquench = tquench − tinfall. The three most massive EQSs have τquench ≈ 2–4 Gyr, while the lowest mass EQSs have −1 ≲ τquench ≲ 1 Gyr. Objects 44820 (cyan) and 82233 (yellow) undergo a pericentric passage around the host before falling within R200m (note the difference between quenching time and infall time markers in Fig. 5, and the orbital minima that occur near quenching time). We therefore include a secondary τquench based on the time of this pericentre rather than the infall time, as the boundary of the DM halo is somewhat arbitrarily defined, especially when considering the baryonic effects of the central galaxy. These points are shown as partially transparent markers connecting to the original point based on tinfall via a dashed line, and bring them into stronger agreement with the other low-mass EQSs, with faster quenching time-scales such that tinfall ≈ tquench.
The distinction in quenching time-scales and infall times of low-mass versus intermediate-mass satellites suggests that there may be further stellar mass dependence within the quenching model of Fillingham et al. (2016). We have indicated their predicted quenching time-scales due to feedback and ram-pressure/turbulent stripping for satellites of MW-mass hosts in the bottom panel of Fig. 5 as a grey bar. We find that intermediate-mass (M⋆ ≈ 106.5–107.5 M⊙) satellites of LMC-mass hosts have somewhat longer quenching time-scales than predicted for satellites of MW-mass hosts. This makes sense in light of the lower stellar mass-to-halo mass ratio for dwarf galaxies like the LMC, and the predicted lower level of disruption for such systems when compared to MW-mass hosts (Jahn et al. 2019). We also find that low-mass satellites (M⋆ ≲ 106 M⊙), which are not resolved in the analysis of Fillingham et al. (2016), have somewhat lower quenching time-scales than predicted for intermediate-mass satellites. This is likely due to the lower binding energy of their less massive DM haloes, leading to higher susceptibility to ram-pressure stripping and therefore quenching earlier in the infall process from less dense gas in the outer parts of the parent halo. In principle, this mechanism should apply to hosts of any mass, suggesting fast quenching time-scales (perhaps within −0.5 to 0.5 Gyr) for low-mass satellites of MW-like hosts. It is unclear at this point whether these two subtypes (i.e. M⋆ ≈ 106.5–107.5 M⊙ with tinfall > 8 Gyr and quenching time-scales of 2–4 Gyr versus M⋆ ≲ 106 M⊙ with tinfall < 7 Gyr and quenching time-scales of −0.5 to 0.5 Gyr) lie on a continuous distribution of satellite quenching behaviour, or if there is a stellar mass cutoff between distinct populations.
The top panels of Fig. 6 show the total and cold gas mass within 2R50⋆(t) for each EQS as a function of time, where R50⋆ is the stellar half-mass radius. We find that R50⋆ ranges from 0.5 to 2 kpc for EQSs, roughly scaling with stellar mass. Gas with high velocity relative to the satellite is excluded such that |vgas − vsat| < 10 ×max[vcirc, σv], all measured within the satellite. We find universally steep drop-offs in gas content near the quenching time for each galaxy, suggesting some form of hydrodynamic gas removal, which operates on much faster time-scales than gravitational stripping or starvation (Fillingham et al. 2015; Emerick et al. 2016). It is possible that the final drop-offs result in quenching due to the proximity of the satellite to the host, where gas is denser and ram pressure is more effective. A large degree of fluctuation in the gas content of these galaxies is observed in this figure. The cause of this is twofold: (i) energetic feedback from FIRE, which redistributes gas in the inner regions of the subhaloes, and (ii) variations in the value of R50⋆, as computed by rockstar. As such, it is difficult to interpret the degree to which the fluctuations preceding the final drop in gas content represent true changes in gas content. Visual follow-up as in Fig. 8 was used to confirm the final removal of gas at tquench for all EQSs.
![Top four panels: total (thin) and cold (thick) gas mass within 2R50⋆(t) for each EQS, excluding gas with high relative velocity to the satellite such that |vgas − vsat| < 10 ×max[vcirc, σv], all measured within the satellite. R50⋆ is the stellar half-mass radius, and ranges from 0.5 to 2 kpc, roughly scaling with stellar mass. Each galaxy experiences a steep drop in Mgas at or near its quenching time, indicating the removal of gas through either star formation bursts or ram pressure (or both) rather than starvation or gravitational stripping, which are characterized by slower reductions in Mgas (of the order of several Gyr or longer). Bottom two panels: cold gas mass within 2R50⋆(t) for star-forming (left-hand panel) and quenched (right-hand panel) centrals. We find a consistent presence of cold gas throughout the history of centrals that are star-forming at z = 0, while quenched centrals cease to contain cold gas after their quenching times.](https://oup.silverchair-cdn.com/oup/backfile/Content_public/Journal/mnras/513/2/10.1093_mnras_stac811/1/m_stac811fig6.jpeg?Expires=1750644576&Signature=iz4YC4aIcv4oaQZFOUFnYQ45du9Qcv1zpwxgiJICMSA5gQ3Y~QhTEGRtk9BO7bmEiLmU46-kub9cNfVAmBGWVHtmXraTYEzc58aKecwvjI8e-yaOItIBOf3NaaxlfzqapAwGzrW0IVTpjHYaf5uOfz2Cf2uWL1XuqJQNUVcIL5Ai0Xvk2QXGWSrD3eI56WOu6~hFNNCjLehTVC3~uaJ1Kq3BRbulJOpyf9kYchCwKy5XFLemqZ-gtXhQDdpTqD4tWb944CviO-k3q3BmEBmikGymKP61aBPTwRG5Pk--6bx8xhh4tkdtLwuifqzWzxOWNru3Lo-KcTxFmSpJEuuncA__&Key-Pair-Id=APKAIE5G5CRDK6RD3PGA)
Top four panels: total (thin) and cold (thick) gas mass within 2R50⋆(t) for each EQS, excluding gas with high relative velocity to the satellite such that |vgas − vsat| < 10 ×max[vcirc, σv], all measured within the satellite. R50⋆ is the stellar half-mass radius, and ranges from 0.5 to 2 kpc, roughly scaling with stellar mass. Each galaxy experiences a steep drop in Mgas at or near its quenching time, indicating the removal of gas through either star formation bursts or ram pressure (or both) rather than starvation or gravitational stripping, which are characterized by slower reductions in Mgas (of the order of several Gyr or longer). Bottom two panels: cold gas mass within 2R50⋆(t) for star-forming (left-hand panel) and quenched (right-hand panel) centrals. We find a consistent presence of cold gas throughout the history of centrals that are star-forming at z = 0, while quenched centrals cease to contain cold gas after their quenching times.
While some galaxies retain or even re-accrete some amount of gas, none reignite their star formation after the primary gas-loss event. Take, for example, the m11h satellite 56887 (bottom left-hand panel, green line), which is on a splashback trajectory before settling permanently in an orbit within the virial radius of the host halo at t ∼ 9 Gyr. This satellite loses its gas and quenches after first infall, but is able to regain some gas on its trajectory back out of the host halo. It is possible that some or all of this gas is not tightly bound to the satellite, as our velocity cuts are somewhat liberal, but ∼106 M⊙ of gas remains within that radius during the object’s splashback orbit for another few Gyr before it infalls again and fully loses all remaining gas content. Interestingly, the re-accretion of gas to pre-quenching levels is not sufficient to reignite star formation in the satellite. This is likely due to a combination of factors, including the fact that the re-accreted gas is kinematically perturbed and does not reach sufficiently cool temperatures and high densities to qualify for FIRE’s star formation criteria. The correlation of multiple infall and subsequent gas removal events is an encouraging suggestion that the environment of the host halo is responsible for stripping away any gas bound to the satellite. We therefore turn our attention to the CGM properties of the LMC-mass host galaxies.
The bottom two panels of Fig. 6 show the history of cold gas within star-forming and quenched centrals. There are no obvious signatures in these data that distinguish the gas content of centrals from EQSs. We therefore look into further details of the gas content of EQSs in Section 3.3.2. For now, we turn our attention to the gas content of the host haloes.
3.3.1 Characterizing the gaseous haloes of LMC analogues
Fig. 7 shows the temperature and density projection for each LMC-mass host in out sample, as well as the phase diagram of halo gas (defined as 2R50⋆ < rgas < R200m and outside 2R50⋆ of luminous satellites), with each pixel coloured according to the total mass of gas contained within it. Projections are constructed by selecting gas with |x| < 1.1R200m, |y| < 1.1R200m, and |z| < 0.2R200m, where z is perpendicular to the plane of the figure. We choose no particular orientation with respect to the host galaxy. This gas is then divided into evenly spaced 2D (x, y) pixels, giving a column of gas with length 0.4R200m. The pixel is then coloured according to the median physical value of temperature or density for all particles within its boundary. If there are no particles within the pixel, it is coloured according to the median value of nearest non-empty pixels.

Properties of the gaseous haloes of all LMC-mass haloes at z = 0. The left-hand column shows a projection of gas temperature, the middle column shows a projection of gas density (with points marking the locations of satellites), and the right-hand column shows the phase-space diagram for halo gas, defined as 2R50⋆ < rgas < R200m and outside 2R50⋆ of luminous satellites. The total mass of halo gas for each host is listed in Table 1. Each host exhibits a significant mass in a hot (T = 104.5–106 K) corona with M = 3–6 × 10⁹ M⊙, with highly structured regions of hot (rarefied) versus cold (dense) gas, with visible shock fronts.
We find that a hot, richly structured gaseous halo is present around all LMC-mass hosts to varying degrees. While not all centrals are host to EQSs, the ubiquity of the rich gaseous halo suggests that the presence of such galaxies relies more on varying cosmological abundances of structure than it does on the ability of any particular LMC analogue to quench its satellites. We identify two primary components of the CGM based on features in the phase diagrams: the hot corona, found in the upper left-hand quadrant, and the horizontal feature of T∼ 104 K gas with 10−4 ≲ ρ/cm−3 ≲ 100. Some runs also contain a small component of cold, dense gas in the lower right-hand quadrant. Star-forming gas in FIRE is restricted to densities above 103 cm−3, and is not abundant enough outside 2R50⋆ compared to the halo gas to appear in this figure.
Quantifying the hot corona as gas with 104.5 < T/K <106, and 10−6 < ρ/cm−3 < 10−4, as well as being located outside 2R50⋆ of the host galaxy and all satellite galaxies, we find that LMC-mass haloes have 3–6 × 10⁹ M⊙ of gas in their hot coronas. Additionally, we find mean gas densities of ∼5 × 10⁻⁴ cm−3 and mean temperatures of ∼1 × 10⁵ K, both quantities volume-weighted. These predictions are in good agreement with the detection of a hot ionized component in the LMC (Wakker et al. 1998; Lehner & Howk 2007) suggesting the presence of hot gas around the Magellanic Clouds as well as with recent theoretical arguments of a need of a hot corona in the LMC to fully explain the morphology of the Magellanic stream (Lucchini et al. 2020). While there are differences in the presence and radial distribution of hot and cold CGM components between LMC and MW-mass galaxies in the FIRE-2 simulations (Stern et al. 2021), the existence of a relatively massive hot component out to ≳100 kpc is consistent between host mass scales.
We note that several satellite galaxies possess quite large stellar masses, with M⋆ ∼ 108–109 M⊙, comparable to the primary hosts themselves (see Table 1). One such high-mass satellite is present in m11d, with M⋆ = 3.12 × 10⁸ M⊙, and two are present in m11v, one with M⋆ = 3.7 × 10⁸ M⊙ and the second with M⋆ = 2.45 × 10⁹ M⊙. We find that the presence of at least one large (M⋆ ≥ 108 M⊙) companion is consistent with a higher-than-average mass of gas located outside 2R50⋆ of the host and all satellite galaxies. The runs m11d and m11v contain ∼1010 M⊙ of such gas, while the average mass of such halo gas for the other runs is 5 × 10⁹ M⊙ – a factor of 2 increase in the amount of halo gas for hosts with large companions. Interestingly, the presence of massive satellites is not consistent with an increase in the number of EQSs, suggesting that the rate of occurrence for EQSs is more dependent on (1) the total number of satellites and (2) the circumstances of their infall, rather than being reliant on the total mass of halo gas present in the host.
In a contrasting example, we find that m11h has an abundance of low-mass satellites, yet possesses the lowest halo gas mass, and a complete lack of T ∼ 104 K gas within R50⋆. The lack of such gas points to the possibility that this host is quenched, which is confirmed by the 95 per cent star formation time-scale of τ95 = 12.3 Gyr, compared to the remainder of the sample, which form the same fraction of their stars about 1 Gyr later. m11h also possesses the lowest stellar mass-to-halo mass ratio, as well as the lowest gas mass-to-halo mass ratio, despite its halo mass being close to the average for our sample, as seen in Table 1. However, its hot corona is comparable in mass, temperature, and distribution to the remainder of the sample. This host contains the highest number of EQSs. Clearly, the star-forming status of the host and the lack of cold halo gas at z = 0 are not indicative of an inability to quench its satellites. Follow-up analysis is needed to investigate the redshift dependence of the state of its CGM in order to link properties of halo gas to the quenching of its satellites.
3.3.2 Quenching via ram pressure and feedback
There are many possible sources for gas removal in satellites, for example, energetic feedback from star formation that can be induced by the increased pressure of the host environment, interactions with other galaxies, or ram-pressure stripping from the ambient halo gas. The time-scale of gas removal seen in Fig. 6 is short enough to rule out starvation, which occurs on longer time-scales as gas reservoirs within the satellite are depleted (Fillingham et al. 2015). Interactions such as fly-by events and ram-pressure stripping are functions of environmental properties (abundance of satellites, density of gas), while feedback-driven, self-induced quenching only depends on the SFH of each galaxy (though the SFH may also be dependent on host environment). It is likely that a combination of these effects simultaneously occurs in orbiting satellites.
Although the energetic feedback of the FIRE simulations is certainly enough to strongly affect the interstellar medium (ISM) of dwarf galaxies (El-Badry et al. 2016, 2017, 2018; Hopkins et al. 2018b), the general lack of isolated dwarfs with tquench = 4–13 Gyr and M⋆ = 105–107 M⊙ makes self-quenching alone an unlikely cause for the halting of star formation in these satellites. However, one could not rule out environmentally induced starbursts (i.e. from compression of gas at orbital pericentres), or removal of low-density gas blown out by feedback, which may have cooled and fallen back into the satellite if it were in isolation, but is easily swept away by the high density of the host’s ISM. Such effects, which may not neatly be described as strictly environmental or strictly self-induced, seem to drive the evolution in some of the satellites in our sample, as illustrated by the two case studies presented next.
Fig. 8 shows a series of density projections at four sequential time stamps of two low-mass satellites of m11h that were quenched near its virial radius. The top panel shows halo 66354 (red in previous figures), and the bottom panel shows halo 82233 (yellow). Also shown is the normalized gas velocity field in the reference frame of each satellite. Time stamps were chosen simply to highlight the state of the gas in and around each satellite as it is quenched, with the first panel being chosen as the snapshot immediately prior to the formation of its last star particle. The stellar half-mass radius of each satellite is also shown as a red circle. Each frame is centred on the satellite’s position at the given time.
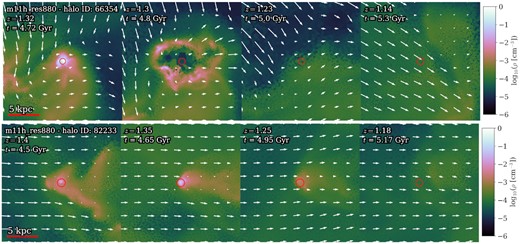
Gas density (colour) and velocity (arrows; in the reference frame of the satellite) projection of two satellites of m11h as they fall into the host halo, demonstrating two primary modes of quenching: star formation-driven stripping (top) and standard ram-pressure stripping (bottom). Each image is centred on the halo location as provided by rockstar at the shown snapshot, despite the lack of obvious structure in later panels. The orientation of panels is not chosen in respect to any particular alignment of objects. The satellites are similar in size, with M200m(tquench)2 ≈ 3 × 10⁹ M⊙ and M⋆(tquench)1 ≈ 2 × 10⁶ M⊙, and they both quench around t ∼ 4.5 Gyr. The first panel of both rows shows the satellite near tquench, with visible tails due to its motion through ambient halo gas. The top row demonstrates quenching due to a combination of feedback and ram pressure, which is a common mechanism among our population satellites. The bottom row demonstrates a classic example of ram-pressure stripping of a satellite.
The top row shows a satellite with M200m(tquench) ≈ 3 × 10⁹ M⊙, M⋆(tquench) ≈ 2 × 10⁶ M⊙, and Mgas(tquench) ≈ 106 M⊙, where tquench = 4.75 Gyr. It demonstrates trails characteristic of ram pressure in the first panel, but the gas is sufficiently dense in its core as to resist stripping. The velocity field reveals turbulence around the galaxy as well, though there is a clear front of gas moving downwards from the top of the figure. The second panel shows a burst of star formation that moves this gas out of the central region, heating and rarefying it. This enables the gas to be pushed out of the halo by the pressure from ambient halo gas in the third panel, resulting in no clear gaseous component to the halo in the fourth panel, where the velocity field has become more uniform. This process is generally consistent with ram-pressure stripping, though it requires sufficient stellar feedback to ‘loosen’ the gas within the satellite before the ambient halo pressure is capable of stripping and quenching it.
The bottom row shows a second similar-mass satellite, with tquench ≈ 4.5 Gyr, this time with a much more uniform velocity field. This object demonstrates a more standard picture of ram pressure characterized by a gas stream extending from the satellite opposite to the direction of motion. There is no feedback event that processes the gas prior to stripping – the pressure from ambient halo gas is sufficient to strip away the dense, bound gas within the satellite. Note that the second panel shows an increased amount of dense gas within R50⋆ due to compression via the ambient velocity field. The time-scale for each galaxy to go from possessing dense, concentrated, star-forming gas to possessing virtually no gas is ∼300 Myr in both cases, though it is slightly faster in the case where feedback is involved.
An important qualification to this analysis is that both satellites come from the same parent halo – m11h. This halo is host to an unusual abundance of satellites: 10 in total (12 including all subhaloes with assigned star particles, forgoing the cuts described in Section 3.1). As seen on the left-hand side of the first panel of the top row in which an additional locus of dense gas is present, satellite–satellite interactions can also be a source of environmental quenching. This particular event seems to have compressed the gas in the satellite shown, leading to a strong burst of star formation, rarefying the gas and making it more susceptible to ram-pressure stripping via the halo gas. These objects were chosen for the case study due to their high resolution and obvious visual features. We have done a similar analysis of all EQSs and find ram pressure alone or in combination with feedback from star formation to be the quenching mechanism for all EQSs.
Interactions can also be seen in the orbits of the above objects in Fig. 5, which appear to have pericentre with some object other than the host prior to final infall. We have checked this explicitly, though the other satellites are not shown in the figure for visual clarity. We include this type of interaction under the umbrella of environmental quenching, though it does require the presence of sufficiently many companion galaxies within a certain volume for satellite–satellite interactions to take place. This requirement favours satellite interactions at later times, when the satellites occupy a smaller volume and thus have orbital paths that increase the likelihood of close approach. It is unclear how cosmologically common satellite interactions are within LMC-mass systems, but in our set of 6 primary centrals and 30 satellites, we identified a minimum of 1 host with 2 instances of interactions.
The pre-processing of satellites prior to infall is a natural prediction of ΛCDM (Li & Helmi 2008; Wetzel et al. 2015a; Benavides, Sales & Abadi 2020), with part of the aim of this study to understand how the environment of the LMC could have affected its satellites prior to the group’s infall into the halo of the MW. We expect that pre-processing – whether due to prior group association or individual fly-by events – before infall into LMC-mass haloes will perhaps be less common than for systems like the MW, simply due to the relative abundance of structure in each. However, this example demonstrates that pre-processing on much smaller scales than the MW is indeed possible, and perhaps contributes to the relatively high amount of EQSs within m11h.
4 EFFECTS OF TIDES ON SATELLITES OF LMC ANALOGUES
It has been shown that MW-mass galaxies are hosts to rich tidal features, including coherent stellar streams and kinematically mixed stellar haloes (Helmi & White 1999). These features result from interactions between dwarf satellites on close orbits with their more massive hosts that tidally strip mass (both dark and luminous) from their companions. Similar processes are expected to occur also for satellites of lower-mass hosts, with a handful of observations confirming the presence of tidal streams in satellites of dwarf-mass centrals (e.g. Martínez-Delgado et al. 2012).
To investigate the tidal stripping of simulated satellites around LMC-mass hosts, the top panel of Fig. 9 shows the DM mass of satellites as a function of time, with the previously described population of EQSs highlighted. We find that the majority of satellites experience tidal stripping of their DM haloes, beginning at or near their infall times on to the host, with EQSs generally experiencing the largest decreases in halo mass, losing 82–99.9 per cent of the peak halo mass ever obtained. M200m for subhaloes is calculated via rockstar (Behroozi et al. 2013a), which defines the boundary between the subhalo as the location where the phase-space distribution of the its particles becomes equidistant from the subhalo and its host halo, removing the ambiguity of using a constant density threshold to define (sub)halo borders. This method does not restrict subhalo mass calculations to particles that are gravitationally bound, so it is possible that some of the fluctuation in mass observed in this figure is a result of DM particles that are unbound but similar in phase space being shed and re-accreted by subhaloes along their orbits.
DM mass (top) and stellar mass (bottom) of all satellites versus time, with EQSs highlighted in colour. All such satellites experience significant tidal stripping of their DM haloes after infall, with anywhere from 82 to 99.9 per cent of the DM mass being lost by z = 0. Stellar masses shown here are from rockstar, and do not necessarily reflect all stellar mass-loss due to stripping as streams are not detected and removed. However, stripping of the stellar component can still be seen in objects 82233 and 66354 (yellow and orange, respectively).
In one case (halo ID 82233, yellow), the satellite appears to have its halo mass reduced by a factor of ∼5 prior to quenching, and by a factor of ∼10 prior to first infall. This is the galaxy shown in the bottom panel of Fig. 8. It is clear from our previous analysis that ram pressure plays an important role in its quenching, but here we demonstrate that it is also subjected to severe tidal stripping. This object also experiences the highest magnitude of halo mass-loss by z = 0 due to its short orbital period, early infall time, and apparent interaction with other satellites prior to infall, as seen in Fig. 5.
The bottom panel of Fig. 9 shows the evolution of stellar mass of all satellites. Most satellite galaxies do not experience significant stripping of their stellar components as they are deeply segregated in the inner regions of their DM subhaloes (Peñarrubia, Navarro & McConnachie 2008), but we do find a handful of objects that appear to have had various degrees of stellar mass-loss due to stripping. Significant halo mass-loss is not necessarily a guaranteed indicator of stellar stripping, but the two haloes that lost the highest fraction of halo mass also lost the highest fraction of stellar mass (82233 and 66354). This makes sense as the DM component is far more extended than the stellar component, and would therefore be first to be stripped away when tidal forces begin to take hold.
Since gravitational interactions with satellites are known to be a source of stellar tidal streams in MW-mass galaxies, we plot the z = 0 locations of star particles that were assigned to any satellite galaxies at their infall times in Fig. 10. Streams were then identified by examining the evolution of the spatial distribution of such star particles. Streams became apparent when star particles were pulled from their original locations within satellites as they made close approaches to the host, forming extended stellar structures. We find four hosts with tidal streams originating from five satellites.
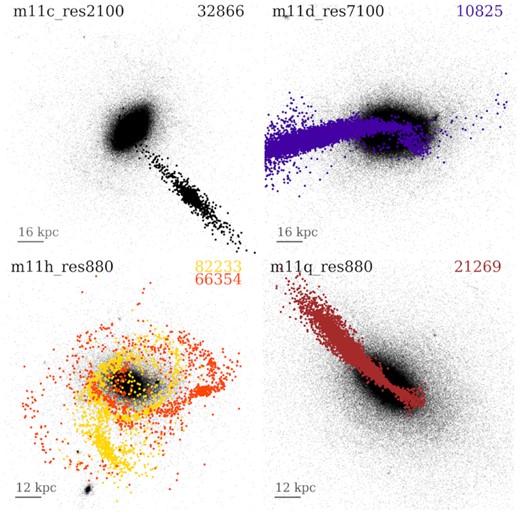
Tidal streams at z = 0 originating from stripped satellites around LMC-mass hosts. Small, black dots are star particles belonging to the host galaxy at z = 0, while thicker dots are the present-day locations of star particles belonging to satellites of the corresponding colour at their first infall times. We find coherent stellar streams in all hosts with EQSs, and none in hosts without EQSs. It is unlikely that the quenching is a direct result of this tidal stripping, but these could be correlated as a result of each effect’s individual dependence on satellite mass (coherent tidal streams require sufficiently many stars to strip – as well as late(r) infall times – while environmental quenching requires sufficiently high mass as to not be quenched by reionization heating).
We find no tidal features that arose from any satellite galaxy that was not environmentally quenched, be it a low-mass early-quenched galaxy, or a high-mass star-forming galaxy. This may be a result of mass selection: Low-mass satellites, while occurring frequently and infalling early, do not possess a large population of stars that can be striped with a well-resolved stream in our runs; meanwhile, high-mass satellites, while having an abundant stellar component, are less common and infall late, thus not having sufficient time to interact with the host. Tidal stripping is not the dominant factor in quenching these galaxies (see the location of triangle symbols in Fig. 9 mostly not correlated to stripping events); however, the shallowing of the DM potential as a result of tidal stripping pre-processes satellites such that their gas is less gravitationally bound and more susceptible to ram-pressure stripping, and hence, quenching of their star formation. Thus, while tidal stripping can contribute to the quenching of a satellite, we observe that the ‘final’ factor is typically ram-pressure stripping.
The streams depicted in Fig. 10 are highly extended, containing stars located within ∼1–4 kpc of the primary host galaxy out to ∼80 kpc. All stripped stars are on highly radial orbits, in agreement with previous theoretical predictions (Abadi, Navarro & Steinmetz 2006). The amount of stellar mass contained in the streams ranges from 106 to 107 M⊙, with a median value of 2 × 10⁶ M⊙. The streams around our simulated LMC-mass galaxies are quite substantial, and may be observable around dwarf centrals through deep photometry.
We find that tidal structures result from the highest mass EQSs, having a stellar mass range of M⋆, max = 106–107 M⊙. Most satellites in this mass range though are star-forming and late-infallers. The tidal structures from later-infalling satellites (such as those around m11c, m11d, and m11q) are morphologically distinct from those formed by early-infalling satellites, as they have not experienced enough dynamical times to become kinematically mixed. The streams around m11h originate from satellites that fell in around 9 Gyr ago, and have undergone many pericentres as seen in Fig. 5. This results in streams that are more diffuse, though still retaining clear spatial cohesion along the orbital path.
We note that we only investigate stellar streams that form directly as the result of tidal forces that strip stars from satellite galaxies as they orbit the central. Extended stellar structures also exist in the form of in-situ stellar streams and stellar haloes, which have been investigated in the FIRE simulations (e.g. Yu et al. 2020). El-Badry et al. (2016) showed that galaxies with M⋆ = 106.3–1010.7 M⊙ experience radial migration of stars on both short and long time-scales due to star-forming clouds that are driven to high radial velocities from bursty feedback, as well as due to energy transfer from the fluctuation of the galactic potential. This migration can result in stars located ≳10 kpc from the radial position of their formation, contributing to wide variations in half-light radius over time. They note that the stellar mass range M⋆ = 107–109.6 M⊙ is optimal for maximizing the physical effects that cause stellar migration, suggesting that LMC-mass centrals may have a significant in-situ stellar halo as well.
Recently, Panithanpaisal et al. (2021) investigated the formation of stellar streams around MW-mass galaxies in the FIRE-2 simulations. They find that present-day satellites are good proxies for the progenitors of stellar streams. They further show that low-mass (M⋆ < 2.25 × 10⁶ M⊙) stream progenitors are likely to have their star formation quenched prior to infall, while progenitors above that stellar mass threshold are quenched by the host environment. This is consistent with our analysis of EQSs, though we find that low-mass stream progenitors may be environmentally quenched as well.
While tidal features arising from satellite interactions have been observed around dwarf galaxies (Martínez-Delgado et al. 2012; Carlin et al. 2019), their frequency is as of yet unknown. The presence of resolved stellar streams in configuration space around four of our six LMC-mass hosts is an encouraging sign that satellite–host interactions may result in observable tidal structures in a substantial fraction of LMC-mass dwarf galaxies in the field.
5 SUMMARY AND CONCLUSIONS
We investigate various properties of the satellite population of six LMC-mass hosts in the FIRE simulations. By comparing their SFHs to those of other centrals of similar stellar mass in Fig. 1, we find that LMC satellites have more diverse SFHs and quenching times than central galaxies, which are strongly bimodal – either forming all their stars before t = 4 Gyr or continuing active star formation at z = 0. We further compare to simulated satellites of LG pairs from Garrison-Kimmel et al. (2019b, also in the FIRE simulations), and find that satellites of LMC-mass hosts have similar SFHs to LG satellites at fixed mass. LMC satellites retain the general mass dependence of quenching times: Low-mass satellites (M⋆ < 106 M⊙) quench early, while high-mass satellites (M⋆ > 107 M⊙) quench late or continue forming stars, as shown in Fig. 3. Intermediate-mass satellites have the greatest diversity of quenching times (Fig. 4).
We identified eight EQSs, selected as having intermediate quenching times (tquench = 4–13 Gyr) and located within twice the virial radius of the host at the time of quenching. By examining their orbits and quenching time-scales (Fig. 5), we identify two subtypes: higher-mass, late-infalling satellites that quench after first pericentre; and lower-mass, early-infalling satellites that quench near the host virial radius. It is unclear whether these subtypes are distinct populations, or if quenching time-scale and infall time are continuous functions of stellar mass. Encouragingly, early data from the LBT-SONG survey also hint at environmental quenching occurring in satellite dwarfs of three observed LMC-like hosts, NGC 628 (Davis et al. 2021), and NGC 4214 (Garling et al. 2020, 2021).
All our simulated galaxies experience a stark drop in their gas content after quenching (Fig. 6), indicating hydrodynamic rather than gravitational effects. We find that the LMC-mass hosts contain hot, richly structured gaseous haloes, with 3–6 × 10⁹ M⊙ of gas in their hot (T = 104.5–106 K), diffuse (ρ = 10−6–10−4 cm−3) coronas, as shown in Fig. 7. We further demonstrate that this rich environment is able to strip gas from satellites via ram pressure, halting their star formation. This process can be made more efficient through internal burst of feedback within the satellite, moving its gas to a higher energy state and expediting the effects of ram pressure. Case studies of two satellites that illustrate quenching due to star formation-aided ram-pressure stripping versus pure ram pressure are shown in Fig. 8.
By examining the evolution of the dark and stellar mass components of satellites, we find that all eight EQSs have lost 82–99.9 per cent of their peak DM mass via tidal stripping, with other satellites undergoing varying amounts of DM loss, some losing almost none due to their late infall times, as shown in Fig. 9. Stellar mass-loss greater than ∼10 per cent due to tidal stripping is rare, happening in only two satellites in our sample.
We investigate vestigial structures of host–satellite interaction by identifying the z = 0 location of stars that were assigned to satellites at their infall times, and find extended stellar streams around four of six LMC-mass hosts, as seen in Fig. 10. All originated from EQSs. Three formed from M⋆ = 106.5–107.5 M⊙ satellites infalling within the last ∼2 Gyr, while the two streams around the fourth host originated from (pre-infall) M⋆ ≈ 106 M⊙ satellites with infall time ∼8 Gyr ago, around z ∼ 1.
Our findings have strong implications for current and upcoming observational missions targeting LMC analogues in the field. We suggest that such objects may be host to one to four intermediate-mass (M⋆ = 105–107 M⊙) satellites that are likely to be environmentally quenched at intermediate to late times (tquench = 4–13 Gyr), depending on mass. This satellite population would be present alongside a potential bright, star-forming satellite, as well as approximately three or more ancient UF satellites with 104 ≤ M⋆ ≤ 105 M⊙, though not all of our runs resolve this scale. LMC-mass galaxies in the field can additionally host tidal streams due to past interactions with their satellites.
ACKNOWLEDGEMENTS
We would like to thank the anonymous referee for a constructive and useful report that helped improve the previous version of our manuscript. We also thank Annika Peter for suggestions and useful discussions on the first version of this work. LVS acknowledges support from the NASA ATP 80NSSC20K0566 and NSF CAREER 1945310 grants. AW and JS received support from: NSF via CAREER award AST-2045928 and grant AST-2107772; NASA ATP grants 80NSSC18K1097 and 80NSSC20K0513; HST grants GO-14734, AR-15057, AR-15809, GO-15902 from STScI; a Scialog Award from the Heising-Simons Foundation; and a Hellman Fellowship. MBK acknowledges support from NSF CAREER award AST-1752913, NSF grant AST-1910346, NASA grant NNX17AG29G, and HST-AR-15006,HST-AR-15809, HST-GO-15658, HST-GO-15901, HST-GO-15902, HST-AR-16159, and HST-GO-16226 from the Space Telescope Science Institute, which is operated by AURA, Inc., under NASA contract NAS5-26555. JSB was supported by NSF grants AST-1910346. We ran simulations using: XSEDE, supported by NSF grant ACI-1548562; Blue Waters, supported by the NSF; and Pleiades, via the NASA HEC programme through the NAS Division at Ames Research Center.
DATA AVAILABILITY
The data in these figures are available on reasonable request. FIRE-2 simulations are publicly available (Wetzel et al. 2022) at http://flathub.flatironinstitute.org/fire. Additional FIRE simulation data are available at https://fire.northwestern.edu/data. A public version of the gizmo code is available at http://www.tapir.caltech.edu/~phopkins/Site/GIZMO.html.
Footnotes
REFERENCES
APPENDIX A: STELLAR MASS-TO-HALO MASS RELATION
To supplement the discussion on the halo mass dependence of quenching in Section 3.1, Fig. A1 shows the stellar mass-to-halo mass relation of each object in our sample. The left-hand panel compares the stellar mass to the z = 0 halo mass (M200m) and the right-hand panel compares to the peak halo mass ever obtained (Mpeak), as determined by rockstar. The difference between z = 0 halo mass and peak halo mass is naturally larger in the population of satellites as opposed to centrals due to the tidal stripping of their haloes, as discussed in Section 4. The late-quenching centrals in the top right-hand panel of Fig. 1, as discussed in Section 3.1, are shown as grey X-shaped markers with black outlines. These two objects appear further to the right in both panels than other centrals in their stellar mass bin, indicating that they inhabit larger-than-average DM haloes with higher virial temperatures that were able to resist quenching via reionization heating, supporting the interpretation given above.
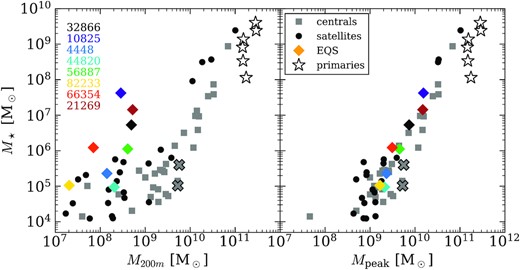
Stellar mass versus z = 0 halo mass (left-hand panel) and peak halo mass ever obtained (right-hand panel) for our entire sample. Centrals are plotted as grey squares, satellites as black circles, and LMC-mass primary centrals as star outlines. Satellites identified as being environmentally quenched are plotted as large black diamonds, colour coded according to the scheme used in the text, with halo IDs listed in the left-hand panel. The late-quenching centrals in the top right-hand panel of Fig. 1, as discussed in Section 3.1, are shown as grey X-shaped markers with black outlines.
