


ABSTRACT
Popular fast radio burst (FRB) models involve rotating magnetized neutron stars, yet no rotational periodicities have been found. Small data sets exclude exact periodicity in FRB 121102. Recent observations of over 1500 bursts from each of FRB 121102 and FRB 20201124A have also not found periodicity. Periodograms of events with cosine-distributed random offsets as large as ±0.6P from a strict period P would still reveal the underlying periodicity. The sensitivity of periodograms of long data series, such as bursts observed on multiple days, to slow frequency drifts is mitigated by considering individual observing sessions, and results are shown for FRB 121102. Models of repeating FRB without intrinsic periodicity are considered, as are models of apparently non-repeating FRBs.
1 INTRODUCTION
The sources of fast radio bursts (FRBs) remain mysterious. Strongly magnetized neutron stars (‘magnetars’) have long been proposed because their great magnetostatic energy is believed to be released in Soft Gamma Repeater (SGR) outbursts (Katz 1982), and because neutron stars have the short characteristic time-scales (manifested in the sub-ms rise times of SGR and in pulsar pulse widths and substructure) required to explain FRBs. As radio pulsars, magnetic neutron stars radiate coherently with extraordinarily high brightness temperatures, another property of FRBs. Although the giant outburst of the Galactic SGR 1806−20 did not produce an FRB (Tendulkar, Kaspi & Patel 2016), setting an upper bound on its isotropic-equivalent FRB energy about 11 orders of magnitude lower than that of FRBs at redshifts z ∼ 1, related objects, perhaps with different values of their parameters, are popular models of FRB sources (Platts 2018).
The magnetically mediated or powered emission of any rotating magnetized object must be periodic at its rotational frequency, unless the magnetic field is (implausibly) accurately dipolar and accurately aligned with the rotational axis. Radio pulsars are the classic example, and the pulses of RRAT (radio pulsars most of whose pulses are nulled) are separated by integer multiples of their underlying (rotational) periods. This applies even if the radiation is produced by a collimated relativistic beam far from the neutron star (Metzger, Margalit & Sironi 2019) because the direction of the beam and its radiation are tied to the orientation of the rotating neutron star. Even the thermal emission of anomalous X-ray pulsars (AXPs; the quiescent counterparts of SGRs) is periodic with their rotational period, as is the emission of accreting binary neutron stars.
Two types of periodicities may be considered: bursts separated by integer multiples of a stable underlying period (as in radio PSR and RRAT) and near-periodic modulation of activity. The latter describes a process that has irregular, perhaps random, scatter about the underlying stable period; an example is observed solar activity that is modulated at the underlying more stable solar rotation period. Either would produce a narrow spike in a periodogram and in the distribution of burst intervals.
Despite the expectation of rotational periodicity in the activity of repeating FRBs, no such periodicity has been found. Long-period modulation of the activity of two FRBs has been observed [16.35 d of FRB 180916 (CHIME/FRB Collaboration 2020) and 160 d of FRB 121102 (Rajwade et al. 2020)], but these periods are too long to be plausibly identified as neutron star rotational periods. Many repetitions of repeating FRBs have recently been reported, including 1652 bursts of FRB 121102 (Li et al. 2021) and 1863 bursts of FRB 20201124A (Xu et al. 2021), in both cases without a spike in periodograms extending over the approximately 2 months of observation or other evidence of periodicity. Are these results consistent with an underlying periodicity, as required in a magnetic neutron star model because neutron stars rotate, or do they point to entirely different models?
Orbital motion and spin-down may interfere with a search for periodic behaviour in a rotating neutron star model by introducing large phase offsets. Popular neutron star models of FRBs assume them to resemble SGRs (‘magnetars’), none of which are binary. For this reason and because of the difficulty of searching the large phase space of possible binary orbits and time dependence of the resulting phase shifts, this paper assumes a single object.
I first describe an unsuccessful search for exact periodicity in a small sample of bursts so closely spaced in time that period changes are unlikely to be significant. Next, I consider the effects of frequency drifts, such as would be produced by neutron star spin-down (or spin-up). These effects are mitigated by analysing each comparatively brief observing session independently; no periodicity is found. Then, I calculate the periodogram of a simple model in which an underlying clock is stable, but bursts are randomly distributed in phase about its period. The periodogram reveals the presence of the clock even when the random phase deviations, distributed by a cosine probability function, may equal or slightly exceed ± a half-cycle. The absence of significant peaks in the periodograms calculated here using the data of Li et al. (2021) [unfortunately, Xu et al. (2021) have not yet published or made available their data] is evidence that there is no such clock in FRB 121102, and supports arguments (Katz 2020) against magnetic neutron star models. Alternative models of repeating and non-repeating FRBs are considered in Section 7.
2 EXACTLY PERIODIC BURSTS
The resulting distribution of FOM is shown in Fig. 1. Some values of P will, entirely fortuitously, provide a good fit to the observed intervals even if there is no underlying periodicity. Because the frequency resolution is greater than the maximum physically possible frequency (the limiting rotation rate of a neutron star), and orders of magnitude greater than likely frequencies (SGR rotation rates), a true periodicity would appear as multiple occurrences of very small r.m.s. deviations from the smooth curve expected for uncorrelated pulses. No such excess is observed.
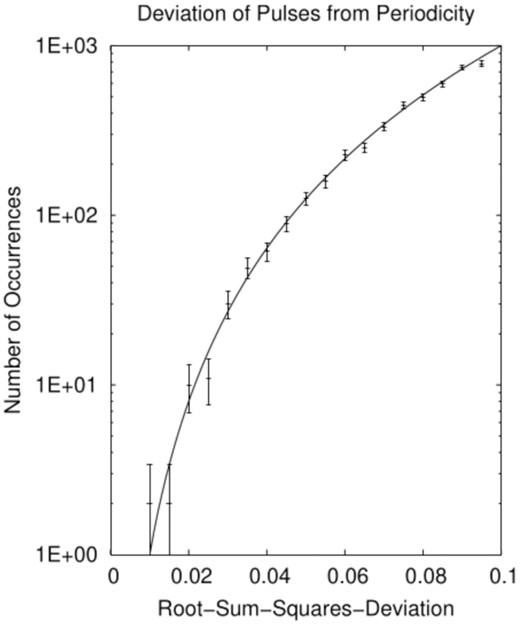
Distribution of r.m.s. deviations of times of bursts 11B–F of Gajjar et al. (2018) from integer multiples of exact periods, for 107 periods evenly spaced in frequency from 231 |$\mu$|Hz to 2.31 kHz (periods 0.432 ms to 1.2 h). Error bars are 1σ. A smooth curve, as observed, is expected for uncorrelated aperiodic bursts. Exact periodicity would appear as a period showing zero (except for measurement and roundoff errors) deviation; none is found.
3 THE PROBLEM OF FREQUENCY DRIFT
Unfortunately, calculating periodograms of entire data sets extending over months, as was done by Li et al. (2021) and Xu et al. (2021), may not reveal a periodicity because even tiny period derivatives can dephase bursts months apart. This is a particular problem for fast (ms) rotation periods, but would be less so for the multisecond periods of known SGRs/AXPs. For example, equation (2) shows that for |$T \approx 2\,$|months, as in the data sets of Li et al. (2021) and Xu et al. (2021), |$|\dot{\omega }| = 2 \times 10^{-12}\,$|s−2 is sufficient to dephase by 2π rad. For comparison, most SGRs/AXPs have |$|\dot{\omega }| \gtrsim 10^{-11}\,$|s−2. If repeating FRBs are made by SGR-like objects, periodograms of months-long data sets, as computed by Li et al. (2021) and Xu et al. (2021), may not reveal their periodicity.
This problem may be mitigated by computing the periodograms of individual observing sessions. The long data sets consist of many shorter observing sessions as the sources pass through the field of view of FAST, a transit instrument. For example, most of the observing sessions of Li et al. (2021) are 1 h long, although a few are as long as 5 h. These may be considered individually, and their average may reveal low-amplitude modulation not apparent in data from individual sessions (although frequency drift may move the signal to different periodogram bins in different sessions).
Li et al. (2021) detected bursts in 39 distinct observing sessions, spread over about 2 months. The number of bursts in a single session ranged from 1 to 122 (an additional 8 sessions detected no bursts). Of those 39 sessions, the 17 with at least 50 bursts (to ensure good statistics in the periodograms) were analysed; these comprise 78 per cent of the total 1652 bursts. The 17 individual periodograms, evaluated at the 3.6 × 10⁶ evenly spaced frequencies from 1 h−1 to 103 s−1, were then averaged.
There was no evidence of a periodicity in any of the individual periodograms or in their average. Because it is difficult to display graphically the 3.6 × 10⁶ elements of an individual periodogram, the distribution of averages of the amplitudes of the 17 single-session periodograms is shown in Fig. 2. Examination of the highest averages also shows no evidence for periodicity (which might occur at slightly different periods in the individual sessions, and be smoothed in the average): The greatest amplitude is only 3 per cent greater than the second highest, and they are at very different periods, not indicating a smoothed or broadened periodicity.
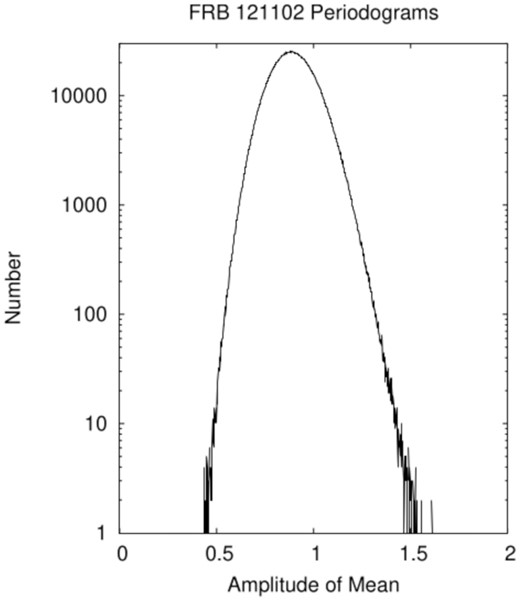
Distribution of the 3.6 × 10⁶ averages of the amplitudes of 17 single-session (sessions with ≥50 bursts) periodograms of the bursts of FRB 121102 for periods from 1 ms to 1 h (data from Li et al. 2021). The amplitude normalization is arbitrary. The distribution is close to the Gaussian expected for ‘shot noise’ burst times, somewhat broadened and skewed by the slow variations in activity of FRB 121102. The largest average amplitude in the data is 1.706; there is no evidence of periodicity.
The 17 individual single-session periodograms, which would not be expected to be significantly affected by period drift, also show no evidence of periodicity. None of the highest amplitudes exceed the second highest by more than 11 per cent, and in each periodogram the highest amplitudes are at very different periods, unlike a broadened peak. The top 10 are shown for each session and for the average in Tables A1 and A2.
The amplitudes of the largest values of the average periodogram are smaller than those of the individual-session periodograms because extremes are reduced by averaging with (smaller) values of the other periodograms at the same frequencies. The highest values of the averaged periodogram are at comparatively low frequencies (the frequencies are equally spaced from 1 h−1 to |$10^3/\text{s} = 3.6 \times 10^6\,$| h−1) because of slow variations in the activity of the source.
4 PERIODIC BURSTS WITH RANDOM PHASE SCATTER
The massive data sets of Li et al. (2021) and Xu et al. (2021) permit consideration of the hypothesis that there are underlying stable clocks but that bursts occur with random phase offsets from exact periodicity. This would be consistent with the failure to find exact periodicity in small data sets (Section 2).
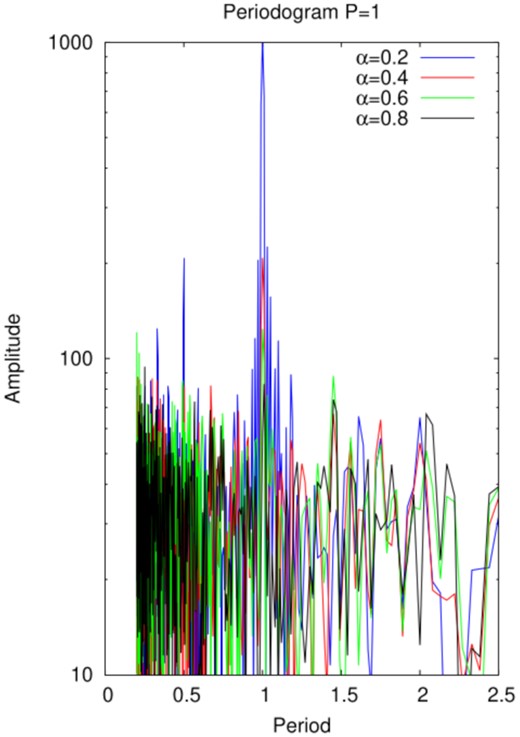
Periodograms for several values of α. If α ⪅ 0.6, there is an evident peak at the underlying period.
Fig. 4 shows realizations of the periodogram at the underlying period P as a function of α, normalized to the mean periodogram for periods from 0.01P to 5P, linearly spaced in frequency. The periodicity is evident for α ≤ 0.4.
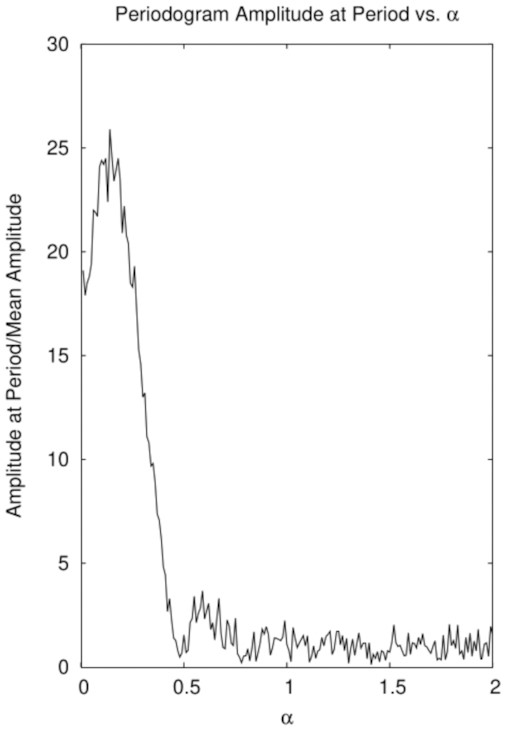
Values of the periodogram at period P, normalized by its mean, as a function of α.
The absence of a peak at the underlying period excludes this model for α < 0.4. Somewhat larger α may produce a peak at that period, although it may not be compellingly distinguished from the level of random fluctuations. In Fig. 3, the true period is known a priori, while in a real data set any true peak must be distinguished in a statistically significant manner from random fluctuations, requiring an amplitude greater than that shown for α = 0.6 and possibly even that for α = 0.4.
5 BURSTS WITH PERIODIC VISIBILITY MODULATION
Discarding these bursts at assumed unfavourable phases, the maximum values of the periodogram for all periods corresponding to evenly spaced frequencies from 1 h−1 to 103 s−1 (because any period is not known a priori, it is necessary to consider all possible periods) are shown in Table 1.
Peak values of the mean over 17 observing sessions of the periodogram when the observed bursts of FRB 121102 (Li et al. 2021) are discarded with a periodic probability, according to equation (10). The peak is a noisy function of β because the data have temporal structure, partly random (with 1652 bursts randomness does not completely average out) and partly systematic (the activity level of FRB 121102 varies systematically with time). Comparison to the peak amplitude of 1.706 for the actual data (see also Fig. 2) shows that the probability modulation amplitude β ⪅ 0.20.
| β | Peak periodogram |
|---|---|
| 0.00 | 1.706 |
| 0.05 | 1.720 |
| 0.10 | 1.722 |
| 0.15 | 1.736 |
| 0.20 | 1.798 |
| 0.25 | 1.760 |
| 0.30 | 1.813 |
| β | Peak periodogram |
|---|---|
| 0.00 | 1.706 |
| 0.05 | 1.720 |
| 0.10 | 1.722 |
| 0.15 | 1.736 |
| 0.20 | 1.798 |
| 0.25 | 1.760 |
| 0.30 | 1.813 |
The large modulation that would be expected for radiation by an oblique dipole or a more complex field distribution is not found; the data are consistent with no periodic modulation.
6 IMPLICATIONS
The absence of a peak in the observed periodograms, if interpreted as a consequence of random phase scattering, implies α ⪆ 0.4 or a half-range of scatter ±0.6P; the scatter from the N-th peak slightly overlaps those of the (N − 1)-th and (N + 1)-th. The quantitative result depends somewhat on the assumed cosine distribution equation (6). It depends chiefly on the width of the scattering rather than on the specific functional form assumed, which must necessarily be arbitrary. The raised cosine distribution (Hann function) used here is widely used in statistics (Nuttall 1981). A similar result could be found for a Gaussian, although then there would be an exponentially small (but not zero) probability of bursts implausibly displaced by arbitrarily large amounts from integer multiples of P.
The question of whether a scatter of ±0.4P (about ±2.5 rad) is consistent with a rotating neutron star model depends on a detailed model of FRB emission, which does not exist. Emission along a bundle of field lines emerging from a magnetic pole implies narrow collimation along the magnetic axis (as is apparently the case in radio PSR and RRAT, as inferred from their pulse widths), but closed field lines are typically bent by ∼π rad (2π rad for the polar field lines of a dipole) before returning to the star. The location of the emission region is not known, so large scatter of the emission angles is not demonstrably impossible. Despite this caveat, the absence of periodicity in the observed burst arrival times suggests that aperiodic models, not based on rotating neutron stars, should be considered.
7 APERIODIC MODELS
Acceleration of energetic particles is nearly ubiquitous in astrophysics (Katz 1991). It is described phenomenologically, but there is no fundamental understanding of why it takes place. For example, much of the energy output of active galactic nuclei (AGNs) takes the form of particle acceleration and the (incoherent) emission of highly relativistic particles. Yet, it is not obvious why this is so: why does accretion on to a supermassive black hole convert so much of the accretional power to these non-thermal processes? If this were not an empirical fact, we would likely expect only the thermal emission of hot disc gas.
7.1 Repeaters
FRBs are not emitted by AGNs (although we cannot exclude the possibility of some analogous phenomenon). They are not emitted by stellar mass black holes, of which there are many in our Galaxy; if they were, the Galactic sources would dominate the FRB sky because of their proximity. FRB sources must be rare, and (with the possible exception of FRB 200428) no active FRB source appears to be present in the Galaxy. In the zoo of astronomical objects, this suggests accreting intermediate-mass black holes and their accretion discs (Katz 2017a, 2019, 2020). They are rare in the Universe, like FRB sources, and analogy to AGNs suggests the possibility of non-thermal processes. That analogy is also consistent with the persistent radio sources associated with FRB 121102 (Marcote et al. 2017), FRB 190520B (Nui et al. 2021), and FRB 20201124A (Ravi et al. 2021), and discussed more generally by Law, Connor & Aggarwal (2021).
In such a model, long-period modulation (CHIME/FRB Collaboration 2020; Rajwade et al. 2020) of the activity of a repeating FRB is readily explained as the result of precession of the plane of the accretion disc, and hence of the direction of emission emerging from its central funnel. Precession is a familiar, perhaps ubiquitous, feature of accretion discs; the original examples are Her X-1, whose disc surrounds a neutron star (Katz 1973), and SS 433, whose disc surrounds a stellar-mass black hole (Katz 1980). Neither of these has been observed to emit anything like an FRB, but their disc axes are never close to the direction to the observer, so emission close to that axis cannot be excluded. The rarity of similar objects (there is no known analogue of SS 433 in either our Galaxy or in any other, nor have intermediate-mass black holes been compellingly identified) is consistent with the low space density of sources of repeating FRBs, and motivates consideration of analogous systems as their sources.
Precession of the disc axis around the orbital angular momentum axis is a fundamental mode of oscillation of an accretion disc in a binary system, which can be excited by irregularity or turbulence in the accretion flow, with the companion’s gravity providing the restoring force. In addition, jitter about the mean precession is observed (Katz & Piran 1982) and may contribute to the aperiodicity of repeating FRBs. If FRBs are emitted along the disc axis, like the thermal plasma jets of SS 433 and the relativistic jets of AGNs, the rate at which such collimated activity will be observed depends on both the angle between the disc axis and the direction to the observer and the angular scatter of FRB emission about the disc axis. Neither has been modelled in detail, but might provide a natural explanation of the periodic modulation of burst activity of FRB 121102 and FRB 180916 as the effect of precession of the disc axis.
7.2 Non-repeaters
Several lines of evidence indicate that non-repeating FRBs differ qualitatively from repeating FRBs; they are distinguished by more than a repetition rate. One is the ‘sad trombone’ phenomenon characteristic of repeating FRBs: within a burst, the frequency of emission drifts downwards, distinguished from the effects of dispersive propagation (Hessels et al. 2019; Josephy et al. 2019; Rajabi et al. 2020). Its origin is not understood, but it may be a useful phenomenological tool for distinguishing the two classes of sources even if only one burst has been observed. Other distinguishing characteristics have been reported by CHIME/FRB Collaboration (2021) and Pleunis et al. (2021).
Arguments derived from the periodograms of repeating FRBs are inapplicable to non-repeaters. However, arguments based on the space density of FRB sources do apply to non-repeaters, and have been considered by Hashimoto et al. (2020). The volumetric rate of observed non-repeating FRBs in the local (z ≲ 1) universe approaches or exceeds that of known or plausibly inferred classes of catastrophic events, such as stellar collapses or mergers. The observed volumetric FRB rate is surely an underestimate of its true value, which is much larger if their emission is beamed, if there is a population of FRBs below instrumental detection thresholds. It is a priori implausible that the distribution of burst fluxes or fluences cuts off just below instrumental sensitivities (this would be inconsistent with the observation that both cosmologically distant and cosmologically local FRBs have fluxes and fluences ranging down to detection thresholds; they are not standard candles) or whether FRB distances are overestimated because of non-intergalactic contributions to their dispersion measures (Nui et al. 2021). The observed rate of apparently non-repeating FRBs can only set a lower bound on the rate of catastrophic events to which they are attributed because it is not determinable how many FRB-like events fall below the detection threshold. Almost any downward extrapolation of the flux or fluence distribution would indicate that the ‘true’ rate must be much higher than the observed rate.
Unless there is a completely unanticipated class of catastrophic events, appeal must be made to less catastrophic events that might, in principle, repeat, but at a much lower rate than those of known repeating FRBs. The giant outbursts of SGRs are not extrapolations of their smaller eruptions, but are qualitatively different outliers (Katz 2021a). This is attributed to a global rearrangement of the magnetic geometry, analogous to a crack that propagates through the entire neutron star crust, while the smaller eruptions are attributed to localized reconnection and flares. The giant outburst of SGR 1806−20 did not make an FRB (Tendulkar et al. 2016), likely because it filled the magnetosphere with opaque and electrically conducting equilibrium pair plasma (Katz 1996). Beaming is an unsatisfactory explanation because it would require 11 orders of magnitude difference between in-beam and out-of-beam emission, inconsistent with even a tiny amount of scattering or extension of the emission region along a field line.
A less energetic but global rearrangement, perhaps of a magnetosphere with lower field, might similarly be a statistical outlier (not the high-energy tail of a smooth distribution of smaller eruptions) without creating a dense pair plasma that would suppress FRB emission. It is impossible to estimate the recurrence time of such bursts (the recurrence time of SGRs is at least a few decades), but it might well be |${\gt} 1\,$|yr, making it difficult to observe repetitions, but |${\ll} 10^{10}\,$|yr, permitting an event rate orders of magnitude greater than the birth rate of FRB sources and the rates of stellar collapse, merger, or similar catastrophic events (Hashimoto et al. 2020). The development of instruments capable of large angular acceptance angle or all-sky monitoring of FRBs will offer the possibility of observing repetition rates |${\lt} 1\,$| yr−1.
8 DISCUSSION
The failure to detect periodicity in repeating FRBs casts doubt on popular models that attribute them to rotating magnetic neutron stars. The data exclude not only strict, PSR-like or RRAT-like periodicity, but also models with substantial scatter of burst times around rotations of a presumed neutron star source. Aperiodic models, such as accretion discs around black holes, should be considered, even though there is no understood mechanism by which they might produce FRBs (a problem also with neutron star models).
Black hole accretion disc models must address the absence of FRBs from known black holes, both stellar-mass black holes in binaries and supermassive holes in AGNs. This might be related to the mass of the black hole, which is why intermediate-mass black holes are suggested, although no mechanism for this is evident.
There may be large observational selection effects. The inner regions of the accretion discs and funnels of luminous stellar mass and AGN black holes are in the intense radiation fields that make these objects observable; such radiation fields are hostile environments for the acceleration of energetic electrons because of Compton scattering. If only a small fraction of black hole accretion discs are favourably oriented for the observation of FRBs, and FRBs are preferentially (or only) emitted by low-luminosity black hole accretion, then observational selection mitigates against the identification of FRB sources with identified black holes.
The related environments of FRB 121102 and SGR/PSR J1745−2900 (Katz 2021b) suggest this latter object as a candidate repeating FRB. No FRB has been observed from it, but its Galactic location means that even micro-FRBs would be detectable. It might repay monitoring.
Non-repeating FRBs pose a different problem because the rate of catastrophic events is insufficient, even if each catastrophe produces an observable FRB. This suggests appealing to intrinsically infrequent but repeating events that are not accompanied by a larger number of weaker events, such as would be implied by a power-law distribution of their fluxes or fluences, in analogy to the giant outbursts of SGRs.
ACKNOWLEDGEMENTS
I thank Alex Chen, Casey Law, and Tsvi Piran for useful discussions, Wang Pei for providing data in a computer-readable format, Lilly M. Canel-Katz for assistance in data processing, and an anonymous referee for pointing out the importance of phase drift in periodograms of long time series.
DATA AVAILABILITY
This theoretical study did not generate any new data. Codes and their output will be provided upon request.
REFERENCES
APPENDIX A: HIGHEST AMPLITUDES IN PERIODOGRAMS
Observing sessions from Li et al. (2021) used in the analysis. MJD values are truncated to whole days and refer to the beginning of the session; some extend into the next MJD. Durations are rounded to the closest whole hour.
| Session | MJD | Duration | # Bursts |
|---|---|---|---|
| 1 | 58724 | 3 h | 87 |
| 2 | 58725 | 3 h | 121 |
| 3 | 58726 | 4 h | 110 |
| 4 | 58727 | 5 h | 91 |
| 5 | 58728 | 3 h | 65 |
| 6 | 58730 | 1 h | 122 |
| 7 | 58733 | 1 h | 81 |
| 8 | 58738 | 1 h | 58 |
| 9 | 58746 | 1 h | 52 |
| 10 | 58748 | 1 h | 53 |
| 11 | 58749 | 1 h | 50 |
| 12 | 58752 | 1 h | 54 |
| 13 | 58753 | 1 h | 53 |
| 14 | 58754 | 1 h | 60 |
| 15 | 58756 | 1 h | 117 |
| 16 | 58757 | 1 h | 64 |
| 17 | 58758 | 1 h | 53 |
Amplitudes A (arbitrary units) of largest 10 elements of the average (top row, and left) and 17 individual-session periodograms, with periods from 1 ms to 1 h, of FRB 121102 bursts, from data of Li et al. (2021). The extreme values of the averaged periodogram are less than those of the individual-session periodograms because at a frequency at which one periodogram has an extreme value, others generally will not.
| ν (h−1) | A | ν (h−1) | A | ν (h−1) | A | ν (h−1) | A | ν (h−1) | A | ν (h−1) | A |
|---|---|---|---|---|---|---|---|---|---|---|---|
| 47 901 | 1.706 | 148 579 | 3.855 | 91 179 | 4.102 | 378 426 | 4.181 | 175 612 | 4.059 | 11 196 | 4.053 |
| 17 329 | 1.656 | 1071 898 | 3.758 | 69 896 | 4.095 | 162 156 | 4.023 | 549 345 | 3.992 | 1599 906 | 3.999 |
| 9624 | 1.622 | 2682 736 | 3.738 | 170 499 | 3.867 | 3148 | 4.007 | 6499 | 3.915 | 40 569 | 3.693 |
| 5389 | 1.609 | 48 531 | 3.661 | 141 895 | 3.809 | 248 731 | 3.966 | 129 301 | 3.758 | 616 044 | 3.635 |
| 26 551 | 1.609 | 3198 871 | 3.634 | 2614 574 | 3.766 | 64 707 | 3.957 | 3450 210 | 3.690 | 29 379 | 3.605 |
| 4445 | 1.608 | 931 421 | 3.616 | 2837 357 | 3.733 | 142 695 | 3.953 | 121 | 3.667 | 15 347 | 3.598 |
| 21 496 | 1.605 | 299 359 | 3.598 | 123 156 | 3.716 | 178 039 | 3.934 | 3545 877 | 3.623 | 15 659 | 3.583 |
| 2807 | 1.601 | 2279 492 | 3.591 | 11 118 | 3.702 | 105 138 | 3.933 | 8576 | 3.609 | 625 709 | 3.573 |
| 77 126 | 1.582 | 3541 614 | 3.528 | 601 611 | 3.695 | 195 010 | 3.846 | 3050 026 | 3.605 | 3204 853 | 3.557 |
| 61 291 | 1.565 | 1437 774 | 3.518 | 3040 658 | 3.683 | 3575 491 | 3.787 | 51 698 | 3.595 | 2329 041 | 3.506 |
| 159 675 | 4.244 | 189 010 | 4.466 | 3569 504 | 3.686 | 548 541 | 4.133 | 19 787 | 3.824 | 1511 | 4.066 |
| 3507 651 | 3.840 | 1788 | 4.275 | 22 776 | 3.653 | 2668 467 | 3.950 | 1808 884 | 3.671 | 50 929 | 3.799 |
| 375 944 | 3.817 | 7436 | 4.173 | 8272 | 3.639 | 141 965 | 3.762 | 30 795 | 3.668 | 31 241 | 3.740 |
| 2556 501 | 3.713 | 16 137 | 4.128 | 1097 262 | 3.594 | 2237 014 | 3.646 | 779 916 | 3.614 | 93 852 | 3.737 |
| 32 369 | 3.690 | 73 887 | 4.064 | 13 328 | 3.581 | 731 623 | 3.646 | 200 291 | 3.593 | 38 728 | 3.661 |
| 3370 705 | 3.664 | 770 860 | 3.962 | 2070 272 | 3.580 | 2004 880 | 3.593 | 2940 895 | 3.557 | 8160 | 3.608 |
| 1096 479 | 3.623 | 431 879 | 3.932 | 2515 606 | 3.579 | 702 377 | 3.576 | 1333 734 | 3.543 | 101 220 | 3.591 |
| 178 908 | 3.608 | 10 203 | 3.928 | 996 211 | 3.560 | 2822 125 | 3.573 | 45 791 | 3.536 | 104 497 | 3.576 |
| 3467 095 | 3.602 | 276 665 | 3.924 | 2449 052 | 3.504 | 24 339 | 3.570 | 78 545 | 3.528 | 3310 589 | 3.575 |
| 62 824 | 3.600 | 3069 486 | 3.905 | 1797 786 | 3.476 | 2950 469 | 3.567 | 110 489 | 3.508 | 787 970 | 3.572 |
| 2795 706 | 3.920 | 146 837 | 3.930 | 1078 954 | 3.783 | 867 699 | 4.022 | 1046 | 4.021 | 5688 | 3.834 |
| 2657 514 | 3.905 | 34 684 | 3.707 | 47 087 | 3.682 | 2509 | 3.944 | 1587 639 | 3.922 | 3161 165 | 3.671 |
| 2829 638 | 3.658 | 2741 838 | 3.616 | 1057 309 | 3.610 | 5733 | 3.878 | 828 385 | 3.734 | 3316 185 | 3.666 |
| 2295 030 | 3.653 | 2762 144 | 3.589 | 2494 837 | 3.589 | 40 230 | 3.816 | 27 757 | 3.714 | 102 691 | 3.656 |
| 2770 545 | 3.640 | 1489 132 | 3.572 | 2498 414 | 3.544 | 1703 863 | 3.777 | 2361 002 | 3.710 | 673 147 | 3.563 |
| 1566 664 | 3.598 | 1473 871 | 3.560 | 3539 423 | 3.529 | 52 659 | 3.769 | 806 658 | 3.684 | 163 929 | 3.546 |
| 4820 | 3.595 | 2531 777 | 3.558 | 104 813 | 3.500 | 98 413 | 3.763 | 3042 096 | 3.642 | 8669 | 3.538 |
| 2596 561 | 3.586 | 71 442 | 3.549 | 8233 | 3.496 | 92 342 | 3.755 | 266 | 3.623 | 63 167 | 3.533 |
| 2469 484 | 3.519 | 1404 559 | 3.548 | 1064 584 | 3.474 | 115 360 | 3.746 | 22477 | 3.610 | 960 611 | 3.532 |
| 3850 | 3.513 | 2527 031 | 3.544 | 2028 999 | 3.469 | 48 365 | 3.726 | 65 864 | 3.601 | 61 964 | 3.528 |
