


ABSTRACT
One of the largest uncertainties in stellar evolutionary computations is the accuracy of the considered reaction rates. The 12C(α, γ)16O reaction is particularly important for the study of low- and intermediate-mass stars as it determines the final C/O ratio in the core which influences the white dwarf (WD) cooling evolution. Thus, there is a need for a study of how the computations of WDs and their progenitors that are made to date may be affected by the uncertainties of the 12C(α, γ)16O reaction rates. In this work, we compute fully evolutionary sequences using the mesa code with initial masses in the range of 0.90 ≤ Mi/M⊙ ≤ 3.05. We consider different adopted reaction rates, obtained from the literature, as well as the extreme limits within their uncertainties. As expected, we find that previous to the core helium burning (CHB) stage, there are no changes to the evolution of the stars. However, the subsequent stages are all affected by the uncertainties of the considered reaction rate. In particular, we find differences to the convective core mass during the CHB stage which may affect pulsation properties of subdwarfs, the number of thermal pulses during the asymptotic giant branch and trends between final oxygen abundance in the core and the progenitor masses of the remnant WDs.
1 INTRODUCTION
Single stellar evolution is fuelled by nuclear reactions that occur within the stellar interior (Bethe 1939; Hoyle 1946, 1954; Burbidge et al. 1957). These reactions not only release energy which allows the star to support itself against gravitational collapse and remain in hydrostatic equilibrium, but also change the composition of the star: this is known as nucleosynthesis (Eddington 1920; Hoyle 1954; Burbidge et al. 1957). The study of these nuclear reactions is where nuclear physics and astronomy come hand-in-hand; an understanding of what happens at the fundamental level provides a better knowledge of how stars evolve and influence their environment. Particularly, improved estimations of the often uncertain reaction rate data, including formula fitted to such data, will improve the accuracy of stellar evolution codes and the understanding of stellar evolution (Caughlan & Fowler 1988; Angulo et al. 1999; Katsuma 2012; Xu et al. 2013; An et al. 2016). Such estimations are hereafter referred to as ‘reaction rates’.
The 12C(α, γ)16O reaction during the central helium-burning stage is considered to be the most important mechanism for defining the WD core composition (D’Antona & Mazzitelli 1990; Salaris & Cassisi 2005; De Gerónimo et al. 2017; Deboer, Brune & Wiescher 2019). However, the reaction rate for this reaction has an extremely large uncertainty (Fowler, Caughlan & Zimmerman 1967; Caughlan & Fowler 1988; Kunz et al. 2002; An et al. 2016; Deboer et al. 2017; Deboer et al. 2019). The main entrance channel for the 12C + α mechanism (|$E_{\alpha _0} = 7.16\, \text{MeV}$|) does not have a resonance channel close to this threshold, the closest occurring at |$E_x = 9.59\, \text{MeV}$|. Instead, the low-energy cross-section is largely influenced by the 1−1 (|$E_x = 7.12\, \text{MeV}$|) and 2+ (|$E_x = 6.92\, \text{MeV}$|) subthreshold states (see fig. 2 of Deboer et al. 2017, for details). The primary influence of these two nearby subthreshold states and the addition of possible resonant transitions in the wings of the broad channel at |$E_x = 9.59\, \text{MeV}$| makes the nuclear cross-section extremely difficult to estimate (see Fowler et al. 1967; Kunz et al. 2002; An et al. 2016; Deboer et al. 2017; Deboer et al. 2019; Aliotta et al. 2021).
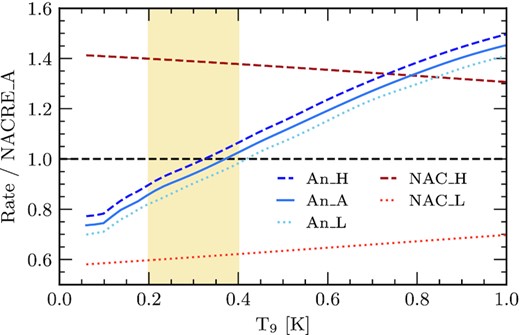
Ratios of each reaction rate considered when compared to the adopted NACRE rate for the 12C(α, γ)16O reaction, as a function of temperature, where T9 = T/109. The beige shaded region defines the temperatures where helium burning occurs. During the core helium-burning stage is also where the 12C(α, γ)16O reaction is most prominent. The light-orange dotted and red dashed lines represent the NACRE_L and NACRE_H considerations, respectively. The solid blue line defines the adopted rate from An et al. (2016) with the An_L and An_H rates being depicted as light-blue dotted and dark-blue dashed lines, respectively.
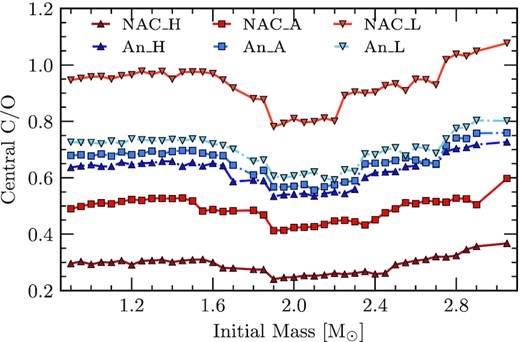
Central C/O ratio at the end of the CHB as a function of initial mass. The red points represent the reaction rates considered by NACRE and the blue points are those considered by An et al. (2016). Additionally, squares represent the respective adopted rates while darker coloured triangles and lighter coloured upside-down triangles represent the high and low-limit uncertainties, respectively.
During the core helium burning (CHB) stage, carbon is produced from the fusion of three helium nuclei via the triple-α process (Salpeter 1952; Kippenhahn & Weigert 1990; Salaris & Cassisi 2005; Prialnik 2009). As the abundance of helium in the core depletes, the probability of carbon interacting with helium to produce oxygen [via 12C(α, γ)16O] is larger than that of the triple-α process at late times during the CHB stage (Salaris & Cassisi 2005). Thus, the 12C(α, γ)16O reaction is of great importance and is vital to model the carbon–to–oxygen (C/O) abundance in the inner chemical profiles for all stellar masses, but particularly low- and intermediate-mass stars (Weaver & Woosley 1993; Woosley & Weaver 1995; Wallerstein et al. 1997)
The C/O abundance, therefore the 12C(α, γ)16O reaction, is important in many areas of stellar evolution. Such as, influencing the pulsation properties of ZZ Ceti stars (De Gerónimo et al. 2015, 2017). Differences between the considered 12C(α, γ)16O reaction rate will also affect the duration of the CHB stage (Deboer et al. 2017). In addition, the 12C(α, γ)16O reaction impacts supernova explosions as the outcome is related to the composition of the final WD (e.g. Iben & Tutukov 1984; Wu et al. 2020) and TDUs during the asymptotic giant branch (AGB) stage (Frost & Lattanzio 1996; Karakas, Lattanzio & Pols 2002; Marigo 2002; Karakas & Lattanzio 2003; Marigo 2007; Cristallo et al. 2009; Ventura & Marigo 2009; Weiss & Ferguson 2009; Kalirai, Marigo & Tremblay 2014; Matteucci 2021). Furthermore, thermonuclear explosions of C/O WDs impacts the ignition of Type 1a supernovae, an important event in constraining cosmological parameters (Riess et al. 1998; Perlmutter, Turner & White 1999). The enrichment of the outer layer of the AGB stars from dredge-up and the mass-loss affects the chemical evolution of galaxies (Boothroyd & Sackmann 1988; Matteucci 2012; Cristallo et al. 2015; Kobayashi, Karakas & Lugaro 2020; Ventura et al. 2020; Matteucci 2021). Additionally, the 12C(α, γ)16O reaction governs whether a star will form a neutron star or black hole (Brown et al. 2001; Heger et al. 2002; Tur, Heger & Austin 2007; West, Heger & Austin 2013; Sukhbold & Adams 2020). Gravitational wave detections from black hole mergers can also be used to constrain the 12C(α, γ)16O reaction rate by determining the mass of the black hole and the fraction of carbon and oxygen that remains (see Farmer et al. 2020, for details).
De Gerónimo et al. (2015, 2017) consider three different reaction rates: an adopted rate from Angulo et al. (1999) and the high and low rates from Kunz et al. (2002). They consider these alternate rates for the CHB until the thermally pulsing AGB (TP–AGB) phase with a sole focus on how the pulsational properties are affected in ZZ Ceti stars, rather than all stages as we attempt in this work.
In this work, we use stellar evolutionary models as tools to study the impact of the 12C(α, γ)16O reaction rate uncertainties on the stellar structure and evolution of low- and intermediate-mass stars. The paper is organized as follows. Section 2 describes the input physics and numerical tool used to compute the evolutionary sequences, as well as a deeper discussion of the considered 12C(α, γ)16O reaction rates used in this work. In Section 3, we present and discuss our results. We summarize our work in Section 4, concluding our findings and indicating future areas where the impact of this work may affect.
2 NUMERICAL TOOLS
2.1 MESA input physics
In this work, we employ the Modules for Experiments in Stellar Astrophysics (MESA) code version-r15140 (see Paxton et al. 2011, 2013, 2015, 2018, for details). We compute the full evolutionary sequence from the zero-age main sequence (ZAMS) through both core hydrogen and helium-burning stages, leading to the AGB and the WD. The computation stops when the stellar model reaches a luminosity of log (L/L⊙) = −3 on the WD cooling track. This stopping condition is applied such that the sequences have experienced their evolution through the DAV instability strip (Fontaine & Brassard 2008; Winget & Kepler 2008; Althaus et al. 2010). This allows for asteroseismology of ZZ Ceti stars to be performed in the future. The final WD masses obtained in this work range from |$0.513 \le M_{\rm f} / \mathrm{M}_\odot \le 0.691\, \mathrm{M}_\odot$|. The initial mass range considered in this work is selected such that all sequences evolve into a carbon–oxygen WD (examples of works which consider/include a similar mass range are Renedo et al. 2010; Romero, Campos & Kepler 2015; De Gerónimo et al. 2017; Marigo et al. 2020).
We compute a total of 246 sequences, with an initial metallicity of Zi = 0.01 and 41 initial masses in the range of 0.90 ≤ Mi/M⊙ ≤ 3.05. For each initial mass, we compute the full evolution considering 6 different formulae for the 12C(α, γ)16O reaction rate. The six reaction rates are adapted from Angulo et al. (1999) and An et al. (2016). Each source comprises three reaction rates: the adopted rate, the low- and high-limiting values, given by the reported uncertainties of the respective rate (see Section 2.2). The rates taken from Angulo et al. (1999) are part of the NACRE compilation and have been used extensively in other computations (Renedo et al. 2010; Romero et al. 2015; De Gerónimo et al. 2017). The reaction rates from An et al. (2016) are less recognized, but boast a lower uncertainty on their reported adopted reaction rate. More detail on these rates and their significance can be found in Section 2.2.
We use the reaction network ‘basic.net’, which comprises 33 individual reactions including the full p–p chain, CNO cycle, 3α up until 24Mg, which contains the 12C(α, γ)16O reaction. This network also includes eight individual isotopes: 1H, 3He, 4He, 12C, 14N, 16O, 20Ne, 24Mg in addition to elementary and α particles.
In our computations, we consider the default radiative opacity tables within mesa. These are from Ferguson et al. (2005) (for 2.7 ≤ logT ≤ 4.5) and from the OPAL project (for 3.75 ≤ logT ≤ 8.7) (Iglesias & Rogers 1993, 1996). Furthermore, we consider OPAL Type 2 tables as they allow for varying amounts of C and O, which are needed for helium burning and beyond (Iglesias & Rogers 1996; Paxton et al. 2011).
The presence of dredge-up episodes during the CHB stage is relevant for the final composition of WDs (Prada Moroni & Straniero 2002; Straniero et al. 2003; Renedo et al. 2010). During the thermally pulsing AGB phase, although overshooting was considered at the boundary of the convective H-rich envelope during the TP-AGB, the TDUs did not occur. Therefore, the evolution of the hydrogen-exhausted core (which is hereafter simply referred to as ‘the helium core mass’) and the final mass of the sequences for those which should experience some TDUs will be affected (see Section 3.2). We define the ‘helium core mass’ as the region from the centre until the local abundance of hydrogen is greater than 10−6. Additional models were computed to assess the impact of the third dredge-up on the core mass growth during the thermal pulses (TPs; Section 3.2 and Appendix B for details).
For regions stable against convection according to the Ledoux criterion, but there is an inversion of mean molecular weight, we employ thermohaline mixing. In mesa, this is treated as a diffusion process, as above, with a diffusion coefficient produced by the stability analysis of Ulrich (1972) and Kippenhahn, Ruschenplatt & Thomas (1980). For the efficiency parameter of thermohaline mixing, we consider αth = 1.0 (see equation 14 of Paxton et al. 2013, for details). Thermohaline mixing was considered in order to smooth a discontinuity in the carbon and oxygen chemical profiles at the edge of the C/O core, during the early-AGB.
Towards the end of the CHB stage, when the central He abundance is lower than ∼10 per cent, breathing pulse-like instabilities may appear. However, these events are attributed to adopted algorithms rather than to the physics of convection (see Straniero et al. 2003; Romero et al. 2015; Constantino et al. 2016; Constantino, Campbell & Lattanzio 2017, for details). To suppress the breathing pulses, when the central abundance of He drops below 0.13, we neglect convection until the central abundance of helium decreases below 10−6, similar to the prescription used by Renedo et al. (2010) and Romero et al. (2015). Without this prescription, the final carbon-to-oxygen (C/O) ratios can vary rapidly (up to ±0.1) with small increments of initial mass (|$0.05\, \mathrm{M}_\odot$|).
During the main sequence (MS), red-giant branch (RGB) and CHB stages, the mass-loss due to stellar winds follows the rate based on the Reimers formula (see Reimers 1975). The AGB and subsequent evolution follow a rate based on the Bloecker formula instead (see Bloecker 1995). We set our scale factors to be ηR = 0.5 and ηB = 0.2 for the Reimers and Bloecker formulae, respectively. These values are chosen as they reproduce a WD with a similar final mass to that found by Renedo et al. (2010) for |$M_i = 1.00\, \mathrm{M}_\odot$| with Zi = 0.01.
A grey atmosphere is employed for the entire evolution of all sequences, which utilizes the grey Eddington τ relation. We consider the equations of state ELM EOS and DT2 EOS, which are derived from the HELM EOS (Timmes & Swesty 2000) and the SCVH tables (Saumon, Chabrier & van Horn 1995), respectively.
Once the star leaves the AGB, we employ an element diffusion process from the work of Burgers (1969). We refer to element diffusion as the physical mechanism for mixing chemicals that includes gravitational settling, thermal diffusion and chemical diffusion. Gravitational settling leads to denser element diffusing towards the core, while lighter elements float towards the surface. Thermal diffusion acts in the same direction as gravitational settling, although to a lesser extent, bringing highly charged and more massive species to the central regions of the star. Chemical diffusion, however, works against this general direction (see Iben & MacDonald 1985; Thoul, Bahcall & Loeb 1994, for details). In addition to the aforementioned processes, mesa includes radiative accelerations (Hu et al. 2011) into their element diffusion prescription. These radiative forces are negligible in hot regions, as well as being computationally demanding. Hence, we do not consider the effects of radiative levitation. Our element diffusion process is applied to the following isotopes: 1H, 3He, 4He, 12C, 14N, 16O, 20Ne, 24Mg.
2.2 The 12C(α, γ)16O reaction
Here, we discuss a brief, yet relevant, history of 12C(α, γ)16O reaction rate evaluations. We lead this into further detail for the 12C(α, γ)16O reaction rate prescriptions from Angulo et al. (1999) and An et al. (2016), discussing their differences to the previous determinations from the literature.
Fowler et al. (1967) organized the first symposium of reaction rate cross-sections that included the 12C(α, γ)16O reaction. At the time, many resonant factors were neglected and were updated by Caughlan & Fowler (1988). However, it is believed that some resonances were still neglected and the treatment of the S-factor in this work produced values that are too small and require a scale factor of ∼2 to produce a realistic S-Factor (Angulo et al. 1999; Kunz et al. 2002; Heil et al. 2008; An et al. 2016; Deboer et al. 2017, 2019).
Built upon the works of Fowler et al. (1967), Caughlan & Fowler (1988), and those associated works in between, Angulo et al. (1999) provided a strong basis for the 12C(α, γ)16O reaction within the NACRE compilation. Angulo et al. (1999) provided the reaction rates for 86 different reactions, including 12C(α, γ)16O. For the S-factor calculations, Angulo et al. (1999) considered the values for non-resonant energies. For narrow resonances, however, they fit the resulting cross-section using a Briet-Wigner model. When the effects of different resonant energies overlap, they use a multi-resonance fit, shown in equation 29 of Angulo et al. (1999). Angulo et al. (1999) state that their analysis is numerical for the majority, although they do provide an analytical approach for each reaction, for completeness. They find that their numerical approach yields a higher accuracy for their calculated reaction rates. The quoted S-Factor value from Angulo et al. (1999) for a stellar energy of 300 keV is |$S(\rm{300\,\,\rm{keV}}) = 199 \pm 64 \, \rm{keV\,\,b}$|, resulting in a reaction rate (RR) of |$RR(\rm{300\,\,\rm{keV}}) = (9.11^{+3.69}_{-3.67}) \cdot 10^{-15}\, \rm{cm^{3} mole^{-1} s^{-1}}$|. A stellar energy of |$E = \rm{300\,\,\rm{keV}}$| is often chosen as the energy at which to compare the S-factors across different works, as it is associated with the ignition of CHB. In this work, we consider the adopted rate of Angulo et al. (1999) (NACRE_A) and the highest and lowest reaction rate within the uncertainties (NACRE_H and NACRE_L, respectively). Hereafter, we refer to the collective 12C(α, γ)16O reaction rates from Angulo et al. (1999) as ‘NACRE’.
An et al. (2016) point out that the resonance parameters used by Kunz et al. (2002), which were taken from Tilley, Weller & Cheves (1993), neglect the ground-state transitions from the works of Brochard et al. (1975) and Ophel et al. (1976). This results in a larger value for the expected reaction rate at helium-burning temperatures. Instead, An et al. (2016) use the reduced R-matrix and S-factor derived by An et al. (2015) to estimate the reaction rate, which accounted for all transitions.
In their computations, An et al. (2015, 2016) found a significant reduction to the uncertainty of their S-factors when compared to that of Angulo et al. (1999), |$S(\text{300 keV}) = 162.7 \pm 7.3 \, \text{keV b}$|. The reaction rate for the same energy resulted |$RR(\text{300 keV}) = (7.83 \pm 0.35) \times 10^{-15}\, \rm{cm^{3} mole^{-1} s^{-1}}$|. We consider the adopted rate from An et al. (2016) (An_A) and the highest and lowest reaction rate within the uncertainties (An_H and An_L, respectively). However, the S-factor calculation of An et al. (2015), seems to neglect external contributions for ground state energy levels, making this approximation not valid for high-precision analysis (Deboer et al. 2017). Therefore, we treat the uncertainties of the 12C(α, γ)16O reaction rate from An et al. (2016) as arbitrary differences to determine the effect of the urgent need for more precise 12C(α, γ)16O reaction rate uncertainties, as claimed by Kunz et al. (2002) and Tur, Heger & Austin (2010). Some works further claim that the uncertainty must be less than 10 per cent to be on par with non-nuclear physical uncertainties (see Woosley et al. 2003; Deboer et al. 2017, for details).
Fig. 1 shows a comparison between the adopted reaction rates from An et al. (2016), NACRE and all of their associated uncertainties. In this figure, we depict for each rate, the ratio between the rate and the value for NACRE_A, as a function of temperature. For an analysis including other works, see fig. 4 of An et al. (2016). As can be seen from Fig. 1, for energies characteristic of stellar energies, the An_A, An_H and An_L reaction rates are lower than for NACRE_A for most temperatures within the beige shaded region, characteristic of temperatures where helium burning may begin. We therefore expect to have a larger C/O ratio in the core after the central helium-burning stage for the sequences which consider the rate from An et al. (2016) when compared to those sequences which consider NACRE_A. It can also be seen in Fig. 1 that the range between NACRE_H and NACRE_L includes all the other prescriptions within the region of helium-burning temperatures, which will lead to the largest differences in the C/O ratio after the CHB stage. At higher temperatures (greater than those considered to be helium-burning temperatures), the reaction rate from An et al. (2016) is larger than that from NACRE. These temperatures are not reached in the sequences computed within this work.
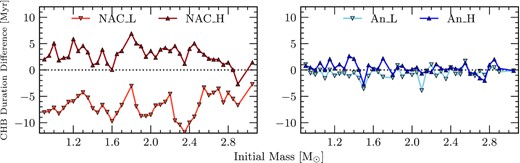
Differences to the duration of the CHB stage due to associated reaction rate uncertainties as a function of initial mass. The differences are calculated between each limit of the reaction rate due to their uncertainties and the adopted rate of each case. The left-hand panel shows the differences of the uncertainties of the rate calculated by NACRE and the right-hand panel shows the same from the rate of An et al. (2016). Darker coloured triangles and lighter coloured upside-down triangles represent the high- and low-limit uncertainties, respectively.
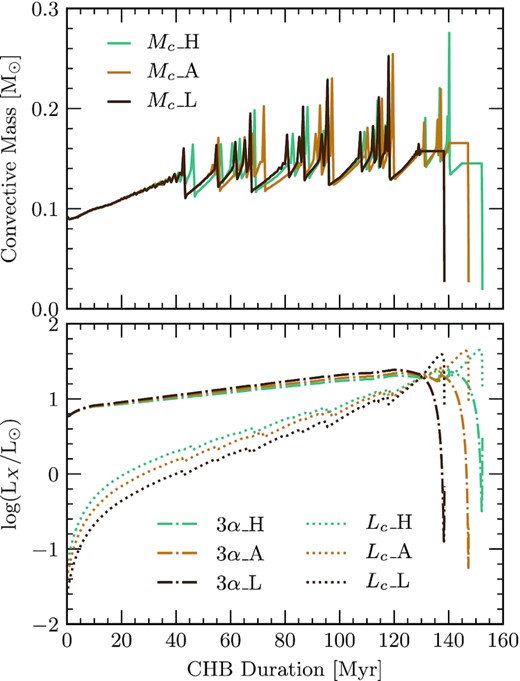
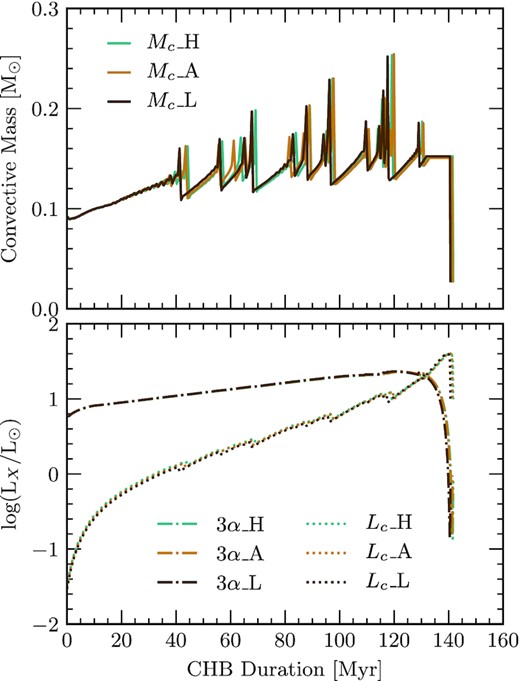
History of the convective mass (top panel), 3α luminosity and the luminosity of the 12C(α, γ)16O reaction during the CHB (bottom panel). The history is given in terms of the CHB duration. This plot in particular considers all NACRE prescriptions for the 12C(α, γ)16O reaction rate for an initial mass of |$M_i = 2.45\, \mathrm{M}_\odot$|. Blue lines represent NACRE_H, orange-brown depicts NACRE_A and dark-brown shows NACRE_L. Furthermore, the solid line represents the convective mass, dotted lines show the luminosity of the 12C(α, γ)16O reaction and dot-dash lines portray the 3α luminosity.
3 RESULTS AND DISCUSSIONS
In this section, we describe in detail the effects that the uncertainties of the 12C(α, γ)16O reaction rate have on the inner structure and evolution for low- and intermediate-mass single stars. As expected, during the pre-MS, MS, and red-giant branch (RGB), we find no differences to the evolution since the 12C(α, γ)16O reaction only becomes important, and increasingly more dominant, during the CHB as the central helium abundance decreases (Salaris & Cassisi 2005; Spruit 2015; Deboer et al. 2019). Thus, we report no difference between the different 12C(α, γ)16O reaction rates at the time of, or shortly after, the helium-flash or a non-degenerate helium ignition. We only show the results from the CHB, AGB, and WD stages where we expect some differences to occur due to the uncertainties and separate literature sources of the 12C(α, γ)16O reaction rate. We consider each evolutionary stage separately in chronological order.
3.1 The CHB phase
Fig. 2 shows the carbon-to-oxygen (C/O) ratio for each star at the end of CHB, as a function of initial mass. As expected due to the large uncertainties of the reaction rate from NACRE, the smallest and largest C/O ratios come from the NACRE_H and NACRE_L rates, respectively. Note that when all reaction rates from An et al. (2016) are considered, the values for the C/O ratios are between the values corresponding to NACRE_A and NACRE_L.
We find that the C/O ratio at the end of the CHB decreases for all considered reaction rates around an initial mass of |$M_i = 1.90\, \mathrm{M}_\odot$|. This mass corresponds to the minimum mass for which helium-burning starts in non-degenerate conditions, and will be referred to as the transition mass. The C/O ratio increases again for higher initial masses (between 2.20 ≤ Mi/M⊙ ≤ 2.45). We find that the initial mass where the increase of the C/O ratio occurs is dependent on the considered 12C(α, γ)16O reaction rate, such that higher reaction rates have a wider initial mass range for the decreased C/O ratio and lower reaction rates have a narrower initial mass range. For example, the NACRE_H has the widest range (1.90 ≤ Mi/M⊙ ≤ 2.45) whereas the NACRE_L has the narrowest range (1.90 ≤ Mi/M⊙ ≤ 2.20). Furthermore, we find no difference to the initial mass range between the adopted rate from An et al. (2016) and the An_H and An_L rates. We also add that the decrease in the C/O ratio is more pronounced for less efficient reaction rates, see Fig. 2, for details.
Fig. 3 shows the time spent in the CHB as a function of initial mass for the high and low reaction rate formulas for NACRE (left-hand panel) and An et al. (2016) (right-hand panel). We consider the difference in the CHB age from the values obtained using the respective adopted reaction rate for each panel. Considering the NACRE rates (left-hand panel of Fig. 3), we find that the CHB lifetime can be up to 12 Myr shorter (longer) from the adopted rate if we consider NACRE_L (NACRE_H) reaction rate, which is roughly a 7 per cent difference. On the other hand, the differences between the An et al. (2016) rates are much lower (right-hand panel of Fig. 3), up to 4 Myr translating to a difference of 4 per cent. Such changes to the CHB lifetimes due to limits of the uncertainties on the 12C(α, γ)16O reaction rate are not negligible, particularly for the rate taken from NACRE. Constantino et al. (2016) found that the difference in the the ratio of HB-to-AGB stars in a sample of 48 globular clusters could be explained by the differences in the CHB duration due to the uncertainties in the 12C(α, γ)16O reaction rate.
The top panel of Fig. 4 shows the CHB history of the convective mass. The convective mass is defined as the mass-coordinate of the core convective boundary, such that convection occurs between this mass-coordinate and the centre. Additionally, the bottom panel of Fig. 4 shows the luminosities of the 3α process and the 12C(α, γ)16O reaction (the latter will be referred to as Cα luminosity), for the NACRE reaction rates. As expected, the Cα luminosity increases when the more efficient reaction rates are considered. Furthermore, the contribution from the 3α process decreases for higher reaction rates due to the helium reservoir being depleted faster by the more efficient 12C(α, γ)16O reaction.
Mixing episodes due to the convective core during the CHB extends from the C/O core to the He-rich layers above, so we define the convective mass as the mass of the convective core. Fig. 4 also shows that higher reaction rates produce more mixing episodes which are characterised by sudden increases of the convective mass. These enhanced convective episodes bring fresh helium from the helium region above the C/O core which not only increases the duration of the CHB but also increases the abundance of oxygen in the core (Ghasemi et al. 2017; Guo & Li 2018).
Convective mixing episodes induce a chemical discontinuity between the fully mixed core and the radiative layer, increasing the opacity beyond the convective boundary. In a class of CHB pulsating stars, sdB stars (see Heber 2009, for an in depth discussion), g-modes propagate from the surface all the way until the boundary of the convective core (Ghasemi et al. 2017). Since we find significant differences to the size of the convective core and number of mixing episodes between the NACRE adopted reaction rate and its uncertainties for the 12C(α, γ)16O reaction rate, the precision of astereoseismology for these objects is limited and must be considered in the calculations of the pulsation period spectrum. However, for the adopted rate taken from An et al. (2016), the high and low limits (An_H and An_L, respectively) do not produce a significant change to the convective core mass and the total number of mixing episodes and would therefore produce a more precise study of the g-mode pulsations (see Fig. A1 in Appendix A, for an example of the same case that considers the reaction rates from An et al. 2016). The implications for asteroseismology from the treatment to mixing during the CHB has been studied by Constantino et al. (2015), who found that changes to the composition and He-burning reaction rates do not significantly change the period spacing of pulsations for pulsators during the CHB stage. However, the period values could be more sensitive to the changes in the chemical profile.
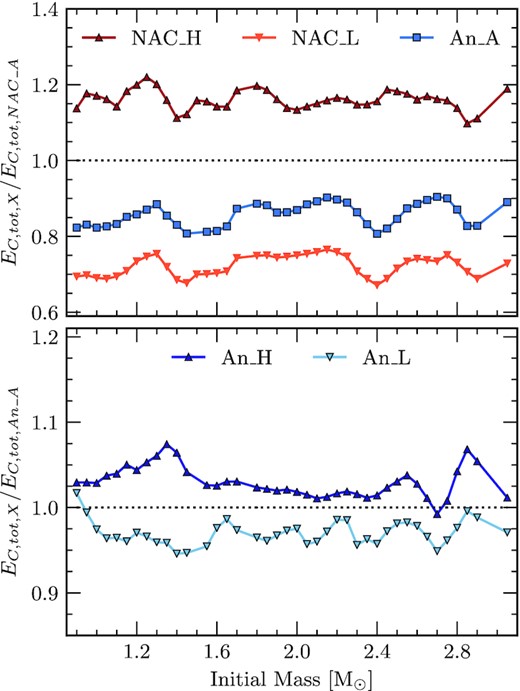
Ratios of the total energy produced by the 12C(α, γ)16O reaction as a function of initial mass. Values are presented in the form of moving averages. The energy produced is calculated by integrating the Cα luminosity shown in Fig. 4 and is integrated with respect to time. The ratios in the top panel are in terms of the NACRE_A rate and the ratios in the bottom panel are made in terms of An_A. The red points represent the reaction rates considered by NACRE and the blue points are those considered by An et al. (2016). Additionally, squares represent the respective adopted rates while darker coloured triangles and lighter coloured upside-down triangles represent the high and low limit uncertainties, respectively.
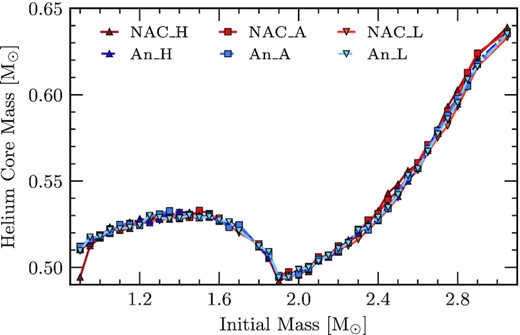
Helium core mass at the start of the first TP as a function of initial mass. All of the considered reaction rates and their uncertainties are shown within this figure. We find a minimum to the helium core mass for the same initial mass which corresponds to the transition mass where CHB begins on a non-degenerate core rather an electron degenerate core (|$M_i = 1.90\, \mathrm{M}_\odot$|). Within the uncertainties, we find differences up to 0.01 M⊙ for masses larger than |$M_i = 1.90\, \mathrm{M}_\odot$|. The red points represent the reaction rates considered by NACRE and the blue points are those from An et al. (2016). Additionally, squares represent the respective adopted rates while darker coloured triangles and lighter coloured upside-down triangles represent the high- and low-limit uncertainties, respectively.
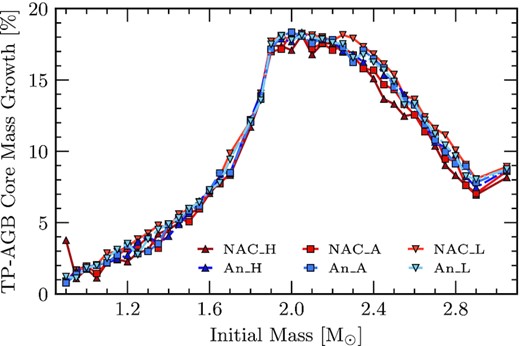
Percentage growth of the helium core mass during the AGB as a function of initial mass. Growth is calculated as the difference between the final mass of the core and the helium core mass described in Fig. 6. We find that the largest growth occurs for initial masses |$\approx 2.00\, \mathrm{M}_\odot$|, peaking at 19 per cent. Above initial masses of |$M_i = 2.90\, \mathrm{M}_\odot$|, it appears that the growth begins to plateau around 8–9 per cent. The red points represent the reaction rates considered by NACRE and the blue points are those from An et al. (2016). Additionally, squares represent the respective adopted rates while darker coloured triangles and lighter coloured upside-down triangles represent the high- and low-limit uncertainties, respectively.
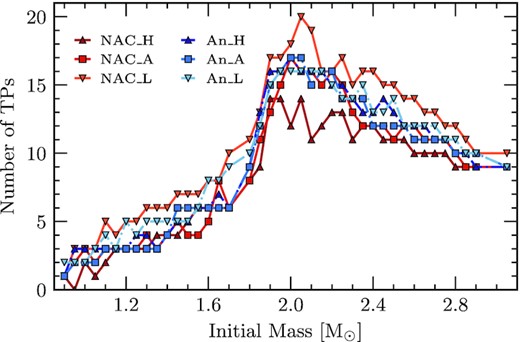
Number of TPs experienced as a function of initial mass. Each reaction rate consideration and their uncertainties are shown. We find that the number of TPs peaks at initial masses |$\approx 2.00\, \mathrm{M}_\odot$|, in-line with the largest core growth, as in Fig. 7. We also show that lower reaction rates for the 12C(α, γ)16O reaction produce more TPs. The red points represent the reaction rates considered by NACRE and the blue points are those from An et al. (2016). Additionally, squares represent the respective adopted rates while darker coloured triangles and lighter coloured upside-down triangles represent the high- and low- limit uncertainties, respectively.
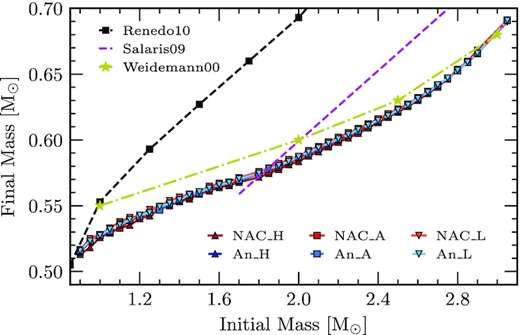
Initial-to-final mass relation of all sequences calculated as part of this work. Also shown are other IFMRs from the works of Weidemann (2000), Salaris et al. (2009), and Renedo et al. (2010) (yellow stars, purple dashed line and black squares, respectively) for a comparison of their trends. The red points represent the reaction rates considered by NACRE, and the blue points are those from An et al. (2016). Additionally, squares represent the respective adopted rates while darker coloured triangles and lighter coloured upside-down triangles represent the high- and low-limit uncertainties, respectively. We find that the slope of the IFMR has a strong dependency on the considered mass-loss scheme considered during the AGB, with the scheme from Vassiliadis & Wood (1993) producing a steeper gradient and that from Bloecker (1995) showing a shallower gradient.
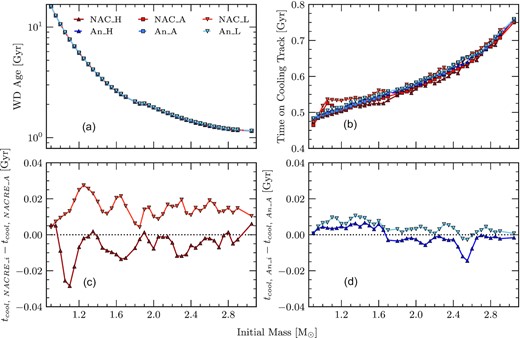
Panel (a) shows the final age (log scale) of the star on the final cooling track with an effective temperature |$T_{\text{eff}} = 10\, 000$| K. Panel (b) shows the time spent of the cooling track, defined as the time taken for a WD on the final cooling track to cool from its maximum effective temperature to an effective temperature of |$T_{\text{eff}} = 10\, 000$| K. Panel (c) and (d) show the moving average for the difference of cooling times between the High/Low limits and the Adopted rate for the NACRE and An et al. (2016) 12C(α, γ)16O reaction rate, respectively. All panels are represented as functions of initial mass. The NACRE reaction rates are shown as different shades of red and those from An et al. (2016) are depicted by shades of blue. Furthermore, squares represent the respective adopted rates while darker coloured triangles and lighter coloured upside-down triangles represent the high- and low-limit uncertainties, respectively. In general, we find that the uncertainties of the 12C(α, γ)16O reaction rate have an negligible effect on the final ages of the stars at this point, whereas the cooling time can differ up to 8 per cent.
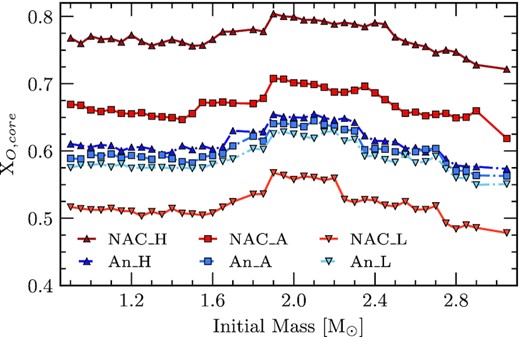
Central oxygen mass fraction for the final WD as a function of initial mass. We show each calculated sequence. The trends for each considered reaction rate are similar to those found in Fig. 2. There has been a slight increase in the central oxygen abundance since the CHB due to diffusion processes in the star. Additionally, squares represent the respective adopted rates while darker coloured triangles and lighter coloured upside-down triangles represent the high- and low-limit uncertainties, respectively.
In both panels, we show the abundance profiles of sequences considering an initial mass of |$M_i = 1.30\, \mathrm{M}_\odot$|. The top panel represents the adopted rate and it’s uncertainties for the NACRE rate, and the same for the An et al. (2016) rates in the bottom panel. The line-styles for each rate are shown in the legend in the bottom panel and the colours for each element is shown in the legend in the top panel. Colour version is available online.
The total energy produced by the 12C(α, γ)16O reaction during the CHB is presented in Fig. 5. The values shown in Fig. 5 are moving averages. We compute the total energy by integrating the Cα luminosity with respect to time for the CHB duration. Fig. 5 shows the ratio between the different reaction rates and the NACRE_A (top panel) and An_A (bottom panel) reaction rates, as a function of initial mass. If we consider the reaction rates from An et al. (2016), the differences are generally smaller than 10 per cent, the largest difference occurs for the sequence with an initial mass of |$2.85\, \mathrm{M}_\odot$| that considers An_H. In most cases, the differences are no larger than 5 per cent (70.7 per cent of the sequences for An_H and 82.9 per cent of the sequences for An_L).
We find larger differences between the limits of 12C(α, γ)16O NACRE rates when compared to the NACRE_A formula, as shown in the top panel of Fig. 5. In this case, we also compare the adopted reaction rate from An et al. (2016). If we consider how NACRE_H differs from NACRE_A, we find that the energy production for the majority of the sequences are greater than 10 per cent than that of the NACRE_A case, with a few exceeding a difference of 20 per cent. For NACRE_L, the carbon energy produced differs more than 30 per cent from the NACRE_A rate. The extra energy produced from the high rates when compared to the adopted rates increases the temperature gradient further allowing convection to continue, causing the extra mixing episodes shown in Fig. 4 (Kippenhahn & Weigert 1990; Prialnik 2009).
Considering the adopted rate from An et al. (2016), the absolute value of the differences in carbon energy produced due to An_H and An_L appears to be independent of either selection. This is not the case for the NACRE rates. A limiting factor for the amount of energy produced is the abundance of available helium. This is more of a limit for the NACRE_H case due to lack of available helium inhibiting further reactions to occur. The NACRE_L will always produce less carbon energy and so is not limited by the helium abundance or lack thereof. The smaller uncertainties of the rates taken from An et al. (2016) are not large enough to produce such an effect.
The CHB stage is where the 12C(α, γ)16O reaction is the most active. In particular, we find that the largest differences due to the considered 12C(α, γ)16O reaction rate appear in the final C/O ratio, CHB duration, energy generation rate and the number of experienced mixing episodes. The primary reason that we find such changes to these properties is due to the changes in energy generation that affects the convection efficiency in this phase. Furthermore, we find that the differences between the An_H and An_L rates from the An_A rate are generally insignificant, unlike those of the NACRE uncertainties which are intrinsically larger. A final point to add is that, in future works, the use of overshooting parameters specifically designed for the CHB would be interesting. Works such as Spruit (2015) claim to keep the convective boundaries stable inhibiting the need for manual breathing pulse suppression, as performed in this work, whilst keeping ‘stable’ convection active throughout the evolution (Spruit 2015; Constantino et al. 2017).
3.2 The AGB phase
During the AGB the energy production is given by two shell sources, the hydrogen-shell at the base of the hydrogen-rich envelope and the He-shell on top of the C/O core. Hydrogen burning occurs through the CNO cycle, while He-burning is through the 3α process. Towards the end of the AGB, the He-burning shell will become thin enough to trigger unstable burning, and the TPs begin (e.g. Kippenhahn & Weigert 1990; Iben 1991). During the interpulse period between the TPs, the outer convection zone may be deep enough to bring the products of He-shell burning to the surface, this is known as the third dredge-up (TDU) (Wallerstein et al. 1997; Busso, Gallino & Wasserburg 1999; Herwig 2005; Karakas & Lattanzio 2014).
Well-known consequences of TDUs are a reduction of the helium core mass and changes to the surface composition, leading to the formation of C-stars (Frost & Lattanzio 1996; Busso et al. 1999; Karakas et al. 2002; Weiss & Ferguson 2009; Romero et al. 2015; Marigo et al. 2020). The extent of the reduction of the helium core mass from TDU episodes is parameterised by the dredge-up efficiency parameter, λd1 (see Karakas et al. 2002; Marigo et al. 2013, for details). The 12C(α, γ)16O reaction during this stage is essentially inactive. There may be some fusion reactions between 12C and alpha particles at the edge of the C/O core but they are, however, insignificant. Thus, any difference between the sequences during the AGB is due to the effect that the 12C(α, γ)16O reaction rate has during the CHB.
Fig. 6 shows the helium core mass at the first TP of each sequence as a function of initial mass. A minimum value occurs for an initial mass |$M_i = 1.90\, \mathrm{M}_\odot$|, which is the transition point as described in Section 3.1. The same result was found in the work of Kalirai et al. (2014), whose initial models come from those produced in Bressan et al. (2012). However, their transition point occurs for |$M_i = 2.00\, \mathrm{M}_\odot$| due the larger initial metallicity affecting the mass for which CHB ignites in degenerate conditions (Bertelli et al. 1986; Romero et al. 2015). We find that there is no significant difference to the helium core mass at the first TP as a result of different 12C(α, γ)16O reaction rates for masses lower than the transition point. Above this mass, the maximum difference between the NACRE rates is |$\sim 0.01\, \mathrm{M}_\odot$|, with NACRE_L producing lower helium core masses and NACRE_H producing larger helium core masses. This is due to the difference in energy outputs between the adopted rate, NACRE_A, and the NACRE_H/NACRE_L rates. Higher reaction rates during the CHB increase the temperature throughout the star which favours the CNO-cycle (Boeltzig et al. 2016), allowing the helium core mass to develop further than sequences which consider lower reaction rates. There are no significant differences in the helium core mass at the first TP between the adopted rate from An et al. (2016) and An_H/An_L for any of the considered initial masses.
Fig. 7 shows the growth of the helium core mass during the TP-AGB as a function of initial mass for each considered reaction rate. We find that the dramatic increase of core growth (for helium core mass growth |$\ge 10{{\ \rm per\ cent}}$| Kalirai et al. 2014) occurs in the range 1.70 ≤ Mi/M⊙ ≤ 2.60, with a maximum increase of 19 per cent occurring at |$M_i \approx 2.00\, \mathrm{M}_\odot$|. This result is in agreement with that of Bird & Pinsonneault (2011) and is similar to that of Kalirai et al. (2014), who find a helium core growth up to 30 per cent. This discrepancy between their work and ours is due to not only a different initial metallicity, but also their consideration of a less efficient mass-loss scheme for stages previous to the AGB (Reimers law with ηR = 0.2 Bressan et al. 2012). Thus, the models used by Kalirai et al. (2014) have a larger mass of hydrogen fuel to produce a larger final mass (see Table 1 for our values of this variable and Bird & Pinsonneault (2011) for an in-depth discussion of the hydrogen fuel variable). Furthermore, possible differences to the energy produced in the H-rich envelope during the TP–AGB may affect the rate of the helium core growth (see Forestini & Charbonnel 1997; Marigo et al. 2013; Kalirai et al. 2014, for details).
Values showing the TP-AGB helium core mass growth and fuel mass. We report the values from the following reaction rate considerations: NACRE_H, NACRE_A, NACRE_L, and An_A. We do not report the values from the uncertainties of the rate taken from An et al. (2016) since they are negligible when compared to their adopted rate.
| Mi/M⊙ | ΔMgrowth/M⊙ | Mfuel/M⊙ | ||||||
|---|---|---|---|---|---|---|---|---|
| NACRE_H | NACRE_A | NACRE_L | An_A | NACRE_H | NACRE_A | NACRE_L | An_A | |
| 1.00 | 0.009 | 0.010 | 0.009 | 0.009 | 0.007 | 0.008 | 0.007 | 0.008 |
| 1.50 | 0.030 | 0.027 | 0.031 | 0.031 | 0.024 | 0.022 | 0.026 | 0.025 |
| 1.60 | 0.037 | 0.038 | 0.039 | 0.038 | 0.030 | 0.031 | 0.031 | 0.031 |
| 2.00 | 0.085 | 0.091 | 0.089 | 0.091 | 0.069 | 0.073 | 0.072 | 0.073 |
| 2.90 | 0.043 | 0.044 | 0.050 | 0.048 | 0.035 | 0.035 | 0.040 | 0.039 |
Considering only the difference in helium core mass growth for NACRE_A rate and it’s NACRE_H/NACRE_L limits, we find that NACRE_L has a larger core growth and NACRE_H has smaller core growth. The increased core growth during the AGB for the NACRE_L sequences are due to the smaller helium core mass at the first TP (see Fig. 6) and as such more fuel to keep He-shell burning sustained, particularly for initial masses above the transition point where the core growth differences are greater (see Table 1). Additionally, during the TP-AGB, we find differences in the energy generation from the CNO cycle between the NACRE_H/NACRE_L limits in comparison with the NACRE_A. The energy generation can be up to 25 per cent lower (higher) when the NACRE_H (NACRE_L) reaction rate is considered.
Fig. 8 shows the number of TPs as a function of initial mass for each considered reaction rate. Moreover, it shows that lower reaction rates experience more TPs than higher reaction rates. This is related to the larger amount of available hydrogen to aid the outward growth of the helium core through a greater number of unstable He-shell burning episodes – TPs. We do not find any M- to C-star transitions (see Marigo et al. 2020, for example) as convective overshooting about the boundary between the helium core and the He-exhausted core was disregarded during the TP-AGB, inhibiting the TDU (Herwig 2000; Romero et al. 2015). However, overshooting still occurred at the boundary of the H-rich core. We define the ‘He-exhausted core’ as the region from the centre until the local abundance of helium is greater than 10−6.
TPs are strongly dependent on the mass-loss rate, helium core mass and initial metallicity (Karakas et al. 2002; Cristallo et al. 2009; Weiss & Ferguson 2009; Renedo et al. 2010; Romero et al. 2015; De Gerónimo et al. 2017). We find that the number of TPs in our computations is lower than that from the works of Weiss & Ferguson (2009), Renedo et al. (2010) and Romero et al. (2015) for a given initial mass, a similar treatment of convection and a similar helium core mass at the beginning of the TP-AGB phase. Difference in the number of TPs could be related to the different mass-loss schemes during the RGB stage. In this work, we consider the mass-loss prescription from Bloecker (1995) while the works of Weiss & Ferguson (2009), Renedo et al. (2010) and Romero et al. (2015) consider a mass-loss scheme that produces a ‘super wind’ stage towards the last TPs, making it more efficient in these last TPs but less so in the early TP-AGB (see Vassiliadis & Wood 1993; van Loon et al. 2005, for details). However, the trend in the number of experienced TPs as a function of initial mass obtained in our work agrees with other works (see Weiss & Ferguson 2009; Renedo et al. 2010; Romero et al. 2015).
To assess the effect of the TDU during the TP-AGB, we computed additional sequences, allowing convective overshooting to occur at all fully- or semi-convective boundaries, with f = 0.016 (see Appendix B, for details on it’s effect). For sequences that consider the NACRE_A prescription, TDU episodes occur for initial masses larger than Mi ≥ 2.40 M⊙, with the dredge-up efficiency parameter (λd) showing values of λd = 0.033 − 0.124 that increases with increasing initial mass. The abundance of carbon and oxygen at the surface does increase during each TDU in these additional models, but the C/O is still lower than 1 meaning that our models show an oxygen dominated surface. A higher value of the overshooting parameter may be necessary to produce C-stars (see Herwig et al. 1997; Karakas et al. 2002; Weiss & Ferguson 2009; Romero et al. 2015; Marigo et al. 2020, for examples of C-star transitions). For sequences where convective overshooting was considered across all boundaries during the AGB, we find a decrease in the final helium core mass up to 0.63 per cent. This value is much lower than the 15 per cent decrease found by Karakas et al. (2002) and Romero et al. (2015).
The sequences that have initial masses Mi < 2.40 M⊙ do not show any third dredge-up episodes, as such we do not expect any difference to the growth of the helium core or the final mass. For those sequences with initial masses Mi ≥ 2.40 M⊙, a more detailed study of the convective boundaries during the TP-AGB is required for more thorough analysis of why we find such weak dredge-up efficiency parameters.
In the case of NACRE_H and NACRE_L, we find that TDU episodes occur for the same initial mass range as that of the NACRE_A sequences (2.40 ≤ Mi/M⊙ ≤ 3.05). Additionally, the dredge-up efficiency parameters are also similar to those of the NACRE_A sequences, with λd = 0.040−0.123. From the results gathered in this work, we find that the uncertainties of current 12C(α, γ)16O reaction rates are not significant in modelling the TDU.
The 12C(α, γ)16O reaction during the AGB is negligible during the TP-AGB. Instead, the main energy source occurs through the 3α reaction series and the CNO-cycle within the H-rich envelope (Herwig 2005; Karakas & Lattanzio 2014). Thus, we do not find any significant change to the peak TP luminosity nor the depth of each TDU, since the changes in core mass at the beginning of the TP-AGB are negligible as a result of the uncertainties of the 12C(α, γ)16O reaction rate, as shown in Fig. 6 (see Wallerstein et al. 1997; Wagenhuber & Groenewegen 1998; Busso et al. 1999; Herwig 2005; Karakas & Lattanzio 2014, for details). However, the uncertainties of the overshooting efficiency raises a greater uncertainty in the surface composition during the AGB, as such we leave a detailed discussion for a future work that considers the overshooting efficiency in more detail (Abia et al. 2002; Herwig 2005; Cristallo et al. 2009; Ventura & Marigo 2009; Karakas & Lattanzio 2014).
3.3 The WD final cooling track
Fig. 9 shows the initial-to-final mass relation (IFMR) for all sequences produced in this work. We find that there is no significant difference in the final mass of any given initial mass due to the 12C(α, γ)16O reaction rate. Considering the largest difference in the reaction rates, between NACRE_H and NACRE_L, the largest difference in the final mass for a given initial mass is less than |$0.01\, \mathrm{M}_\odot$| (|$\lt 2{{\ \rm per\ cent}}$|).
In the interest of the pursuit for a global IFMR, we compare our IFMR to those of other works of a similar metallicity. We consider the IFMRs from the works of Weidemann (2000), Salaris et al. (2009) and Renedo et al. (2010). We find a similar trend with the work of Weidemann (2000), both of which consider the same mass-loss scheme from Bloecker (1995) for the AGB phase. The IFMRs from the works of Salaris et al. (2009) and Renedo et al. (2010) consider the mass-loss scheme from Vassiliadis & Wood (1993) for the AGB and show a much steeper gradient in their IFMRs. However, the core masses between this work and the works of Weidemann (2000), Salaris et al. (2009), and Renedo et al. (2010) are similar at the first TP. Thus, it is reasonable to assume that the difference is due to their considered mass-loss scheme for the IFMR determination.
In Fig. 10, we show, in Panel (a), the final ages of a WD that has cooled to an effective temperature of |$T_{\textrm {eff}} = 10\, 000$| K (log scale) as a function of initial mass for all the sequences computed in this work. The differences in the final ages due to the high/low limits of each considered 12C(α, γ)16O reaction rate are in general negligible, with variations of the order ∼0.01 Gyr for both the NACRE and An et al. (2016) 12C(α, γ)16O reaction rate. The variations in the reported final ages due to the uncertainties of the 12C(α, γ)16O reaction rate are a magnitude lower than the populations studied in the works of Hansen et al. (2013), Forbes et al. (2015), and Campos et al. (2016). As such, the impact that the 12C(α, γ)16O reaction rate has on final ages of WD models is currently negligible as compared to the greater uncertainty of ageing stellar populations.
Panels (c) and (d) of Fig. 10 show the moving average for the time spent on the cooling track for the NACRE and An et al. (2016) 12C(α, γ)16O reaction rates, respectively. We define this quantity as the time taken for a star on the final cooling track to cool from it’s maximum effective temperature until an effective temperature of |$T_{\text{eff}} = 10\, 000$| K. During the final cooling track, the differences in the duration due to the reaction rates between the adopted and high/low limits generally differ up to 0.030 Gyr for those of NACRE and up to 0.015 Gyr for An et al. (2016). The general trend is in agreement with past discussions of the effect of the 12C(α, γ)16O reaction rate and cooling time during this stage of evolution, such that more oxygen-rich cores will produce a lower cooling time. This is due to the gravitational energy release during stratification occurring at earlier times for more oxygen-rich cores. As a consequence, the WD is left with a lower thermal content to feed the surface luminosity at later times. The larger the luminosity at which the stratification occurs, the shorter the resulting cooling times will be (D’Antona & Mazzitelli 1990; Prada Moroni & Straniero 2002; Salaris et al. 2010). Furthermore, for the high/low limits of the NACRE rate, we find that NACRE_L produces a greater absolute difference than that of NACRE_H. This is due to the availability of helium during the CHB as discussed in Section 3.1.
After the settling and diffusion processes described in Section 2, the final oxygen abundances within the core of the sequences are presented in Fig. 11, as a function of initial mass. We find similar trends to the oxygen mass fraction in this stage to those found at the end of the CHB. Although there are slight increases to the oxygen mass fraction due to the aforementioned diffusion processes (Unglaub & Bues 2000). Additionally, diffusion affects the C/O ratio throughout the star up to the surface and not just in the core (see Herwig 2000; Straniero et al. 2003, for details).
The onset of crystallization begins when the core cools to a certain temperature, Tc (Segretain et al. 1994; Horowitz, Schneider & Berry 2010). This temperature is dependent on the internal composition of the star. Through observations of the globular cluster NGC 6397, Winget et al. (2009) report that the crystallization of the WD core is similar to that of a pure carbon core. According to the phase diagram produced in Horowitz et al. (2010) and their limits for the maximum crystallization temperature, this would require a limit to the oxygen mass fraction of XO ≤ 0.64. This requires that the maximum S-factor at 300 keV has an upper limit of |$S(300\, \text{keV}) \le 170\, \text{keV b}$|. Considering the relationship between oxygen mass fraction and initial mass presented in Fig. 11, we find that NACRE_H and NACRE_A produce central oxygen abundances that are too large for a crystallization process similar to that found by Horowitz et al. (2010). Meanwhile, the rates An et al. (2016) agree not only with the oxygen mass fraction limit presented by Horowitz et al. (2010), but also their derived S-factor for an energy of 300 keV. Thus, we find that sequences dedicated to studying crystallization using the method presented by Horowitz et al. (2010) should consider a lower reaction rate than that from NACRE for the 12C(α, γ)16O reaction to keep their analysis consistent with the input physics that they use.
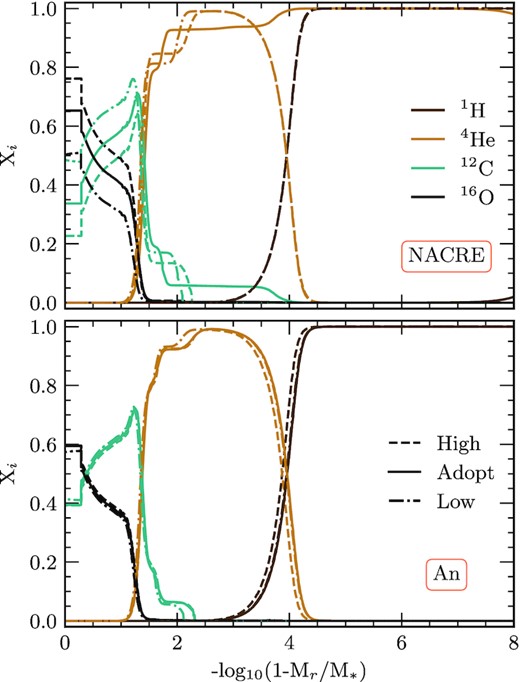
Fig. 12 shows the abundance profiles of WD models with a stellar mass of |$M_* = 0.548\, \mathrm{M}_\odot$|, |$T_{\textrm {eff}} = 20\, 000$| K and an initial mass of |$M_i = 1.30 \, \mathrm{M}_\odot$|. Sequences that consider a reaction rate from NACRE are shown in the top panel and those from An et al. (2016) are represented in the bottom panel. All sequences finish with similar structure to those shown in Fig. 12. The profiles depict a DA WD configuration, with a hydrogen-rich envelope, a helium buffer and a C/O core. Where the abundance of carbon reaches it’s maximum, we hereafter refer to this as the carbon peak.
We show that the interior of the star has a consistent trend where the carbon peak is higher for lower reaction rates – an outcome of a less efficient reaction rate which leaves behind a larger abundance of carbon. Furthermore, the position of the carbon peak changes with the reaction rates, moving away from the centre as the reaction rate increases. We find in general that differences between An_A and the An_H/An_L reaction rates do not affect this region drastically (bottom panel), unlike that of the NACRE 12C(α, γ)16O reaction rate considerations (top panel).
The abundance profile and composition gradients in these central regions that lie within the range of 1 < −log10(1 − Mr/M*) < 2 affect the peaks in the Brunt-Väisälä frequency, which disturbs the period spectrum structure (see Córsico & Althaus 2006; Romero et al. 2012b, for more details). This is an outcome of the pulsation modes that are trapped in this region through the mode-trapping mechanism. We confirm that uncertainties of the 12C(α, γ)16O reaction rate may affect the pulsation period spectrum. Another region where the Brunt–Väisälä frequency is affected is in the He/H transition region. In particular, the position of the He/H transition will impact the period spectrum (Romero et al. 2012a, 2013).
4 CONCLUSIONS
In this work we analyse the impact that the limits of the 12C(α, γ)16O reaction rate has on the inner structure and evolutionary properties of low- and intermediate-mass stars. We consider the 12C(α, γ)16O reaction rates from NACRE (Angulo et al. 1999) and An et al. (2016). We have computed stellar sequences from the ZAMS until the remnant WD reaches a luminosity of log(L/L⊙) = −3. We applied similar starting parameters for different ensembles of reaction rates where we consider the adopted rate along with the upper and lower limits within the uncertainties of each source. We summarize our main results are as follows:
The C/O ratio of the core in the final model of each sequence is affected by the 12C(α, γ)16O reaction rate as expected, with lower C/O ratios for larger reaction rates. We find that the decreased C/O ratio for initial masses greater than the transition mass increase again at higher masses. The mass at which this increase occurs is dependent on the considered 12C(α, γ)16O reaction rate, such that it occurs for higher masses if higher reaction rates are considered. This is due to an increased number of mixing episodes, a cause of larger energy outputs increasing convective efficiency which brings fresh helium to the core during the CHB. Note that significant differences between the adopted rate and high/low limits occur only for those rates taken from NACRE which has a much larger uncertainty than those from An et al. (2016).
CHB lifetime is dependent on the considered reaction rate, a higher reaction rate produces a greater lifetime. We deem this to be a consequence in the number of mixing episodes extending the CHB lifetime, although further research would be beneficial to confirm this. Between the adopted rate and high/low limits, we find a difference up to 12 Myr for the NACRE rates and up to 4 Myr for those from An et al. (2016).
The helium core mass at the beginning of the first TP is independent of the considered 12C(α, γ)16O reaction rate up to and including the transition mass. Above this mass, we find a maximum difference of |$\approx 0.01\, \mathrm{M}_\odot$| between NACRE_H and NACRE_L, with lower reaction rates producing a lower helium core mass. Additionally, our minimum helium core mass at this point occurs at our transition mass.
Growth of the helium core mass between the first TP and the final mass reaches a maximum of 19 per cent, with growths greater than 10 per cent occurring in the mass range 1.70 ≤ Mi/M⊙ ≤ 2.60 which is in agreement with Bird & Pinsonneault (2011) and Kalirai et al. (2014). The largest growths occur for the lower reaction rates due to more available hydrogen which remained after the CHB. There are no significant differences between the rates taken from An et al. (2016) due to the limits being smaller in relation to their adopted rate than those from NACRE.
The number of TPs during the TP–AGB is dependent on the considered 12C(α, γ)16O reaction rate. We find that lower reaction rates increase the number of TPs due to a larger hydrogen fuel aiding the outward growth of the helium core mass by fuelling the unstable He-shell with a greater supply of fresh helium.
TDU episodes occur for sequences in the initial mass range of 2.40 ≤ Mi/M⊙ ≤ 3.05 with dredge-up efficiency parameters λd = 0.033 − 0.124. This mass range is independent of the considered 12C(α, γ)16O reaction rate. Additionally, the values of λd between the considered 12C(α, γ)16O reaction rate uncertainties are not significant. Furthermore, the depth of each TDU is independent of the 12C(α, γ)16O reaction rate.
The IFMR produced in this work has a similar trend to that of Weidemann (2000), who also consider a similar mass-loss prescription during the AGB. The IFMRs of Renedo et al. (2010) and Salaris et al. (2009) show a much steeper gradient and they consider the Vassiliadis & Wood (1993) mass-loss prescription during the AGB.
We find that the final ages of the sequences are in general independent of the considered reaction rate. However, during the final cooling track, we find differences up to 10 per cent between the adopted rates and high/low limits. This is true for both those rates taken from NACRE and An et al. (2016). This difference in the cooling time agrees with the works of Prada Moroni & Straniero (2002), Salaris et al. (2010), Isern, and Artigas & García-Berro (2013).
The final C/O ratio in the core shows a similar trend to that at the end of the CHB. The oxygen abundance increases slightly due to the diffusion processes. The final oxygen mass fraction for NACRE_A and NACRE_H sequences are greater than the values derived by Horowitz et al. (2010) for crystallization of a C/O core. The reaction rates from An et al. (2016) agree closely with the derived values of Horowitz et al. (2010). As such, future works should consider a lower reaction rate than that of NACRE when considering the crystallization process of Horowitz et al. (2010).
The inner structure of the star is affected by the uncertainties within the considered reaction rates, particularly those from NACRE. The position and height of the carbon peak is significantly affected by the difference between the adopted rate and high/low limits of the reaction rate for the NACRE considerations. This may affect the modes in which pulsations can occur during the ZZ Ceti instability strip (Córsico & Althaus 2006; Romero et al. 2012a).
Although we analyse the possible evolutionary stages where more accurate 12C(α, γ)16O reaction rates are needed, a deeper analysis of some effects are still required. For instance, a quantification of how the pulsation modes of sdB’s and ZZ Ceti stars are affected, for example. Furthermore, we conclude that a lower reaction than that of NACRE_A is favourable for the Horowitz et al. (2010) considerations of crystallization, however, this must be further analysed as well. By limiting the uncertainties of 12C(α, γ)16O reaction rates to 10 per cent of the adopted rate, as in An et al. (2016), reports a much better consistency of stellar parameters.
ACKNOWLEDGEMENTS
BTP, ADR, and SOK acknowledge support by CNPq and PRONEX-FAPERGS/CNPq. This study was financed in part by the Coordenação de Aperfeiçoamento de Pessoal de Nível Superior - Brasil (CAPES) – Finance Code 001. This research has made use of NASA’s Astrophysics Data System. AGI acknowledges support from the Netherlands Organisation for Scientific Research (NWO). We also thank developers of the mesa software, which was used extensively in this work. Finally, we thank the anonymous referee for their input to make it a more complete work.
DATA AVAILABILITY
The data is available upon request to the corresponding author.
Footnotes
The dredge-up efficiency parameter is defined as the fraction of helium core mass lost during the TDU episode over the helium core mass growth since the last TDU.
REFERENCES
APPENDIX A: CONVECTION DURING CHB FOR AN RATES
Fig. A1 shows the CHB history of the convective mass and the luminosities of the 3α process and the 12C(α, γ)16O reaction, for the reaction rates taken from An et al. (2016). This figure is analogous to that of Fig. 4 which shows the same for the NACRE rates. We provide this figure to prove that we do not find any significant difference between the number of mixing episodes, luminosity from the 3α process and the 12C(α, γ)16O reaction. Thus, the high/low limits for the 12C(α, γ)16O reaction rate from An et al. (2016) does not affect the CHB in terms of energy production, mixing episodes or CHB duration. This was not found for the NACRE case, which is discussed in Section 3.1.
History of the convective mass (top panel), 3α luminosity and the luminosity of the 12C(α, γ)16O reaction during the CHB (bottom panel). The history is given in terms of the CHB duration. This plot in particular considers all An et al. (2016) prescriptions for the 12C(α, γ)16O reaction rate for an initial mass of |$M_i = 2.45\, \mathrm{M}_\odot$|. Blue lines represent An_H, orange-brown depicts An_A and dark-brown shows An_L. Furthermore, the solid line represents the convective mass, dotted lines show the luminosity of the 12C(α, γ)16O reaction and dot-dash lines portray the 3α luminosity.
APPENDIX B: ADDITIONAL AGB MODELS
Fig. B1 shows the Kippenhahn diagram for the case of |$M_i = 3.05\, \mathrm{M}_\odot$| during the TP-AGB in the original NACRE_A models. We represent the mass co-ordinate on the first y-axis and the surface C/O ratio on the second y-axis. Both values are plotted against the age of the sequence. These models did not consider convective overshooting around the border of the He-exhausted core. Green slashed areas show convective regions, red back slashed areas represent semiconvective regions and the purple regions are where overshooting occurs. The purple dotted line shows the history of the He-exhausted core mass and the blue dotted line represents the history of the helium core mass. The colour bar measures the energy generation rate from nuclear reactions. The solid orange line represents the C/O ratio at the surface. It can be seen that the overshooting occurs close to the envelope boundary and there is no overshooting about the semiconvective region of the He-exhausted core. As a result of this, we do not observe TDU episodes in the original models. We can be sure that there are no TDU episodes because of the lack of change in helium core mass and that the surface C/O ratio remains constant, which would change if TDUs were experienced (Frost & Lattanzio 1996; Herwig et al. 1999; Karakas et al. 2002; Weiss & Ferguson 2009; Romero et al. 2015; De Gerónimo et al. 2017; Marigo et al. 2020).
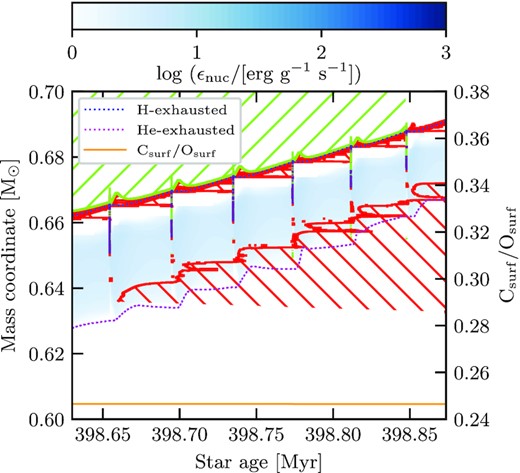
Kippenhahn diagram for during the TP-AGB for the case of |$M_i = 3.05\, \mathrm{M}_\odot$| of the original models. We represent the mass co-ordinate on the first y-axis and the surface C/O ratio on the second y-axis. Both values are plotted against the age of the sequence. This model did not consider convective overshooting at boundary of the He-exhausted core which inhibited the TDU. The colour bar measures the energy generation rate from nuclear reactions. The blue dotted line represents the helium core mass while the purple dotted line represents the He-exhausted core. Green slashed regions show convection and the red back slashed regions represent where regions of the star are semi-convective. Finally, purple areas are where overshooting occurs.
Fig. B2 shows the same as Fig. B1 but allows for convective overshooting at each boundary. We find that, with the new prescription, convection and overshooting extends throughout the helium buffer. For this reason material can be ‘dredged-up’ from the core to the surface. This results in the helium core mass and He-exhausted core masses changing with each convective episode – an outcome of TDU episodes (Frost & Lattanzio 1996; Herwig et al. 1999; Karakas et al. 2002; Weiss & Ferguson 2009; Romero et al. 2015; De Gerónimo et al. 2017; Marigo et al. 2020). Furthermore, we find an increase in the surface C/O ratio with each TDU as material travels from the stellar interior to the surface. The surface C/O ratio, however, remains less than 1. This indicates a larger overshooting parameter is required for M-star to C-star transitions.
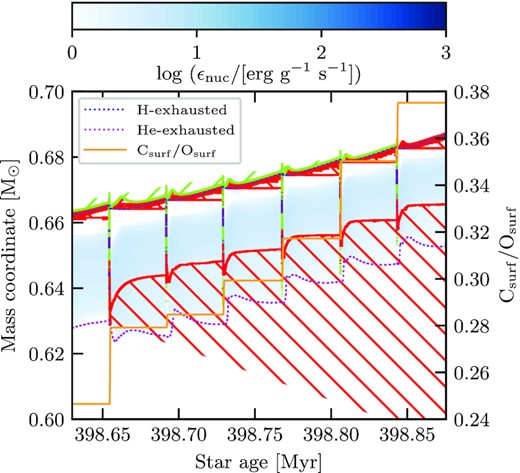
Kippenhahn diagram for during the TP-AGB for the case of |$M_i=3.05\, \mathrm{M}_\odot$| of the new models. We represent the mass co-ordinate on the first y-axis and the surface C/O ratio on the second y-axis. Both values are plotted against the age of the sequence. The colour bar measures the energy generation rate from nuclear reactions. This model considered convective overshooting at all convective boundaries, allowing fro TDUs to occur. The blue dotted line represents the helium core mass while the purple dotted line represents the He-exhausted core. Green slashed regions show convection and the red back slashed regions represent where regions of the star are semi-convective. Finally, purple areas are where overshooting occurs.
