


ABSTRACT
We present 21 new long-term variable radio sources found commensally in 2 yr of weekly MeerKAT monitoring of the low-mass X-ray binary GX 339−4. The new sources are vary on time-scales of weeks to months and have a variety of light-curve shapes and spectral index properties. Three of the new variable sources are coincident with multiwavelength counterparts; and one of these is coincident with an optical source in deep MeerLICHT images. For most sources, we cannot eliminate refractive scintillation of active galactic nuclei as the cause of the variability. These new variable sources represent 2.2 ± 0.5 per cent of the unresolved sources in the field, which is consistent with the 1–2 per cent variability found in past radio variability surveys. However, we expect to find short-term variable sources in the field and these 21 new long-term variable sources. We present the radio light curves and spectral index variability of the new variable sources, as well as the absolute astrometry and matches to coincident sources at other wavelengths.
1 INTRODUCTION
We are entering a new era of radio astronomy where we can execute untargeted, image-plane searches for variable and transient sources using sensitive instruments with wide field capabilities. Instruments such as the Australian Square Kilometre Array Pathfinder (ASKAP;1 Hotan et al. 2021), the Karl G. Jansky Very Large Array (VLA; Perley et al. 2011), the Low Frequency Array (LOFAR; van Haarlem et al. 2013), the Murchison Wide Field Array (MWA; Tingay et al. 2012), and the (more) Karoo Array Telescope (MeerKAT; Camilo et al. 2018) are uncovering large samples of dynamic sources in the radio sky and facilitating their detailed light-curve analyses without the need for targeting each source individually.
Previous surveys and investigations of the changing radio sky in the image plane have revealed that ∼1–2 per cent of radio point sources at L-band (1.4 GHz) are variable (see e.g. Ofek et al. 2011, for a review).2 Many of these past searches for variable sources used the VLA. For example, Carilli, Ivison & Frail (2003) searched the Lockman Hole region with the VLA on time-scales of 19 d to 17 months and found that less than 2 per cent of sources varied; de Vries et al. (2004) used the Faint Images of the Radio Sky at Twenty centimeters (FIRST; Becker, White & Helfand 1995) observations of the zero-declination strip and found that ∼2 per cent of sources varied; Levinson et al. (2002) searched VLA FIRST and National Radio Astronomy Observatory (NRAO) VLA Sky Survey (NVSS; Condon et al. 1998) observations and found one transient candidate; and Mooley et al. (2013) observed the Extended Chandra Deep Field-South with the VLA at 1.4 GHz and found that 1 per cent of unresolved sources were variable. The Nasu sky survey detected one confirmed transient source, supernova WJN J1443+3439 (Kuniyoshi et al. 2007; Matsumura et al. 2007, 2009; Niinuma et al. 2007, 2009; Kida et al. 2008; Aoki et al. 2014). Recently, the VLA COSMOS H i Large Extragalactic Survey (CHILES; Fernández et al. 2013, 2016) field was observed 172 times over 5.5 yr by the CHILES Variable and Explosive Radio Dynamic Evolution Survey (CHILES VERDES; Sarbadhicary et al. 2021) team. This was a very sensitive search for variable and transient sources, with each epoch reaching a root-mean-square (rms) noise of |${\sim}10\, \mathrm{\mu Jy}$|. However, they only used the VLA while it was in B-configuration, which occurs for approximately 4 months per 16-month cycle. During those 4 months, CHILES VERDES observed the field for 1–8 h per epoch every 1–2 d. They then had a 12-month break where they did not monitor their sources. The CHILES VERDES survey has unprecedented depth and cadence, revealing that 58 of their 2713 (∼2 per cent) sources are variable. Other telescopes have also been used to search for variables, such as the Molonglo Observatory Synthesis Telescope (MOST; Mills 1981) and ASKAP. Bannister et al. (2011) used MOST to observe a large part of the sky over 22 yr. They found variability in less than 0.3 per cent of the radio sources they observed. The ASKAP Boolardy Engineering Test Array (BETA; Hotan et al. 2014) was used to searched for variable sources in two regions. BETA consisted of six ASKAP antennas, and only one variable source was found with this instrument (Heywood et al. 2016; Hobbs et al. 2016). Wang et al. (2021) used the full ASKAP array to search for intrahour variable sources and they found six variable sources.
These surveys and searches for variable sources tell us that only a small percentage of the radio sky is variable. However, we know that those radio sources that are variable reveal important information about some of the most extreme and explosive astrophysical sources. This includes black hole accretion and jets in X-ray binaries (XRBs; e.g. Tremou et al. 2020), gamma-ray burst (GRB) afterglows (e.g. Granot & van der Horst 2014; Chandra 2016), and jet-shocks from active galactic nuclei (AGNs; e.g. Hovatta et al. 2008). Radio waves are not obstructed by dust and gas, meaning that radio observations can be used to obtain accurate rates of events such as core-collapse supernovae, tidal disruption flares, and possibly Type Ia supernovae. In addition to intrinsic effects there are extrinsic effects, for example five of the variable sources found by Wang et al. (2021) line up on the sky, suggesting scintillation by an interstellar medium (ISM) filament. Expanding untargeted searches for radio variables and transients could also reveal new classes of transients.
It is thought that AGN variability is the dominant source of radio point source variability (e.g. Thyagarajan et al. 2011; Mooley et al. 2016). AGNs are observed to vary on short time-scales of hours to days, thought to be due to refractive interstellar scintillation (RISS; e.g. Rickett 1990). RISS is caused by electrons along the line of sight, and the time-scale and variability amplitude caused by scintillation depends on the Galactic latitude of the AGN (Hancock et al. 2019). AGNs are observed to flare on longer time-scales, from days to months, due to shocks in the jets formed by material accreting on to the black holes at their centres (Hovatta et al. 2008). In the CHILES VERDES survey, Sarbadhicary et al. (2021) determined that most of their variable sources were AGNs using their multiwavelength counterparts and radio spectral indices. Compact AGNs are expected to have flat spectra, α ≳ −0.5 (e.g. Padovani et al. 2017, and references therein), where the spectral index, α, is given by Sν ∝ να, where Sν is the flux density of the source at frequency ν.
MeerKAT (Camilo et al. 2018) is a 64-dish interferometer in the Karoo region of South Africa. Each dish has an effective collecting area with a diameter of 13.5 m and the longest baseline is 8 km, giving a resolution of ∼5 arcsec and a field of view (FoV) of ∼1 deg2 at 1400 MHz. ThunderKAT3 is a MeerKAT Large Survey Project (LSP) investigating variable and transient radio sources in the image plane, including commensal searches (Fender et al. 2018). ThunderKAT has committed to observing the low-mass X-ray binary GX 339−4 on a weekly cadence for 5 yr, beginning in 2018 September (Tremou et al. 2020). This makes the GX 339−4 field ideal for commensal searches for variable and transient sources, with the first MeerKAT transient, MKT J170456.2−482100, discovered in this field (Driessen et al. 2020).
We present the results of searching for long-term (sources that show variability on scales of weeks to months) variable sources in the GX 339−4 field over the first 2 yr of ThunderKAT monitoring of the source. In Section 2, we present our MeerKAT observations, and in Section 3, we present our method for matching sources to their multiwavelength counterparts. In Section 4, we present our results, and in Sections 5 and 6, we discuss and conclude.
2 MEERKAT RADIO OBSERVATIONS
We present 102 epochs of weekly MeerKAT observations of the field surrounding GX 339−4. ThunderKAT started weekly monitoring of the field in 2018 September (Tremou et al. 2020) using the L-band (856–1712 MHz) receiver in full polarization mode. The MeerKAT L-band receiver has a bandwidth of 856 MHz, a central frequency of 1284 MHz, and 4096 frequency channels. The field is observed for ∼10 min each week with a minimum integration time of 8 s. The phase calibrator (1722–554) is observed for 2 min before and after observing the target field, and the band-pass and flux calibrator (1934–638) is observed for 5 min at the start of the observing block.
Full details on the processing of the weekly GX 339−4 observations can be found in Driessen et al. (2020) and Tremou et al. (2020). The data are flagged using AOFlagger4 (Offringa et al. 2010; Offringa, van de Gronde & Roerdink 2012) and are calibrated using the Common Astronomy Software Application5 (casa ; McMullin et al. 2007). Calibration includes phase correction, antenna delays, and band-pass corrections. The data are imaged using WSClean (Offringa et al. 2014), including w-projection planes, a Briggs robust weighting of −0.7 (Briggs 1995), and multiscale clean. The multifrequency synthesis (MFS) images were produced using eight frequency channels and a fourth-order spectral polynomial fit. The weekly, 10-min MFS images have a typical rms noise of |${\sim}30\, \mathrm{\mu Jy\, beam^{-1}}$|. We produce eight subband images per epoch by excluding the -join-channels parameter and spectral fit. The eight subbands have central frequencies: 909, 1016, 1123, 1230, 1337, 1444, 1551, and 1658 MHz and each subband image is primary beam corrected. The primary beam correction is performed by multiplying the final fits image by the primary beam model for each subband. The 1230 MHz subband is strongly affected by radio frequency interference (RFI), and as such we exclude it from our analysis. As we are focusing on long-term variability in this investigation, we only produce full time-integration images, both subband and MFS, for each epoch. We will present an investigation of the short-term variability of sources in the GX 339−4 field in a future publication. In addition to the single-epoch images, we also utilize a deeper, combined image of the field produced using DDFacet (Tasse et al. 2018) to determine the positions of the sources. This image was produced by jointly imaging the visibilities from eight epochs (2018 September and October, and a commissioning image from 2018 April) with a total integration time of 3.63 h.
2.1 The LOFAR Transients Pipeline
The LOFAR Transient Pipeline (TraP, Release 4.0; Swinbank et al. 2015) is a software package for extracting light curves from a time series of fits images. It has been designed with radio images in mind, specifically to find sources in LOFAR images for the Transients Key Project.6
We used the default TraP parameters with some minor adjustments to search the GX 339−4 field for variable and transient sources. The default settings for the pipeline configuration and job configuration files can be found in the TraP documentation.7 We used the default signal-to-noise ratio (S/N) of 8 for a new source to be detected in an image, and we set the force_beam parameter to True (default is False) to search for sources with a Gaussian shape consistent with the shape of the synthesized beam in each image. The beamwidths_limit parameter was set to 3.0. This means that there must be at least three synthesized beamwidths between two sources for those two sources to be considered unique. Both force_beam and beamwidths_limit were set this way to reduce the number of extended sources, particularly double-lobed galaxies, detected as point sources. For our statistics and information we require flux density measurements in every epoch, even if those measurements are upper limits. As such, we force TraP to continue measuring flux densities for all sources in all epochs by setting the expiration parameter to 150. TraP searches through the inputted images in chronological order. So, as mentioned above, only a source detected in the first epoch will be tracked in all epochs. To track as many sources as possible for as many epochs as possible, we insert the deep MeerKAT image of the GX 339−4 field as the ‘first epoch’. Once TraP has run, we remove this epoch from our analysis. Using the deep image as our ‘first epoch’ and a TraP detection threshold of 8 means that the tracked sources have a minimum S/N of 8 in this deep image, but may have a much lower S/N in the weekly 10-min epochs. As such, future mentions of S/N for sources in this work are calculated using the simple method of dividing the measured flux density by the uncertainty on the flux density. We extract the source information and light curves from TraP using python.8
2.2 Variability parameters
2.3 Light-curve binning
As we are interested in the long-term variability of the sources in the field and we wanted to confirm longer term low-amplitude variability, we binned the light curves for all sources into 10-epoch bins using the weighted mean. We then calculated the variability parameters for each source using the binned light curves. To ensure that any variability was not dependent on the starting epoch, we performed the same analysis after removing epoch one, epochs one and two, and epochs one, two, and three. This did not impact the light curves or variability parameters. We found that binning enhances the ην parameter for light curves where the binning is on comparable time-scales to the trend in the curve. This is because a trend across multiple bins enhances the trend, as opposed to binning randomly scattered data.
2.4 Systematic effect corrections
In the initial stages of investigating the sources in the GX 339−4 field, we manually examined the light curves of all of the sources. We noticed that many had similar underlying light-curve shapes, and that many more sources than expected appeared to be variable. We determined that some of the light-curve correlations between unrelated sources are due to those sources being small (only slightly larger than the synthesized beam), resolved sources. We removed the resolved sources and spatially close sources from the data set reducing the number and strength of the correlations between sources (see Appendix A); however, some correlation between light curves remained. The remaining underlying systematic effects are multiplicative and cause variations of ∼10 per cent.
We determined the shape of the systematics by taking all of the sources with an S/N ≥ 3 and dividing their flux densities by the flux density in a reference epoch. We used this S/N threshold as we needed a sufficient number of sources to identify the systematics and to test any possible flux density and position dependence. We chose the last epoch as the reference epoch as all sources have a measurement in the last epoch due to the forced measurements (see Section 2.1). We then take the distribution of the scaled flux density of every source from each epoch and find the median and the median absolute deviation (MAD). These median values (with the MAD as the uncertainty) are the model of the systematics for each epoch.
To correct the light curve of each source for the systematics, we divide each light curve by the model and propagate the uncertainties. We then recalculate ην and Vν for each source using the corrected flux density and equations (1) and (2). The light curves and variability parameters discussed in this paper have all been corrected for the systematic effects. These light-curve systematics are the reason that we have chosen to focus on long-term variable sources instead of short-term variable sources. The systematics particularly induce week-to-week variability, as opposed to longer trends. For more information regarding the systematics and corrections, see Appendix A.
2.5 Absolute astrometry
We performed a Python Blob Detector and Source Finder9 (PyBDSF) search on the deep MeerKAT image to determine the source positions and found 17 130 sources. The PyBDSF software is a source extractor designed for LOFAR and is focused on cleanly extracting all flux from an image. The maximum uncertainties for the right ascension and declination positions of our sources of interest are 0.08 and 0.09 arcsec, respectively. To accurately match the sources to sources from other catalogues, we need to understand the accuracy of our absolute astrometry.
There are no matches between MeerKAT sources in our FoV and the Third International Celestial Reference Frame (3ICRS; Charlot et al. 2020). However, there are 11 Australian Telescope Compact Array (ATCA) Parkes-MIT-NRAO (PMN) source matches (ATPMN; McConnell et al. 2012). ATPMN is a source catalogue where 8385 PMN sources were observed with ATCA at 8.6 GHz, resulting in a catalogue of 9040 radio sources. The number of sources from ATPMN is greater than the number of PMN sources as the higher resolution of ATCA resolves some PMN sources into multiple sources. McConnell et al. (2012) compared the ATPMN sources to the positions of the Long-Baseline Array (LBA) Calibrator Survey 1 catalogue of Southern Sources (LCS1; Petrov et al. 2011) and to the International Celestial Reference Frame (ICRF; Ma et al. 1998). They matched ATPMN sources to 309 LCS1 and 26 ICRF sources, and found that the median astrometric uncertainty in the ATPMN positions is 0|${_{.}^{\prime\prime}}$|4 in both right ascension and declination.
Of the 11 ATPMN sources within the MeerKAT GX 339−4 FoV, five are resolved in the MeerKAT observations. As resolved sources have poorer localization precision, we discard these five sources. We use the six remaining ATPMN sources, shown in Table 1, and the corresponding six MeerKAT sources to test and correct the astrometry.
Summary of the ATPMN sources used to determine the absolute astrometry of the MeerKAT observations of the GX 339−4 field. The right ascension (RA) and declination (Dec.) are given in degrees. The α value is the ATPMN spectral index.
| ATPMN name | RA | Dec. | |${S_{5\, \mathrm{ GHz}}}$| (mJy) | |${S_{8\, \mathrm{ GHz}}}$| (mJy) | α |
|---|---|---|---|---|---|
| J165418.2−481303 | 253.5759 | −48.2176 | 82 ± 7 | 61 ± 10 | −0.5 ± 0.3 |
| J165613.1−492318 | 254.0549 | −49.3883 | 110 ± 7 | 46 ± 10 | −1.5 ± 0.4 |
| J165614.9−472915 | 254.0623 | −47.4876 | 77 ± 7 | 37 ± 10 | −1.3 ± 0.5 |
| J165902.0−474618 | 254.7585 | −47.7719 | 61 ± 7 | 71 ± 10 | 0.3 ± 0.3 |
| J165908.3−481548 | 254.7848 | −48.2635 | 99 ± 7 | 43 ± 10 | −1.4 ± 0.4 |
| J171154.9−491250 | 257.9791 | −49.2141 | 73 ± 7 | 43 ± 10 | −0.9 ± 0.4 |
We fit for a transformation matrix to shift and rotate the MeerKAT deep image source positions to match the six ATPMN source positions. We then apply the transformation to all MeerKAT sources in the field.10 The separation between the MeerKAT and ATPMN reference sources before and after transformation is shown in Table 2. To determine the uncertainties on the transformed MeerKAT positions, we performed a Monte Carlo simulation. We selected a position for each ATPMN reference source from a Gaussian with the mean of the ATPMN position and a standard deviation of 0|${_{.}^{\prime\prime}}$|4. We then calculated and applied the transformation matrix to the MeerKAT reference sources. We repeated these steps 5000 times, and found the standard deviation on the transformed positions of the MeerKAT reference sources. The minimum and maximum standard deviations were 0|${_{.}^{\prime\prime}}$|2 and 0|${_{.}^{\prime\prime}}$|4 for both the Right Ascension and Declination. This uncertainty is much larger than the uncertainty derived by PyBDSF for our sources of interest, and as such we will use an uncertainty of 0|${_{.}^{\prime\prime}}$|4 in Right Ascension and Declination for all of our MeerKAT sources. The final positions we use for our MeerKAT sources are therefore the transformed position from the deep MeerKAT stack, with an uncertainty of 0.4 arcsec and this means that the positions for the sources quoted in this paper have been corrected for absolute astrometry.
Separation between ATPMN and MeerKAT reference sources before and after applying the transformation. The separation is given in arcsecond.
| ATPMN source name | Separation before | Separation after |
|---|---|---|
| (arcsec) | (arcsec) | |
| J165418.2−481303 | 1.22 | 0.11 |
| J165613.1−492318 | 0.86 | 0.05 |
| J165614.9−472915 | 1.34 | 0.18 |
| J165902.0−474618 | 0.85 | 0.20 |
| J165908.3−481548 | 0.88 | 0.09 |
| J171154.9−491250 | 0.46 | 0.06 |
3 SOURCE MATCHING
The corrections to the absolute astrometry in the common reference frame allow us to match sources to objects in other catalogues at different frequencies. We used astropy astroquery11 to search for sources in VizieR (Ochsenbein, Bauer & Marcout 2000) that are colocated with our sources of interest. We searched the VizieR catalogues shown in Table B2 using the astrometric precision for each catalogue. If a catalogue has a smaller astrometric uncertainty than our positions, we searched within a radius of 0.4 arcsec, otherwise we used the radius defined by the catalogue’s uncertainty. Known variable sources GX 339−4 and MKT J170456.2−482100 match with multiple catalogues, as expected.
Summary of long-term variable sources in the GX 339−4 field. Each source, except for GX 339−4 and PSR J1703−4851, has been given their own MKT name that will be used in this paper, but may change if the source is identified as a known source. The names of the sources include the astrometrically corrected (see Section 2.5) RA and Dec., both the RA and Dec. have uncertainties of 0.4 arcsec. |$\overline{\alpha }$| is the weighted mean MeerKAT spectral index for the source, the sources denoted with a star (*) have significantly variable spectral indices. The MeerKAT spectral indices were all produced using simple power-law fits. The VF has been calculated for each source using the 10-epoch binned MFS light curves and the weighted mean. S|$_{\mathrm{909\, MHz}}$| is the mean flux density in the 909 MHz MeerKAT subband and SRACS is the Rapid ASKAP Continuum Survey (RACS) flux density with a central frequency of 887.5 MHz. We show both the unbinned and binned ηMFS and VMFS values for each source.
| Name | |$\overline{\alpha }$| | VF (per cent) | S|$_{909\, \mathrm{MHz}}$| (mJy) | SRACS (mJy) | ηMFS/VMFS (unbinned) | ηMFS/VMFS (binned) | |
|---|---|---|---|---|---|---|---|
| 1 | MKT J165945.1−484703 | 0.19 ± 0.05 | 45 ± 13 | 0.29 ± 0.03 | 0.43/0.2 | 2.0/0.13 | |
| 2 | MKT J165955.1−491352 | −0.44 ± 0.009* | 12 ± 1 | 9.13 ± 0.05 | 9.81 ± 0.06 | 4.5/0.055 | 34/0.048 |
| 3 | MKT J170028.1−482543 | −0.24 ± 0.02 | 21 ± 5 | 1.10 ± 0.03 | 0.67/0.096 | 3.9/0.072 | |
| 4 | MKT J170057.2−484753 | 0.5 ± 0.05 | 32 ± 9 | 0.26 ± 0.02 | 0.69/0.17 | 3.3/0.11 | |
| 5 | MKT J170101.1−484953 | 0.54 ± 0.05 | 52 ± 9 | 0.25 ± 0.02 | 1.0/0.21 | 7.7/0.18 | |
| 6 | MKT J170104.7−484842 | −0.11 ± 0.02 | 20 ± 3 | 1.13 ± 0.03 | 1.96 ± 0.06 | 1.3/0.074 | 11/0.065 |
| 7 | MKT J170109.9−483550 | 1.3 ± 0.01* | 47 ± 1 | 3.19 ± 0.03 | 3.32 ± 0.05 | 59/0.14 | 620/0.14 |
| 8 | MKT J170037.5−485646 | 0.95 ± 0.01* | 31 ± 2 | 1.81 ± 0.03 | 1.51 ± 0.03 | 7.5/0.11 | 73/0.11 |
| 9 | MKT J170145.8−484029 | −0.58 ± 0.02* | 26 ± 4 | 0.90 ± 0.02 | 1.4/0.1 | 12/0.095 | |
| 10 | MKT J170154.7−485342 | 0.43 ± 0.05 | 46 ± 9 | 0.23 ± 0.02 | 1.1/0.21 | 7.7/0.17 | |
| 11 | MKT J170128.5−482955 | 0.38 ± 0.04 | 26 ± 8 | 0.38 ± 0.03 | 0.57/0.13 | 2.6/0.084 | |
| 12 | MKT J170127.4−485810 | −0.023 ± 0.01* | 35 ± 1 | 13.62 ± 0.05 | 14.3 ± 0.2 | 79/0.12 | 805/0.12 |
| 13 | MKT J170213.7−483337 | 0.015 ± 0.01* | 26 ± 2 | 1.61 ± 0.03 | 4.3/0.097 | 43/0.098 | |
| 14 | GX 339−4 | 0.079 ± 0.01* | 1268 ± 7 | 2.28 ± 0.03 | 1.49 ± 0.04 | 1845/1.9 | 13655/1.4 |
| 15 | MKT J170225.5−485711 | −0.19 ± 0.03 | 21 ± 7 | 0.48 ± 0.02 | 0.5/0.1 | 2.5/0.073 | |
| 16 | PSR J1703−4851 | −2.0 ± 0.01 | 57 ± 2 | 3.09 ± 0.03 | 4.11 ± 0.1 | 52/0.34 | 106/0.15 |
| 17 | MKT J170355.9−485556 | 0.31 ± 0.01* | 31 ± 1 | 3.98 ± 0.03 | 4.73 ± 0.06 | 20/0.09 | 200/0.089 |
| 18 | MKT J170340.2−484010 | −0.14 ± 0.03 | 30 ± 5 | 0.54 ± 0.02 | 1.0/0.12 | 8.1/0.11 | |
| 19 | MKT J170404.0−485820 | −0.49 ± 0.01* | 13 ± 2 | 2.80 ± 0.03 | 2.96 ± 0.03 | 1.5/0.047 | 10/0.038 |
| 20 | MKT J170456.2−482100 | 1.0 ± 0.06 | 90 ± 17 | 0.19 ± 0.03 | 3.3/0.65 | 7.4/0.31 | |
| 21 | MKT J170524.1−480842 | 1.1 ± 0.06 | 70 ± 20 | 0.45 ± 0.04 | 0.46/0.32 | 2.3/0.22 | |
| 22 | MKT J170546.3−484822 | −1.5 ± 0.05 | 53 ± 13 | 0.55 ± 0.03 | 0.71/0.25 | 3.9/0.19 | |
| 23 | MKT J170721.9−490816 | 0.085 ± 0.02 | 21 ± 5 | 2.71 ± 0.05 | 2.55 ± 0.03 | 0.66/0.092 | 3.6/0.068 |
| 24 | MKT J170754.2−484252 | −0.13 ± 0.01* | 16 ± 2 | 11.03 ± 0.06 | 11.6 ± 0.2 | 4.9/0.082 | 23/0.056 |
Predicted VMFS,max and variability time-scales at 1284 MHz caused by refractive interstellar scintillation (RISS) using the Hancock et al. (2019) models. We show the MFS unbinned and binned VMFS values for each source, the predicted VMFS,max after a year of observations, and the predicted time-scale of variability using a central frequency of 1284 MHz.
| Name | VMFS (unbinned) | VMFS (binned) | VMFS,max (predicted yr−1) | Predicted time-scale (yr) | |
|---|---|---|---|---|---|
| 1 | MKT J165945.1−484703 | 0.2 | 0.13 | 0.13 ± 0.01 | 1.3 ± 0.1 |
| 2 | MKT J165955.1−491352 | 0.055 | 0.048 | 0.17 ± 0.01 | 1.1 ± 0.08 |
| 3 | MKT J170028.1−482543 | 0.096 | 0.072 | 0.12 ± 0.009 | 1.4 ± 0.1 |
| 4 | MKT J170057.2−484753 | 0.17 | 0.11 | 0.18 ± 0.01 | 1.0 ± 0.08 |
| 5 | MKT J170101.1−484953 | 0.21 | 0.18 | 0.19 ± 0.005 | 0.95 ± 0.08 |
| 6 | MKT J170104.7−484842 | 0.074 | 0.065 | 0.19 ± 0.005 | 0.95 ± 0.08 |
| 7 | MKT J170109.9−483550 | 0.14 | 0.14 | 0.16 ± 0.01 | 1.1 ± 0.09 |
| 8 | MKT J170037.5−485646 | 0.11 | 0.11 | 0.17 ± 0.01 | 1.1 ± 0.08 |
| 9 | MKT J170145.8−484029 | 0.1 | 0.095 | 0.19 ± 0.005 | 0.92 ± 0.08 |
| 10 | MKT J170154.7−485342 | 0.21 | 0.17 | 0.19 ± 0.005 | 0.85 ± 0.07 |
| 11 | MKT J170128.5−482955 | 0.13 | 0.084 | 0.16 ± 0.01 | 1.1 ± 0.09 |
| 12 | MKT J170127.4−485810 | 0.12 | 0.12 | 0.19 ± 0.005 | 0.89 ± 0.07 |
| 13 | MKT J170213.7−483337 | 0.097 | 0.098 | 0.19 ± 0.005 | 0.9 ± 0.07 |
| 14 | GX 339−4 | 1.9 | 1.4 | 0.2 ± 0.006 | 0.8 ± 0.07 |
| 15 | MKT J170225.5−485711 | 0.1 | 0.073 | 0.2 ± 0.005 | 0.83 ± 0.07 |
| 16 | PSR J1703−4851 | 0.34 | 0.15 | 0.2 ± 0.006 | 0.77 ± 0.07 |
| 17 | MKT J170355.9−485556 | 0.09 | 0.089 | 0.2 ± 0.006 | 0.75 ± 0.06 |
| 18 | MKT J170340.2−484010 | 0.12 | 0.11 | 0.2 ± 0.006 | 0.8 ± 0.07 |
| 19 | MKT J170404.0−485820 | 0.047 | 0.038 | 0.2 ± 0.006 | 0.75 ± 0.06 |
| 20 | MKT J170456.2−482100 | 0.65 | 0.31 | 0.19 ± 0.005 | 0.89 ± 0.07 |
| 21 | MKT J170524.1−480842 | 0.32 | 0.22 | 0.19 ± 0.005 | 0.84 ± 0.07 |
| 22 | MKT J170546.3−484822 | 0.25 | 0.19 | 0.2 ± 0.005 | 0.78 ± 0.06 |
| 23 | MKT J170721.9−490816 | 0.092 | 0.068 | 0.2 ± 0.006 | 0.69 ± 0.06 |
| 24 | MKT J170754.2−484252 | 0.082 | 0.056 | 0.2 ± 0.005 | 0.76 ± 0.06 |
We use this same method to match source positions to MeerLICHT (Bloemen et al. 2016) and the Rapid ASKAP Continuum Survey (RACS; McConnell et al. 2020). MeerLICHT (more light) is a fully robotic, 0.65-m optical telescope at the Sutherland station of the South African Astronomical Observatory (SAAO). MeerLICHT has a 2.7 deg2 FoV. A deep image using fifteen 1-min epochs of the GX 339−4 field has been made in five SDSS filters (u, g, r, i, and z) and the wider q filter (440–720 nm). The individual epochs are being reprocessed as part of a pipeline update, but we can match our MeerKAT sources to MeerLICHT detections in the deep images. The MeerLICHT coordinates are in the International Celestial Reference System (ICRS) using the Gaia Data Release 2 (DR2, J2015.5; Gaia Collaboration 2016, 2018) frame. The coordinates are consistent with FK5 J2000 within 0.1 arcsec. RACS is a radio survey covering the whole southern sky (declinations below +41°) with ASKAP. The central frequency is 887.5 MHz with a bandwidth of 288 MHz, and the median rms in each image is 0.25 mJy beam−1. The resolution is approximately 15 arcsec. The bottom of the MeerKAT band is 856 MHz, so there is an overlap between RACS and MeerKAT. The RACS data were released in early 2021, and can be found online.12 The catalogues of sources from RACS provide the position, flux density, and spectral index of the sources. The RACS positions have not been corrected for absolute astrometry and the spectral indices do not include uncertainties. The RACS synthesized beam is more than three times larger than the MeerKAT synthesized beam, which means that some resolved MeerKAT sources or sources that are close to each other will appear as one source in the RACS images. We therefore match the MeerKAT sources to the RACS sources by finding the minimum separation between sources, and then confirm the matches by visual inspection, checking that each RACS source is only matched to a single MeerKAT source.
4 RESULTS
We detect 1080 unique point sources at least once with S/N > 3 in the weekly, 10-min images of the GX 339−4 field. The light curves of known variable sources GX 339−4 (Tremou et al. 2020), MKT J170456.2−482100 (Driessen et al. 2020), and mode-changing pulsar PSR J1703−4851 (Wang, Manchester & Johnston 2007; Jankowski et al. 2019) are shown in Fig. 1. While we will not be investigating these sources in depth in this paper, we include them to demonstrate the light curves of variable sources and to demonstrate the variability of outlier sources in the variability parameter plots (Fig. 2). In this work, we investigate only long-term variable sources, sources that vary on time-scales of months or more. There are other outlier sources in Fig. 2, these sources are short-term variable candidates and will be further investigated in future work. The light curve of GX 339−4 up to early 2021 will be discussed in Tremou et al. (in preparation).
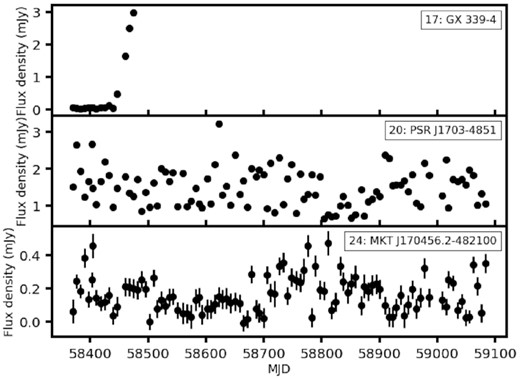
The multifrequency synthesis (MFS) light curves of known variable sources GX 339−4, PSR J1703−4851, and MKT J170456.2−482100. We have included the light curve of GX 339−4 as shown in Tremou et al. (2020), see Tremou et al. (in preparation) for an up-to-date light curve.
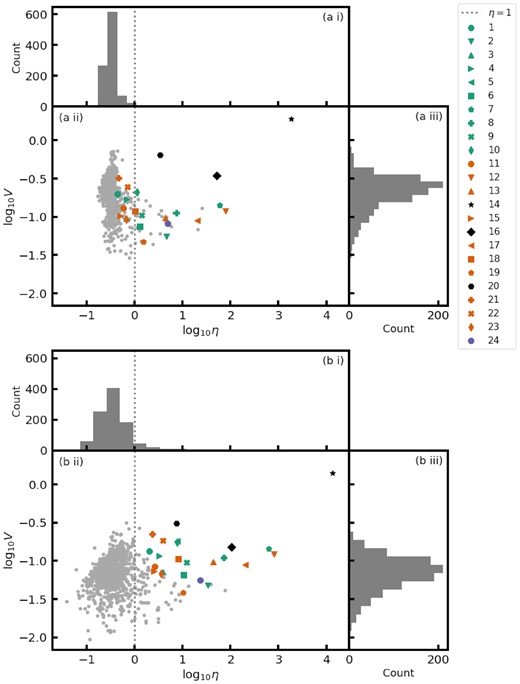
Variability parameters for sources in the GX 339−4 field calculated using the MFS light curves. Panel (a ii) shows the variability parameters for all sources in the field (grey markers) and the variable sources using the original, unbinned light curves. Panels (a i) and (a iii) show the distributions of the unbinned ηMFS and VMFS parameters, respectively. Panel (b ii) shows the variability parameters for all sources in the field (grey markers) and the variable sources using the 10-epoch binned light curves. Panels (b i) and (b iii) show the distributions of the binned ηMFS and VMFS parameters, respectively. The grey dashed line in panels (a i), (a ii), (b i), and (b ii) indicates where ηMFS = 1 (or log10ηMFS = 0). All of the sources in both panels have been detected with an S/N of 3 in at least one epoch. The numbers identifying the long-term variable sources in the legend are in Table 3. We note that there are more outliers in the variability parameters than the long-term variable sources that we discuss in this paper. These sources are short-term (week-to-week variability) variable source candidates and will be discussed in future work.
4.1 New long-term variable radio sources
We found 21 new long-term variable sources13 within 1° of GX 339−4 using a combination of manual vetting and the ην and Vν variability parameters. Manual vetting was performed by looking at the light curves for every source in all seven subbands and MFS for every source with an S/N > 3 in at least one epoch (1080 unique sources). The median flux density of each source was plotted together with the light curve, and deviation from the median and peak-to-peak variation was used to identify variable sources. We initially plotted and manually looked through all unbinned light curves to investigate the systematic variability (see Section 2.4), and while performing this investigation we noted the sources that appeared to vary over the long term. This is why many of the new long-term variable sources were found via manual vetting, while a few were found as they are extreme outliers in the unbinned ην parameter. After binning (see Section 2.3) we found that all of the sources that were identified manually have a binned ην value >1, shown in Fig. 2 and Table 3, and would have been identified as candidates using this method. A summary table of the positions of the variable sources in the GX 339−4 field is also shown in Table 3. We will refer to these sources by their MeerKAT names. Upon visual inspection of the in-band spectra, we assume that the spectral index can be modelled by a power law for all of the long-term variable sources. We use non-linear least-squares fitting to fit a power law to the seven subband flux densities for each source per epoch. The weighted mean MeerKAT spectral indices for each source are shown in Table 3.
Three of the long-term variable sources are coincident with a source in at least one of the catalogues shown in Table B2: MKT J170109.9−483550 (source 7), MKT J170127.4−485810 (source 12), and MKT J170524.1−480842 (source 21). Only MKT J170109.9−483550 is detected by MeerLICHT, and one source, MKT J170754.2−484252 (source 24), is outside the MeerLICHT FoV. Out of the 24 (including the three known variables) variable sources 11 have matches in RACS, including PSR J1703−4851 and GX 339−4. The sources and their RACS flux densities are shown in Table 3. The MeerKAT FoV with the locations of the 21 new variable sources, plus the three known variable sources, is shown in Fig. 3. Note that source 14 is GX 339−4, the phase centre of the image. A MeerLICHT image showing its FoV is shown in Fig. B1, where we can see how crowded this field is in the optical. This means that it is particularly interesting that only one of the sources is matched to MeerLICHT sources. No other sources have clear optical counterparts in the MeerLICHT image, for postage stamps of the MeerLICHT q-band positions of all of the variable sources, see Figs B2–B4. We will now discuss each source individually.
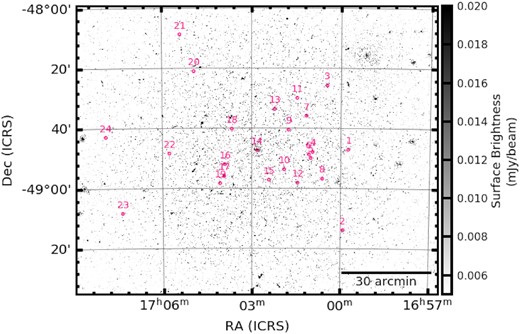
MeerKAT deep, MFS image of the GX 339−4 field showing the positions of the variable sources, including the three known variable sources. The numbers correspond to those in Table 3. The synthesized beam shape is too small to see in this figure and, as this is an MFS image, it has not been primary beam corrected.
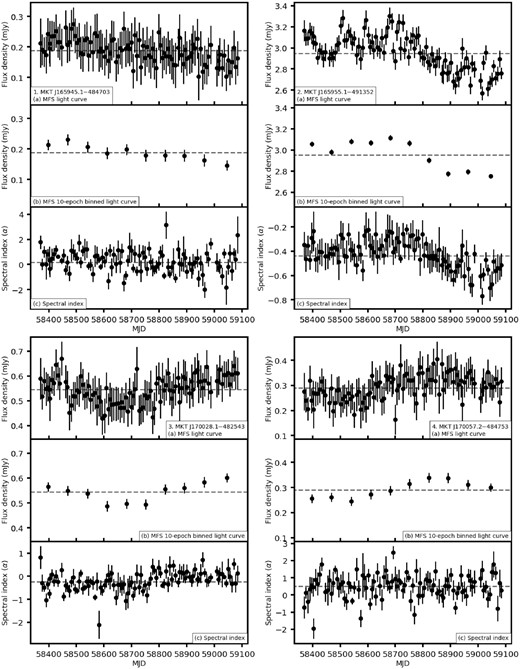
Light curves, binned light curves, and spectral index over time for sources: (1) MKT J165945.1−484703, (2) MKT J165955.1−491352, (3) MKT J170028.1−482543, and (4) MKT J170057.2−484753. The grey dashed line in each panel shows the weighted mean value.
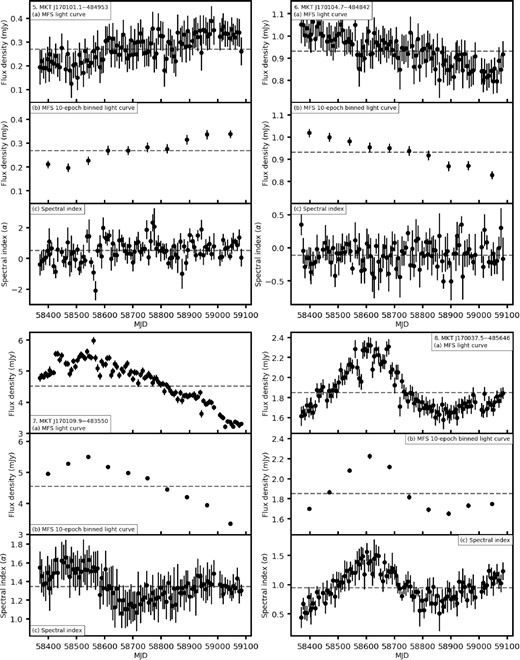
Light curves, binned light curves, and spectral index over time for sources: (5) MKT J170101.1−484953, (6) MKT J170104.7−484842, (7) MKT J170109.9−483550, and (8) MKT J170037.5−485646. The grey dashed line in each panel shows the weighted mean value.
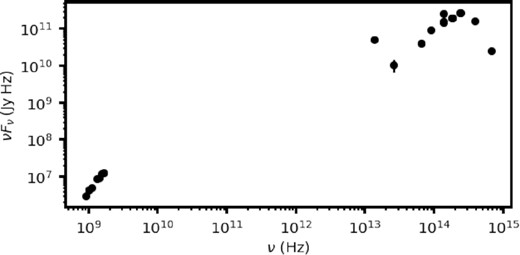
Spectral energy distribution (SED) of MKT J170109.9−483550 (source 7) including the archival MeerLICHT and MeerKAT observations. The MeerKAT flux densities shown here are the mean flux densities over every epoch these sources are observed. MKT J170109.9−483550 is only detected in the MeerLICHT i-band, the non-detections are not shown here. The MeerLICHT optical flux density has been extinction corrected using the NASA/IPAC Extragalactic Database Coordinate Transformation and Galactic Extinction Calculator.
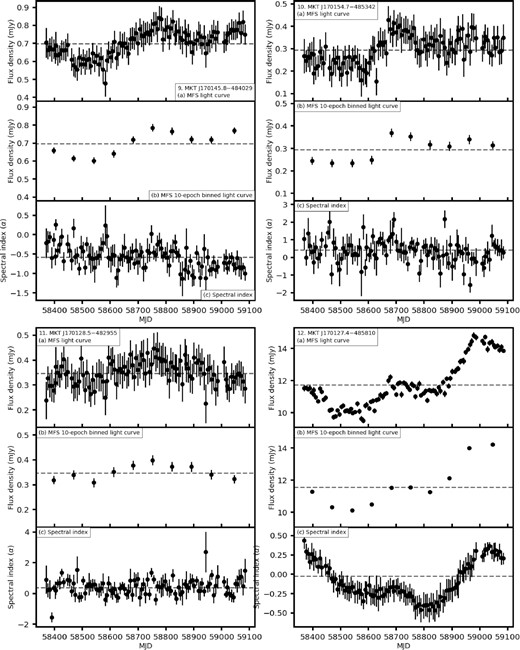
Light curves, binned light curves, and spectral index over time for sources: (9) MKT J170145.8−484029, (10) MKT J170154.7−485342, (11) MKT J170128.5−482955, and (12) MKT J170127.4−485810. The grey dashed line in each panel shows the weighted mean value.
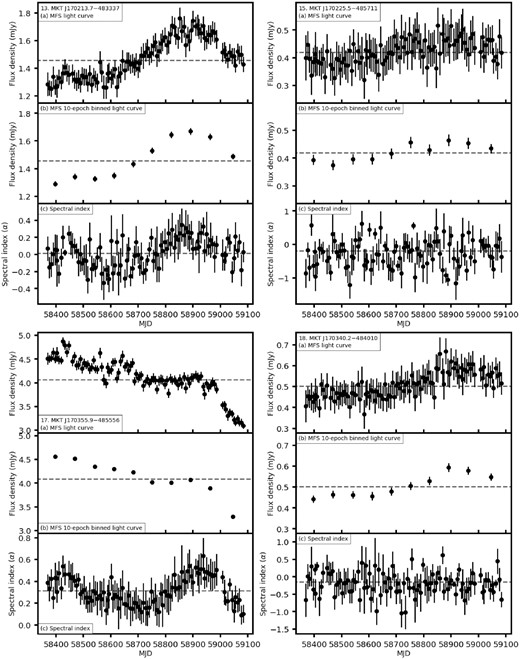
Light curves, binned light curves, and spectral index over time for sources: (13) MKT J170213.7−483337, (15) MKT J170225.5−485711, (17) MKT J170355.9−485556, and (18) MKT J170340.2−484010, The grey dashed line in each panel indicates the weighted mean value.
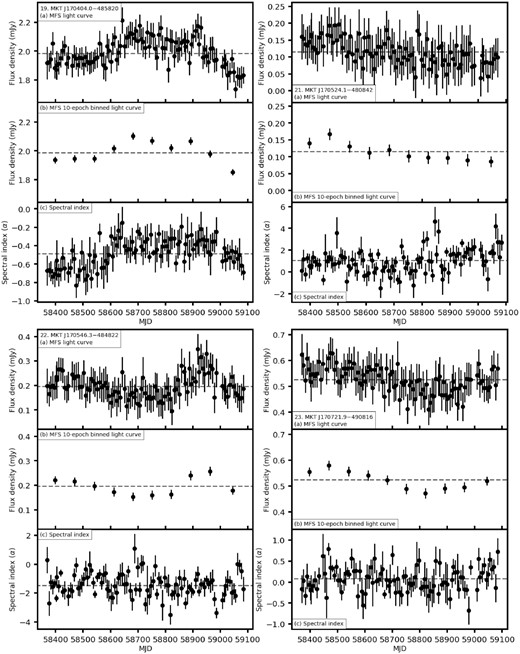
Light curves, binned light curves, and spectral index over time for sources: (19) MKT J170404.0−485820, (21) MKT J170524.1−480842, (22) MKT J170546.3−484822, and (23) MKT J170721.9−490816. The grey dashed line in each panel shows the weighted mean value.
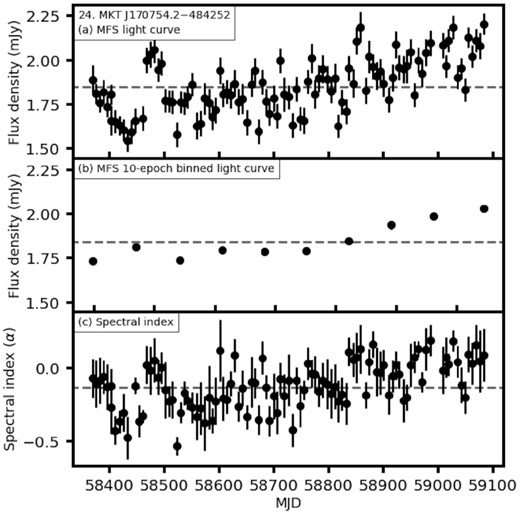
Light curve, binned light curve, and spectral index over time for source (24) MKT J170754.2−484252. The grey dashed line in each panel shows the weighted mean value.
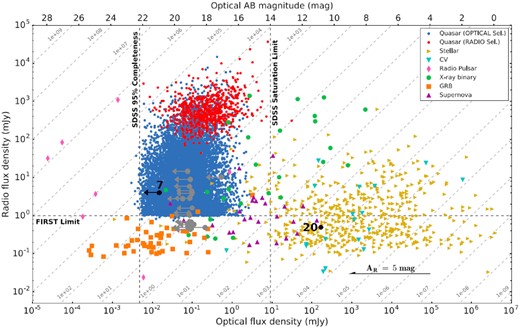
Plot from Stewart et al. (2018) showing the radio and optical flux densities of various stellar sources. The long-term variable sources have been included as grey markers where the radio flux densities are the median flux densities and the optical flux densities are the extinction-corrected MeerLICHT r-band upper limits, except for source 20 that is known stellar flaring system MKT J170456.2−482100 (black marker). Source 7 (MKT J170109.9−483550) is also marked in black. The extinction values were determined using the NASA/IPAC Extragalactic Database Coordinate Transformation and Galactic Extinction Calculator.
4.1.1 MKT J165945.1−484703
This source (source 1) was also manually identified as variable using its MFS light curve, and does not appear variable in the individual subband light curves due to the low S/N. It has an unbinned/binned ηMFS of 0.43/2.0 and VMFS of 0.2/0.13. MKT J165945.1−484703 has a slowly decreasing flux density over time, see Fig. 4, and a VF of 45 ± 13 per cent. This source has a mean spectral index of |$\overline{\alpha }=0.19\pm 0.05$|, but α also appears to vary randomly over time due to the low S/N in some subbands. This source does not have any known counterparts at other wavelengths or RACS.
4.1.2 MKT J165955.1−491352
MKT J165955.1−491352 (source 2) is an outlier in the ην parameter. The source has an unbinned/binned ηMFS of 4.5/34 and VMFS of 0.055/0.048. It has an initially flat light curve that decreases in flux density after approximately a year, shown in Fig. 4, with a VF of 12 ± 1 per cent. There appears to be shorter time-scale variability superimposed over the long-term variability; however, this correlates with the light curves of other sources in the field and is therefore likely to be a residual uncorrected correlated effect. The spectral index varies over time in a way that mirrors the MFS flux density light curve, with a mean value of |$\overline{\alpha }=-0.44\pm 0.01$|. The RACS flux density is 9.81 ± 0.06 mJy (with a centre frequency of 887.5 MHz), which is consistent with the mean MeerKAT flux density that we observe at 909 MHz: 9.15 ± 0.14 mJy. We did not find any counterparts for this source at other wavelengths.
4.1.3 MKT J170028.1−482543
This source (source 3) was found via manual light-curve vetting and was picked up at various subbands and MFS. It has an unbinned/binned ηMFS of 0.67/3.9 and VMFS of 0.096/0.072. The light curve of this source initially decreases and then slowly increases over time with a VF of 21 ± 5 per cent, see Fig. 4. The mean spectral index is |$\overline{\alpha }=-0.24\pm 0.02$|. Because of the low S/N in some subbands there is scatter in the spectral index over time, including an outlier at MJD 56000 that was caused by a noisy epoch in the 1016 MHz subband, but has no overall variability in the spectral index. There are no multiwavelength counterparts.
4.1.4 MKT J170057.2−484753
This source (source 4) was found manually in the MFS band. It has an unbinned/binned ηMFS of 0.69/3.3 and VMFS of 0.17/0.11. The light curve of this source, shown in Fig. 4, increases from approximately MJD 58550 to 58700 before roughly levelling off again and has a VF of 32 ± 9 per cent. MKT J170057.2−484753 has a mean spectral index of |$\overline{\alpha }=0.50\pm 0.05$|, with scatter on the spectral index over time caused by the low S/N in some subbands. This source does not have any multiwavelength or RACS counterparts.
4.1.5 MKT J170101.1−484953
MKT J170101.1−484953 (source 5) was identified manually in the MFS light curves. It has an unbinned/binned ηMFS of 1.0/7.7 and VMFS of 0.21/0.18. This source rises slowly over time, see Fig. 5, and has a VF of 52 ± 9 per cent. MKT J170057.2−484753 has a mean spectral index of |$\overline{\alpha }=0.54\pm 0.05$|, with scatter on the spectral index over time caused by the low S/N in some subbands. We do not find any multiwavelength counterparts for this source and it is not detected by RACS.
4.1.6 MKT J170104.7−484842
This source (source 6) was identified as variable as it is an outlier in the ην parameter. It has an unbinned/binned ηMFS of 1.3/11 and VMFS of 0.074/0.065. The flux density decreases over time with a VF of 20 ± 3 per cent, the light curve is shown in Fig. 5. The spectral index is scattered around a mean of |$\overline{\alpha }=-0.11\pm 0.02$|. This source has a MeerKAT 909 MHz mean flux density of 1.12 ± 0.19 mJy and was detected by RACS with an 887.5 MHz flux density of 1.96 ± 0.06 mJy. We did not find any coincident sources at other wavelengths.
4.1.7 MKT J170109.9−483550
MKT J170109.9−483550 (source 7) is highly variable in all MeerKAT subbands, shown in Fig. 5, and is an outlier in the ην parameter. It has an unbinned/binned ηMFS of 59/620 and VMFS of 0.14/0.14. The flux density of the source increases over the first ∼100 d of MeerKAT observations and then decreases, it has a VF of 47 ± 1 per cent. The spectral index varies between α ∼ 1 and α ∼ 1.8, with a different trend to the flux density variations and a mean of |$\overline{\alpha }=1.35\pm 0.01$|. This source has a MeerKAT 909 MHz mean flux density of 3.25 ± 0.18 mJy and was detected by RACS with an 887.5 MHz flux density of 3.32 ± 0.05 mJy. This source is coincident with a Two Micron All-Sky Survey (2MASS) source, 2MASS 17010986−4835508, with a separation of 0.39 arcsec. 2MASS 17010986−4835508 has a K-magnitude of 14.465 ± 0.123, but has poor-quality photometry in the J and H bands (Cutri et al. 2003). The 2MASS source was matched to an AllWISE source, AllWISE J170109.82−483550.8, by the Transiting Exoplanet Survey Satellite (TESS) Input Catalog (TIC; Stassun et al. 2019) with W1 magnitude 13.670 ± 0.040 and W2 magnitude 13.617 ± 0.046. The 2MASS/AllWISE source is classified as a star by the TIC due to its point-like morphology. MKT J170109.9−483550 is detected in the MeerLICHT i-band image with an AB magnitude of 18.90 ± 0.04. The spectral energy distribution (SED) including the archival, MeerLICHT, and MeerKAT data for MKT J170109.9−483550 is shown in Fig. 6.
4.1.8 MKT J170037.5−485646
MKT J170037.5−485646 (source 8) was found as it is an outlier in the ην parameter in the 1337–1658 MHz subbands and MFS. It has an unbinned/binned ηMFS of 7.5/73 and VMFS of 0.11/0.11. The flux density of the source increases sharply until approximately MJD 58600, decreases sharply until approximately MJD 58800, and then slowly increases. MKT J170037.5−485646 has a VF of 31 ± 2 per cent and the light curve is shown in Fig. 5. The spectral index varies between α ∼ 0.5 and α ∼ 1.5 with a similar shape to the light curve and a mean of |$\overline{\alpha }=0.95\pm 0.01$|. We do not find any multiwavelength counterparts for this source.
4.1.9 MKT J170145.8−484029
This source (source 9) was found through manual vetting, but is a slight outlier in the unbinned ην parameter in the 1016 MHz band and MFS. It has an unbinned/binned ηMFS of 1.4/12 and VMFS of 0.1/0.095. The flux density of MKT J170145.8−484029 decreases for approximately 100 d, increases for approximately 300 d, decreases for approximately 100 d, followed by a further increase, see Fig. 7. The VF is 26 ± 4 per cent. The spectral index roughly decreases for 2 yr with a mean spectral index of |$\overline{\alpha }=-0.58\pm 0.02$|. We do not find any multiwavelength counterparts for this source.
4.1.10 MKT J170154.7−485342
This source (source 10) was found via manual vetting. It has an unbinned/binned ηMFS of 1.1/7.7 and VMFS of 0.21/0.17. MKT J170154.7−485342 has a constant flux density until approximately MJD 56800 at which point the flux density increases for approximately 100 d before decreasing slightly again and returning to roughly constant. The light curve is shown in Fig. 7 and it has a VF of 46 ± 9 per cent. The source has a mean spectral index of |$\overline{\alpha }=0.43\pm 0.05$|, with some scatter caused by the low S/N in some subbands. This source is not detected by RACS and does not have any multiwavelength counterparts.
4.1.11 MKT J170128.5−482955
MKT J170128.5−482955 (source 11) was found through manual vetting. It has an unbinned/binned ηMFS of 0.57/2.6 and VMFS of 0.13/0.084. The VF of the light curve is 26 ± 8 per cent. The light curve, shown in Fig. 7, increases slightly for approximately a year, before slowly decreasing again. The mean spectral index is |$\overline{\alpha }=0.38\pm 0.04$|, which is constant over time apart from scatter due to the low subband S/N. This source is not detected in RACS or MeerLICHT and does not have any archival multiwavelength counterparts.
4.1.12 MKT J170127.4−485810
MKT J170127.4−485810 (source 12) was found as it is an outlier in the ην parameter in all subbands and MFS. It has an unbinned/binned ηMFS of 79/805 and VMFS of 0.12/0.12. The MFS light curve initially decreases before increasing over approximately a year, and begins decreasing again in the last 2 months, see Fig. 7. The VF of the light curve is 35 ± 1 per cent. The spectral index varies between α ∼ −0.5 and α ∼ 0.5 with a mean of |$\overline{\alpha }=-0.02\pm 0.01$|. There is some curvature in the spectrum of this source, and as such the power-law spectral index fit is an approximation. The spectral index decreases over about 400 d before increasing again, followed by a decrease echoing the flux density decrease. MKT J170127.4−485810 is detected by RACS, with a flux density of 14.32 ± 0.6 mJy at 887.5 MHz. The mean MeerKAT flux density of the source at 909 MHz is 13.72 ± 0.14, which is roughly consistent with the RACS flux density. This source is coincident with unWISE sources 2542m485o0077626 and 2564m485o0076399 with a separation of 0.2 arcsec for both. MKT J170127.4−485810 is not coincident with any other sources in VizieR and is not detected by MeerLICHT.
4.1.13 MKT J170213.7−483337
MKT J170213.7−483337 (source 13) was found as it is a clear outlier in the ην parameter in the 1658 MHz subband and MFS. It has an unbinned/binned ηMFS of 4.3/43 and VMFS of 0.097/0.098. Its light curve, shown in Fig. 8, is roughly constant for the first ∼200 d of MeerKAT observations before increasing for approximately a year, followed by a decrease until the end of the MeerKAT light curve. It has a VF of 26 ± 2 per cent. The spectral index varies between α ∼ −0.5 and α ∼ 0.5 with a mean spectral index of |$\overline{\alpha }=0.01\pm 0.01$|. The evolution of the spectral index roughly mirrors that of the light curve. The source does not have any multiwavelength counterparts and is not detected by MeerLICHT or RACS.
4.1.14 MKT J170225.5−485711
This source (source 15) was found via manual vetting. It has an unbinned/binned ηMFS of 0.5/2.5 and VMFS of 0.1/0.073. The flux density of MKT J170225.5−485711 increases slowly over time, see Fig. 8, with a VF of 21 ± 7 per cent. The mean spectral index of the source is |$\overline{\alpha }=-0.19\pm 0.03$| with scatter caused by low S/N in some subbands. This source was not detected by RACS or MeerLICHT, and no multiwavelength counterparts were found.
4.1.15 MKT J170355.9−485556
This source (source 17) is an outlier in the ην parameter in all subbands and MFS. It has an unbinned/binned ηMFS of 20/200 and VMFS of 0.09/0.089. The source’s light curve, shown in Fig. 8, decreases over 2 yr. The VF of MKT J170355.9−485556 is 31 ± 1 per cent. This source has a mean spectral index of |$\overline{\alpha }=0.31\pm 0.01$|, and the spectral index varies between ∼0 and ∼0.7. There is some curvature in the spectrum of this source, and as such the power-law spectral index fit is an approximation. The mean MeerKAT 909 MHz flux density is 4.01 ± 0.18 mJy and the source is detected by RACS with an 887.5 MHz flux density of 4.73 ± 0.06 mJy. MKT J170355.9−485556 is not detected by MeerLICHT and we do not find any counterparts using VizieR.
4.1.16 MKT J170340.2−484010
We found MKT J170340.2−484010 (source 18) using manual vetting. It has an unbinned/binned ηMFS of 1.0/8.1 and VMFS of 0.12/0.11. The MFS light curve of the source, shown in Fig. 8, is approximately constant for 300 d, increases for approximately 200 d, and then decreases slightly until the end of the MeerKAT light curve. The VF of the light curve is 30 ± 5 per cent. The mean spectral index of the source is |$\overline{\alpha }=-0.14\pm 0.03$| with scatter caused by low S/N in some subbands. We do not find any VizieR, RACS, or MeerLICHT counterparts for this source.
4.1.17 MKT J170404.0−485820
MKT J170404.0−485820 (source 19) was found via manual vetting. It has an unbinned/binned ηMFS of 1.5/10 and VMFS of 0.047/0.038. The source is constant for approximately 200 d, increases for approximately 100 d, remains constant for approximately 300 d, and then decreases. The light curve is shown in Fig. 9 with a VF of 13 ± 2 per cent. The spectral index varies in a similar way to the flux density, varying between α ∼ −1 and α ∼ 0 with a mean of |$\overline{\alpha }=-0.49\pm 0.01$|. The mean MeerKAT flux density at 909 MHz is 2.81 ± 0.18 mJy and the RACS 887.5 MHz flux density is 2.96 ± 0.03 mJy. We do not find any VizieR or MeerLICHT counterparts.
4.1.18 MKT J170524.1−480842
MKT J170524.1−480842 (source 21) was found using manual vetting and has a decreasing flux density over time. It has an unbinned/binned ηMFS of 0.46/2.3 and VMFS of 0.32/0.22. The light curve of the source is shown in Fig. 9. The VF of the light curve is 70 ± 20 per cent. The mean spectral index of the source is |$\overline{\alpha }=1.06\pm 0.06$| with scatter caused by low S/N in some subbands. This source is coincident with unWISE source 2564m485o0191898 (0.138 arcsec separation). We do not find any other VizieR, MeerLICHT, or RACS counterpart for this source.
4.1.19 MKT J170546.3−484822
MKT J170546.3−484822 (source 22) was found using manual vetting. It has an unbinned/binned ηMFS of 0.71/3.9 and VMFS of 0.25/0.19. The light curve, shown in Fig. 9, slowly decreases over the first half of the light curve before increasing and decreasing more steeply in the second half. The VF of the light curve is 53 ± 13 per cent. The mean spectral index of the source is |$\overline{\alpha }=-1.46\pm 0.05$| with scatter caused by low S/N in some subbands. This source is not detected by MeerLICHT or in archival VizieR catalogues and is not detected by RACS.
4.1.20 MKT J170721.9−490816
This source (source 21) was found using manual vetting. It has an unbinned/binned ηMFS of 0.66/3.6 and VMFS of 0.092/0.068. The light curve of MKT J170721.9−490816, shown in Fig. 9, decreases over time before slowly increasing for the last ∼200 d. The mean spectral index of the source is |$\overline{\alpha }=0.08\pm 0.02$|. There is some curvature in the spectrum of this source, particularly towards the top of the MeerKAT band, and as such the power-law spectral index fit is an approximation. The mean 909 MHz MeerKAT flux density is 2.69 ± 0.14 mJy and the RACS 887.5 MHz flux density is 2.55 ± 0.03 mJy. This source does not have a VizieR or MeerLICHT counterpart.
4.1.21 MKT J170754.2−484252
MKT J170754.2−484252 (source 24) was found via manual vetting. It has an unbinned/binned ηMFS of 4.9/23 and VMFS of 0.082/0.056. The source has an increasing flux density, shown in Fig. 10. The light curve of this source also shows shorter time-scale variability; however, we note that this variability correlates with some other light curves in the field, indicating that it is caused by residual systematics and is not intrinsic to the source. The spectral index increases over time from α ∼ −0.5 to α ∼ 0.5 with a mean of |$\overline{\alpha }=-0.13\pm 0.01$|. There is some curvature in the spectrum of this source, particularly towards the top of the MeerKAT band, and as such the power-law spectral index fit is an approximation. MKT J170754.2−484252 has a mean MeerKAT 909 MHz flux density of 11.04 ± 0.12 mJy and is detected by RACS with a flux density of 11.60 ± 0.15 mJy. The source falls outside the MeerLICHT FoV and we did not find any multiwavelength counterparts in VizieR.
5 DISCUSSION
In Section 2.4, we discussed the discovery and mitigation of systematic effects in the light curves of sources in the GX 339−4 field (see Appendix A for further information). While we were investigating these systematics we manually looked through plots of all of the unbinned light curves of sources with S/N > 3 in at least one epoch, with the mean value also plotted to enable easier identification of systematics and variability. In doing this, we first identified many of the long-term variable sources presented in this paper. This is why many of the sources in Section 4 were found via manual vetting. We performed the binning (Section 2.3) after many of the sources had already been identified manually as candidate long-term variable sources, but all 21 of the new long-term variable sources have binned ην values >1, and as such would have been identified as candidates for further investigation using the binned variability parameters. The ην value of all of the new variable sources increased after binning, which indicates that there is a long-term trend in the light curves. This is because binning enhances the ην value where there is a trend on time-scales comparable to the binning.
The non-variable sources in Fig. 2 are clustered around ην ∼ 0.3 instead of the expected ην ∼ 1.0 for the reduced χ2. We believe that this is because the uncertainties on the light curves and systematics are conservative, and when we propagate these it leads to more conservative binned light-curve uncertainties. This means that the ην values of the variable sources are also likely to be underestimated, which is why we consider the sources in comparison with each other.
If we include the known variable sources GX 339−4, PSR J1703−4851, and MKT J170456.2−482100, we find that 2.2 ± 0.5 per cent of the point sources in the field with S/N > 3 are long-term variable sources. Surveys such as Carilli et al. (2003), Frail et al. (1994), and Mooley et al. (2013) found that 1–2 per cent of radio sources in their surveys were variable. This is consistent with the percentage of sources we find; however, we have only included known variables and long-term variables in this work and we have three more years of weekly monitoring of this field to search for variable sources. This implies that 2.2 ± 0.5 per cent is the lower limit on the percentage of variable sources in the field.
There are over 400 000 optical sources in the deep MeerLICHT image, which gives ∼40 sources arcmin−2 or 0.01 sources arcsec−2. Initially it may be surprising that we did not find more matches with such a high density of optical sources. There are ∼0.3 MeerKAT sources arcmin−2 or ∼8 × 10⁻⁵ sources arcsec−2 within a degree of the phase centre. The 0.4 arcsec uncertainty on the MeerKAT astrometry gives a 1σ region of 0.5 arcsec2 around each radio source. We expect 0.006 MeerLICHT sources per 0.5 arcsec2. We find 1080 unique MeerKAT sources, if we multiply this by 0.006 we only expect 6.5 random matches between MeerKAT and MeerLICHT sources. Similarly, we would expect 0.14 matches between the 24 variable radio sources in the FoV and MeerLICHT sources. Instead, we find that three of the variable sources (including GX 339−4 and MKT J170456.2−482100) in the field match with MeerLICHT sources, which is 20 times the expected 0.14 matches. We can see the positions of the MeerKAT sources in the MeerLICHT q-band postage stamps of each source in Figs B2–B4. We are looking through the Galactic plane, which means that optical sources outside the Galaxy or on the other side of the Galaxy will be strongly affected by extinction. A lack of optical detections for 20 of the new variable sources does not conclusively mean that the sources are extragalactic, but this could be why we do not find optical counterparts despite the deep, sensitive MeerLICHT observations.
The ASKAP intrahour variability study by Wang et al. (2021) found correlated variability in sources in a linear formation on the sky, leading them to conclude that the variability is due to structure in the ISM. While some sources, such as MKT J170225.5−485711 (source 15) and MKT J170340.2−484010 (source 18), have similar variability trends, they are not in the same region on the sky and other variable sources with different trends are between these sources on the sky. We therefore do not find evidence of an ISM scintillation structure in this field based on long-term variability trends.
Thyagarajan et al. (2011) found that ∼1409 of the 1627 (∼87 per cent) variable sources they found using the FIRST survey were either confirmed to be or consistent with galaxies and quasi-stellar objects (QSOs), indicating that the majority of radio variable sources are likely to be AGN. The SED of MKT J170109.9−483550 (shown in Fig. 6) is consistent with a radio-quiet AGN or star-forming galaxy, despite being classified as a star by the TIC based on the round morphology. The 20 other new variable sources do not have enough information to confirm their nature; however, we can compare the radio variability to the blazar variability found by the Fermi-Gamma-ray Space Telescope (GST) AGN Multifrequency Monitoring Alliance (F-GAMMA; Fuhrmann et al. 2016). F-GAMMA has observed ∼60 selected blazars (plus targets of opportunity) approximately monthly from 2007 to 2015 in radio frequency bands from 2.64 to 43 GHz. They find that the radio variability of blazars is due to shocks in the relativistic jet at high frequencies and refractive scintillation at low frequencies (Angelakis et al. 2012). We can see in their released light curves that the variability of the blazars they observe can be extreme at the higher (43 GHz) frequencies, but has a lower VF and a smoother, slower variability at low frequencies (2.64 GHz). We note that the shape and time-scales of variability in their sources at low frequencies are similar to some of our sources, and that the spectral index evolution in some sources also mirrors the variability of our sources. While we cannot yet determine the nature of our sources or the cause of the variability, the many similarities between our sources and the F-GAMMA sources mean that refractive scintillation of AGN could explain what we observe.
We used the model14 by Hancock et al. (2019) to predict the approximate variability time-scale and VMFS for scintillating extragalactic sources at the position of each of our sources. Hancock et al. (2019) use an Hα intensity map (Finkbeiner 2003) to predict the effect of RISS on radio sources in searches for variable sources. They find that more RISS-induced variable sources are expected for searches close to the Galactic plane than further away. Table 4 shows the results of using their code to predict the RISS variability time-scale and expected VMFS after a year of observations at the positions of each of our sources. The predicted VMFS is the maximum expected value, and multiple sources can have the same predicted values due to the coarseness of the model grid. The known Galactic sources, GX 339−4, PSR J1703−4851, and MKT J170456.2−482100, are intrinsically variable and are not variable due to RISS. As expected, the predicted RISS Vν values and time-scales for these sources do not match the observed Vν values and time-scales. The predicted RISS Vν values are consistent with the observed, binned Vν values for 18 of the 21 new variable sources. Some sources have a lower than expected Vν compared to the RISS values, such as sources MKT J165955.1−491352 (source 2) and MKT J170127.4−485810 (source 12). This could be because those sources are Galactic sources, or it could be because the true electron density along the line of sight of the source is not well modelled by the Hα intensity map. MKT J170524.1−480842 (source 21) is the only new variable source where the observed Vν (0.22 for the binned light curve) is larger than the predicted Vν (0.19 ± 0.005). The predicted RISS time-scales for all 25 of the new variable sources are on the order of a year, which matches the observed time-scales.
Most of the new long-term variable sources that we have identified with MeerKAT have measured properties that are consistent with scintillating AGNs. In Fig. 11, we have placed the sources on to a plot by Stewart et al. (2018) that shows the radio and optical flux densities of a range of different source types. This plot shows that the 21 new long-term variable sources are consistent with quasars. We note that there are many quasars below the source detection threshold of the FIRST survey, indicated with a dashed line at 1 mJy, down to the lowest flux variables in our sample. XRBs and GRBs also occupy a similar phase space to quasars in this plot, meaning that our sources are broadly consistent with the radio to optical brightness ratios of XRBs and GRBs. However, typical radio light curves at MeerKAT observing frequencies from GRBs and XRBs have very different morphologies and time-scales than the variable sources in our sample (e.g. Chandra & Frail 2012; Fender & Bright 2019). This field is also regularly monitored in the X-ray due to GX 339−4, which would have revealed the presence of more XRBs. The optical to radio flux density ratios of the sources are also broadly consistent with pulsars in Fig. 11. While some individual pulsars have spectral indices as low as −3 and as high as 0, most pulsars have spectral indices between approximately −2.2 and −1.0 with a weighted mean of −1.60 ± 0.03 (Jankowski et al. 2018). Only one new source has a spectral index consistent with the steep spectral indices expected for pulsars: MKT J170546.3−484822 (source 22, |$\overline{\alpha }=-1.46\pm 0.05$|). If we exclude source 22, the spectral indices of the 21 new variable sources range from ∼−0.6 to ∼1.3, which does not match with the expected spectral index range for pulsars. This field has been searched by multiple pulsar surveys including the Parkes Southern Pulsar Survey (Manchester et al. 1996), the Parkes Multibeam Pulsar Survey (PMPS; Manchester et al. 2001), and, most recently, the High-Time Resolution Universe-South (HTRU-S) survey (Keith et al. 2010) where part of the field (down to a Galactic latitude of |${-}3{_{.}^{\circ}}5$|) was covered by the low-latitude survey and part was covered by the medium-latitude survey. All of our long-term variable sources fall into the region of the sky covered by the medium-latitude survey. Initially we conservatively use the worst sensitivity, which is for short-period pulsars (period ≲1 ms), is 0.6 mJy. The HTRU-S survey searched with a central frequency of 1352 MHz, corresponding to the 1337 MHz MeerKAT subband. Using the mean flux densities of each source in the 1337 MHz subband (see Table B1), we find that 14 of the 21 new long-term variable sources have flux densities greater than the 0.6 mJy sensitivity limit of HTRU-S. The best sensitivity of HTRU-S mid-latitude is ∼0.3 mJy for longer period pulsars (period ≳1 ms), and all of the new long-term variable sources have mean flux densities ≳0.3 mJy in the 1337 MHz band. If all of the new long-term variable sources were pulsars, we would expect that more than half of them would have been discovered previously by the HTRU-S mid-latitude survey. So the combination of spectral index and flux density indicates that it is unlikely that many, if any, of these sources are pulsars. However, if the sources are, for example, intermittent emitters or eclipsing binaries, this may be why they were missed in previous pulsar surveys (e.g. Kaplan et al. 2019). Further observations, particularly polarization observations or targeted pulsar searches, would determine whether the properties of these sources are consistent with pulsars.
Using the RISS-predicted VMFS and time-scales, the radio–optical flux density ratios, the spectral indices, and the light-curve shapes, we find that the new long-term variable sources are consistent with refractive scintillation of AGN. MKT J170524.1−480842 (source 21) has a marginally higher than predicted VMFS value, but the variability time-scale is consistent with the predicted time-scale. Also the RISS model we used predicts the VMFS after 1 yr of observations, while we have observed our sources for 2 yr. The radio–optical flux density ratio of the source is consistent with AGN, and the light-curve shape and spectral index are not consistent with pulsars, GRBs, or relativistic binaries. MKT J170546.3−484822 (source 22) has a VMFS and variability time-scale consistent with RISS, and its radio–optical flux density ratio is consistent with being an AGN. Similar to source 21 the light-curve shape is not consistent with GRBs or relativistic binaries. It does have a steep spectral index that is consistent with what is expected for pulsars; however, AGN can also have steep spectral indices and the other properties of the source are consistent with AGN. Further information, such as polarization measurements, will be useful in confirming the AGN classification of these sources. The polarization properties away from the phase centre for MeerKAT are still being characterized and data reduction techniques are being developed. As such, we are presently not able to determine the polarization properties of these sources with these data. This will be pursued in the future. Work is ongoing to characterize there sources at higher frequencies with ATCA and polarization analysis will be part of that work.
As many of these sources do not have multiwavelength counterparts, further investigation in the radio is the most promising for determining the nature of these sources. We have successfully proposed for ATCA time to observe the variable sources at 5 and 9 GHz to obtain polarization and further spectral information, these observations took place in mid-2021. Circular polarization of these sources would point towards stellar or pulsar sources, as opposed to AGN. Deep infrared observations and deeper optical images may also reveal counterparts to some sources. MeerLICHT continues to co-observe the field during the night, and will soon have individual epoch information available to further investigate the positions of these sources in the optical and the potential to stack more images for greater sensitivity. MeerTRAP also commensally observes the field while ThunderKAT is observing, which means that we are searching for any short time-scale bursts or pulsations from these sources, indicating pulsars or rotating radio transients. ThunderKAT will continue to observe the field weekly until 2023 September, providing further radio information about these sources.
6 CONCLUSIONS
We present the radio light curves and spectral indices of 21 new long-term variable sources discovered and monitored commensally in 2 yr of MeerKAT observations of the low-mass X-ray binary GX 339−4. This is an unprecedented data set in terms of cadence, continuity, and length. Three of these new sources are coincident with counterparts at other frequencies, and one of those is coincident with a MeerLICHT optical source. We find that refractive scintillation of AGNs could explain the long-term variability that we see in these sources. The GX 339−4 field will continue to be monitored weekly with MeerKAT until 2023 September, MeerLICHT will continue to monitor the field during night time observations, and we will use ATCA observations to further investigate the sources.
ACKNOWLEDGEMENTS
LND and BWS acknowledge support from the European Research Council (ERC) under the European Union’s Horizon 2020 Framework Programme (grant agreement no. 694745). ET acknowledges financial support from the UnivEarthS Labex program of Université Sorbonne Paris Cité (ANR-10-LABX-0023 and ANR-11-IDEX-0005-02). PAW acknowledges support from the National Research Foundation (NRF) and the University of Cape Town (UCT). AH acknowledges support by the I-CORE Program of the Planning and Budgeting Committee and the Israel Science Foundation, and support by ISF grant 647/18.This research was supported by a grant from the GIF, the German-Israeli Foundation for Scientific Research and Development. AH acknowledges support from GIF. This research was supported by grant no. 2018154 from the United States-Israel Binational Science Foundation (BSF). This work is based on the research supported in part by the National Research Foundation of South Africa (grant numbers 93405 and 119446). We acknowledge use of the Inter-University Institute for Data Intensive Astronomy (IDIA) data intensive research cloud for data processing. IDIA is a South African university partnership involving the University of Cape Town, the University of Pretoria, and the University of the Western Cape. The MeerKAT telescope is operated by the South African Radio Astronomy Observatory (SARAO), which is a facility of the National Research Foundation, an agency of the Department of Science and Innovation, South Africa. We would like to thank the operators, SARAO staff, and ThunderKAT Large Survey Project team. This research made use of astropy,15 a community-developed core python package for astronomy (Astropy Collaboration 2013, 2018). This research made use of APLpy, an open-source plotting package for python (Robitaille & Bressert 2012). LND would like to thank Tiaan Bezuidenhout, Manisha Caleb, Fabian Jankowski, Mat Malenta, Vincent Morello, Kaustubh Rajwade, and Mayuresh Surnis for useful and interesting discussions. We would like to thank the referee for their detailed comments that helped us to improve the manuscript.
DATA AVAILABILITY
The data underlying this paper are available in Zenodo at http://doi.org/10.5281/zenodo.5069119. The code underlying this paper is available on Zenodo: https://doi.org/10.5281/zenodo.4456303 and https://doi.org/10.5281/zenodo.4921715.
Footnotes
See http://www.tauceti.caltech.edu/kunal/radio-transient-surveys/index.html for an up-to-date list of untargeted radio surveys.
The HUNt for Dynamic and Explosive Radio transients with MeerKAT.
The code for this can be found on GitHub: https://doi.org/10.5281/zenodo.4456303
The code for performing the astrometric corrections can be found on GitHub: https://doi.org/10.5281/zenodo.4921715
The light-curve data for these 21 new variable sources can be found at: http://doi.org/10.5281/zenodo.5069119
REFERENCES
APPENDIX A: FLUX DENSITY SYSTEMATICS
Upon visual inspection of the light curves of sources in the GX 339−4 field, we noticed that some show correlated variability. Some examples of source light curves are shown in Fig. A1. This is concerning for variability searches as these sources appear variable, but are unlikely to be as they are apparently varying in the same way. This could also indicate underlying issues that mean that every source in this field may be affected by this systematic variability. To investigate the correlated sources further and determine the cause of the correlation we started with the Pearson’s r correlation coefficient (r; Pearson 1896). Pearson’s r measures the linear correlation between two sets of discrete points, where an r of −1 is a |$100{{\ \rm per\ cent}}$| negative correlation, an r of +1 is a |$100{{\ \rm per\ cent}}$| positive correlation, and an r of 0 is no correlation at all. The r values between the sources shown in Fig. A1 are all above 0.85. We can see similar peaks and troughs, as well as overall, long-term trends. When we compare the light curves of all sources in the field with each other (only once, if we calculate the r comparing source A to source B we did not calculate the r comparing source B to source A), we find that many sources correlate strongly with each other.
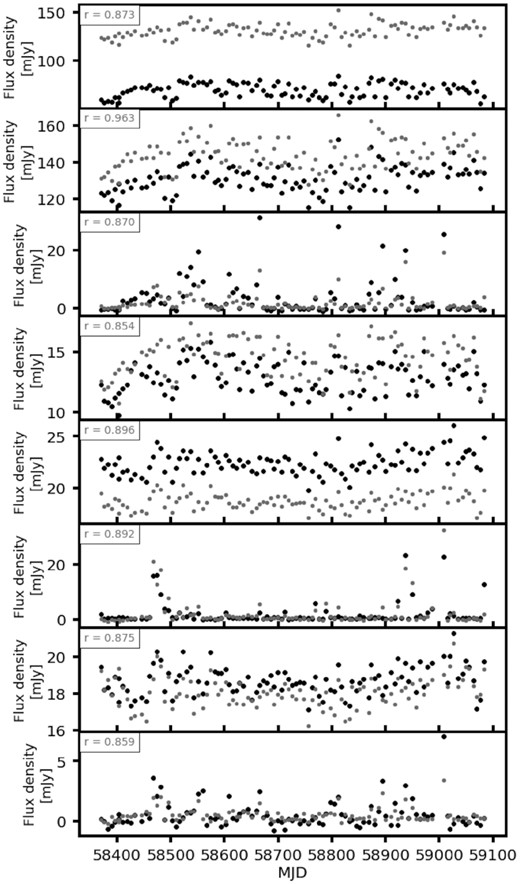
Examples of pairs of highly correlated light curves. Each row shows light curves from two different sources, one in grey and one in black. The Pearson’s r value calculated by comparing each pair of light curves is shown in the upper left-hand corner of each panel.
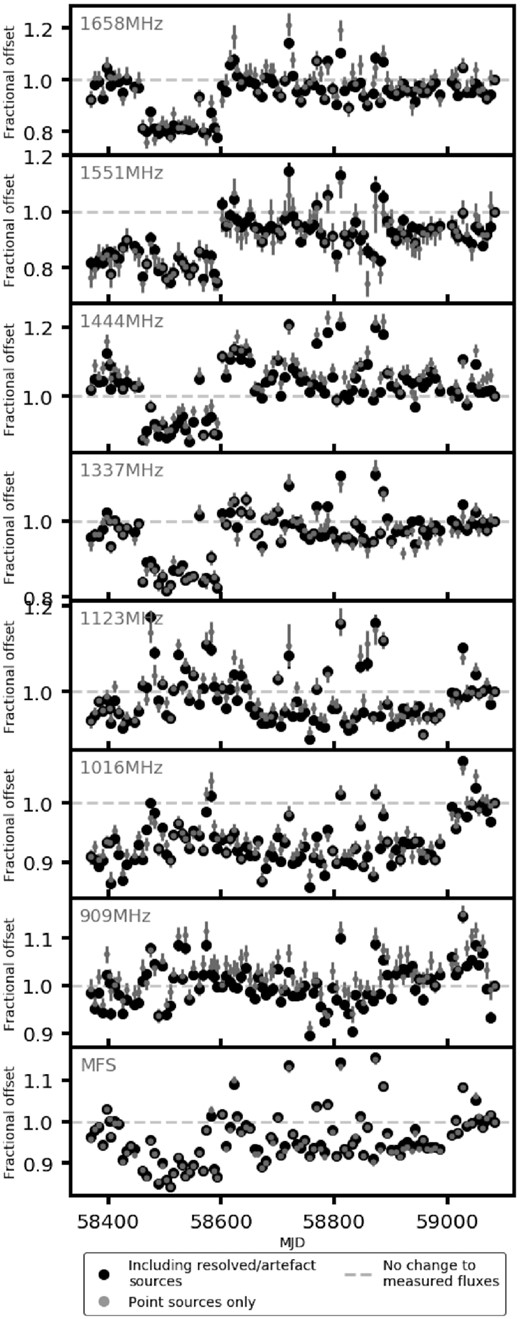
Median and MAD scale models for all frequency subbands and MFS. All points have error bars, some are too small to see. The grey dashed line is at 1.0.
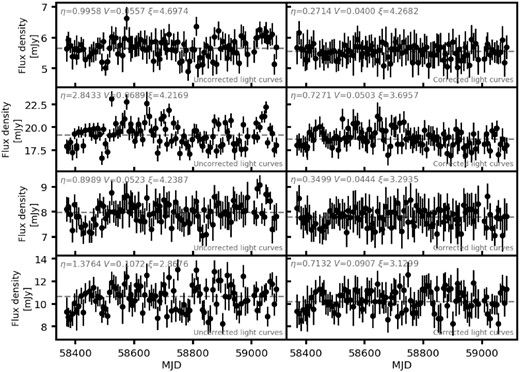
Examples of 909 MHz subband light curves before and after correction. Each row is the same source, where the left-hand column is the light curve before the correction is applied, and the right-hand column is the light curve after the correction has been applied. These sources are all point sources with an S/N > 2.
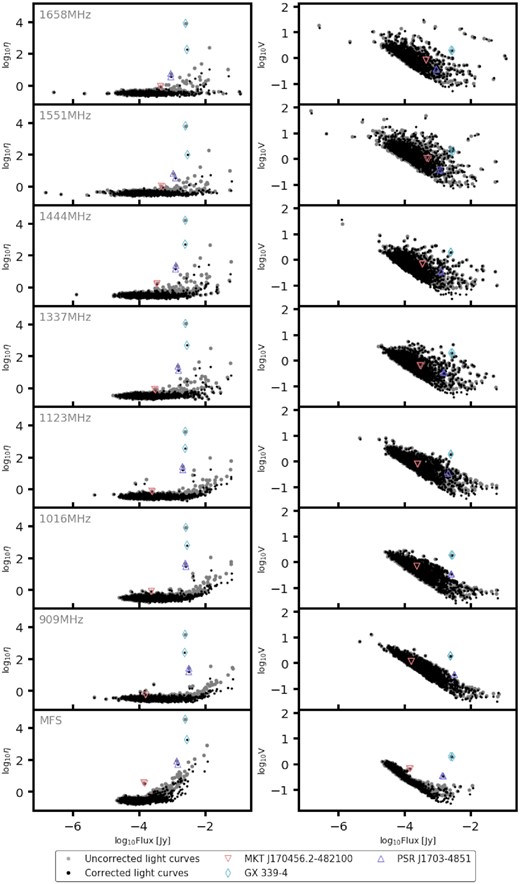
Variability parameters before and after applying the corrections. Resolved sources and artefacts have already been removed, as have sources with an S/N < 2.
A1 Resolved sources and artefacts
Our first attempt to mitigate the correlation problem was to vet all sources to check for artefacts and resolved sources. The GX 339−4 field does not have any large extended structures, the largest resolved structures are lobes of radio galaxies and a planetary nebula. The force_beam and beamwidths_limit parameters mean that obvious extended sources are not included by TraP. There are many double-lobed sources and small resolved sources and sources with structure that can appear point-like. It is important to remember that these are images with integration times of 10–15 min, which means that the synthesized beam is not round. Sometimes two sources that are close together on the sky can appear to be a single point source depending on the orientation of the beam. This means that flux is sometimes collected from mostly one source, or sometimes both sources. There are also clean artefacts around bright sources that are detected as point-like sources in some epochs. These artefacts vary from epoch to epoch and often appear and disappear completely, which means that they can look like very interesting variable sources.
Differentiating between resolved and unresolved sources in radio images is challenging. As we are investigating a single field, we chose a manual, visual method to remove the problem sources. To do this, we created a DS9 (Joye & Mandel 2003) region file including every source detected by TraP in every subband and the MFS images. We then looked at these sources in the deep MeerKAT stacked image of this field and determined by-eye which sources are resolved and which sources are artefacts. We then checked all the sources again using a single-epoch 1658 MHz image as sources are more likely to be resolved at the highest frequency due to the smaller synthesized beam. We then removed these sources and compared all the sources in the field to each other using the Pearson’s r coefficient. This method removes all but one of the light curves from Fig. A1, meaning that all but one of these sources is either a resolved source or an artefact, and reduces the amount of strong correlations within the GX 339−4 field.
A2 Direction dependence of the systematics
The next possible cause of the correlation that we tested was direction dependence, in particular distance from the phase centre (centred on GX 339−4). To do this, we select all the sources within an annulus. We then choose a source within that annulus, and calculate the r correlation coefficient between that source and all of the other sources within the annulus. We then remove that source, so that we do not compare to it again. We proceed to do this for every source. We perform the same calculations for annuli outwards from the phase centre. We choose the radii of each annulus such that the area of every annulus (and the corresponding circle located at the phase centre) is the same. We find that there is no clear direction dependence, no annulus where the correlation is particularly strong.
A3 Flux dependence of the systematics
Finally, we wanted to determine whether the systematics are flux density dependent. In other words: are brighter sources more affected by the systematics? To do this, we compared all the sources using the r correlation coefficient again and plotted the flux densities and correlation coefficient value range. We find that there may be some flux density dependence where bright sources are more affected by the systematics than fainter sources. This could be because the effect is multiplicative, or it could be because the uncertainties on bright sources are underestimated by TraP (Rowlinson, private communications).
A4 Modelling the light-curve systematics
We use the median and MAD model to model and correct for the systematics as the median is robust to outliers compared to the mean. The median model for each frequency band and the MFS images is shown in Fig. A2 (left-hand column). This plot also shows the difference between the models before and after removing the resolved sources and artefacts. This shows that removing these sources does not significantly change the shape of the models, indicating that the main contribution to the systematics is not these sources. To correct for the systematics, we divide each light curve by the model and combine the uncertainties.
A5 Systematic correction results
Examples of light curves before and after correction are shown in Fig. A3. We can see that these sources are consistent with constant sources, and that their variability parameters decrease after applying the corrections, particularly the ην parameter. In Fig. A4, we can see the variability parameters before and after correction. These values are for light curves with S/N > 2 in at least one epoch. The code for the investigation and correction of the systematics can be found on GitHub: https://doi.org/10.5281/zenodo.4456303. This repository also includes the code for accessing the light curves from TraP.
APPENDIX B: SUPPLEMENTARY MATERIAL
The mean flux density for each long-term variable source is shown in Table B1. The VizieR catalogues used for matching to the long-term variable sources are shown in Table B2.
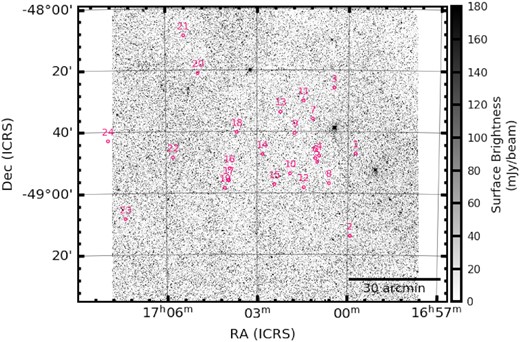
Deep MeerLICHT q-band image including the long-term variable sources.
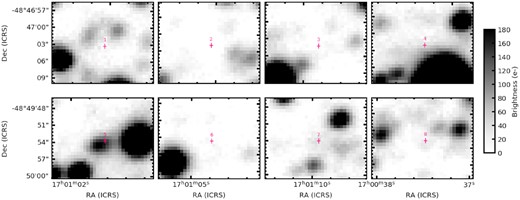
Deep MeerLICHT q-band postage stamps showing the locations of sources 1–8. The cross-hairs are 0.4 arcsec long to indicate the astrometric uncertainties on the MeerKAT positions. These sources are (1) MKT J165945.1−484703, (2) MKT J165955.1−491352, (3) MKT J170028.1−482543, (4) MKT J170057.2−484753, (5) MKT J170101.1−484953, (6) MKT J170104.7−484842, (7) MKT J170109.9−483550, and (8) MKT J170037.5−485646.
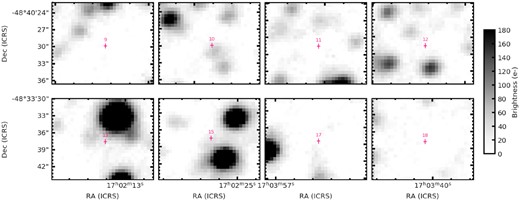
Deep MeerLICHT q-band postage stamps showing the locations of sources 9–16. The cross-hairs are 0.4 arcsec long to indicate the astrometric uncertainties on the MeerKAT positions. These sources are (9) MKT J170145.8−484029, (10) MKT J170154.7−485342, (11) MKT J170128.5−482955, (12) MKT J170127.4−485810, (13) MKT J170213.7−483337, (15) MKT J170225.5−485711, (17) MKT J170355.9−485556, and (18) MKT J170340.2−484010.
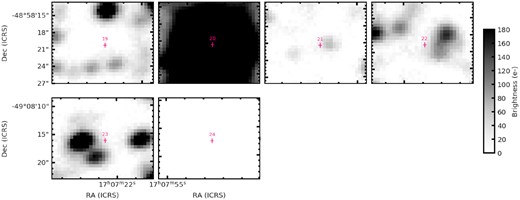
Deep MeerLICHT q-band postage stamps showing the locations of sources 17 to 24. The cross-hairs are 0|${_{.}^{\prime\prime}}$|4 long to indicate the astrometric uncertainties on the MeerKAT positions. These sources are: (19) MKT J170404.0−485820; (20) MKT J170456.2−482100; (21) MKT J170524.1−480842; (22) MKT J170546.3−484822; (23) MKT J170721.9−490816; and (24) MKT J170754.2−484252. As source 20 is MKT J170456.2−482100 the star is overexposed, leading to the large black blob we can see here.
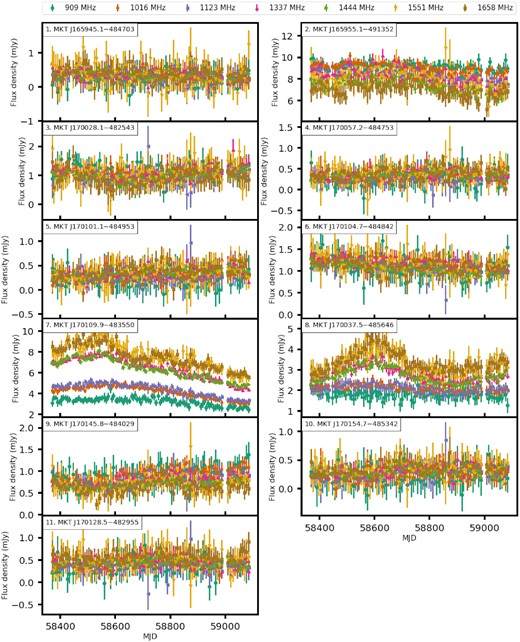
Subband light curves for sources: (1) MKT J165945.1−484703, (2) MKT J165955.1−491352, (3) MKT J170028.1−482543, (4) MKT J170057.2−484753, (5) MKT J170101.1−484953, (6) MKT J170104.7−484842, (7) MKT J170109.9−483550, (8) MKT J170037.5−485646, (9) MKT J170145.8−484029, (10) MKT J170154.7−485342, and (11) MKT J170128.5−482955. Note that the 1230 MHz band has been excluded due to radio frequency interference (RFI) and that the subband flux densities have been primary beam corrected.
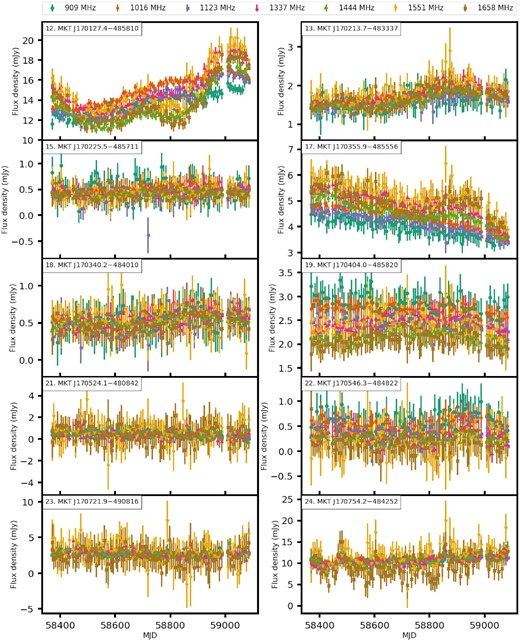
Subband light curves for sources: (12) MKT J170127.4−485810, (13) MKT J170213.7−483337, (15) MKT J170225.5−485711, (17) MKT J170355.9−485556, (18) MKT J170340.2−484010, (19) MKT J170404.0−485820, (21) MKT J170524.1−480842, (22) MKT J170546.3−484822, (23) MKT J170721.9−490816, and (24) MKT J170754.2−484252. Note that the 1230 MHz band has been excluded due to radio frequency interference (RFI) and that the subband flux densities have been primary beam corrected.
The MeerLICHT 5σ upper limits for the location of each source are shown in Table B3. One of the MeerLICHT products is a fits image map of the limiting magnitude across the whole MeerLICHT field. These limits were measured at the position of each source in the limit maps per band. The MeerLICHT q-band deep image with the locations of the variable sources (numbers correspond to those in Table 3) are shown in Fig. B1. Postage stamps of the positions of each long-term variable source in the MeerLICHT deep q-band are shown in Figs B2–B4.
Figs B5 and B6 show the subband light curves for the 21 new long-term variables sources.
Summary of the positions and mean flux densities of the long-term variable sources in the GX 339−4 field. The RA and Dec. are in degrees and have been corrected for the absolute astrometry (see Section 2.5), both the RA and Dec. have uncertainties of 0.4 arcsec.
| Mean flux density (mJy) in subband (MHz) | ||||||||||
|---|---|---|---|---|---|---|---|---|---|---|
| Name | RA (°) | Dec. (°) | 1658 | 1551 | 1444 | 1337 | 1123 | 1016 | 909 | |
| 1 | MKT J165945.1−484703 | 254.93796 | −48.78424 | 0.37 ± 0.03 | 0.35 ± 0.04 | 0.34 ± 0.02 | 0.37 ± 0.02 | 0.30 ± 0.02 | 0.35 ± 0.02 | 0.29 ± 0.03 |
| 2 | MKT J165955.1−491352 | 254.97960 | −49.23137 | 7.13 ± 0.08 | 7.9 ± 0.1 | 7.33 ± 0.04 | 8.27 ± 0.04 | 8.34 ± 0.04 | 9.09 ± 0.03 | 9.13 ± 0.05 |
| 3 | MKT J170028.1−482543 | 255.11701 | −48.42868 | 0.93 ± 0.04 | 1.03 ± 0.04 | 0.98 ± 0.02 | 1.07 ± 0.02 | 1.00 ± 0.02 | 1.11 ± 0.02 | 1.10 ± 0.03 |
| 4 | MKT J170057.2−484753 | 255.23823 | −48.79807 | 0.37 ± 0.02 | 0.37 ± 0.02 | 0.36 ± 0.01 | 0.37 ± 0.01 | 0.29 ± 0.02 | 0.30 ± 0.02 | 0.26 ± 0.02 |
| 5 | MKT J170101.1−484953 | 255.25445 | −48.83158 | 0.36 ± 0.02 | 0.35 ± 0.02 | 0.33 ± 0.01 | 0.34 ± 0.01 | 0.28 ± 0.02 | 0.28 ± 0.02 | 0.25 ± 0.02 |
| 6 | MKT J170104.7−484842 | 255.26939 | −48.81184 | 1.12 ± 0.02 | 1.17 ± 0.03 | 1.06 ± 0.01 | 1.18 ± 0.01 | 1.11 ± 0.02 | 1.19 ± 0.02 | 1.13 ± 0.03 |
| 7 | MKT J170109.9−483550 | 255.29126 | −48.59750 | 7.33 ± 0.04 | 7.27 ± 0.05 | 6.20 ± 0.02 | 6.26 ± 0.02 | 4.33 ± 0.02 | 4.14 ± 0.02 | 3.19 ± 0.03 |
| 8 | MKT J170037.5−485646 | 255.15615 | −48.94632 | 3.33 ± 0.03 | 3.25 ± 0.04 | 2.70 ± 0.02 | 2.79 ± 0.02 | 2.12 ± 0.02 | 2.11 ± 0.02 | 1.81 ± 0.03 |
| 9 | MKT J170145.8−484029 | 255.44078 | −48.67495 | 0.66 ± 0.02 | 0.72 ± 0.02 | 0.70 ± 0.01 | 0.79 ± 0.01 | 0.79 ± 0.02 | 0.92 ± 0.01 | 0.90 ± 0.02 |
| 10 | MKT J170154.7−485342 | 255.47793 | −48.89498 | 0.32 ± 0.01 | 0.33 ± 0.02 | 0.297 ± 0.009 | 0.31 ± 0.01 | 0.27 ± 0.01 | 0.26 ± 0.01 | 0.23 ± 0.02 |
| 11 | MKT J170128.5−482955 | 255.36859 | −48.49876 | 0.53 ± 0.02 | 0.49 ± 0.03 | 0.44 ± 0.01 | 0.46 ± 0.01 | 0.38 ± 0.02 | 0.43 ± 0.02 | 0.38 ± 0.03 |
| 12 | MKT J170127.4−485810 | 255.36419 | −48.96960 | 13.78 ± 0.06 | 14.87 ± 0.08 | 13.29 ± 0.03 | 15.01 ± 0.04 | 14.00 ± 0.04 | 14.87 ± 0.03 | 13.62 ± 0.05 |
| 13 | MKT J170213.7−483337 | 255.55712 | −48.56044 | 1.66 ± 0.02 | 1.78 ± 0.03 | 1.59 ± 0.01 | 1.72 ± 0.01 | 1.59 ± 0.02 | 1.69 ± 0.02 | 1.61 ± 0.03 |
| 14 | GX 339−4 | 255.70547 | −48.78973 | 1.37 ± 0.02 | 1.42 ± 0.02 | 1.51 ± 0.01 | 1.69 ± 0.01 | 1.89 ± 0.02 | 2.28 ± 0.02 | 2.28 ± 0.03 |
| 15 | MKT J170225.5−485711 | 255.60623 | −48.95290 | 0.42 ± 0.02 | 0.44 ± 0.02 | 0.419 ± 0.009 | 0.47 ± 0.01 | 0.43 ± 0.01 | 0.49 ± 0.01 | 0.48 ± 0.02 |
| 16 | PSR J1703−4851 | 255.97719 | −48.86696 | 0.91 ± 0.02 | 1.14 ± 0.02 | 1.19 ± 0.01 | 1.52 ± 0.01 | 2.09 ± 0.02 | 2.56 ± 0.02 | 3.09 ± 0.03 |
| 17 | MKT J170355.9−485556 | 255.98298 | −48.93234 | 4.86 ± 0.03 | 5.02 ± 0.04 | 4.50 ± 0.02 | 4.81 ± 0.02 | 4.11 ± 0.02 | 4.34 ± 0.02 | 3.98 ± 0.03 |
| 18 | MKT J170340.2−484010 | 255.91730 | −48.66967 | 0.48 ± 0.02 | 0.55 ± 0.02 | 0.500 ± 0.009 | 0.53 ± 0.01 | 0.52 ± 0.01 | 0.57 ± 0.01 | 0.54 ± 0.02 |
| 19 | MKT J170404.0−485820 | 256.01674 | −48.97230 | 2.09 ± 0.02 | 2.36 ± 0.03 | 2.14 ± 0.01 | 2.43 ± 0.02 | 2.42 ± 0.02 | 2.72 ± 0.02 | 2.80 ± 0.03 |
| 20 | MKT J170456.2−482100 | 256.23435 | −48.35021 | 0.40 ± 0.04 | 0.42 ± 0.04 | 0.36 ± 0.02 | 0.33 ± 0.02 | 0.25 ± 0.02 | 0.25 ± 0.02 | 0.19 ± 0.03 |
| 21 | MKT J170524.1−480842 | 256.35003 | −48.14511 | 0.5 ± 0.1 | 0.6 ± 0.1 | 0.47 ± 0.05 | 0.47 ± 0.05 | 0.43 ± 0.04 | 0.48 ± 0.03 | 0.45 ± 0.04 |
| 22 | MKT J170546.3−484822 | 256.44297 | −48.80631 | 0.20 ± 0.03 | 0.20 ± 0.03 | 0.26 ± 0.02 | 0.32 ± 0.02 | 0.40 ± 0.02 | 0.52 ± 0.02 | 0.55 ± 0.03 |
| 23 | MKT J170721.9−490816 | 256.84123 | −49.13783 | 2.3 ± 0.2 | 2.9 ± 0.2 | 2.75 ± 0.07 | 2.82 ± 0.07 | 2.78 ± 0.05 | 2.87 ± 0.04 | 2.71 ± 0.05 |
| 24 | MKT J170754.2−484252 | 256.97587 | −48.71454 | 9.3 ± 0.2 | 11.4 ± 0.2 | 10.52 ± 0.09 | 10.65 ± 0.09 | 10.49 ± 0.06 | 11.17 ± 0.05 | 11.03 ± 0.06 |
VizieR catalogues used for matching sources by position. The number of sources is the total number of sources in the catalogue within a degree of the phase centre of the MeerKAT observations (centred on GX 339−4). The search radius is the maximum matching radius we used for that catalogue, a matching radius of 0.4 arcsec indicates that the MeerKAT astrometry is the limiting factor.
| Catalogue name | Number of sources | Search radius (arcsec) | Reference |
|---|---|---|---|
| Gaia EDR3 | 1721 225 | 0.40 | Gaia Collaboration (2021) |
| Gaia EDR3 × Tycho | 398 | 0.40 | Gaia Collaboration (2021) |
| 2MASS | 313 565 | 0.40 | Cutri et al. (2003) |
| WISE | 99448 | 0.50 | Cutri et al. (2012) |
| AllWISE | 98 848 | 0.50 | Cutri et al. (2013) |
| SkyMapper | 269 806 | 0.40 | Wolf et al. (2018) |
| unWISE | 383 183 | 0.40 | Schlafly, Meisner & Green (2019) |
| DENIS | 341 161 | 0.50 | http://cds.u-strasbg.fr/denis.html |
| 2FGL × radio | 1 | 0.40 | Schinzel et al. (2015) |
| YSO candidates | 489 | 0.50 | Marton et al. (2016) |
| Solar-type dwarfs | 3591 | 0.40 | Nascimbeni et al. (2016) |
| ASAS-SN variable stars | 295 | 1.00 | Jayasinghe et al. (2018) |
| XMM-OM serendipitous 2019 | 46 191 | 0.70 | Page et al. (2012) |
| GLADE | 1 | 0.50 | Dálya et al. (2018) |
| 2MASX ZOA galaxy cat | 3 | 1.50 | Schröder, van Driel & Kraan-Korteweg (2019) |
| MORX | 143 | 1.00 | Flesch (2016) |
| Chandra | 72 | 1.40 | Evans et al. (2010) |
| Chandra CSC | 114 | 1.40 | Evans et al. (2010) |
| Swift 2SXPS | 77 | 5.60 | Evans et al. (2020) |
| ASAS variable stars | 14 | 5.00 | Pojmanski (2002) |
| VISTA | 305 142 | 0.40 | McMahon et al. (2013) |
| MGPS-2 | 75 | 2.00 | Murphy et al. (2007) |
| Tycho | 548 | 0.40 | Egret et al. (1992) |
| SwiftUVOT serendipitous | 202 777 | 0.50 | Yershov (2014) |
| 4XMM serendipitous | 4272 | 1.29 | Traulsen et al. (2020) |
MeerLICHT upper limits for the long-term variable sources in each band. These are the 5σ upper limits measured at the position of each source. The first value in each column is the measured upper limit, and the second value is the extinction-corrected upper limit. The extinction values were determined using the NASA/IPAC Extragalactic Database Coordinate Transformation and Galactic Extinction Calculator.a For the q-band extinction we assumed the average extinction of the g and r bands.
| Name | u | g | r | i | z | q | |
|---|---|---|---|---|---|---|---|
| 1 | MKT J165945.1−484703 | 21.07/17.19 | 21.58/18.56 | 21.24/19.15 | 21.10/19.57 | 19.72/18.56 | 22.37/19.82 |
| 2 | MKT J165955.1−491352 | 21.19/17.31 | 21.74/18.72 | 21.44/19.35 | 21.46/19.93 | 19.87/18.71 | 22.76/20.21 |
| 3 | MKT J170028.1−482543 | 21.23/17.35 | 21.60/18.58 | 21.24/19.15 | 21.44/19.91 | 19.74/18.58 | 22.62/20.07 |
| 4 | MKT J170057.2−484753 | 20.82/16.94 | 21.43/18.41 | 21.07/18.98 | 20.84/19.31 | 19.53/18.37 | 22.02/19.47 |
| 5 | MKT J170101.1−484953 | 21.16/17.28 | 21.17/18.15 | 20.51/18.42 | 19.94/18.41 | 19.03/17.87 | 21.29/18.74 |
| 6 | MKT J170104.7−484842 | 21.09/17.21 | 21.64/18.62 | 21.36/19.27 | 21.29/19.76 | 19.79/18.63 | 22.58/20.03 |
| 7 | MKT J170109.9−483550 | 20.82/16.94 | 21.51/18.49 | 21.13/19.04 | 20.52/18.99 | 19.45/18.29 | 22.06/19.51 |
| 8 | MKT J170037.5−485646 | 21.37/17.49 | 21.84/18.82 | 21.38/19.29 | 21.03/19.50 | 19.93/18.77 | 22.35/19.80 |
| 9 | MKT J170145.8−484029 | 20.94/17.06 | 21.62/18.60 | 21.34/19.25 | 21.40/19.87 | 19.74/18.58 | 22.68/20.13 |
| 10 | MKT J170154.7−485342 | 21.07/17.19 | 21.72/18.70 | 21.09/19.00 | 20.75/19.22 | 19.58/18.42 | 22.16/19.61 |
| 11 | MKT J170128.5−482955 | 20.85/16.97 | 21.64/18.62 | 21.34/19.25 | 21.38/19.85 | 19.79/18.63 | 22.66/20.11 |
| 12 | MKT J170127.4−485810 | 21.37/17.49 | 21.86/18.84 | 21.50/19.41 | 21.55/20.02 | 19.85/18.69 | 22.78/20.23 |
| 13 | MKT J170213.7−483337 | 20.89/17.01 | 21.47/18.45 | 21.17/19.08 | 21.27/19.74 | 19.74/18.58 | 22.24/19.69 |
| 14 | GX 339−4 | 20.26/16.38 | 20.74/17.72 | 20.18/18.09 | 19.44/17.91 | 18.78/17.62 | 20.88/18.33 |
| 15 | MKT J170225.5−485711 | 21.39/17.51 | 21.62/18.60 | 21.13/19.04 | 20.75/19.22 | 19.72/18.56 | 22.20/19.65 |
| 16 | PSR J1703−4851 | 21.16/17.28 | 21.70/18.68 | 21.32/19.23 | 21.46/19.93 | 19.85/18.69 | 22.60/20.05 |
| 17 | MKT J170355.9−485556 | 21.05/17.17 | 21.56/18.54 | 21.30/19.21 | 21.42/19.89 | 19.85/18.69 | 22.58/20.03 |
| 18 | MKT J170340.2−484010 | 20.80/16.92 | 21.74/18.72 | 21.38/19.29 | 21.46/19.93 | 19.75/18.59 | 22.74/20.19 |
| 19 | MKT J170404.0−485820 | 21.09/17.21 | 21.62/18.60 | 21.38/19.29 | 21.44/19.91 | 19.83/18.67 | 22.58/20.03 |
| 20 | MKT J170456.2−482100 | 17.29/13.41 | 17.26/14.24 | 17.13/15.04 | 16.43/14.90 | 15.53/14.37 | 18.33/15.78 |
| 21 | MKT J170524.1−480842 | 20.87/16.99 | 21.62/18.60 | 21.11/19.02 | 20.97/19.44 | 19.58/18.42 | 22.31/19.76 |
| 22 | MKT J170546.3−484822 | 21.05/17.17 | 21.47/18.45 | 21.13/19.04 | 20.88/19.35 | 19.66/18.50 | 22.14/19.59 |
| 23 | MKT J170721.9−490816 | 21.05/17.17 | 21.37/18.35 | 21.17/19.08 | 21.08/19.55 | 19.53/18.37 | 22.12/19.57 |
| 24 | MKT J170754.2−484252 | 18.90/15.02 | 19.52/16.50 | 19.42/17.33 | 19.08/17.55 | 18.28/17.12 | 20.73/18.18 |
