


ABSTRACT
HESS J1804−216 is one of the brightest yet most mysterious TeV γ-ray sources discovered to date. Previous arc-minute scale studies of the interstellar medium (ISM) surrounding this TeV γ-ray source revealed HESS J1804−216 is likely powered by a mature supernova remnant (SNR) or pulsar, hence its origin remains uncertain. In this paper, we focus on the diffusive escape of cosmic ray protons from potential SNR accelerators. These cosmic rays interact with the ISM to produce TeV γ-rays. We utilize the isotropic diffusion equation solution for particles escaping from a shell, to model the energy-dependent escape and propagation of protons into the ISM. This work is the first attempt at modelling the spatial morphology of γ-rays towards HESS J1804−216, using arc-minute ISM observations from both Mopra and the Southern Galactic Plane Survey. The spectral and spatial distributions of γ-rays for the two nearby potential SNR counterparts, SNR G8.7−0.1 and the progenitor SNR of PSR J1803−2137, are presented here. We vary the diffusion parameters and particle spectrum and use a grid search approach to find the best combination of model parameters. We conclude that moderately slow diffusion is required for both candidates. The most promising candidate to be powering the TeV γ-rays from HESS J1804−216 in a hadronic scenario is the progenitor SNR of PSR J1803−2137.
1 INTRODUCTION
The High Energy Stereoscopic System (H.E.S.S.) has a sensitivity to γ-rays of energy 100 GeV to tens of TeV. H.E.S.S. has identified numerous γ-ray sources in the Milky Way (or ‘Galactic sources’), however, the exact nature of over 30 per cent of these sources remains unknown (H.E.S.S. Collaboration 2018a). These sources are also possibly the sites of cosmic ray (CR) accelerators, the population of these sources are dominated by objects within their final stages of stellar evolution.
HESS J1804−216 is one of the brightest unidentified TeV γ-ray sources detected, with a soft spectral index of Γ = 2.69. The GeV γ-ray source, 3FHL J1804.7−2144e, was detected at the same location as the TeV γ-ray source HESS J1804−216 (see Fig. 1).
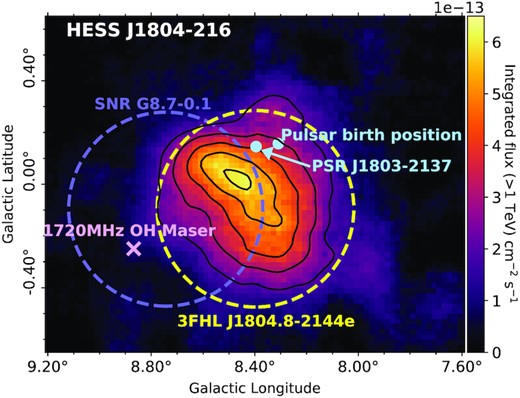
Integrated flux map (cm−2 s−1) above 1 TeV adapted from H.E.S.S. Collaboration (2018a). The dashed purple circle indicates SNR G8.7−0.1, the purple cross indicates the 1720 MHz OH maser and the progenitor SNR of PSR J1803−2137 is indicated by the blue dot. The TeV γ-ray emission from H.E.S.S. Collaboration (2018a) is shown by the solid black contours (2 × 10⁻¹³ to 6 × 10⁻¹³ cm−2 s−1 levels).
In a previous paper (Feijen et al. 2020), we studied the interstellar medium (ISM) towards HESS J1804−216 in detail at arc-min scales, to help determine the nature of the γ-ray emission. We investigated multiple plausible CR accelerators and concluded that a mature supernova remnant (SNR G8.7−0.1 or the progenitor SNR of PSR J1803−2137) or a pulsar (PSR J1803−2137) are viable accelerators of CRs to produce the TeV γ-ray emission in the hadronic and leptonic scenarios, respectively. The hadronic production of γ-rays involves accelerated CR protons interacting with the ISM to produce γ-rays through neutral pion decay (Ackermann et al. 2013). The leptonic scenario primarily involves TeV emission being produced by inverse-Compton upscattering by highly energetic electrons. The TeV emission from HESS J1804−216 could be produced by high-energy electrons from a pulsar wind nebulae (PWNe) powered by PSR J1803−2137 (H.E.S.S. Collaboration 2018b), as supported by the high spin-down luminosity. The modelled energy spectra of CR protons towards both SNR G8.7−0.1 and the progenitor SNR of PSR J1803−2137 matched with GeV and TeV observations, making it plausible for either SNR to generate the GeV and TeV γ-ray emission from HESS J1804−216.
SNRs are a typical candidate in accelerating CR protons at their shock front (Blandford & Ostriker 1980). The hadronic production of γ-rays is investigated in this paper, assuming either SNR G8.7−0.1 or the progenitor SNR of PSR J1803−2137 (shown in Fig. 1) are the plausible CR accelerators. A 1720 MHz OH maser is present at the southern edge of SNR G8.7−0.1 at 36 km s −1 indicating the SNR (at a velocity of 35 km s−1) is interacting with the ISM (Hewitt & Yusef-Zadeh 2009).
Models of the γ-ray emission from escaping CRs have previously been presented for different γ-ray sources, such as Casanova et al. (2010) for SNR RX J1713.7−3946 and Mitchell et al. (2021) for multiple SNRs. Casanova et al. (2010) model accelerated CRs escaping SNR RX J1713.7−3946 in the hadronic and leptonic scenarios. Morphology maps of the γ-ray energy flux at 1 TeV were obtained using the distribution of the ambient gas for different diffusion conditions. Casanova et al. (2010) model the γ-ray morphology by utilizing the LAB survey of HI and the Nanten survey of CO, which provides a detailed look into the distribution of γ-ray emission.
This work expands on our previous paper by predicting the morphology arising from the diffusive energy-dependent escape of CR protons and interaction with the surrounding ISM in the hadronic scenario. We make use of the spherically symmetric case for the isotropic transport equation from Aharonian & Atoyan (1996), assuming CR protons are accelerated by a single source and the energy-dependent diffusion coefficient is constant with position. The γ-ray emission is modelled across all pixels of the gas column density map from the Mopra 12CO(1-0) survey and the Southern Galactic Plane Survey (SGPS) of HI for a wide range of parameters, to find the best combination of model parameters to match the observations. We present a first look at the 2D spatial morphology of γ-rays towards HESS J1804−216. This provides an important framework for understanding the region surrounding γ-ray sources, in particular the diffusive transport of particles from SNRs into the ISM.
2 DATA
The distribution of atomic hydrogen (HI) from the SGPS1 (McClure-Griffiths et al. 2005) and molecular hydrogen, specifically 12CO(1-0), from the Mopra radio telescope2 are utilized. The Australia Telescope National Facility (ATNF) analysis software, livedata, gridzilla, and miriad in addition to custom idl routines were used to process the data from Mopra (Burton et al. 2013; Braiding et al. 2018). Integrated emission maps were generated from the FITS cubes.
In this work, we use maps of total column density as these provide the distribution of the total target material towards HESS J1804−216. The total hydrogen column density, NH, is the sum of NHI and 2|$N_{\rm {H_2}}$|, from SGPS HI observations and Mopra 12CO (regridded to the SGPS HI pixel size of ∼40 arcsec).
The two plausible counterparts of interest are SNR G8.7−0.1 and the progenitor SNR of PSR J1803−2137 which are at distances of 4.5 kpc (Hewitt & Yusef-Zadeh 2009) and 3.8 kpc (Brisken et al. 2006), respectively. SNR G8.7−0.1 has an age of 15–28 kyr (Finley & Oegelman 1994) and the progenitor SNR of PSR J1803−2137 has an age of 16 kyr (Brisken et al. 2006), assumed to be the same age as the pulsar it is attached to.
An 1720 MHz OH maser is indicative of interaction between SNRs and ISM clouds (Hewitt & Yusef-Zadeh 2009). Given the OH maser velocity of 36 km s−1, we expect SNR G8.7−0.1 to be at a similar velocity. With use of the Galactic Rotation Curve (GRC, Brand & Blitz 1993) and the distance to each SNR, the progenitor SNR of PSR J1803−2137 and SNR G8.7−0.1 are placed at a velocity of ∼25 km s−1and ∼35 km s−1, respectively.
The velocity components are determined by taking the velocity of each counterpart as the mid point of our range. If the velocity ranges chosen are too large, additional gas emission which is likely not connected to the source will be included. Due to local motions in the gas and the uncertainty of the GRC model, we estimate that the velocity bands should span 10 km s−1. The position-velocity plots in Figs A1 and A2 show that our defined velocity regions are reasonable as they do not include too much of the gas located in the Galactic arms. Currently, the SGPS HI data (Fig. A2) does not reveal any HI voids making it hard to narrow down these velocity ranges further. Future HI surveys, such as the GASKAP HI survey (Dickey et al. 2013), will have a higher resolution and be more sensitive to voids and bubbles in the HI gas. Fig. 2 shows the total column density maps derived from SGPS HI and Mopra CO for components 1 (vlsr = 20 to 30 km s−1) and 2 (vlsr = 30 to 40 km s−1).
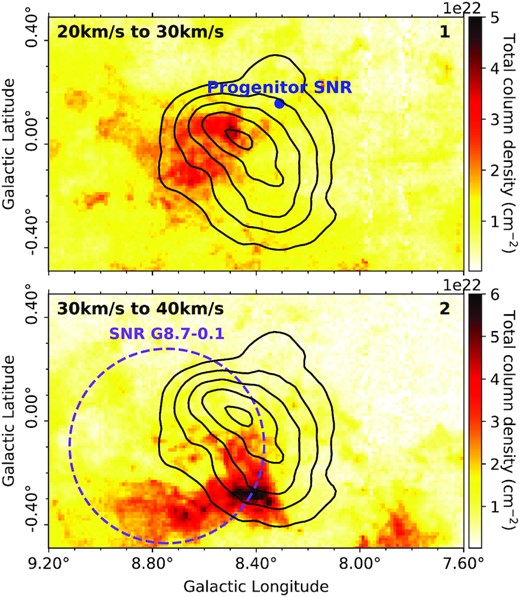
Total column density maps, |$N_{\rm {HI}}+2N_{\rm {H_2}}$|, (|$\rm {cm}^{-2}$|) towards HESS J1804−216, for gas components 1 and 2. The progenitor SNR of PSR J1803−2137 is indicated by the blue dot and the dashed purple circle indicates SNR G8.7−0.1. The TeV γ-ray emission from H.E.S.S Collaboration et al. (2018a) is shown by the solid black contours (2×10⁻¹³ to 6×10⁻¹³ cm−2 s−1 levels).

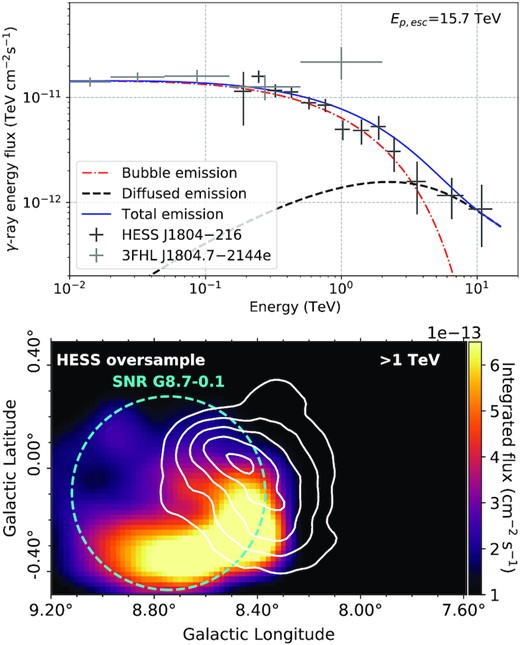
Best matching spectral and spatial model (G4a) for SNR G8.7−0.1 with an age of 15 kyr. Top: γ-ray spectral model shown in blue. The diffused and bubble spectra are shown by the dashed black curve and dot-dashed red curve, respectively, with HESS J1804−216 observations in dark grey and 3FHL J1804.7−2144e observations in light grey. Bottom: γ-ray flux map above 1 TeV towards HESS J1804−216. The escape radius, Resc, is shown by cyan dashed circle. The TeV γ-ray emission from H.E.S.S. Collaboration (2018a) shown by the solid white contours (2 × 10⁻¹³ to 6 × 10⁻¹³ cm−2 s−1 levels). The lower limit of the colorbar is set to 10−13 cm−2 s−1 to exclude any emission below the sensitivity of H.E.S.S.. Model parameters: α = 2.0, χ = 0.01, δ = 0.6, δp = 2.5, Ep, max = 1 PeV, type II SN, Ep, esc = 15.8 TeV. For the spectral model χ2/m = 1.1.
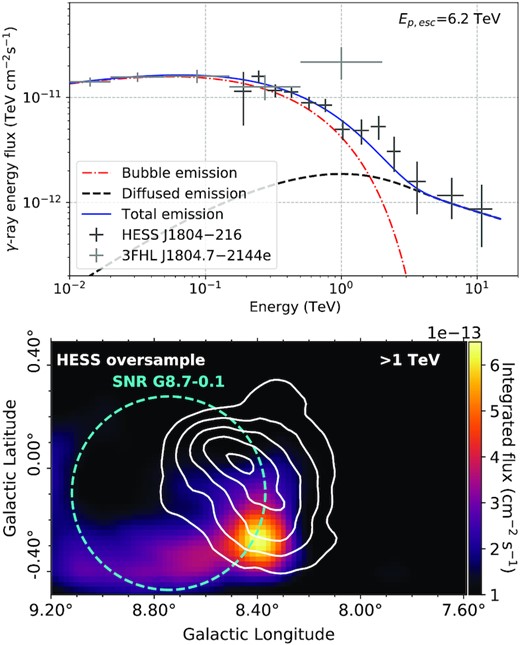
Best matching spectral and spatial model (G2b) for SNR G8.7−0.1 with an age of 28 kyr. Top: γ-ray spectral model shown in blue. The diffused and bubble spectra are shown by the dashed black curve and dot-dashed red curve, respectively, with HESS J1804−216 observations in dark grey and 3FHL J1804.7−2144e observations in light grey. Bottom: γ-ray flux map above 1 TeV towards HESS J1804−216. The escape radius, Resc, is shown by cyan dashed circle. The TeV γ-ray emission from H.E.S.S. Collaboration (2018a) shown by the solid white contours (2×10⁻¹³ to 6×10⁻¹³ cm−2 s−1 levels). Model parameters: α = 1.8, χ = 0.1, δ = 0.4, δp = 1.4, Ep,max = 5 PeV, type Ia SN, Ep,esc = 6.2 TeV. For the spectral model χ2/m = 0.8.
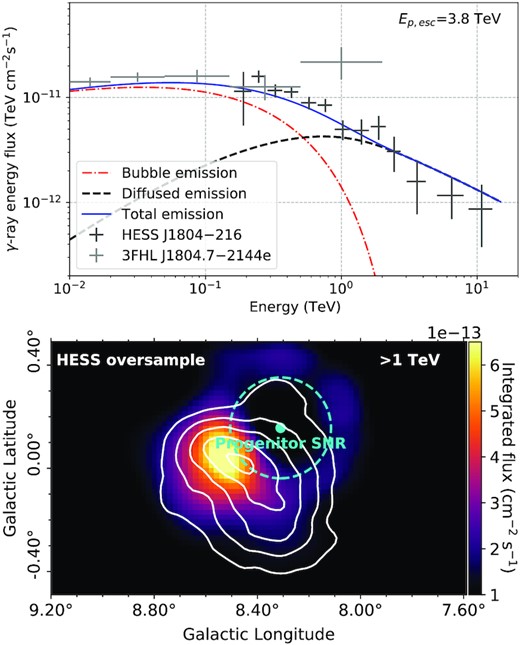
Best matching spectral and spatial model (P1) for the progenitor SNR of PSR J1803−2137. Top: γ-ray spectral model shown in blue. The diffused and bubble spectra are shown by the dashed black curve and dot-dashed red curve, respectively, with HESS J1804−216 observations in dark grey and 3FHL J1804.7−2144e observations in light grey. Bottom: γ-ray flux map above 1 TeV towards HESS J1804−216. The progenitor SNR of PSR J1803−2137 is indicated by the cyan dot and the escape radius, Resc, is shown by cyan dashed circle. The TeV γ-ray emission from H.E.S.S. Collaboration (2018a) shown by the solid white contours (2×10⁻¹³ to 6×10⁻¹³ cm−2 s−1 levels). Model parameters: α = 1.8, χ = 0.01, δ = 0.6, δp = 2.5, Ep, max = 5 PeV, type II SN, Ep,esc = 3.8 TeV. For the spectral model χ2/m = 0.9.
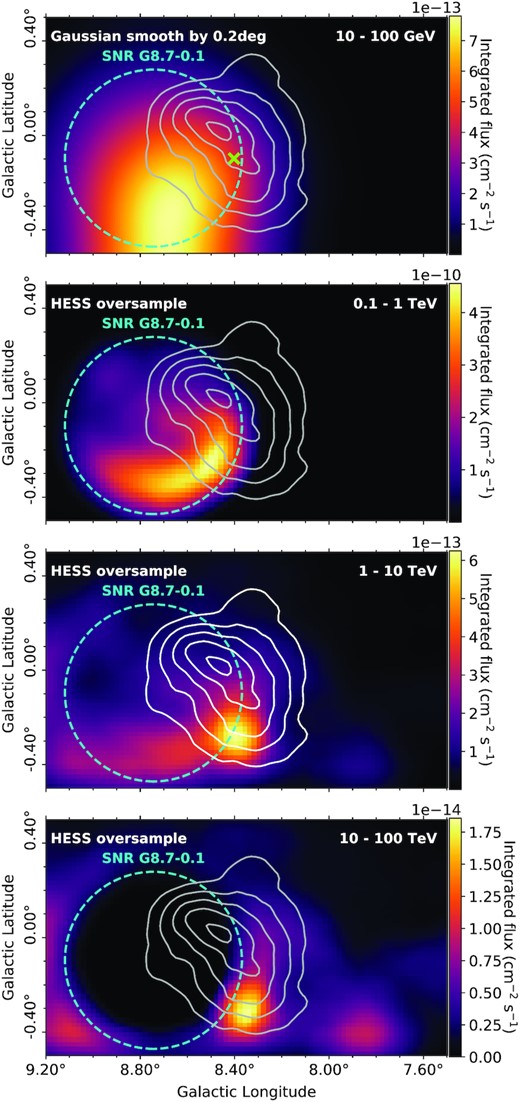
γ-ray flux maps for various energy bands towards HESS J1804−216 for the best matching model (G4a) for SNR G8.7−0.1 with an age of 15 kyr. The escape radius, Resc, is shown by cyan dashed circle. The green cross indicates the centroid of 3FHL J1804.7−2144e. The first energy band (Eγ = 10 – 100 GeV) corresponds to energies detected by Fermi-LAT so is smoothed using the Fermi-LAT PSF of ∼0.2° above 10 GeV (Ackermann et al. 2017). The other energy bands are oversampled using the H.E.S.S. method described in Section 2. The TeV γ-ray emission above 1 TeV from H.E.S.S. Collaboration (2018a) is shown by the solid white contours in the third panel (2×10⁻¹³ to 6×10⁻¹³ cm−2 s−1 levels) and by grey contours in the other panels as a reference for where the γ-ray emission is expected. Model parameters as described in Fig. 4.
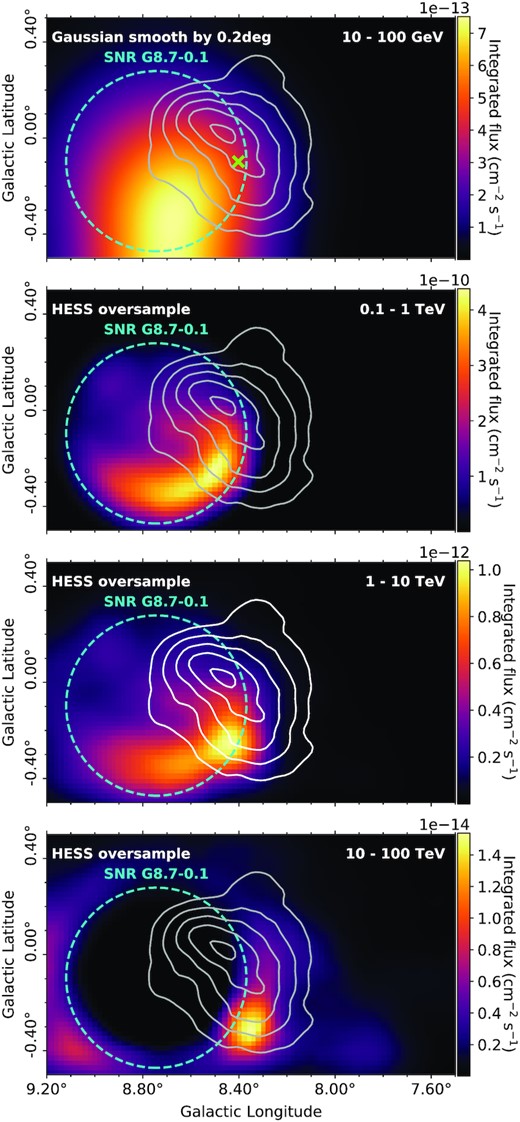
γ-ray flux maps for various energy bands towards HESS J1804−216 for the best matching model (G2b) for SNR G8.7−0.1 with an age of 28 kyr. The escape radius, Resc, is shown by cyan dashed circle. The green cross indicates the centroid of 3FHL J1804.7−2144e. The solid white/grey contours are as described in Fig. 7. Model parameters as described in Fig. 5.
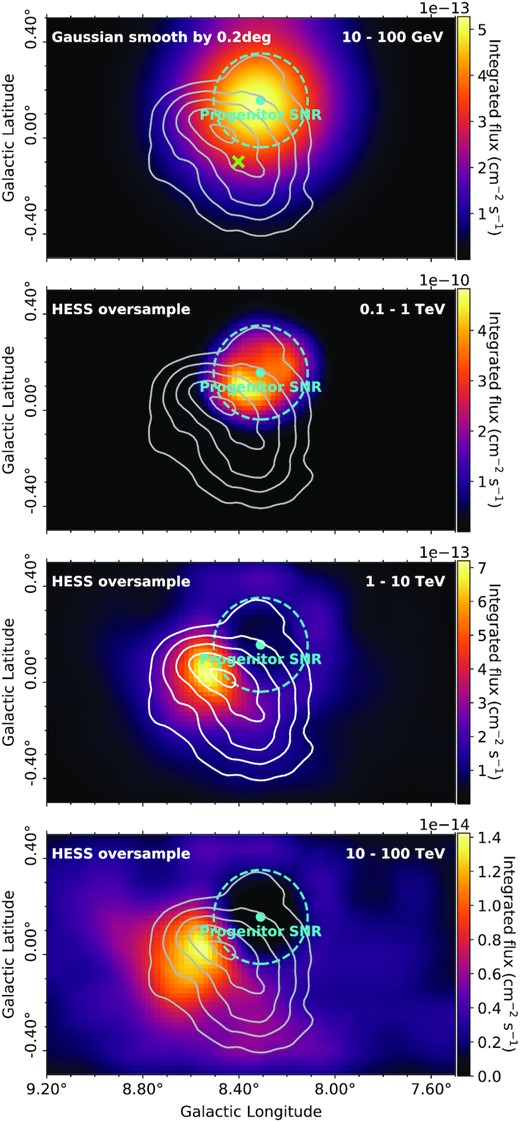
γ-ray flux maps for various energy bands towards HESS J1804−216 for the best matching model (P1) for the progenitor SNR of PSR J1803−2137. The escape radius, Resc, is shown by cyan dashed circle. The green cross indicates the centroid of 3FHL J1804.7−2144e. The solid white/grey contours are as described in Fig. 7. Model parameters as described in Fig. 6.
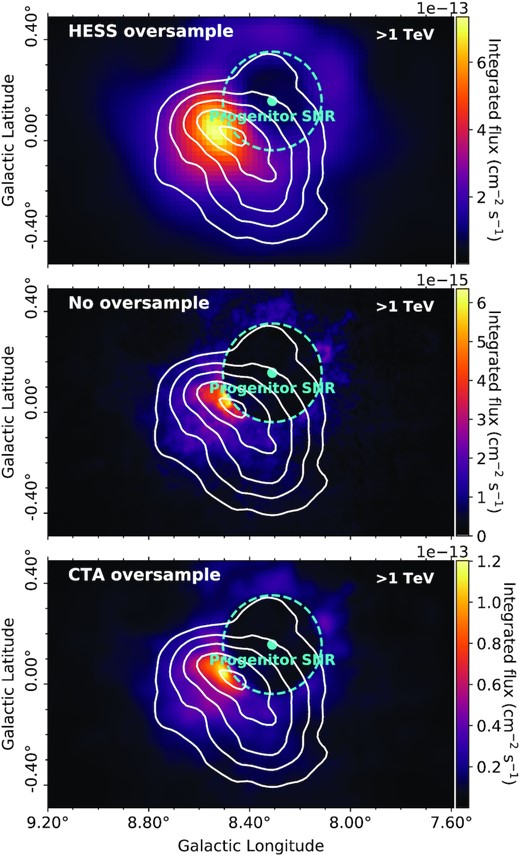
γ-ray flux maps above 1 TeV towards HESS J1804−216 with the progenitor SNR of PSR J1803−2137 as the accelerator (for the top model, P1). The TeV γ-ray emission from H.E.S.S. Collaboration (2018a) shown by the solid white contours (2×10⁻¹³ to 6×10⁻¹³ cm−2 s−1 levels). Top: map oversampled with H.E.S.S. factor of radius=0.1° with grid size of 0.02°. Middle: map not oversampled, with same resolution as gas map. Bottom: map oversampled with CTA factor of radius=0.03° with grid size of 0.01°.
The TeV γ-ray data used throughout this paper are from H.E.S.S.. Fig. 1 shows the γ-ray flux map above 1 TeV of HESS J1804−216 from the H.E.S.S Galactic Plane Survey (HGPS, H.E.S.S Collaboration 2018a). The HGPS γ-ray flux maps are available as oversampled maps which are obtained by dividing the survey region into a grid of 0.02°, then summing all values within a circular radius of 0.1° for each grid point.
The spectral γ-ray data from Aharonian et al. (2006) is utilized, as this paper focused on the TeV γ-ray sources in the inner part of the Galactic plane, including HESS J1804−216, providing a detailed look at the spectra and morphology of the TeV γ-ray observations. The Aharonian et al. (2006) and H.E.S.S Collaboration (2018a) data show good spectral matches as shown in Fig. C1. The Aharonian et al. (2006) data provides more spectral data points which will allow the spectral shape of our model to be compared with observations. The HESS J1804−216 spectral γ-ray observations from Aharonian et al. (2006) were extracted from a circular region of ∼0.36° radius centred on HESS J1804−216 (l = 8.4°, b = −0.03°). We also make use of the spectral γ-ray data of 3FHL J1804.7−2144e from Ajello et al. (2017), extracted from a disk region of 0.38° (centred on l = 8.4°, b = −0.09°).
3 MODELLING
SNRs can be described as impulsive accelerators, in which CRs are accelerated by the SNR shock front, and escape into the ISM. We model the energy-dependent escape and subsequent diffusive transport of these particles using the solution to the isotropic diffusive transport equation (Aharonian & Atoyan 1996). The injection of CRs is assumed to follow a power law, |$E_{\rm {p}}^{-\alpha }$|, with a spectral index of α. Protons of different energies escape the accelerator at different times, where the higher energy protons leave the shock earlier than lower energy protons. Particles then diffuse through the ISM and interact to produce γ-rays. Where relevant, we assume either a type Ia or type II supernova explosion occurs with a total kinetic energy of ESN, and an energy budget in CRs of Wp = ηESN, where η ≤ 0.5 (Berezhko & Völk 1997, 2000; Ackermann et al. 2013).
3.1 Proton flux
We assume the energy budget in CRs is the total energy of particles with energies from Ep,min to Ep,max, |$W_p=N_0 \int _{E_{\rm {p,min}}}^{E_{\rm {p,max}}} E\, E^{-\alpha } \mathrm{d}E$|. From this definition, we determine the normalization factor, N0, where the maximum energy is, Ep,max and the minimum energy is Ep,min = 1 GeV.
3.2 Gamma-ray flux
4 METHODOLOGY
We calculate the volume distribution of CR protons using equation (1) at every pixel in the total column density map, for a range of proton energies. The predicted 3D γ-ray map is created with the z-axis being γ-ray energy, via equation (11), by combining the proton map with the ISM distribution. The resulting γ-ray ‘cube’ is used to extract spectra and integrated flux maps. Fig. 3 shows a schematic of the model.
Our model has a range of parameters. Multiple parameters have a similar effect on the model, for example, χ and δ, which both effect the diffusion coefficient, which leads to a redundancy in our model solution. Due to this, we cannot perform a purely quantitative optimization across the entire parameter space. Instead, we perform a systematic grid search over a range of model parameters, in which each combination is modelled, based on typical values from literature, as discussed below and compare these models to γ-ray observations. We calculate metrics to quantify the agreement of GeV–TeV observations with our model. To compare the modelled morphology to the HGPS observations, the oversampling method from H.E.S.S. is applied, as described in Section 2.
Here Ri = Oi − Fi is the residual from the spatial morphology map (residual maps are provided in the supplementary material) for the ith pixel, μ is the mean and N is the number of pixels in the residual map.
Model parameter variation
SNRs are thought to be the main source of CRs for energies below the knee of the CR spectrum (at PeV energies, Lucek & Bell 2000). We define the maximum energy of protons, Ep,max, at the start of the Sedov phase to be either 1 PeV or 5 PeV (Gabici et al. 2009), for equations (4) and (5) and in the normalization factor, N0. The energy budget, Wp, is a free parameter which is optimized by minimizing the residual between the observations and model spectra. From diffusive shock acceleration theory, we expect a power law with a spectral index of α ≈ 2 (Malkov & Drury 2001). Therefore, we vary the spectral index from 1.8 to 2.4 in our model.
The factor χ varies from 0.001 to 1, the lower limit (χ = 0.001) is potentially applicable to the dense regions of interstellar gas that the CRs may diffuse through, and the upper limit is taken from various observations (see Feijen et al. 2020, and references therein). Typically, δ varies from 0.3 to 0.7 (Berezinskii et al. 1990) to allow for a range of turbulent spectra to be investigated. Here 0.3 corresponds to Kolmogorov turbulence (indicating slower diffusion), 0.5 indicates Kraichnan turbulence (Strong, Moskalenko & Ptuskin 2007) and 0.7 is consistent with a good fit to the Boron to Carbon ratio measurements.
In equation (4), δp describes the energy-dependent release of CRs. The lower limit is taken to be 1/5 which is for a simple stationary particle and the upper limit is taken to be 2.5 (Ptuskin & Zirakashvili 2005; Gabici et al. 2009; Celli et al. 2019). For the Sedov time in equation (B1) we take the typical mass and energy values for different supernovae types. We find for type Ia, where Mej = 1M⊙ (Ptuskin & Zirakashvili 2005) and ESN = 1051 erg, the Sedov time is tsedov ∼ 230 yr. For yype II, where Mej = 10M⊙ and Mej = 20M⊙ (Heger et al. 2003) with ESN = 1051 erg, the Sedov time is tsedov ∼ 1600 yr and tsedov ∼ 2850 yr, respectively. Type II can also have a higher total kinetic energy (Nomoto et al. 2004) of ESN = 1052 erg for Mej = 10M⊙ and Mej = 20M⊙, where the Sedov time is tsedov ∼ 500 yr and tsedov ∼ 900 yr, respectively.
If RSNR is not known, n0 takes on values from 0.1 to 20 cm−3. The model parameters discussed are summarized in Table 1.
Model parameters with their discrete values. The spectral index is α, the diffusion suppression factor and the index of diffusion coefficient are given by χ and δ, respectively. The maximum CR proton energy is Ep,max and δp describes the energy-dependent release of CRs. ESN is the kinetic energy released at the supernova explosion and Mej is the mass of the ejecta.
| Parameter | Values |
|---|---|
| α | 1.8, 2.0, 2.2, 2.4 |
| χ | 0.001, 0.01, 0.1, 1.0 |
| δ | 0.3, 0.4, 0.5, 0.6, 0.7 |
| δp | 0.2, 1.4, 2.5 |
| Ep, max | 1, 5 PeV |
| 1M⊙ and 1051 erg (type Ia) | |
| Mej and ESN | 10M⊙, 20M⊙, and 1051 erg (type II) |
| 10M⊙, 20M⊙, and 1052 erg (type II) | |
| n0* | 0.1, 1, 10, 20 cm−3 |
Note.* For progenitor SNR of PSR J1803−2137
5 BEST MATCHING MODELS
The following section considers the best matching models for each accelerator, based on the parameter space and minimizing the spectral and spatial criteria (equations 12 and 13, respectively), as described in Section 4. Specifically, the 5 best matching spectral models are chosen for each accelerator.
5.1 SNR G8.7−0.1
SNR G8.7−0.1 is believed to be contained in component 2 (v lsr = 30 to 40 km s−1). We test the various model parameters for both type Ia and type II supernovae for both suggested ages of SNR G8.7−0.1, 15 kyr and 28 kyr, the results shown here are the closest matching spectra to the observations. Tables D1 and D2 show the 5 best matching spectral models with their ranking parameters for the spectral and spatial models, χ2/m and S respectively.
The 5 best matching models for SNR G8.7−0.1 for each age show a range of χ and δ values. Typically a moderately slow diffusion with χ = 0.001 or 0.01 is seen, which is consistent with other studies in which the diffusion coefficient is suppressed (Gabici et al. 2007; Giuliani et al. 2010; Li & Chen 2010). The index for the energy-dependent release of CRs, δp, takes on values of 1.4 or 2.5. A mixture of the Ep,max values are present. For SNR G8.7−0.1, we find both a type Ia SN and type II SN, match the γ-ray spectra well for both ages of this accelerator. The escape energy of protons, Ep,esc, in Figs 4 and 5 are 15.8 TeV and 6.2 TeV respectively. CR protons with energy lower than Ep,esc are still confined in the bubble, however higher energy particles have escaped. This is shown by splitting the spectra into its bubble and diffused components as depicted in the top panels of Figs 4 and 5.
For our best matching models, Figs 4 and 5, the spectra tend to match well at low energies. The escape energies for these spectra are quite high, therefore the model spectra are largely dominated by the bubble component. This is seen at higher energies, where the model begins to deviate from the observations, particularly in Fig. 4.
The spatial morphology above 1 TeV cannot explain the γ-ray emission from HESS J1804−216. One contributing factor is the bubble component encompassing a large area of the H.E.S.S. source. The simulated γ-ray emission shows a peak toward the northern edge of HESS J1804−216 and a lack of γ-ray emission towards the western TeV peak of HESS J1804−216. Simulated γ-ray emission is also present at the outer western edge of SNR G8.7−0.1 for both ages, which is not present in the observations from H.E.S.S.. The closest TeV γ-ray source from the HGPS is HESS J1808−204, which is an extended source located at l = 10.01°, b = −0.24°, which is not close enough to SNR G8.7−0.1 to provide the γ-ray emission at this position.
5.2 Progenitor SNR of PSR J1803−2137
The progenitor SNR is assumed to have an age of 16 kyr, as per the age of PSR J1803−2137, and is placed at the birth position of PSR J1803−2137 as shown in Fig. 1. The progenitor SNR is believed to be in component 1 (vlsr = 20 to 30 km s−1). We test a range of combinations of model parameters for a core-collapse supernova, as a pulsar is attached to the system. The 5 best matching spectral models with their ranking parameters for the spectral and spatial models, χ2/m and S respectively, are shown in Table D3.
Table D3 shows the 5 best matching spectral models typically have a spectral index of α = 1.8, with χ = 0.001 or 0.01 and a range of δ. Similarly to SNR G8.7−0.1, this indicates moderately slow diffusion of particles. Both values of the maximum energy, Ep,max, are present and n0 takes on all values in the parameter space. The total kinetic energy, ESN, is typically the higher value from our parameter space of 1052 erg, with the ejecta mass being either 10M⊙ or 20M⊙. The index for the energy-dependent release of CRs δp = 2.5, the highest value chosen in our parameter space. The escape energy for the top model is Ep,esc = 3.8 TeV, therefore some particles are still trapped in the bubble and some have diffused, this can be seen in the spectral components in Fig. 6.
For this accelerator, both the spectral and spatial morphology match the observations well. The modelled integrated γ-ray map peaks towards the northern TeV peak of HESS J1804−216 from H.E.S.S Collaboration (2018a). There is weaker modelled γ-ray emission overlapping the entire γ-ray source and a lack of modelled emission outside the HESS J1804−216 region. No strong γ-ray emission is present outside HESS J1804−216 unlike with SNR G8.7−0.1. However, parts of the morphology do not match well due to the bubble component and the lack of γ-ray emission in the southern and eastern edges of HESS J1804−216.
6 DISCUSSION
In the previous section, we compared the model emission with observational γ-ray emission above 1 TeV. Fig. 17 from Aharonian et al. (2006) shows the morphology of HESS J1804−216 above 0.2 TeV, which is similar to the integrated flux morphology above 1 TeV in Fig. 1 (H.E.S.S Collaboration 2018a). Extensions of both HESS J1804−216 and 3FHL J1804.7−2144e overlap (Fig. 1). To probe the effects of the bubble and diffused components we look at the γ-ray emission in different energy bands: Eγ = 10 − 100 GeV, Eγ = 0.1 − 1 TeV, Eγ = 1 − 10 TeV, and Eγ = 10 − 100 TeV.
The morphology of the different energy bands for the SNR G8.7−0.1 accelerator show that the bubble component provides stronger γ-ray emission compared to the diffused component (as shown in Figs 7 and 8). At higher energies (Eγ = 1 – 10 TeV, and Eγ = 10 – 100 TeV) the model exhibits strong emission towards the southern edge of HESS J1804−216, which does not overlap with the TeV peak. In comparing the four energy bands to morphology of HESS J1804−216, it is clear the morphology is quite different.
Fig. 9 shows the morphology from different energy bands for the best model of the progenitor SNR. The bubble tends to dominate at the two lower energy bands (Eγ = 10 – 100 GeV and Eγ = 0.1 – 1 TeV), with strong emission towards the pulsar birth position. The two higher energy bands (Eγ = 1 – 10 TeV and Eγ = 10 – 100 TeV) show the γ-ray peak moves away from the pulsar position and closer to the TeV γ-ray peak from HGPS. The emission in these bands becomes diffusion dominated with extended emission outside the bubble.
Overall, the γ-ray emission in the lower energy bands of Figs 7–9 are dominated by the bubble component as the particles have energy less than the escape energy, so are still confined to the bubble region. However, above 1 TeV the diffused component becomes dominant. The morphology of the lower energy band can be compared with the spatial morphology of Fermi-LAT observations. However, Fermi-LAT has poor resolution (with a PSF of 0.2° above 10 GeV), so the spatial map from Fermi-LAT observations is described only by a circular region. Therefore, we can only compare the model morphology with the position and extent of 3FHL J1804.7−2144e (seen in Fig. 1). For each accelerator model, the peak of γ-ray emission is offset from the 3FHL catalog position (by up to 0.4°).
There are a number of known limitations in our model. These arise from:
2D propagation of CR protons
2D arrangement of the ISM
Uniform distribution of CRs inside bubble
Simple assumption of ISM inside bubble
Spherical uniformity of the SNR evolution
The main limitation comes from assuming a 2D geometry for the proton model in addition to the accelerators lying within the γ-ray source. This 2D approach to modelling the γ-rays has previously been implemented e.g. Casanova et al. (2010), in which the accelerator is further away from the γ-ray source. In our model, we have a special case in which both accelerators lie within the extension of the γ-ray source. As we do not model the diffusion inside the bubble component, our results are biased. In our 2D proton model, we do not consider particles diffusing along our line of sight, therefore we are not taking into account the emission foreground/background to the SNR bubble. This makes reconciling the morphology inside the bubble with the observations difficult and is the reason we do not use the spatial criterion (equation 13) to test which model performs best.
Another limitation comes from the assumptions regarding the ISM surrounding HESS J1804−216. We assume a 2D model in which the brightness temperature gas cube is integrated over to obtain a total column density map. By using the column density map we assume that all gas we integrated over is interacting with the CRs. Due to this, we could be including gas that is foreground and/or background to the accelerator, which may not be physically able to interact with the accelerated protons. This effect is more prominent for the bubble component which has radius Resc ∼ 30 pc compared to the entire column which is integrated over 10 km s−1 corresponding to ∼800 pc from the GRC. Our model could therefore be over predicting the bubble component.
One of the largest uncertainties in our model comes from the distribution of CRs and density of the ISM inside the bubble. We assume the CRs are uniformly distributed in the bubble (see e.g. Zirakashvili & Aharonian 2010), however realistically the particle distribution is more complex, with CRs likely accumulating in the shock region (i.e. the expanding SNR shell), as explored by some theoretical studies (Ptuskin & Zirakashvili 2005; Celli et al. 2019; Brose et al. 2020). They suggest the CR distribution can be shell brightened. From diffusive shock acceleration theory, it is possible that the shocked ISM could be ∼4 times denser than the unshocked gas (Reynolds 2008), according to the expected shock compression factor. Furthermore, it is possible for some of the ISM here to be dissociated by the SNR shock, thereby reducing the density (Fukui et al. 2003; Sano et al. 2020).
For limitation (v) we assume a constant number density for the SNR evolution (n0, in equation 3), leading to spherical uniformity of the particle escape radius. The escape energy is dependent upon δp, which describes the energy dependent release of CRs, which can also effect the evolution of the SNR. A future version of the model would involve tracing the evolution of the shock in closer detail, including the escape radius as it changed with ISM density.
7 CONCLUSIONS
We developed a model to investigate the distribution of γ-rays towards HESS J1804−216 for two SNRs in the hadronic scenario. This is a first attempt to model the morphology of γ-rays towards HESS J1804−216. Gamma-ray spectra and morphology maps of SNR G8.7−0.1 and the progenitor SNR of PSR J1803−2137 were generated for a range of model parameters and compared to observations to gain an understanding of the origin of HESS J1804−216. It was found that the progenitor SNR is the most promising candidate to be creating the TeV γ-rays, however, we are limited by the bubble component. The modelled γ-ray morphology from SNR G8.7−0.1 does not match the γ-ray morphology from observations well, therefore it is either only a minor contributor or does not contribute to the observed γ-ray emission.
The γ-ray observatory CTA (Cherenkov Telescope Array) aims to improve the current measurements from other Imaging Atmospheric Cherenkov Telescope. More detailed features in the morphology may be resolved with CTA, which will provide unprecedented angular resolution and sensitivity. The angular resolution of CTA will reach a few arcmins, comparable to the angular resolution of the Mopra radio telescope, which is utilized for our gas measurements. Here, we compare the best matching model of the progenitor SNR of PSR J1803−2137 (P1) for three different angular resolutions using different oversampling settings for each instrument. The original model (no oversampling, same resolution as the gas maps), the H.E.S.S. over sample (radius=0.1° with a grid size of 0.02°) and the expected CTA oversample (radius=0.03° with a grid size of 0.01°, as per the expected angular resolution from CTA Consortium et al. 2018) maps are shown in Fig. 10.
Fig. 10 shows that the oversampling of CTA (bottom panel) is able to resolve features, comparable to the gas map resolution (middle panel with no oversample), meaning the morphology can be further probed with CTA.
Our model provides a good framework for future studies, including insight into what parameters are required. A numerical approach in 3D could be used to more precisely model the particles injected, for each time step. This involves tracing the accelerated particles as they propagate and subsequently interact with the ISM, based on the magnetic field and diffusion parameters of each grid point in the model, hence it is a very computationally expensive approach.
For our model, we currently consider an impulsive injection of particles from the accelerator for the hadronic scenario. Mature aged SNRs may also produce γ-rays leptonically through the inverse-Compton effect (e.g. Araya & Frutos 2012; Devin et al. 2018; Fukui et al. 2021). To finally confirm the accelerator of HESS J1804−216, we need to explore the leptonic scenario, assuming the SNR is accelerating electrons which may contribute to the TeV γ-ray emission as discussed by Ajello et al. (2012), Liu et al. (2019). TeV emission from a PWNe is a reasonable assumption due to the turn over in the GeV/TeV spectrum, which could be caused by cooling effects of electrons. Along with this, a continuous acceleration scenario should be investigated for both leptonic (typical of PWNe) and hadronic origins. Our model predicts an energy-dependent morphology, largely due to the bubble component, which is not implied by the GeV/TeV observations. Future work will include an energy-dependent morphology study of the H.E.S.S. data, to investigate this further. A dedicated study of the Fermi-LAT data could also help to resolve the morphology of γ-rays at lower energies, in addition to the use of CTA in the future. These methods will hopefully help reveal the nature of HESS J1804−216.
SUPPORTING INFORMATION
Figure S1. γ-ray flux map above 0.2 TeV towards HESS J1804–216 for SNR G8.7–0.1 with an age of 15 kyr.
Figure S2. γ-ray flux map above 0.2 TeV towards HESS J1804–216 for SNR G8.7–0.1 with an age of 28 kyr.
Figure S3. γ-ray flux map above 0.2 TeV towards HESS J1804–216 for the progenitor SNR of PSR J1803–2137.
Figure S4. Best matching spectral and spatial model (G4a) for SNR G8.7–0.1 with an age of 15 kyr, showing the residual of the spatial model.
Figure S5. Best matching spectral and spatial model (G2b) for SNR G8.7–0.1 with an age of 28 kyr, showing the residual of the spatial model.
Figure S6. Best matching spectral and spatial model (P1) for PSR J1803–2137 with an age of 16 kyr, showing the residual of the spatial model.
Please note: Oxford University Press is not responsible for the content or functionality of any supporting materials supplied by the authors. Any queries (other than missing material) should be directed to the corresponding author for the article.
ACKNOWLEDGEMENTS
The Mopra telescope is part of the ATNF (Australia Telescope National Facility) which is funded by the Australian Government for operation as a National Facility managed by CSIRO (Commonwealth Scientific and Industrial Research Organisation). Support for observations were provided by the University of New South Wales and the University of Adelaide. KF acknowledges support through the provision of Australian Government Research Training Program Scholarship.
DATA AVAILABILITY
The data underlying this article are available on the MopraGam website at http://www.physics.adelaide.edu.au/astrophysics/MopraGam/. Other datasets were derived from sources in the public domain: HGPS at https://www.mpi-hd.mpg.de/hfm/H.E.S.S./hgps/ and SGPS at https://www.atnf.csiro.au/research/HI/sgps/fits_files.html.
Footnotes
SGPS data can be found at https://www.atnf.csiro.au/research/HI/sgps/fits_files.html
Published Mopra data can be found at https://dataverse.harvard.edu/dataverse/harvard/
REFERENCES
APPENDIX A: POSITION-VELOCITY PLOTS
Figs A1 and A2 are position-velocity plots for the 12CO(1-0) and HI data, respectively, towards the HESS J1804−216 region, integrated over latitudes |$b=-0.49^{\circ }\, \rm {to}\, 0.49^{\circ }$|. Using this figure, we defined two gas velocity regions, component 1 (vlsr = 20 to 30 km s−1) and component 2 (vlsr = 30 to 40 km s−1), as shown by the dashed navy lines.
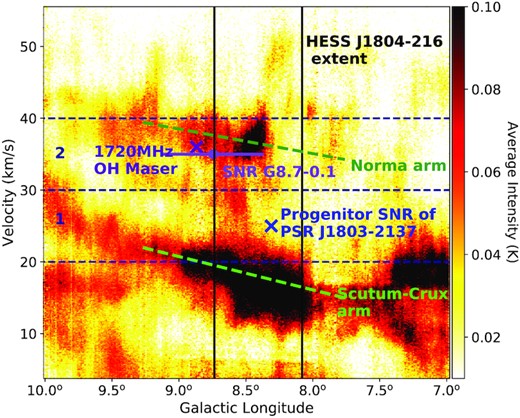
Position-velocity plot of Mopra 12CO(1-0) emission (K) towards HESS J1804−216, integrated over latitudes from −0.49° to 0.49°. The black vertical lines show the longitudinal extent of HESS J1804−216. The blue cross indicates the birth position of PSR J1803−2137 at its assumed velocity of ∼25 km s −1. The 1720 MHz OH maser is shown by the purple cross at its velocity of 36 km s−1. The centre of SNR G8.7−0.1 is shown by the purple dot, whilst the purple line shows its radial extent, at a velocity of 35 km s −1. The green dashed lines are estimates of the Galactic spiral arms along the line of sight for HESS J1804−216 (from the model in Vallée 2014). Components 1 and 2 are indicated by the dashed navy lines.
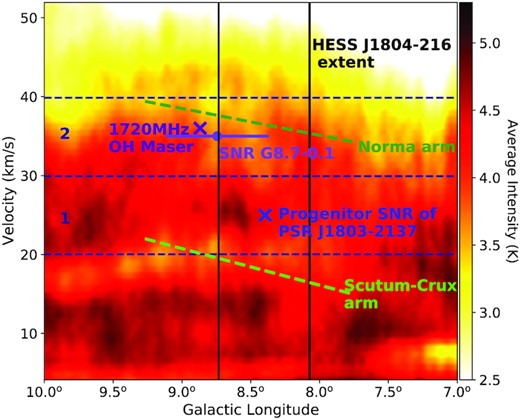
Position-velocity plot of SGPS HI emission (K) towards HESS J1804−216. The annotations are described in Fig. A1.
APPENDIX B: ADDITIONAL MODEL TERMS
APPENDIX C: HESS J1804−216 SPECTRAL COMPARISON
Fig. C1 shows the spectral comparison between the H.E.S.S. 2006 survey of the inner Galaxy (Aharonian et al. 2006) and the 2018 HGPS data (H.E.S.S Collaboration 2018a) towards HESS J1804−216. These spectra tend to match well. The observations from Aharonian et al. (2006) are between 2004 May and July with 11.7 hours of observation time. The data from H.E.S.S Collaboration (2018a) was collected between 2006 January and 2013 January with ∼44 hours of observations. Aharonian et al. (2006) provide a dedicated source analysis on HESS J1804−216 with more spectral data points than H.E.S.S Collaboration (2018a) which has a total of six bins (fixed bin number for all sources). The data from Aharonian et al. (2006) is utilized here, as we want to compare the spectral shape of the observations with our model.

APPENDIX D: BEST MATCHING MODELS
The following tables show the model parameters for the best matching spectral models based on their χ2/m values, shown here in ascending order. Each model is given a name identifier, used within the main text.
The 5 best matching spectral models for accelerator SNR G8.7−0.1 for an age of 15 kyr with their model parameters.
| Model | α | χ | δ | δp | Ep,max | SN Type | Mej | ESN | Wp | Ep,esc | χ2/m | S |
|---|---|---|---|---|---|---|---|---|---|---|---|---|
| name | (PeV) | (M⊙) | (erg) | (1049 erg) | (TeV) | (Spectral) | (Spatial, 10−13) | |||||
| G1a | 2.0 | 0.001 | 0.5 | 1.4 | 5.0 | Ia | 1 | 1051 | 7.0 | 14.8 | 1.0 | 2.8 |
| G2a | 2.0 | 0.001 | 0.4 | 2.5 | 5.0 | II | 10 | 1051 | 6.9 | 18.6 | 1.1 | 3.2 |
| G3a | 2.0 | 0.01 | 0.3 | 1.4 | 5.0 | Ia | 1 | 1051 | 7.0 | 14.8 | 1.1 | 3.0 |
| G4a* | 2.0 | 0.01 | 0.6 | 2.5 | 1.0 | II | 20 | 1051 | 6.2 | 15.7 | 1.1 | 2.7 |
| G5a | 2.0 | 0.001 | 0.4 | 2.5 | 1.0 | II | 20 | 1051 | 6.2 | 15.7 | 1.1 | 2.8 |
Note.* Best spatial model
The 5 best matching spectral models for accelerator SNR G8.7−0.1 for an age of 28 kyr with their model parameters.
| Model | α | χ | δ | δp | Ep, max | SN Type | Mej | ESN | Wp | Ep, esc | χ2/m | S |
|---|---|---|---|---|---|---|---|---|---|---|---|---|
| name | (PeV) | (M⊙) | (erg) | (1050 erg) | (TeV) | (Spectral) | (Spatial, 10−13) | |||||
| G1b | 1.8 | 0.01 | 0.6 | 1.4 | 5.0 | Ia | 1 | 1051 | 1.5 | 6.2 | 0.6 | 1.9 |
| G2b* | 1.8 | 0.1 | 0.4 | 1.4 | 5.0 | Ia | 1 | 1051 | 1.5 | 6.2 | 0.8 | 1.6 |
| G3b | 1.8 | 0.001 | 0.4 | 1.4 | 1.0 | II | 20 | 1052 | 1.0 | 8.1 | 1.0 | 2.3 |
| G4b | 2.0 | 0.001 | 0.4 | 1.4 | 5.0 | II | 10 | 1052 | 0.7 | 18.1 | 1.0 | 3.2 |
| G5b | 1.8 | 0.1 | 0.4 | 1.4 | 1.0 | II | 20 | 1052 | 1.0 | 8.1 | 1.0 | 2.0 |
Note.* Best spatial model
The 5 best matching spectral models for accelerator progenitor SNR of PSR J1803−2137 for an age of 16 kyr with their model parameters.
| Model | α | χ | δ | δp | n0 | Ep,max | SN Type | Mej | ESN | Wp | Ep,esc | χ2/m | S |
|---|---|---|---|---|---|---|---|---|---|---|---|---|---|
| name | (cm−3) | (PeV) | (M⊙) | (erg) | (1049 erg) | (TeV) | (Spectral) | (Spatial, 10−13) | |||||
| P1* | 1.8 | 0.01 | 0.6 | 2.5 | 20 | 5.0 | II | 20 | 1052 | 3.8 | 3.8 | 0.9 | 1.2 |
| P2 | 1.8 | 0.01 | 0.6 | 2.5 | 10 | 5.0 | II | 20 | 1052 | 4.5 | 3.8 | 0.9 | 1.4 |
| P3 | 1.8 | 0.001 | 0.3 | 1.4 | 20 | 1.0 | II | 10 | 1052 | 2.6 | 8.0 | 1.0 | 2.6 |
| P4 | 1.8 | 0.01 | 0.6 | 2.5 | 1 | 5.0 | II | 20 | 1052 | 8.7 | 3.8 | 1.0 | 2.6 |
| P5 | 2.0 | 0.001 | 0.4 | 2.5 | 0.1 | 1.0 | II | 20 | 1051 | 3.5 | 13.4 | 1.0 | 1.2 |
Note.* Best spatial model
Author notes
Presently at: Australian Space Agency, Adelaide, Australia
