


ABSTRACT
The gas supply from the cosmic web is the key to sustain star formation in galaxies. It remains to be explored how the cosmic large-scale structure (LSS) effects on galaxy evolution at given local environments. We examine galaxy-specific star formation rate as a function of local density in a LSS at z = 0.735 in the Extended Chandra Deep Field South. The LSS is mapped by 732 galaxies with R < 24 mag and redshift at 0.72 ≤ z ≤ 0.75 collected from the literature and our spectroscopic observations with Magellan/IMACS, consisting of five galaxy clusters/groups and surrounding filaments over an area of 23.9 × 22.7 co-moving Mpc2. The spread of spectroscopic redshifts corresponds a velocity dispersion of 494 km s−1, indicating the LSS likely to be a thin sheet with a galaxy density ≳ 3.9 times that of the general field. These clusters/groups in this LSS mostly exhibit elongated morphologies and multiple components connected with surrounding filaments. Strikingly, we find that star-forming galaxies in the LSS keep star formation at the same level as field, and show no dependence on local density but stellar mass. Meanwhile, an increasing fraction of quiescent galaxies is detected at increasing local density in both the LSS and the field, consistent with the expectation that galaxy mass and local dense environment hold the key to quench star formation. Combined together, we conclude that the cosmic environment of the LSS overtakes the local environment in remaining galaxy star formation to the level of the field.
1 INTRODUCTION
Galaxies that are formed at peaks of initial dark matter density fields (e.g. Davis et al. 1985) acquire their angular momentum in the early Universe under a great influence of tidal torque during their formation (e.g. Peebles 1969, see Schafer 2009 for a review). As galaxies and dark matter are not randomly distributed but arranged in the intricate ‘cosmic web’, the large-scale structure (LSS) of the Universe with scales up to tens of Mpc consists of relatively high-density clusters, filaments, and relatively low-density voids (e.g. Shandarin & Zeldovich 1989; Bond, Kofman & Pogosyan 1996). LSSs are ideal laboratories for studying galaxy formation and evolution in different environments. Mapping LSSs and intergalactic medium (IGM) in connection with the properties of galaxies have become a central task in extragalactic astronomy.
Theoretically, galaxies reside in low-mass dark matter haloes (less massive than the critical shock-heating mass of Mc ∼ 1012 M⊙) can accrete cold gas from cosmic web to feed star formation directly. Above Mc, the accreted gas will be shock-heated to the virial temperature before settling to the halo centre (Keres et al. 2005; Dekel & Birnboim 2006). Since the cooling of the hot gas becomes inefficient possibly due to energy injection from the active galactic nucleus feedback (Somerville & Davé 2015), the stellar mass (M*) growth in massive haloes is suppressed. However, some studies suggest that cold gas can penetrate the hot gas halo to feed star formation through cold flows at high redshift (z) (Dekel & Birnboim 2006; Keres et al. 2009; Ocvirk, Pichon & Teyssier 2008; Sánchez et al. 2014). There has been some observational evidence for the existence of such cold flows in high-z protoclusters (Daddi et al. 2021). Investigating the star formation properties of galaxies in filaments and clusters thus may shed light on the gas accretion manners in these environments and how cold flows occur.
The star formation properties of galaxies depend, on the one hand, on the amount of the accreted gas and the star formation efficiency, and on the other hand, on the environment in which the galaxies are located. In low-z, many observed properties of galaxies are strongly correlated with their environment (e.g. Gomez et al. 2003; Kauffmann et al. 2004; Baldry et al. 2006). It is believed that many early-type galaxies in clusters are formed through galaxy mergers. After that, they sink into the central region of clusters during dynamic relaxation. Late-type galaxies gradually lost their gas reservoirs when they are accreted into the inner region of clusters and evolve into lenticular galaxies (S0). For those galaxies that are far away from clusters, they are less influenced by environmental effects and still have disc or irregular morphologies. This picture can explain the origin of the well-known morphology−density relation in low redshift (e.g. Dressler 1980; Goto et al. 2003; Holden et al. 2007).
Much efforts have been devoted to study the morphology−density relation in clusters (Dressler et al. 1997; Fasano et al. 2000; Postman, Franx & Cross 2005; Smith et al. 2005), star formation activities (Brinchmann et al. 2004; Kauffmann et al. 2004; Asari et al. 2007; Poggianti et al. 2008; Peng et al. 2010; Ricciardelli et al. 2014), and stellar populations (Vulcani et al. 2012; Guglielmo et al. 2018, 2019) in different environments since z = 1. It is expected that at z ∼ 1, star formation rate (SFR) of cluster member galaxies decreases towards denser environments. However, such a trend is not seen for star-forming member galaxies (Balogh et al. 2004; Patel et al. 2009, 2011; Muzzin et al. 2012). This effect is mainly due to the existence of high proportion of quiescent galaxies (QGs) in dense regions, and the lower SFRs of such galaxies lead to the establishment of the SFR−density relation (Scoville, Arnouts & Aussel 2013; Chartab et al. 2020). The environment effects still play a role in shaping galaxy properties at 1 < z < 2 (van der Burg et al. 2020; Old et al. 2020). At z > 2, the galaxy star formation properties show no environment dependence (Scoville et al. 2013; Darvish et al. 2016). Observationally, the cosmic star formation density declines rapidly since z ∼ 2 (Madau & Dickinson 2014), along with a significant growth of the QG population (Muzzin et al. 2013; Buitrago et al. 2013). This is likely a consequence of the decrease of gas accretion on to galaxies since the cosmic star formation peaks (Pan et al. 2019).
The local and large-scale environment influence galaxy evolution with very different manners. In a dense local environment, frequent galaxy interactions can lead to the formation of disturbed morphologies or tidal tails (Ren et al. 2020). In the extreme cases, the stripped gas and stars from interacting galaxies can form ultra-compact galaxies or ultra-diffuse galaxies (Pfeffer et al. 2013; Janssens et al. 2017). In addition, interactions between central and satellite galaxies in groups can cause gas removal, which can suppress the star formation of satellite galaxies (Kawinwanichakij et al. 2016; van de Voort et al. 2017). In contrast, the large-scale environment influences galaxy evolution via replenish, cut-off, or rapidly deplete the cold gas supply in galaxies (Dekel et al. 2009; Castignani et al. 2022). In the cluster environment, it is well acknowledged that the hot IGM will remove gas from galaxies through ram pressure stripping (e.g. Hester 2006; Bekki 2014; Bahe & McCarthy 2015). In the filament environment, the observations have not yet converged to the same conclusion. For example, Kleiner et al. (2017) find evidence for the replenishment of H i gas in massive galaxies from the intra-filament medium in the low-z Universe. However, more studies support a picture where galaxies in filaments are cut off from their gas supply relative to those in voids (Kuutma, Tamm & Tempel 2017; Poudel et al. 2017; Crone et al. 2018). Recently, simulation works based on IllustrisTNG-100 suggest that the influence exerted by the large-scale galaxy environment on the circumgalactic medium gas angular momentum results in either enhanced or suppressed or star formation inside a galaxy (Lu et al. 2021; Wang et al. 2021). A comparison study for the properties of galaxies in LSSs and general fields is thus important for understanding how the local and large-scale environment influence galaxy evolution.
Over the past two decades, thanks to the Sloan Digital Sky Survey (SDSS; York et al. 2000; Stoughton et al. 2002; Abazajian et al. 2003, 2004), massive photometric and spectroscopic data have been available for studying LSSs in the low-z Universe. At intermediate- and high-z, the formation and evolution of LSSs and their member galaxies are far less explored. On the one hand, there are few large-area multiwavelength sky surveys at the intermediate- and high-z. On the other hand, accurate redshifts needed for the identification of member galaxies in LSS are also lacking for a large sample of galaxies beyond the local Universe. Many researches have focused on the Extended Chandra Deep Field South (ECDF-S), which has increased spectroscopic redshift (spec-z) surveys and multiwavelength data covering from X-ray (Giacconi et al. 2002; Luo et al. 2008; Xue et al. 2011; Luo et al. 2017) and optical to the infrared (Wolf et al. 2004; Rix et al. 2004; Gawiser et al. 2006; Cardamone et al. 2010). These wealthy data make it possible to accurately identify LSSs and study the properties of their member galaxies. In recent years, LSSs and their substructures (e.g. groups, clusters and filaments) in the ECDF-S field have been reported at various redshifts, either from X-ray (Gilli et al. 2003) or from optical studies (Adami et al. 2005; Trevese et al. 2007; Salimbeni et al. 2009; Dehghan & Johnston-Hollitt 2014).
The LSS at z = 0.735 in the ECDF-S field has been examined in previous works (Gilli et al. 2003; Adami et al. 2005; Dehghan & Johnston-Hollitt 2014). In this work, we aim to investigate relations between galaxy properties and their environment in this LSS. This paper is organized as follows. Section 2 introduces our observations and the sample selection of member galaxies in the LSS. Section 3 presents the results. A brief discussion is presented in Section 4. Section 5 summarizes the conclusion of this work. Throughout this paper, we adopt a concordance cosmology of H0 = 70 km s−1 Mpc−1, Ωm = 0.3, and ΩΛ = 0.7. All photometric magnitudes are given in the AB system.
2 OBSERVATIONS AND SAMPLE SELECTION
In order to derive a complete member galaxy sample of the z = 0.735 LSS, all publicly available spec-z and photometric redshift (phot-z) data in the ECDF-S field are collected. We also carried out new spectroscopic observations using the multi-object spectrograph (MOS) mounted on the Magellan telescope to enlarge the spec-z sample.
2.1 Public data
The Classifying Objects by Medium-Band Observations-17 survey (COMBO-17 filters), centred in the ECDF-S field, covers a field area of 31|${_{.}^{\prime}}$|5 × 30 arcmin with 17 bands ranging from 3500 to 9300 Å. The COMBO-17 catalog contains a total of 63 501 objects. For the R < 24 mag galaxies, the completeness reaches ∼80 per cent and the phot-z accuracy is Δz/(1 + z) ∼ 0.06 (Wolf et al. 2004). In order to select the sources in the COMBO-17 catalog that have preexisting spec-z, we cross-matched the catalog with the published spec-z catalogs in the ECDF-S field. These include the MUltiwavelength Survey by Yale-Chile (MUSYC) catalog complied by Cardamone et al. (2010), in which they collected all the preexisting spec-z data from Cristiani et al. (2000), Croom, Warren & Glazebrook (2001), Cimatti et al. (2002), Le Fevre et al. (2004), Strolger et al. (2004), Szokoly et al. (2004), van der Wel et al. (2004), Kriek et al. (2008), Vanzella et al. (2008), Treister et al. (2009), and Balestra et al. (2010). We also use the Arizona CDF-S Environment Survey (ACES) catalog compiled by Cooper, Yan & Dickinson (2012), which is based on a spec-z survey of the Chandra Deep Field South field with Magellan/Inamori-Magellan Areal Camera and Spectrograph (IMACS). In the recent years, HST/WFC3 grism spec-z data (Morris et al. 2015) and MUSE wide survey catalog (Urrutia et al. 2019) in the Great Observatories Origins Deep Survey South field (GOODS-S) have also been published. The details of these catalogs are listed in Table 1. We cross-matched the COMBO-17 catalog with these spec-z catalog using an aperture of radius = 1 arcsec and generated an ECDF-S Master spec-/phot-Redshift Catalog (EMRC). The EMRC contains 62 448 sources with 0 < z < 4.9, and 8370 of them have spec-z. Note that the MUSYC catalog of the ECDF-S field (Cardamone et al. 2010) also provides phot-z estimates. At 0.1 < z < 1.2, the phot-z accuracy of the MUSYC catalog is Δz/(1 + z) ∼ 0.007, which is better than that of the COMBO-17 catalog. Thus, the MUSYC phot-z will be adopted if a source is matched between the EMRC and MUSYC catalog.
The public redshift catalogs and imaging data in the ECDF-S field.
| Name | Telescope | Filed | Type | N1 |
|---|---|---|---|---|
| COMBO172 | MPG | ECDF-S | phot | ∼ 60 000 |
| GEMS3 | HST | CDF-S | morphology | ∼ 10 000 |
| MUSYC4 | Subaru | ECDF-S | phot | ∼ 40 000 |
| ACES5 | Magellan | ECDF-S | spec | ∼ 5000 |
| WGELRC6 | HST | GOODS-S | spec | ∼ 600 |
| MWS7 | VLT | CANDELS | spec | ∼ 2000 |
The MUSYC catalog of the ECDF-S field provides 18 medium-bands deep optical photometry from the Subaru telescope and 14 pre-existing broad-band photometry from the U38 to Spitzer/IRAC 8 |$\rm{\mu m}$|. This catalog contains ∼40 000 galaxies with RAB < 25.3 mag, the median depth of the medium-band imaging. We use an aperture of r = 0|${_{.}^{\prime\prime}}$|6 to cross-match our EMRC with the MUSYC catalog. This aperture radius is equivalent to the coordinate 3σ deviation of the two catalogs. Finally, we obtain the multiwavelength fluxes of a sample of 1402 galaxies with R < 24 mag at 0.69 ≤ z ≤ 0.78. In the following, we will perform spectral energy distribution (SED) fitting to these galaxies to derive their physical properties.
The GOODS-S covering the central region of the ECDF-S field (Giavalisco et al. 2004) and the Galaxy Evolution from Morphology and SEDs survey (Rix et al. 2004) provide high-resolution imaging data taken with the Hubble Space Telescope (HST), which enables the study of the morphology−density relation of member galaxies in the z ∼ 0.735 LSS.
2.2 Magellan/IMACS spectroscopic observations
In order to enlarge the spec-z sample, 125 galaxies with phot-z of 0.7 < z < 0.8 are selected from EMRC for spectroscopic observations. We conducted MOS observations on 2018 January 21, using the IMACS (Dressler et al. 2011) on the Magellan Baade telescope at Las Campanas Observatory. We used the f/2 (short) camera on the IMACS with a 200 line mm−1 grism (2.037 Å pixel−1) and a broad r-band filter with a wavelength coverage of 540−700 nm to do the observations. The total exposure time is 1.5 h, which is divided into three 1800 s exposures. The median seeing is 0|${_{.}^{\prime\prime}}$|8.
The MOS data are reduced using the Carnegie Observatories System for Multi-Object Spectroscopy 1 (COSMOS) pipeline (Dressler et al. 2011; Oemler et al. 2017). The pipeline is mainly composed of two major parts: constructing the spectral map and reducing the spectra. In the constructing spectral map step, we subtract bias from each science exposure frame and use the HeNeAr arc to do the wavelength calibration. Then, we trace each spectral position on the science frames. In the reducing spectrum process, we do flat-fielding and sky subtraction from science frames. After that, we extract 2D spectra and stack three exposures to remove cosmic rays. The 1D spectra for all sources are extracted from the reduced 2D spectra using a boxcar extraction, with the extraction aperture matched to the spatial profile of the object.
Considering the spectral wavelength coverage and the redshifts of our target objects, the reduced spectra should cover the rest-frame wavelength range of 3000−4000 Å. There is only one strong emission line [O ii] λ3727 over the rest-frame wavelength of 3000 and 4000 Å in a galaxy spectrum, making a robust redshift identification difficult. Although the [O ii] λ3727 emission line has doublet, our spectral resolution is not enough to resolve two lines. The phot-z accuracy of MUSYC is about Δz = 0.012 at z = 0.73. Therefore, if an emission line is identified between (phot-z − 3 × Δz) × 3727 Å and (phot-z + 3 × Δz) × 3727 Å, we consider it as an [O ii] λ3727 emission line. Then, we use specutils2 to determine the centre of the emission line and calculate the spec-z.
As such, the spec-z uncertainty δz depends on that of the wavelength calibration. At z ∼ 0.735, our wavelength calibration results in a redshift uncertainty of δz < 0.001. This accuracy is sufficiently high for identifying member galaxies in the LSS. Finally, we obtain the spec-z of 75 galaxies from our observations. Examples of 1D and 2D spectra and the catalog of newly observed spec-z from our observations are presented in Appendix A.
2.3 Sample selection
Redshift distribution of galaxies with R < 24 mag in the ECDF-S field is shown in Fig. 1. The golden and blue histograms indicate the spec-z + phot-z sample and the spec-z sample, respectively. The inner panel shows the spec-z distribution of the z = 0.735 LSS. It can be seen that the redshift distribution of the LSS is well fit by a Gaussian function with δz = 0.0029 and zpeak = 0.7345. Considering the relatively low spec-z completeness and the uncertainty of phot-z, we thus select galaxies within the range of 0.72 ≤ z ≤ 0.75 (hereafter the LSS sample) as the member galaxies of the z = 0.735 LSS. Meanwhile, we selected galaxies with 0.69 ≤ z < 0.72 and 0.75 < z ≤ 0.78 as a comparison sample (hereafter the field sample), to study the difference in galaxy properties between the LSS and the general field. Finally, the LSS sample contains 732 (414 spec-z + 318 phot-z) galaxies with R < 24 mag at 0.72 ≤ z ≤ 0.75, and the field sample includes 860 galaxies with R < 24 mag at 0.69 ≤ z < 0.72 and 0.75 < z ≤ 0.78.
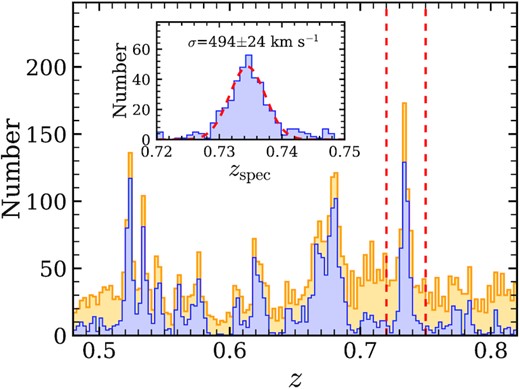
Redshift distribution of R < 24 mag galaxies in the ECDF-S field, with a bin size Δz = 0.0025. The blue histogram refers to the spectroscopic redshifts, and the orange histogram is for the spec-z + phot-z. We select the galaxies with 0.72 ≤ z ≤ 0.75 as the members of the LSS. The inner panel shows the spec-z distribution of the galaxies with a bin size Δz = 0.001 in the LSS. The red dashed curve in the inner panel represents a Gaussian fit to the spec-z distribution.
3 ANALYSIS AND RESULTS
Our goal is to study the physical properties of the member galaxies of the z = 0.735 LSS, and investigate whether these properties are different from those of galaxies reside outside the LSS. We first characterize the LSS and its substructures and then study galaxy properties as functions of local environment.
3.1 Spatial distribution of the z = 0.735 LSS
Fig. 2 shows the spatial distribution of LSS member galaxies at 0.72 ≤ z ≤ 0.75 and field galaxies at 0.69 ≤ z < 0.72 and 0.75 < z ≤ 0.78. Our sample galaxies span a sky area of 31|${_{.}^{\prime}}$|5 × 30 arcmin, corresponding to scales of 23.9 × 22.7 co-moving Mpc2 (cMpc2) at z = 0.735. Blue circles and magenta squares mark spec-z and phot-z, respectively. We split the projected plane into a grid of identical cells with a size of 30 × 30 arcsec2, calculate galaxy surface number density in these cells, and smooth the density maps with a Gaussian kernel of |$\rm {FWHM}=4{_{.}^{\prime}} 6$| (3.5 cMpc at z = 0.735). The full width at half-maximum (FWHM) value is larger than the virial radius of general clusters and is suitable for showing 2D density map of the LSS. The average volume of the 0.69 ≤ z < 0.72 and 0.75 < z ≤ 0.78 redshift bins are equal to that of the 0.72 ≤ z ≤ 0.75 bin and each of the redshift bins contain nearly the same volume (within 5 per cent). The surface number densities of the three slices can be compared with each other. The density maps are normalized to the average density in the field following 1 + δ = Σ/ < Σ > field. Here, <Σ > field is the average density over the two redshift slices 0.69 ≤ z < 0.72 and 0.75 < z ≤ 0.78.
![The spatial distribution of galaxies with R < 24 mag in the ECDF-S field. From left to right are the galaxies at 0.69 ≤ z < 0.72, 0.72 ≤ z ≤ 0.75 and 0.75 < z ≤ 0.78. The LSS is shown in the second panel. Blue circles represent the spec-z galaxies and magenta squares represent the phot-z galaxies. The colour map shows the relative surface density of all galaxies smoothed by a Gaussian kernel with $\rm {FWHM}=4{_{.}^{\prime}} 6$ (3.5 cMpc at z = 0.735). The lime contour levels refer to [1,3,5] times the averages density in the field. The three maps have a size of 31${_{.}^{\prime}}$5 × 30 arcmin, corresponding to a co-moving size of 23.9 × 22.7 cMpc2 at z = 0.735.](https://oup.silverchair-cdn.com/oup/backfile/Content_public/Journal/mnras/510/2/10.1093_mnras_stab3633/1/m_stab3633fig2.jpeg?Expires=1749938124&Signature=JLuEW9KGHyTq-aYQP~a0Ct6r9YdRvDqX3bHTpIDlByK6kJetN1HMVWLHEmFrSg3cII9YMvh8a4z9Ob8fph-nBbrOt56ChhY0khnyXjIciuglAPxDI6ijF7EpaTtSFO~CMmddI0RV6tGeG5-lcs1uMmvQiaypJrRd1gS0tPlIk4dU7-mKGhxPsg0sBfP21Gh3Wm~-Sua0MpZhE3XWZXPqbvdisny67PHRA3n-0C8yojaSKmcwiJ4rCws0dPl-czASBPBR3KFnpUHmS0h6WeA9g2IF6yeLj-QCGwvJhOH-Ak~9mwiq~9DMF8XGyTPheYrM~TqvnSIXgTC7fyp~z4FhLA__&Key-Pair-Id=APKAIE5G5CRDK6RD3PGA)
The spatial distribution of galaxies with R < 24 mag in the ECDF-S field. From left to right are the galaxies at 0.69 ≤ z < 0.72, 0.72 ≤ z ≤ 0.75 and 0.75 < z ≤ 0.78. The LSS is shown in the second panel. Blue circles represent the spec-z galaxies and magenta squares represent the phot-z galaxies. The colour map shows the relative surface density of all galaxies smoothed by a Gaussian kernel with |$\rm {FWHM}=4{_{.}^{\prime}} 6$| (3.5 cMpc at z = 0.735). The lime contour levels refer to [1,3,5] times the averages density in the field. The three maps have a size of 31|${_{.}^{\prime}}$|5 × 30 arcmin, corresponding to a co-moving size of 23.9 × 22.7 cMpc2 at z = 0.735.
As shown in the inner panel of Fig. 1, the spec-z distribution of the LSS member galaxies suggests a scatter of δz = 0.0029. This scatter is a combination of galaxy velocity dispersion and the cosmic distance, along the line-of-sight. Considering that the velocity dispersion of a typical galaxy group reaches ∼500 km s−1, and the radial distance of the LSS might be dramatically smaller, implying that this LSS may possibly be a thin sheet. When taking ±1.2 × δz, corresponding to the Δz equal to the FWHM of the spec-z distribution, as the upper limit for the line-of-sight span of the z = 0.735 LSS (corresponding to 19.8 cMpc), the number density of the LSS becomes ≳3.9 times the average number density of the field. The number density of the LSS might be significantly higher if the actual size is adopted.
3.2 Substructures in the z = 0.735 LSS
We further examine the substructures of the z = 0.735 LSS. It is clear that galaxies within the LSS are concentrated around some density peaks and form substructures, including galaxy clusters, massive groups, and filaments. These substructures have been identified as small galaxy clusters (Dehghan & Johnston-Hollitt 2014). Using the latest data we collect, we map the densities in the redshift slice of 0.72 ≤ z ≤ 0.75 and identify five galaxy clusters and filaments around them.
In Fig. 3, we mark the five galaxy clusters on the density map of the z = 0.735 LSS, smoothed with a Gaussian kernel of |$\rm {FWHM}=2{_{.}^{\prime}} 3$| (1.75 cMpc). The central density of these substructures must be greater than twice the average density and FWHM > 1.75 cMpc. The substructures of the LSS are detected using the 1D density distribution from the centre of the substructures to the first inflection point. Among them, Cluster-A and Cluster-B are galaxy clusters with a single dense core. Cluster-C and Cluster-D both consist of two smaller substructures. These substructures are common in low-z clusters (e.g. Aguerri & Sánchez-Janssen 2010; Soares & Rembold 2019). We speculate that the substructures in Cluster-C and Cluster-D will eventually merge and form two massive clusters. Cluster-E has only a few galaxies with spec-z. It is thus difficult to robustly determine its velocity dispersion and select member galaxies. The redshift distribution of the member galaxies of four clusters (A, B, C, and D) are shown in Fig. 4. Note that uncertainties exist with our identification of these substructures as criteria for galaxy groups, poor clusters, and rich clusters are not clearly defined, particularly for unvirialized systems. We remind that our analyses do not rely on the identification of these substructures. Instead, we introduce the density indicator to quantify the local environment of galaxies in Section 3.4.
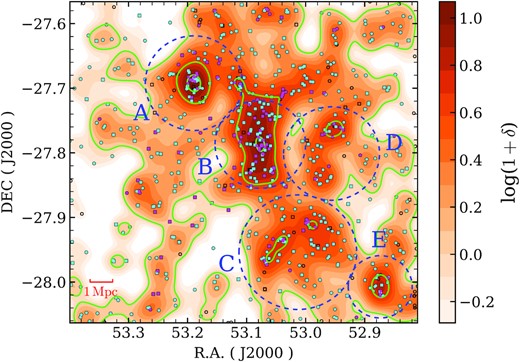
Spatial distribution of member galaxies of the z = 0.735 LSS. The squares represent spec-z samples and circles are phot-z samples. Magenta and cyan symbols are QGs and SFGs as divided in Section 3.3. Large blue circles are the r/R200 = 3 regions of the massive substructures detected in the LSS. Unfilled symbols represent no SED-fitting results galaxies or |$\chi _r^2\gt 5$| galaxies. Colour map shows a density map of δ relative to the average density in the field. The map is smoothed with a Gaussian Kernel of FWHM = 2|${_{.}^{\prime}}$|3 (1.75 cMpc at z = 0.735). 1 + δ = 1, 5, 10 are marked with the lime contours.
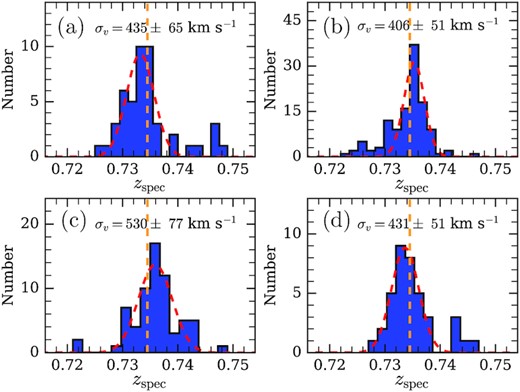
The spec-z distribution of four clusters. From top left to bottom right panels are cluster-A, -B, -C, and -D. The red dashed curves show the best-fitting Gaussian functions. The orange dashed lines mark the centre redshift of the LSS. Velocity dispersions of the substructures are given.
3.2.1 Properties of clusters
Properties of four clusters in the LSS.
| ID | σv | R200 | M200 | |$N_{\rm gal}\, {a}$| | Cb |
|---|---|---|---|---|---|
| km s−1 | (Mpc) | (× 1013 M⊙) | |||
| A | 435 ± 65 | 0.72 ± 0.11 | 6.2|$^{+3.2}_{-2.4}$| | 58 | 0.569 |
| B | 406 ± 51 | 0.67 ± 0.08 | 5.0|$^{+2.1}_{-1.7}$| | 76 | 0.934 |
| C | 530 ± 77 | 0.87 ± 0.13 | 11.2|$^{+5.6}_{-4.2}$| | 64 | 0.688 |
| D | 431 ± 51 | 0.71 ± 0.08 | 6.0|$^{+2.4}_{-1.9}$| | 42 | 0.595 |
a Number of member galaxies with spec-z + phot-z within r/R200 < 2.
b Spec-z completeness within r/R200 < 2.
Because these substructures have not relaxed and have higher redshifts, the low-z cluster criteria are not applicable to these substructures. The velocity dispersions, M200 and R200 of the substructures in our work are similar to that of the low-z small clusters (Soares & Rembold 2019). The mass and velocity dispersion of the clusters shown in our work are comparable to the Fornax cluster (Drinkwater, Gregg & Colless 2001). Our clusters have higher redshift than the Fornax cluster. We hypothesize that if these clusters evolved from z = 0.735 to z = 0, they would be larger than the Fornax cluster.
3.3 SED fitting
We obtain the broad-band SED composed of fluxes in the U38, U, B, V, R, I, z, J, H, K, 3.6, 4.5, 5.8, and 8.0 |$\rm{\mu m}$| bands for the galaxies with multiwavelength fluxes at 0.69 ≤ z ≤ 0.78 and fit the observed fluxes using a python Code Investigating GALaxy Emission3 (CIGALE; Boquien et al. 2019). Based on the energy balance principle, CIGALE treats the dust attenuation of galaxies, star formation history (SFH), single stellar population model, and other modules as free parameters to fit the observed data and find the best-fitting SED model. A Bayesian analysis is used for constructing a probability distribution function (PDF) of the estimated parameter and then output the adopted values.
The module sfhdelayed is used in our SED-fitting procedure with CIGALE. The BC03 stellar population model (Bruzual & Charlot 2003) with a Chabrier initial mass function (IMF; Chabrier 2003) is adopted in our fitting. The dustatt_modified_starburst dust attenuation curve (Calzetti et al. 2000) and Dale2014 dust emission (Dale et al. 2014) are adopted. An E(B-V) factor of 0.44 is used to correct the different dust attenuation between old and young stellar populations (Calzetti et al. 2000; Charlot & Fall 2000; Wild et al. 2011; Qin et al. 2019). For each model, a number of parameters are set to fit the observed data, which are listed in Table 3. Some examples of our SED-fitting results are shown in Fig. 5.
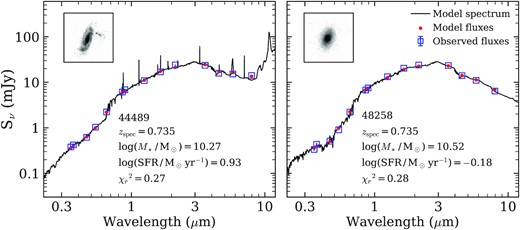
Two examples of observed galaxy SEDs and best-fitting models. Blue squares with error bars are observed data points and solid lines represent the best-fitting model spectrum. Red dots are the best-fitting fluxes. The inner small panels show the galaxy stamps taken from the HST/ACS F775W observations.
SED-fitting modules and parameters.
| Model | Parameters | Value |
|---|---|---|
| sfhdelayed | τ | 0.05,0.1,0.5,1,2, |
| 4,6,8,10,20 (Gyr) | ||
| age | 1,2,5,7 (Gyr) | |
| τburst | 5,10,50,100,500 (Myr) | |
| Ageburst | 10,50,100,200,500 (Myr) | |
| fburst | 0.001,0.01,0.02,0.05,0.1 | |
| BC03 | IMF | 1 (Chabrier) |
| Metallicity | 0.02 | |
| Nebular | Ionization | −2 |
| Calzitti2000 | E(B−V)nebular | 0.01,0.05,0.1,0.2,0.3 |
| 0.4,0.5,0.6,0.8,1.0,1.2 | ||
| E(B−V)factor | 0.44 | |
| powerlaw_slope | −0.7, −0.5, −0.3, −0.1,0.1,0.3 |
Through SED fitting, we obtain the stellar mass, SFRs, and other physical parameters for 1402 galaxies at 0.69 ≤ z ≤ 0.78 in the ECDF-S. Some faint sources have larger reduced chi square (|$\chi _r^2$|) due to the observation errors, and these sources will be removed from our SED samples. The 1116 galaxies with |$\chi _r^2\lt 5$| are selected. Fig. 6 shows the M* −SFR relation for the galaxies with |$\chi _r^2\lt 5$|. It can be found that the star formation main sequence (SFMS) of our LSS and field samples are well consistent with those at z = 0.7 reported in the literature, supporting that our stellar mass and SFR estimates from the SED fitting are robust. Besides, the star-forming galaxies (SFGs) in our LSS and field samples obey the similar SFMS. The two samples of SFGs do not show noticeable difference in SFR.
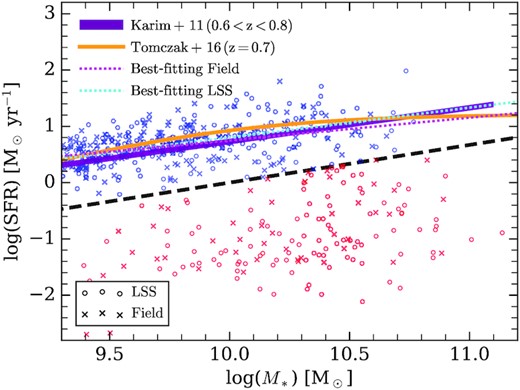
The M* versus SFR diagrams for galaxies at 0.69 ≤ z ≤ 0.78 in the ECDF-S field. The circles and crosses represent the galaxies in the LSS (0.72 ≤ z ≤ 0.75) and in the field (0.69 ≤ z < 0.72 & 0.75 < z ≤ 0.78), respectively. The orange solid line is the SFMS relation at z = 0.7 from Tomczak et al. (2016). The purple solid line refers to the SFMS at 0.65 < z < 0.80 from Karim et al. (2011). The black dashed line is used to separate SFGs and QGs. The SFMS of the LSS and the field samples are plotted with the cyan and magenta dotted lines, respectively.
3.4 Galaxy local environment and galaxy properties
Many of the galaxy properties are found to be tightly correlated with environment. We examine the properties of galaxies as functions of environment in the LSS and field samples. For a galaxy, we employ the surface density Σ10 as its local environment indicator. By definition, |$\Sigma _{10}=11/(\pi r_{10}^{2}$|), where r10 is the projected distance from this galaxy to its 10th nearest neighbour. This local environment indicator has been used in many works (e.g. Dressler 1980; Koyama et al. 2013; Pan, Kong & Fan 2013; Yan et al. 2015). For the three redshift slices we study in this work, we compute the galaxy local density (Σ10) using all R < 24 mag galaxies (phot-z + spec-z) in that redshift slice. For our sample, Σ10 spans a range from ∼0.2 to ∼100 Mpc−2.
3.4.1 Star formation properties in different environments
Galaxy properties are usually correlated with stellar mass. Thus, a mass limited sample is demanded for many studies. In this section, we select M* > 109.3 M⊙ galaxies to study their star formation properties. This mass cut ensures that SFGs are mass complete within the probed redshift range (Borch et al. 2006). SFGs and QGs form two peaks in the mass−SFR−density plot (e.g. Renzini & Peng 2015). We use a line, along the lowest galaxy number density between these two peaks, to separate these two populations. As such, galaxies with |$\log (\rm {SFR})\gt 0.65\log (M_\ast /\rm M_\odot)-6.7$| are classified as SFGs, as shown in Fig. 6. Fig. 7 shows the relationships between the density Σ10 and star formation activity (described by SFR and sSFR ≡ SFR/M*) for the field and LSS samples. The blue crosses (circles) and red crosses (circles) represent SFGs and QGs in the field (LSS), respectively. The orange dashed lines draw the best-fitting relations for the SFGs. Note that Σ10 spans about two orders of magnitude in the LSS, while it only ranges up to 10 Mpc−2 in the field. The high end of Σ10 in the LSS is comparable to that in massive clusters of galaxies in the local Universe (e.g. Yan et al. 2015).
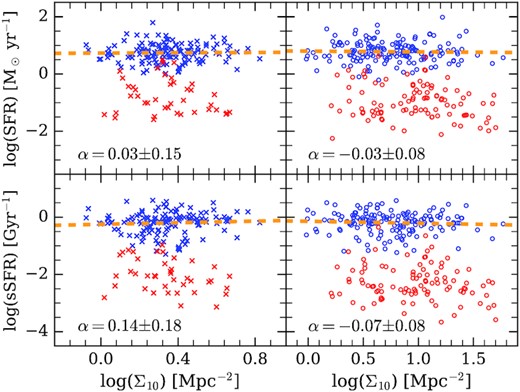
Comparison of galaxies between the field at 0.69 ≤ z < 0.72 and 0.75 < z ≤ 0.78 (left), and the LSS at z = 0.735 (right), in the diagrams of Σ10 versus SFR (top), and Σ10 versus sSFR (bottom). Blue symbols represent SFGs, and red symbols represent QGs. The golden dashed lines give the best-fitting relations to SFGs.
SFR of SFGs does not change with increasing Σ10 both in the LSS and the field, giving a slope of α = 0.03 ± 0.15 and α = −0.03 ± 0.08, respectively. Vulcani et al. (2010) finds that denser regions tend to contain higher fraction of massive galaxies. To remove the stellar mass dependence, we investigate sSFR against Σ10 and show the results in the bottom panels of Fig. 7. The best-fitting relation obeys |$\log (\rm {sSFR}) = 0.14 \pm 0.18 \times \log (\Sigma _{10}) + 0.25 \pm 0.07$| and |$\log (\rm {sSFR}) = -0.07 \pm 0.08 \times \log (\Sigma _{10}) + 0.14 \pm 0.07$| for SFGs in the field and LSS samples, respectively. One can see that sSFR only slightly increases with increasing Σ10 for SFGs in the field sample, and sSFR is nearly independent of Σ10 for SFGs in the LSS.
Within the fitting uncertainties, the sSFR−Σ10 relations are nearly identical for both of the two samples. Differing from the star formation−density relation seen among local galaxy clusters. Our results reveal that SFGs at z ∼ 0.7 in the ECDF-S field demonstrate no star formation dependence on the local environment traced by Σ10, indicating that the local environment does not play a significant role in either enhancing or suppressing star formation in SFGs, at least for our LSS and field samples. Compared with the general field, the z = 0.735 LSS provides a cosmic environment that exhibits little or no effect on the suppression of star formation in SFGs. A similar result is also reported by Poggianti et al. (2008) at the same redshift.
As already known, sSFR of SFGs also depend on stellar mass. To separate the dependence of sSFR on stellar mass and Σ10, we further divide the LSS sample into subsamples according to their Σ10 and stellar mass, and investigate their distributions in the sSFR−M* diagram. We divide the LSS sample into low-density (log Σ10 < 0.48), medium-density (0.48 < log Σ10 < 0.87), and high-density (log Σ10 > 0.87) subsamples, ensuring that each subsample contains similar number of galaxies. In Fig. 8, the median sSFR are plotted against the median of stellar mass for three subsamples. Note that our field samples contain few galaxies in the high-density environment. It is obvious that sSFR decreases with stellar mass but the local density (Σ10) in the first place. The three subsamples follow the same M*−sSFR relation. Therefore, we conclude from Figs 7 and 8 that galaxy local environment (Σ10) does not induce significant influence on star formation of SFGs in the z = 0.735 LSS.
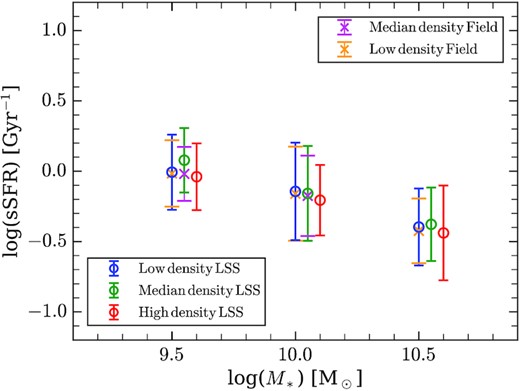
The median sSFR as a function of stellar mass for SFGs split into stellar mass and local density bins in the z = 0.735 LSS. The three local-density bins refer to low- (blue circles), medium- (green circles), and high-density (red circles) in the LSS. The magenta and orange crosses refer to the median- and low-density in the field. The error bar of every data point marks the sSFR range, including 68 per cent of galaxies in that bin.
The environments have influence not only on the star formation properties, but also on the transformation of SFGs into QGs. Therefore, the study of the QG fraction (fQG) in the field and in the LSS can better understand how the environment quench the star formation. The selection criterion of R < 24 mag at ∼0.7 is incomplete for QGs with M* < 1010.3 M⊙ (Borch et al. 2006). Considering the lack of massive galaxies in our sample, we counted the fQG using the galaxies with M* > 1010 M⊙.
Fig. 9 shows the fQG as a function of local density. In the LSS, the fQG can reach ∼70 per cent in the high-density region. This illustrates that in the most dense regions, the quenching of star formation is linked to environmental effects. The fQG of the field sample is similar to that in the low-density region of the LSS and increase with the increase of local density both in the field and in LSS. It means that the LSS has little effect on quenching galaxies in the low-density region around it. This is like putting several dense regions in a general field with no effect on the surrounding galaxies. In other words, the fQG is influenced by local environment rather than the large-scale environment, at least in our work.
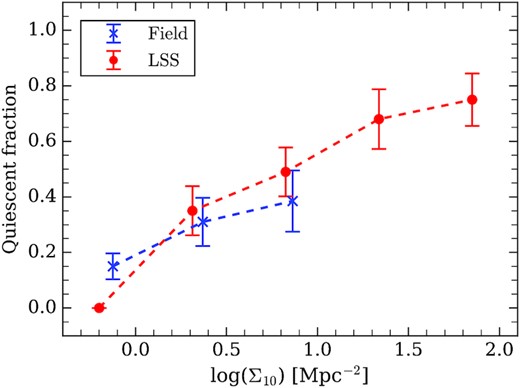
Fraction of QGs as a function of local density for the galaxies with M* > 1010 M⊙ in the field (blue crosses) and the z = 0.735 LSS (red dots) samples. The error bars indicates shot noises.
3.4.2 Stellar mass and Sérsic index
We examine the relations between galaxy local density, stellar mass, and structural parameter for the galaxies with M* > 109.3 M⊙. Here, Sérsic index (n) is used as the structural parameter to characterize galaxy morphology and light concentration. The GEMS catalog provides structural parameter measurements for nearly 10 000 galaxies (Rix et al. 2004). We crossmatch our EMRC catalog with the GEMS catalog and obtain Sérsic index for 72 per cent of the total sample galaxies. Fig. 10 shows the distributions of stellar mass and Sérsic index in relations to Σ10 for our sample galaxies in the field and the z = 0.735 LSS. As can be seen, in the field no clear tendency is found between galaxy stellar mass and local density. Massive galaxies with M* > 1010 M⊙ in the field reside in the low- and medium-density environments, while in the LSS, galaxies of different stellar masses appear in all three types (low-, medium-, and high-density) of local environments. Only very high-density environment (log Σ10 > 1.5) in the LSS preferentially hosts massive galaxies with M* > 1010 M⊙. From the bottom panels of Fig. 10, no correlation is found between n and Σ10 in either the field or the LSS. We emphasize that in the LSS galaxies with n > 3 can be found in all three types of local environment, and they do not favour the medium- and high-density environment.

Galaxy stellar mass (top) and Sérsic index (bottom) as a function of local density for galaxies in the field (left) and in the LSS (right). The symbols are the same as in Fig. 7.
3.4.3 The morphology−density relation in cluster-B
We examine whether the morphology−density relation among local galaxy clusters is already in place at intermediate z. To do so, a large sample of member galaxies with spec-z and high-resolution imaging are needed. In the z = 0.735 LSS, only Cluster-B hosts member galaxies with a high completeness in spec-z (93 per cent within r/R200 < 2), and HST/ACS multiband imaging data from the GOODS-S survey are available.
In order to study the morphology−density relation in the inner (r/R200 < 2) and the outer (2 < r/R200 < 3) region of cluster-B, we selected a sample of 101 galaxies from cluster-B within r/R200 < 3 that with HST/ACS F850LP imaging data. These galaxies are then visually classified into four morphological classes: disc, elliptical, merger, and peculiar. In our classification, discs include spiral, lenticular, and edge on galaxies. Galaxies that exhibit tidal tails, double nuclei, or significant merger remnants are categorized into mergers. Galaxy pairs are not included in our merger sample, because the high number density of galaxies in clusters brings in very severe projection effect, resulting in a high misidentification rate of galaxy pairs. In addition, the high relative velocity between galaxies in clusters makes it difficult for galaxy pair to merge. The peculiar class includes irregular and morphologically disturbed galaxies. In total, there are 39 elliptical (39 per cent), 26 disc (26 per cent), 13 merger (13 per cent), and 23 peculiar (23 per cent) galaxies in our sample.
We divide the environment indicator Σ10 into four bins and then count galaxies of given morphological types in each Σ10 bin. The results are shown in Fig. 11. It is obvious that the fraction of elliptical is higher towards denser environment, and discs show an opposite trend. These results are similar to those found in local clusters of galaxies. Interestingly, the fraction of disc and mergers both peak at the density range of 0.4 < log (Σ10) < 0.8. This may partially due to the applied morphological classification. In our classification, we choose the mergers based on the tidal features, which is generated by the merger of disc galaxies. Therefore, the fraction of mergers is relatively high in the environment with high-fraction disc galaxies. For peculiar galaxies, they peak at 0 < log (Σ10) < 0.4 and 0.8 < log (Σ10) < 1.2. The low-density peak is expected, because irregular galaxies are mostly low-mass galaxies and tend to reside in low-density environments (outer). In the high-density environment (inner), strong interactions between galaxies can cause strong disturbance, also producing a significant fraction of peculiar galaxies.
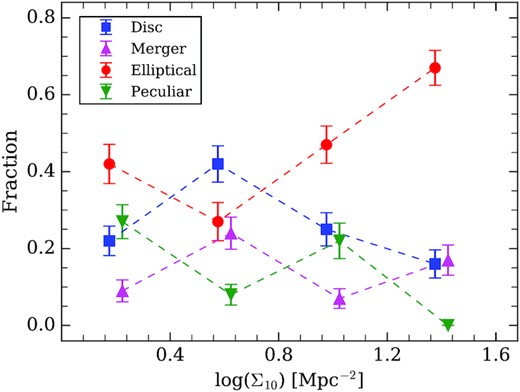
The galaxy fraction of different morphology types in different environments. The error bars indicates shot noises.
4 DISCUSSION
The z = 0.735 LSS in the ECDF-S filed spanning 23.9 × 22.7 cMpc2 over the observed area is characterized by a low velocity dispersion of 494 ± 24 km s−1, along the line of sight, likely being a thin sheet consisting of five galaxy clusters and surrounding filaments. This LSS contains galaxies at a density ≳3.9 times that of the general fields, suggestive of an overdense cosmic environment that is comparable to galaxy clusters at the same epoch (e.g. Chiang, Overzier & Gebhardt 2013). Our results reveal that SFGs in this dense structure are indistinguishable from those in the field at the same redshift in terms of their SFR, as shown in Fig. 7. This finding differs from the expectation that galaxy evolution in dense environments tends to be accelerated (e.g. Thomas et al. 2005), and cluster SFGs exhibit a lower sSFR relative to these in the field at intermediate redshifts (Erfanianfar et al. 2016; Jian et al. 2018). However, no environmental dependence of galaxy star formation was also reported (e.g. Randriamampandry, Vaccari & Hess 2020). We notice that previous studies on environmental effects were mostly concentrated on cluster-scale environment, i.e. the local environment mentioned in our work. The cosmic environment beyond the cluster scale has seldom been addressed. We argue that the controversy on environmental effects on galaxy star formation is likely attributed to the omission of the cosmic environment.
Our striking finding that no environmental dependence is seen for the SFMS, as well as the sSFR−density relation in the z = 0.735 LSS suggests that the cosmic environment overtakes the local environment in remaining galaxy star formation, at least in some cosmic LSSs. We point out that the z = 0.735 LSS enables to effectively supply gas into member galaxies in various local environments and sustains star formation at the level of the field.
4.1 The robustness of the density−sSFR relation
We demonstrate that adoption of different density indicators will not change our results relied on galaxy local density given in Figs 7 and 10. Muzzin et al. (2012) used the cluster centric distance as a proxy of density. The smaller the cluster centric distance, the higher the number density of galaxies. This density indicator is suitable for clusters or groups. Some works use the relative density, setting the lowest density region to zero and the highest density region to unity to facilitate the comparison of different fields (Scoville et al. 2013). The most commonly used method for galaxy density is the 2D or 3D number density of galaxies within the radius of the i-th nearest galaxy (Elbaz et al. 2007; Patel et al. 2011; Koyama et al. 2013). We use Σ10 as the indicator for galaxy local density. Our choice of i = 10 is optimized for a better comparison of the sSFR−density relation between the field and the LSS with given sample galaxies. It is a balance between the density resolution and the sensitivity to small-scale substructures.
We test the density indicators with i = 5, 15, 20 and examine the influence on the sSFR−density relation. Fig. 12 illustrates the slope (α) of the sSFR−density relation obtained with the four density indicators. The results from the literature are also plotted. The blue and red points show the galaxies with M* > 109.3 M⊙ and M* > 1010 M⊙, respectively. The crosses and dots represent the filed and LSS samples. Triangles show the results collected from literature (Patel et al. 2011; Yan et al. 2015). The error bars indicate the best-fitting errors of the sSFR−density relations. It can be seen that SFGs in the LSS and the field share a similar α at given density indicators. sSFR−density relations are not affected by different mass limited samples. When using Σ15 or Σ20 as the density indicator, the density range is significantly compressed and the scaling relations suffer from large uncertainties.
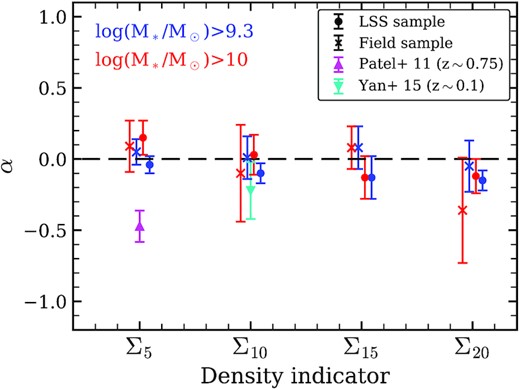
The slope of the density−sSFR relation versus density indicator. The blue and red symbols represent the samples with M* > 109.3 M⊙ and M* > 1010 M⊙, respectively. The crosses are the field samples and the dots are the LSS samples. The magenta and cyan symbols represent the results from Patel et al. (2011) and Yan et al. (2015).
We point out that our SFR measurements do not induce systematics that could bias our results on either the SFMS or the sSFR−density relation. We have shown that our SFMS is well consistent with those at the same redshift given in the literature, verifying that our SFR measurements are robust. On the one hand, as Patel et al. (2011) pointed out, the systematics induced by different SFR indicators only affect the normalization of the SFMS and the sSFR−density relation for both the field and the LSS. On the other hand, SED-based SFRs have a lower detection limit than that of the [O ii]-based SFRs. Vulcani et al. (2010) demonstrated a detection limit of 0.3 M⊙ yr−1 for the [O ii]-based SFRs. The SFRs of our SFGs sample are larger than 0.5 M⊙ yr−1, which have not reached the detection limit. Thus our conclusions based on the comparison between the two samples are not affected.
4.2 The effects of environment
Investigating the star formation properties of galaxies in the LSS is crucial for understanding the roles of environment on galaxy evolution. As shown in Fig. 7, sSFR is only weakly correlated with local density (Σ10) for SFGs in both the LSS and the field. There have been many works studying the correlations between star formation properties and environment from low-z to high-z, but giving controversial conclusions. Cooper et al. (2008) reported a negative sSFR−density correlation based on SDSS and DEEP2 data. However, some other studies reported a positive or no correlation at z < 1 (e.g. McGee et al. 2011; Muzzin et al. 2012; Koyama et al. 2013). Patel et al. (2011) found that sSFR decreases by 1 dex from the lowest to the highest environment at z ∼ 0.75. For a comparison, our results show a decrease of sSFR of only ∼0.2 dex, suggesting that high-density environment in the LSS has little effect on galaxy sSFR. We suspect that the discrepancy of the sSFR−density relations from those studies may be caused by the failure to take global environment and local environment into account. Although the dense environment does have some influence on star formation activity, our work indicates that star formation activity in the LSS is similar to that in the field. This likely indicates that interactions play a similar role both in the LSS and in the field at the same local density.
In the z = 0.735 LSS, we find that there are some filamentary substructures connecting five clusters. We suspect that the filamentary structures are transporting gas and galaxies into these clusters, which maintains the star formation activity of SFGs in the LSS. In addition, as indicated by the spec-z distribution, the line-of-sight velocity dispersion of the LSS is only σ ∼ 500 km s−1, which is far lower than that of the local massive structures, such as the Coma cluster (σ > 1000 km s−1). The global environment may affect the heating efficiency of gas in the structures through stellar and active galactic nucleus feedback or gravitational heating. For a thin sheet, the feedback energy and hot gas from galaxies escape easily from the sheet and gas in the sheet is much less affected. Moreover, most of the substructures in the z = 0.735 LSS seem have not reached dynamically relaxed and thus gravitational heating to the IGM is negligible. The gas cooling and accretion into galaxy haloes is still as efficient as that in the general fields. On the other hand, if the global environment lead the feedback injection and/or gravitational heating to the IGM more efficient, the gas cooling into a galaxy halo would become less efficient and galaxy star formation would decline compared to the general field at the same epoch.
We note that there has been a high fQGs in the dense environment at z = 0.7. van der Burg et al. (2020) points out that the QG fraction is higher in clusters than that in fileds at z ∼1.25. At high redshift, Wang et al. (2016) points out that the fQGs is similar to that in the field by studying a protocluster at z = 2. This means that the fQGs increases rapidly at z < 2. We believe that the cluster environment is critical for the transition from SFGs to QGs since z = 2. As already known, external- or internal-related mechanisms (known as ‘environment quenching’ and ‘mass quenching’) are both responsible for star formation quenching in galaxies (e.g. Peng et al. 2010; Old et al. 2020). The detailed discussion of ‘mass quenching’ is beyond the scope of this paper. Our results also indicate that the fQGs in the low-density environment of the LSS is similar to that in the field, indicating that the quenching of star formation is not sensitive to the large-scale environment, at least for our sample. In the medium-density environment, galaxy interaction frequently occurs, which can effectively consume or expel the gas in galaxies and may be an important mechanism for quenching. In the core of clusters, the interactions between galaxies and intra-cluster medium can effectively strip gas out of a galaxy and lead to quenching. Our results also suggest that galaxy clusters have little influence on the galaxies in the surrounding filaments.
4.3 The z = 0.735 LSS: a structure under assembly
In the z = 0.735 LSS, we identify five clusters and study the properties for four of them. Although we use large samples of member galaxies with spec-z to compute R200 and M200, and obtain a similar result as Dehghan & Johnston-Hollitt (2014), we remind that these results should be seen as the lower limits since the calculation of R200 and M200 is made under the assumption that these clusters are virialized systems. From our visual inspection, Cluster-C and Cluster-D contain substructures, which are considered to be independent groups in Dehghan & Johnston-Hollitt (2014). Cluster-A is ellipsoidal in morphology and has a very dense core, so it is the most likely cluster to have reached dynamic equilibrium. Cluster-B locates near the centre of the LSS and connects with other clusters. It hosts the largest number of member galaxies but smallest R200 and M200.
In Cluster-B, 40 per cent of the member galaxies are elliptical, and the elliptical fraction increases towards denser regions. In this cluster, the fraction of merging galaxies is up to 13 per cent. The actual fraction could be even higher since the selection of merging galaxies based on morphology would miss the merging between elliptical galaxies. Oh et al. (2018) studied low-z clusters and found that the merger fraction reaches 20 per cent. We argue that it is not surprising that a high fraction of merging galaxies is seen in unrelaxed clusters, since the galaxy interaction rate is expected to be high during the collapse of substructures of clusters.
5 SUMMARY
Using the publicly available phot-z and spec-z data combined with our new spectral observations with Magellan/IMACS MOS, we re-examine a LSS at z = 0.735 in the ECDF-S field. We select 732 galaxies with R < 24 mag at 0.72 ≤ z ≤ 0.75 belonged to the z = 0.735 structure. We carry out broad-band SED-fitting with CIGALE for galaxies at 0.69 ≤ z ≤ 0.78 to derive their physical parameters, including stellar mass and SFR. We pick up galaxies at 0.69 ≤ z < 0.72 and 0.75 < z ≤ 0.78 as the field sample for a comparison with the LSS sample. The substructures of the LSS, sSFR−density relation, M* −density relation, and morphology−density relation are addressed. Our results are summarized as follows:
The z = 0.735 LSS spanning 23.9 × 22.7 cMpc2 over the observed area consists of 732 member galaxies with R < 24 mag and a line-of-sight velocity dispersion of 494 ± 24 km s−1, yielding a galaxy number density ≳3.9 times that of the field, and suggestive of an overdense cosmic environment that is comparable to galaxy clusters at the same epoch.
Five substructures are identified in the LSS based on the spatial distribution of member galaxies. Considering their physical scale, these substructures are classified as galaxy clusters. Two of the clusters contain substructures (50 per cent), which are comparable to low-z clusters.
SFGs in both the z = 0.735 LSS and the field obey the similar sSFR−density relation, showing a weak dependence of sSFR on the local density. We demonstrate that this weak dependence is controlled by galaxy stellar mass-related scaling relation. Star formation activity of SFGs in either the field or the LSS exhibits no dependence on the local environment traced by Σ10. However, the fraction of QGs increases with the local density both in the LSS and in the field. The fQG in the low-density region of the LSS is similar to that of the galaxies in the field, which means that the LSS does not influence the quenching of the low-density-environment galaxies around it.
The morphology−density relation is presented for one cluster based on HST/ACS imaging. The fraction of merging galaxies is found to be relatively high, which is interpreted as a natural consequence during the dynamical relaxation process of a galaxy cluster.
Our results suggest that the z = 0.735 LSS is still in an assembly phase and far from being virialized. The SFGs in the dense regions are likely transported from the surrounding filamentary substructures. We thus stress that the cosmic environment overtakes the local environment in remaining galaxy star formation in at least some LSSs like the z = 0.735 one in the ECDF-S field.
ACKNOWLEDGEMENTS
The authors thank the anonymous referee for the useful and detailed comments and suggestions. This work is supported by the National Key Research and Development Program of China (2017YFA0402703), the National Science Foundation of China (11773076 and 12073078), the Major Science and Technology Project of Qinghai Province (2019-ZJ-A10), the science research grants from the China Manned Space Project with no. CMS-CSST-2021-A02 and CMS-CSST-2021-A07, and the Chinese Academy of Sciences (CAS) through a China-Chile Joint Research Fund (CCJRF #1809) administered by the CAS South America Centre for Astronomy (CASSACA). This research made use of astrophy, a community-developed core python package for Astronomy (Astropy Collaboration 2013).
DATA AVAILABILITY
The data underlying this article will be shared on reasonable request to the corresponding author.
Footnotes
REFERENCES
APPENDIX A: SOME EXTRA MATERIAL
Fig. A1: Example spectra in our observations.
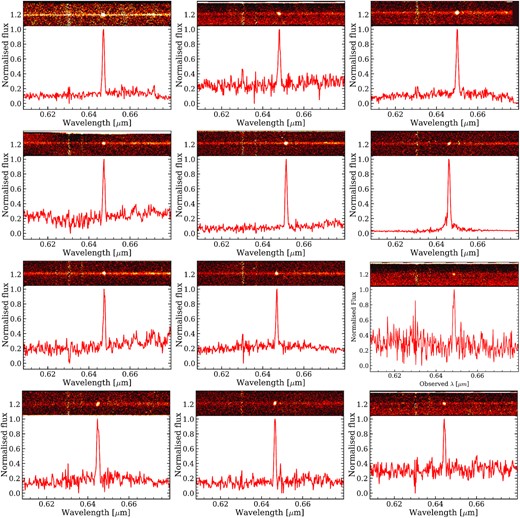
Example 1D and 2D spectrum.
Table A1: Column 1: slits ID in our observations; Column 2–6: objects id, coordinates, R-band magnitudes, and photometry redshifts come from COMBO-17 catalog; Column 7: spectroscopic redshifts.
The information of our observed galaxies.
| Slit | ID | RA | Dec. | R | phot-z | spec-z |
|---|---|---|---|---|---|---|
| (J2000) | (J2000) | (mag) | ||||
| S1-3 | 7448 | 03:32:36.02 | −28:00:34.7 | 23.05 | 0.626 | 0.7348 |
| S1-5 | 3419 | 03:32:29.29 | −28:02:27.6 | 23.18 | 0.751 | 0.6854 |
| S1-6 | 4783 | 03:32:28.68 | −28:01:49.1 | 22.58 | 0.697 | 0.7356 |
| S1-10 | 1069 | 03:32:15.19 | −28:03:30.3 | 23.06 | 0.695 | 0.7394 |
| S1-14 | 649 | 03:32:08.85 | −28:03:43.0 | 21.53 | 0.716 | 0.7878 |
| S1-26 | 4398 | 03:32:02.62 | −28:01:57.5 | 23.01 | 0.684 | 0.7380 |
| S1-38 | 12761 | 03:32:48.54 | −27:58:04.3 | 22.78 | 0.757 | 0.7754 |
| S1-40 | 9700 | 03:32:35.93 | −27:59:30.0 | 22.51 | 0.687 | 0.7351 |
| S1-42 | 13899 | 03:32:30.13 | −27:57:30.8 | 22.52 | 0.715 | 0.6914 |
| S1-44 | 8587 | 03:32:45.35 | −28:00:03.6 | 22.77 | 0.745 | 0.7813 |
| S1-52 | 9013 | 03:31:59.53 | −27:59:49.9 | 22.78 | 0.698 | 0.7377 |
| S1-56 | 13664 | 03:31:59.96 | −27:57:36.5 | 22.78 | 0.700 | 0.7362 |
| S1-64 | 11927 | 03:31:46.94 | −27:58:26.4 | 22.52 | 0.749 | 0.7379 |
| S1-71 | 18594 | 03:33:04.98 | −27:55:13.6 | 23.18 | 0.717 | 0.5803 |
| S1-77 | 16713 | 03:32:11.33 | −27:56:09.9 | 22.40 | 0.693 | 0.7370 |
| S1-80 | 19335 | 03:32:08.85 | −27:54:50.9 | 22.98 | 0.748 | 0.7361 |
| S1-86 | 19136 | 03:31:58.25 | −27:54:56.6 | 22.10 | 0.728 | 0.7370 |
| S1-92 | 14520 | 03:32:04.95 | −27:57:09.7 | 22.81 | 0.723 | 0.7997 |
| S1-93 | 17597 | 03:32:06.81 | −27:55:41.1 | 23.12 | 0.697 | 0.7370 |
| S1-96 | 15029 | 03:31:52.39 | −27:56:54.8 | 22.48 | 0.694 | 0.7432 |
| S1-102 | 15502 | 03:31:28.52 | −27:56:40.3 | 22.91 | 0.674 | 0.7530 |
| S1-105 | 18547 | 03:31:27.68 | −27:55:12.1 | 22.37 | 0.739 | 0.7475 |
| S1-106 | 19260 | 03:31:37.25 | −27:54:50.4 | 22.94 | 0.673 | 0.7006 |
| S1-107 | 20182 | 03:31:36.34 | −27:54:22.1 | 23.01 | 0.725 | 0.8139 |
| S1-108 | 22309 | 03:33:11.87 | −27:53:23.6 | 22.50 | 0.715 | 0.7364 |
| S1-111 | 21175 | 03:33:10.90 | −27:53:56.5 | 22.62 | 0.811 | 0.6893 |
| S1-113 | 23129 | 03:32:12.34 | −27:52:57.2 | 22.83 | 0.661 | 0.7309 |
| S1-114 | 24760 | 03:32:11.80 | −27:52:11.9 | 22.09 | 0.691 | 0.7305 |
| S1-117 | 27135 | 03:31:57.41 | −27:50:59.7 | 22.46 | 0.735 | 0.8094 |
| S1-118 | 23479 | 03:31:42.72 | −27:52:45.3 | 22.68 | 0.731 | 0.7357 |
| S1-120 | 24001 | 03:31:39.76 | −27:52:32.0 | 22.97 | 0.689 | 0.6813 |
| S1-121 | 25346 | 03:31:34.13 | −27:51:49.7 | 22.91 | 0.716 | 0.7846 |
| S1-122 | 26899 | 03:31:41.54 | −27:51:07.1 | 22.64 | 0.711 | 0.7467 |
| S1-123 | 26915 | 03:33:17.67 | −27:51:07.9 | 22.57 | 0.749 | 0.7070 |
| S1-124 | 24775 | 03:33:15.20 | −27:52:11.3 | 21.71 | 0.711 | 0.6906 |
| S1-130 | 29085 | 03:31:54.04 | −27:50:05.8 | 21.66 | 0.710 | 0.7426 |
| S1-131 | 31702 | 03:31:56.68 | −27:48:46.8 | 22.96 | 0.719 | 0.7325 |
| S1-134 | 28807 | 03:31:49.65 | −27:50:11.5 | 21.97 | 0.705 | 0.7362 |
| S1-144 | 37670 | 03:33:23.76 | −27:45:56.4 | 22.11 | 0.735 | 0.6627 |
| S1-147 | 35612 | 03:33:09.46 | −27:46:53.6 | 22.25 | 0.714 | 0.7339 |
| S1-149 | 38308 | 03:33:15.48 | −27:45:36.7 | 23.12 | 0.717 | 0.8379 |
| S1-150 | 37758 | 03:32:59.90 | −27:45:56.3 | 21.31 | 0.674 | 0.7338 |
| S1-157 | 34298 | 03:31:53.73 | −27:47:27.6 | 22.71 | 0.717 | 0.7345 |
| S1-160 | 38348 | 03:31:47.68 | −27:45:34.5 | 23.10 | 0.759 | 0.7357 |
| S1-161 | 38832 | 03:31:50.44 | −27:45:21.4 | 22.26 | 0.678 | 0.7322 |
| S1-179 | 46040 | 03:32:44.65 | −27:42:02.4 | 22.26 | 0.711 | 0.7090 |
| S1-181 | 47576 | 03:32:45.83 | −27:41:17.1 | 22.94 | 0.727 | 0.7323 |
| S1-187 | 43498 | 03:31:57.94 | −27:43:08.9 | 22.97 | 0.698 | 0.7294 |
| S1-188 | 46768 | 03:32:00.55 | −27:41:43.1 | 22.03 | 0.725 | 0.7286 |
| S1-209 | 53041 | 03:32:40.93 | −27:38:46.7 | 22.23 | 0.714 | 0.7366 |
| S1-210 | 53346 | 03:32:45.52 | −27:38:40.2 | 21.84 | 0.715 | 0.7341 |
| S1-211 | 53492 | 03:32:33.55 | −27:38:31.4 | 23.11 | 0.711 | 0.7330 |
| S1-212 | 52953 | 03:32:20.46 | −27:38:47.2 | 22.83 | 0.675 | 0.7350 |
| S1-225 | 57449 | 03:32:28.19 | −27:36:42.4 | 21.33 | 0.703 | 0.7333 |
| S1-232 | 42764 | 03:32:27.58 | −27:43:31.4 | 22.92 | 0.685 | 0.7380 |
| S1-233 | 40914 | 03:32:23.16 | −27:44:22.8 | 22.69 | 0.734 | 0.7373 |
| S1-250E | 3139 | 03:32:11.85 | −28:02:34.5 | 22.53 | 0.742 | 0.7017 |
| S1-285E | 29193 | 03:31:36.90 | −27:49:59.3 | 21.97 | 0.701 | 0.7167 |
| S1-291E | 38339 | 03:31:45.90 | −27:45:38.7 | 21.34 | 0.739 | 0.7372 |
| S1-292E | 38874 | 03:31:48.47 | −27:45:18.4 | 22.99 | 0.753 | 0.7375 |
| S1-314E | 40013 | 03:32:20.67 | −27:44:46.3 | 22.81 | 0.737 | 0.7252 |
| S2-9 | 7119 | 03:32:45.07 | −28:00:42.6 | 23.39 | 0.716 | 0.7329 |
| S2-16 | 827 | 03:32:13.54 | −28:03:36.1 | 23.39 | 0.666 | 0.7095 |
| S2-44 | 13095 | 03:32:44.67 | −27:57:52.1 | 23.86 | 0.711 | 0.7734 |
| S2-63 | 16957 | 03:32:55.95 | −27:56:00.5 | 23.88 | 0.730 | 0.7748 |
| S2-78 | 22528 | 03:32:04.35 | −27:53:14.2 | 23.45 | 1.285 | 0.7441 |
| S2-100 | 30432 | 03:31:46.83 | −27:49:22.8 | 23.94 | −99.0 | 0.7353 |
| S2-125 | 34954 | 03:31:42.76 | −27:47:07.3 | 23.36 | 0.808 | 0.7337 |
| S2-159 | 48680 | 03:32:55.30 | −27:40:46.9 | 23.84 | 0.692 | 0.7336 |
| S2-187 | 29357 | 03:32:54.45 | −27:49:55.5 | 23.90 | −99.0 | 0.7327 |
| S2-198 | 50082 | 03:32:28.98 | −27:40:06.2 | 23.90 | 0.616 | 0.7324 |
| S2-216 | 24627 | 03:32:18.57 | −27:52:12.8 | 23.43 | 0.805 | 0.7964 |
| S2-217 | 29835 | 03:32:22.09 | −27:49:39.9 | 23.74 | 1.103 | 0.7306 |
| S2-241E | 12150 | 03:32:05.23 | −27:58:18.2 | 23.47 | 0.604 | 0.7279 |
| S2-266E | 54514 | 03:32:38.59 | −27:38:03.3 | 23.88 | 0.754 | 0.7505 |
