


ABSTRACT
We present a comprehensive study of GRS 1915+105 in wide-energy band (0.5–60 keV) using AstroSat – SXT and LAXPC observations during the period of 2016–2019. The MAXI X-ray light curve of the source shows rise and decay profiles similar to canonical outbursting black holes. However, the source does not follow the exemplary ‘q’-diagram in the hardness–intensity diagram. Model independent analysis of light curves suggest that GRS 1915+105 displays various types of variability classes (δ, χ, ρ, κ, ω, and γ). We also report possible transitions from one class to another (χ → ρ, ρ → κ via an ‘unknown’ class and ω → γ → ω + γ) within a few hours duration. Detailed ‘spectrotemporal’ analysis indicates a gradual increase in the photon index (Γ) from 1.83 to 3.8, disc temperature (kTin) from 1.33 to 2.67 keV, and quasi-periodic oscillation frequency (ν) from 4 to 5.64 Hz during the rise, while the parameters decrease to Γ ∼1.18, kTin ∼1.18 keV, and ν ∼1.38 Hz, respectively, in the decline phase. The source shows maximum bolometric luminosity (Lbol) during the peak at ∼36 per cent of Eddington luminosity (LEdd), and a minimum of ∼2.4 per cent of LEdd during the decay phase. Further evolution of the source towards an obscured low-luminosity (Lbol of ∼1 per cent LEdd) phase, with a decrease in the intrinsic bolometric luminosity of the source due to obscuration, has also been indicated from our analysis. The implication of our results are discussed in the context of accretion disc dynamics around the black hole.
1 INTRODUCTION
Accretion powered X-ray binaries (XRBs) are binary systems consisting of a compact object − a neutron star or a black hole (BH), with a disc around it formed by accreting matter from a companion star. The XRBs provide ideal opportunity to probe a black hole and to understand the implications of general relativity by studying the strong gravitational influence of the source on the matter at the inner edge of the accretion disc. The XRBs are revealed during an X-ray activity (persistent or transient), which is triggered and fuelled by accretion of matter. Depending on the mass of the companion, the accretion of matter from the companion can happen via Roche lobe over flow for a low mass X-ray binary (LMXB) or through stellar winds in a high mass X-ray binary (HMXB) system (Petterson 1978; Blondin, Stevens & Kallman 1991). Most of the LMXBs discovered are transient in nature (King, Kolb & Burderi 1996; Chen, Swank & Taam 1997; van Haaften et al. 2015) i.e. they spend most of their time in quiescent phase where there is a steady mass transfer from the companion on to the compact object. Eventually, as the temperature in the disc increases, a thermal-viscous instability is triggered within the disc causing a rapid in-fall of matter on to the compact object leading to an X-ray outburst (Shakura & Sunyaev 1976; Hameury, King & Lasota 1990).
The outburst duration in a BH-XRB can range from several months to a few years. The energy spectrum of the BH-XRBs is usually characterized by a multicolour disc component (Shakura & Sunyaev 1973) resulting in soft X-ray photons, and Comptonization of the seed disc photons by the hot corona producing hard X-rays (Sunyaev & Titarchuk 1980; Lightman & Zdziarski 1987; Chakrabarti & Titarchuk 1995; Tanaka & Lewin 1995; Gilfanov 2010; Iyer, Nandi & Mandal 2015). The sources exhibit variability in their light curves which result in broad-band noise features in the power density spectrum (PDS) with or without the presence of QPOs (van der Klis 1995).
Based on the evolution of the energy spectra and temporal characteristics during an outburst, the BH source progresses sequentially through ‘canonical’ spectral states (Miyamoto et al. 1992; Homan et al. 2001; Belloni et al. 2005; Remillard & McClintock 2006; Dunn et al. 2010; Nandi et al. 2012) in the hardness–intensity diagram (HID). The HID exhibits a ‘q’-shaped plot trailed in an anticlockwise direction (Maccarone & Coppi 2003; Casella, Belloni & Stella 2005; Nandi et al. 2012; Radhika & Nandi 2014; Sreehari et al. 2019b; Sreehari & Nandi 2021 and references therein). The vertical branch emerging at the right edge of the HID represents the initial phase of the outburst where the source is in the Low/Hard State (LHS) with the spectrum dominated by the Comptonized component. The PDS is associated with strong fractional rms variability (∼30–40 per cent). The source then pivots to a horizontal track in the HID representing the transition to the hard intermediate state (HIMS) and then to the soft intermediate state (SIMS). The energy spectrum in both states are softer in nature with substantial contribution from the disc photons. The PDS displays remarkable differences during the HIMS and the SIMS. Prominent features like Type-C QPOs (see Wijnands, Homan & van der Klis 1999; Casella et al. 2005; Motta et al. 2011; Nandi et al. 2012; Radhika & Nandi 2014 for the definitions and characteristics of QPOs) along with a flat top noise are observed during the HIMS. A power law noise component with a drop in the fractional rms variability along with Type-A/B QPOs are seen in the PDS during the SIMS. The source diverts to the vertical branch in the left corner of the HID, thus making a transition to the high/soft state (HSS). The energy spectrum is dominated by a thermal disc component with weak rms variability in the PDS (∼1 per cent). The source reverts back to SIMS, HIMS, and LHS in the final stage of the ‘q’-shape. However, the persistent BH-XRBs like Cyg X−1 (Meyer-Hofmeister et al. 2020; Kushwaha, Agrawal & Nandi 2021), the aperiodically variable GRS 1915+105 (see the HID plotted in this paper), and a few black hole transients like 4U 1630–472 (Baby et al. 2020) and MAXI J0637–430 (Baby et al. 2021) do not follow the exact ‘q’-profile in the HID, and hence are an exception to this generalization.
The superluminal X-ray binary GRS 1915+105 was discovered by WATCH, an All Sky Monitor, on-board GRANAT during its outburst in 1992 August (Castro-Tirado, Brandt & Lund 1992). It had been exhibiting persistent brightness since its discovery till mid-2018, after which an exponential decrease in the X-ray flux was observed. This makes the source one of the most remarkable LMXB sources unlike others (e.g. XTE J1859+226, GRO J1655–40, 4U 1630–472, GX 339–4) which generally have long quiescence periods followed by an outburst lasting for months to a few years. Greiner et al. (2001) estimated the mass of the black hole in the binary system to be 14 ± 4 M⊙ with an orbital period of 33.5 d. The long orbital period indicated the large accretion disc that fuelled its long-lasting outburst. However, Reid et al. (2014), using VLT, identified the companion as a K-giant donor star. Through the trigonometric parallax, they estimated the distance to the source as 8.6|$_{-1.6}^{+2.0}$| kpc and the mass of the BH was revised to 12.4|$_{-1.8}^{+2.0}$| M⊙. Recent studies by Sreehari et al. (2020) also reveal the mass of the BH to be around 12.44–13.09 M⊙ with a spin value of 0.99–0.997. GRS 1915+105 was one of the first Galactic source to display apparent superluminal radio ejections with the characteristics of a microquasar (Mirabel & Rodríguez 1994).
GRS 1915+105, throughout its 28 yr long extreme X-ray activity, has displayed diverse variability in its light curve. It has, so far, exhibited 15 classes of variability (Belloni et al. 2000; Klein-Wolt et al. 2002; Hannikainen et al. 2005) namely α, β, γ, δ, θ, κ, λ, μ, ν, ρ, ϕ, χ, ω, η, ξ. These classes could be structured down to transition between three states; quiescent state C − where the flux is relatively low, outburst state B − where the count rate is high in the light curve with red-noise like variability in it, and flare state A − where flux is seen to be rapidly varying between the two flux levels (Belloni et al. 1997a, 2000).
Based on short- and long-term observations of the source, the ‘spectrotemporal’ characteristics associated with each class have been widely studied hitherto, thus giving an idea about the accretion dynamics around the source within a particular class and/or during a class transition. GRS 1915+105 has so far exhibited low frequency QPOs (LFQPOs) in 0.1–10 Hz and high frequency QPOs (HFQPOs) at 34 Hz, 41 Hz, and 67 Hz (Strohmayer 2001; Belloni & Altamirano 2013; Belloni et al. 2019; Sreehari et al. 2020). Type-C QPOs in the frequency range 2–5.4 Hz, during χ variability class, have been reported by Zhang et al. (2015) and Misra et al. (2020). Tomsick & Kaaret (2001) investigated the properties of strong 0.8–3 Hz QPOs in 60–124 keV energy band during the LHS and observed the decrease in QPO amplitude at high energies. During ρ variability class, QPOs at frequencies 6–8 Hz were observed. Naik et al. (2002b) report a strong correlation between the QPO frequency and the source flux which was also assessed by noticing the presence of QPO at different frequencies during burst and quiescent phase in class α. The overall change in the broad-band noise and the strength of the QPO during a class transition from class χ to the ‘heart-beat’ state was studied by Rawat et al. (2019). The correlation between the QPO frequency in the 1–10 Hz range and the duration of the quiescent phases are emphasized by Chakrabarti & Manickam (2000). The energy dependence of LFQPOs in GRS 1915+105 was investigated by Rodriguez et al. (2002) and it was concluded that the frequency variations are better correlated with the soft X-ray (2–5 keV) flux.
In the spectral domain, Rao & Vadawale (2001) deduced a specific combination of models to describe the spectrum of the source during each class. The spectral characteristics during HSS (δ class) is described using a multicolour disc blackbody with a power law, while that for LHS (χ class) consists of a Comptonization component due to hot plasma along with the disc component. The LHS with steady radio emission requires an additional power-law component. The spectra of the source during states B and C were studied by Zdziarski et al. (2001), where Comptonization of disc photons from a hybrid plasma, a plasma distribution consisting of thermal and non-thermal electrons, is discussed (see also Zdziarski et al. 2005). For the χ and θ classes, spectral variabilities in 2–120 keV energy band were studied by Ueda et al. (2010) and a dominant Comptonizing component at low electron temperature was observed. The investigation of spectral variabilities during the ρ and α classes by Naik et al. (2002b) revealed a steady disc temperature and optical depth of the Compton cloud identical for both classes and inferred that the source spectrum is identical during the burst and quiescent phases. The nature of the accretion disc of the source during soft and steady conditions were studied by Ueda, Yamaoka & Remillard (2009) for the classes χ, γ, and ϕ. The spectrum during ϕ variability showed a dominating Comptonization component, in disparity with a typical soft-state spectrum where minimal Comptonized component and a maximum disc component are observed. Similarly, an increased Comptonized flux contribution was observed in the source by Pahari & Pal (2010) during the ω class.
After a year of steady low X-ray activity since 2018 June, the source exhibited a few unexpected sequence of events like an unusual low luminosity phase (Homan et al. 2019a) subsequently followed by several X-ray rebrightenings with associated radio flares (Iwakiri et al. 2019; Trushkin et al. 2019a) throughout the year 2019. Recent studies explore the possibility of internal obscuration in the system since 2019 May (Miller et al. 2020; Balakrishnan et al. 2021; Koljonen & Hovatta 2021; Motta et al. 2021). Miller et al. (2020) detected absorption lines that reflected the signature of obscuration. Study of Swift data by Balakrishnan et al. (2021), reveals the similarities in the spectra of GRS 1915+105 with that observed in highly obscured Seyfert-2 AGN. Koljonen & Hovatta (2021) discuss the possible fate of the outburst; that is, the eventual return of GRS 1915+105 to quiescence or continued activity, while the source is in a heavily obscured but intrinsically bright accretion state.
In this paper, we perform a systematic and detailed study of the source, GRS 1915+105, for the period of 2016–2019 using AstroSat observations and characterize the source behaviour. We study the long-term MAXI (Matsuoka et al. 2009) light curve of the source and investigate its possible similarity with the rise and decay pattern of the general outburst profile of a canonical outbursting BH source. The HID of the source is also examined to track the evolution of the source through different spectral states and a detailed comparison with canonical BHs is performed. We explore in depth ‘spectrotemporal’ properties during the different class variabilities exhibited by the source. The evolution of the broad-band ‘spectrotemporal’ features, nature of the light curve, and colour–colour diagram (CCD) of the source as it evolves through different classes are investigated. Evolution of the characteristics during the three years of observation period are studied to understand the variation of spectral and temporal parameters, and thereby compare with canonical BH transients.
This paper is structured as follows: In Section 2, we present the details of AstroSat observations of the source and describe the process of data reduction using SXT and LAXPC pipeline software. In Section 3, we briefly describe the different analyses and modelling procedures applied to study the temporal and spectral properties of the source. We present the results obtained from our analyses in Section 4 and interpret the same by considering the scenario of accretion dynamics, and arrive at our conclusions in Section 5.
2 OBSERVATIONS AND DATA REDUCTION
AstroSat (Agrawal 2006) is India’s first satellite launched exclusively for astronomical studies and is capable of studying various celestial objects in near and far-UV, soft (0.3–8 keV) and hard X-rays (3–100 keV) by means of four co-aligned instruments: Ultraviolet imaging telescope (UVIT) (Tandon et al. 2017), soft X-ray telescope (SXT) (Singh et al. 2016, 2017), large area X-ray proportional counter (LAXPC) (Yadav et al. 2016; Antia et al. 2017), and the cadmium zinc telluride imager (CZTI) (Bhalerao et al. 2017). We exclusively consider all the available SXT and LAXPC observations of GRS 1915+105 for our study during the period of 2016–2019. The spectral coverage in 0.3–8 keV by SXT along with the advantage of large effective area of LAXPC in 3–80 keV, jointly provide a wide-band spectral view. The temporal resolution of LAXPC of 10 |$\mu$|s also provides excellent opportunity for detecting QPOs in a wide range of frequencies (Yadav et al. 2016; Verdhan Chauhan et al. 2017; Sreehari et al. 2020).
AstroSat observations of GRS 1915+105 between 2016 November to 2019 June were carried out as a part of Announcement of Opportunity (AO), Guaranteed Time (GT), and Target of Opportunity (ToO) cycles. Table 1 represents the list of all the AstroSat observations of GRS 1915+105 during this period, along with the effective exposure time and average count rate for each Epoch of observation. We also mention the segments, i.e. the time interval in light curve having continuous observation which also excludes the orbit constraints like South Atlantic Anomaly (SAA) passage of the spacecraft. The level-2 data of SXT and level-1 data of LAXPC for all the observations at various Epochs were obtained from the ISSDC data dissemination archive.1 We also extract the MAXI light curve within this period to study the long-term evolution of the source.
Log of X-ray observations of GRS 1915+105 from 2016 November to 2019 June using SXT and LAXPC onboard AstroSat. The source count rate and variability classes (see Sections 4.2 and 4.3) are also included along with exposure times. Also quoted is the segment number corresponding to the time interval in light curve with continuous observation. Here, IM corresponds to an intermediate state, while HB (ρ′) represents a ‘heart-beat’ state. The first observation, MJD 57705.50 corresponds to 2016 November 13.
| Observation ID | MJD | Epoch | Segment | Exposure time (ks) | Average count rate (cts s−1) | Variability class | ||
|---|---|---|---|---|---|---|---|---|
| Start time | SXT | LAXPC | SXT | LAXPC | ||||
| G06_033T01_9000000792 | 57705.50 | 1 | 3 | 0.89 | 2.68 | 78 | 3230 | δ |
| G06_033T01_9000001116 | 57840.87 | 2 | 1 | 1.22 | 3 | 21 | 860 | |$\chi \longrightarrow$| IM |$\longrightarrow \chi \longrightarrow$| HB (ρ′) |
| G07_046T01_9000001124 | 57844.07 | 3a | 1 | 1.02 | 2.04 | 24 | 810 | χ |
| 57844.13 | 3b | 2 | 1.15 | 2.52 | 26 | 845 | IM | |
| 57844.21 | 3c | 3 | 1.14 | 2.15 | 27 | 815 | χ | |
| 57844.53 | 3d | 8 | 1.28 | 2.58 | 26 | 980 | HB (ρ′) | |
| G07_046T01_9000001162 | 57857.59 | 4 | 6 | 1.45 | 3 | 24 | 775 | HB (ρ′) |
| G07_028T01_9000001166 | 57858.82 | 5 | 3 | 1.36 | 3 | 23 | 770 | HB (ρ′) |
| G07_028T01_9000001232 | 57891.82 | 6a | 2 | 2.07 | 3 | 20 | 635 | HB (ρ′) |
| 57891.89 | 6b | 3 | 1.03 | 3 | 19 | 670 | HB (ρ′) | |
| G07_046T01_9000001236 | 57892.50 | 7a | 3 | 1.22 | 3 | 19 | 660 | ρ |
| 57892.70 | 7b | 6 | 2.09 | 3 | 17 | 660 | ρ | |
| G07_028T01_9000001272 | 57909.76 | 8 | 1 | 1.19 | 2.43 | 26 | 1060 | ‘Unknown’ |
| G07_046T01_9000001274 | 57910.11 | 9a | 13 | 2.26 | 2.86 | 27 | 1055 | ‘Unknown’ |
| 57910.63 | 9b | 14 | 1.74 | 0.78 | 27 | 1145 | ‘Unknown’ | |
| G07_028T01_9000001370 | 57943.71 | 10 | 2 | 2.26 | 3 | 23 | 1250 | κ |
| G07_046T01_9000001374 | 57946.42 | 11 | 14 | 1.99 | 2.73 | 34 | 1500 | κ |
| G07_028T01_9000001406 | 57961.39 | 12 | 3 | 1.67 | 1.97 | 31 | 1750 | κ |
| G07_046T01_9000001408 | 57961.64 | 13 | 2 | 2.28 | 3 | 42 | 2230 | κ |
| G07_028T01_9000001500 | 57995.33 | 14 | 5 | 1.67 | 2.71 | 56 | 1080 | ω |
| G07_046T01_9000001506 | 57996.55 | 15 | 2 | 2.18 | 3 | 38 | 2970 | ω |
| G07_046T01_9000001534 | 58007.66 | 16a | 2 | 1.95 | 2.78 | 69 | 3085 | ω |
| 58008.05 | 16b | 11 | 0.68 | 1.47 | 73 | 3450 | γ | |
| 58008.19 | 16c | 14 | 0.93 | 2.32 | 62 | 3240 | ω + γ | |
| G07_028T01_9000001618 | 58041.42 | 17 | 1 | 1.32 | 2.63 | 111 | 4340 | δ |
| A04_180T01_9000001622 | 58045.94 | 18 | 2 | 2.6 | 2.41 | 54 | 4015 | δ |
| A04_042T01_9000001630 | 58047.36 | 19 | 2 | 1.23 | 3 | 101 | 3830 | δ |
| G08_028T01_9000001656 | 58058.18 | 20 | 2 | 1.10 | 3 | 54 | 1655 | δ |
| A04_180T01_9000002000 | 58209.13 | 21 | 1 | 1.25 | 2.8 | 45 | 1700 | χ |
| G08_028T01_9000002006 | 58211.76 | 22 | 1 | 2.19 | 3.0 | 42 | 1480 | χ |
| G08_028T01_9000002080 | 58246.66 | 23 | 8 | 1.84 | 3.0 | 17 | 720 | χ |
| G08_028T01_9000002110 | 58260.60 | 24 | 3 | 2.11 | 2.98 | 16 | 630 | χ |
| G08_028T01_9000002112 | 58262.77 | 25 | 3 | 2.16 | 2.82 | 17 | 610 | χ |
| G08_028T01_9000002220 | 58313.57 | 26 | 3 | 2.26 | 3.0 | 7 | 360 | χ |
| G08_028T01_9000002306 | 58344.70 | 27 | 2 | 2.36 | 2.95 | 5 | 305 | χ |
| G08_028T01_9000002334 | 58358.10 | 28 | 1 | – | 2.74 | – | 295 | χ |
| A05_173T01_9000002812 | 58565.98 | 29 | 3 | 1.11 | 3 | 6 | 300 | χ |
| T03_116T01_9000002916 | 58618.09 | 30 | 19 | 1.84 | 2.54 | 2 | 100 | χ(with flares) |
| T03_117T01_9000002988 | 58648.51 | 31 | 18 | 2.19 | 2.78 | 1 | 95 | χ |
2.1 MAXI observations
GRS 1915+105 was continuously monitored by the Gas Slit Camera (GSC) onboard Monitor of All sky X-ray Imaging (MAXI) mission (Mihara et al. 2011) during the period of AstroSat observations. We, therefore, use MAXI mission data obtained from MAXI/GSC on-demand web interface2 to study the light curve in 2–20 keV, and Hardness Ratio (HR) of the source as ratio of count rates in 6–20 keV and 2–6 keV, as shown in the top and bottom panels of Fig. 1, respectively. The figure also highlights the AstroSat observations of the source in black vertical lines corresponding to the different Epochs. With the intention of comparing the evolution of the source with the canonical evolution of an outbursting BH, we obtain MAXI observations of GX 339–4 during its outburst in 2010–2011 for the same energy ranges.
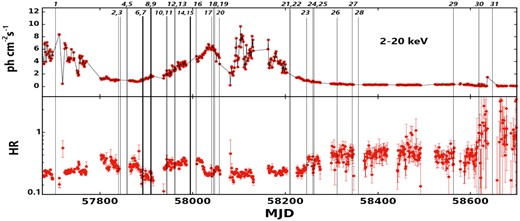
Light curve of GRS 1915+105 as observed with the MAXI/GSC from 2016 July to 2019 June in 2–20 keV range (top panel). The hardness ratio, defined as the ratio between the X-ray count rate in 6–20 keV and 2–6 keV, is plotted in the bottom panel. The AstroSat observations of GRS 1915+105 during the Epochs mentioned in Table 1 are marked with vertical black lines along with their Epoch numbers.
2.2 SXT data reduction
We obtained SXT Level-2 data generated by the latest Level-2 SXTPIPELINE VERSION 1.4breleased in 2019 January. The Photon Counting (PC) mode data were chosen for the analysis during all the Epochs. The extraction of SXT data was performed following the guidelines provided by the SXT team3 and following Sreehari et al. (2019b), Baby et al. (2020). The tools for SXT data extraction along with the background, spectral response, and effective area files are provided by the SXT instrument team3. All the events from individual orbits belonging to each observation were merged into a single clean merged event file using Julia based SXTevtmerger script. xselectv2.4g was used to generate the light curve, spectrum, and image from the merged event file. In order to implement simultaneous analysis of SXT and LAXPC data, we chose one segment from each observation with a minimum of 1 ks exposure time. We also made sure that simultaneous LAXPC observation was available for the selected good time interval (GTI). We, therefore, filtered the GTI accordingly before generating the light curve, spectrum, and the image. We initially attempted to include the source data points within a circular region of 13–16 arcmin radius for extraction which contained 88–93 per cent of event-list. However, during certain Epochs none of these regions could be accommodated within the field of view (FOV) due to off-axis pointing. We, therefore, used a circular region of 12 arcmin (enclosing ∼85 per cent of event-list) for extraction during all the observations. None of the epochs showed pile up (> 40 cts s−1 as indicated in the AstroSat Handbook)4. sxtARFModule provided by SXT instrument team3 is used to generate the suitable ARF file for the selected region by applying correction for any offset pointing. Fig. 2 shows SXT image generated for GRS 1915+105 during segment 3 of Epoch 1 (see Table 1). The green circle of 12 arcmin radius encloses the extracted region.
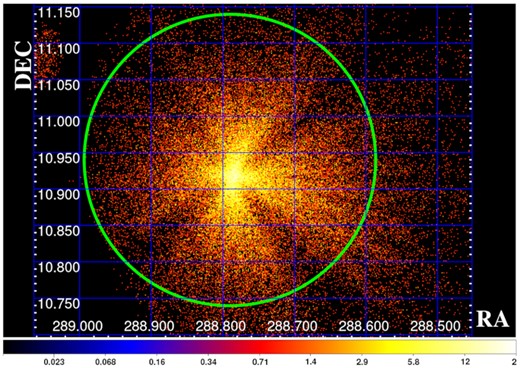
AstroSat/SXT image of GRS 1915+105 corresponding to segment 3 of Epoch 1, obtained using PC mode, is shown. The green circle of 12 arcmin radius encloses the extracted region of the source.
2.3 LAXPC data reduction
Level-1 LAXPC data are converted to level-2 using Laxpcsoft v 3.1.25 released on 2020 February 15, following procedures described in Antia et al. (2017). Amongst the three LAXPC detectors (LAXPC 10, LAXPC 20, LAXPC 30) onboard AstroSat, we analysed data from LAXPC 20, since LAXPC 30 and LAXPC 10 exhibited some abnormal gain changes during 2018.6LAXPC data extraction and processing was performed following Agrawal et al. (2018), Sreehari et al. (2019b) to obtain the source spectra and light curves. The GTI was considered, thereby the background and spectral response were generated as mentioned in Antia et al. (2017). In order to align the background and source spectra from LAXPC instrument, the code backshiftv2.e was used. The background model chosen for an observation of the source during a particular time corresponds to the closest background model made available by LaxpcSoft v 3.1.2 for that particular observation period. In order to retain minimal residue in the spectrum beyond 30 keV, we opt for single event, top layer data from LAXPC 20 to generate spectra and light curves in 3–60 keV range (Sreehari et al. 2019b, 2020).
3 ANALYSIS AND MODELLING
3.1 Temporal analysis
Initially, we generated a background corrected LAXPC light curve with a time bin of 1 s in the energy range of 3–60 keV. The 1 s binned background corrected light curves in the energy ranges 3–6, 6–15, and 15–60 keV were also generated in order to plot the CCD. In comparison, the corresponding energy ranges are 2–5, 5–13, and 13–60 keV in Belloni et al. (2000) for generating CCDs. The bottom left-hand and bottom right-hand panels of Fig. 3 show the light curves corresponding to Epochs 1 and 21 in 3–60 keV, respectively. The top left-hand and top right-hand panels of Fig. 3 represent the CCDs corresponding to the same Epochs, where hard colour, HR2 (ratio of count rates in 15–60 and 3–6 keV ranges), is plotted against the soft colour, HR1 (ratio of count rates in 6–15 and 3–6 keV ranges). We then generated 0.01 s time resolution light curve in the energy band 3–60 keV to obtain PDS with 65 536 bins resulting in a Nyquist frequency of 50 Hz (1/(2 × 10 ms)) and a lowest frequency of 0.001 Hz (1/(65536 × 10 ms)).
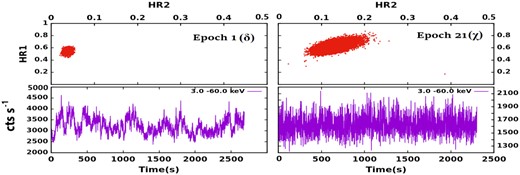
Background subtracted light curve (3–60 keV) and CCD of GRS 1915+105 corresponding to Epoch 1 (left-hand panel) and Epoch 21 (right-hand panel), both binned at 1 s. The CCD is plotted as HR1 versus HR2, where HR1 is the ratio between the count rate in 6–15 keV and 3–6 keV ranges and HR2 is the ratio between the count rate in 15–60 keV and 3–6 keV ranges. See the text for details.
The PDS was geometrically re-binned by a factor of 1.05 and also normalized to the rms space (Belloni & Hasinger 1990; Nowak et al. 1999). The total rms variability of the PDS was computed for the frequency range 0.01–50 Hz using the rectangle rule integration method (Riemann 1867) as rms = |${\sqrt{(P(\nu)\times \delta \nu)}}\times 100$| (in per cent) (see also Radhika et al. 2018 and references therein), where P(ν) is units of rms2Hz−1 and δν is the frequency interval width in Hz. The error for rms was estimated by propagating the error on power and δν. The broad-band noise components associated with the PDS were fitted using multiple Lorentzians and powerlaw (Belloni, Psaltis & van der Klis 2002; Motta et al. 2012). Any narrow features observed in the PDS were modelled with a Lorentzian and those features with Q-factor |$\big (\textrm {Q} = \frac{{\it v}}{\Delta {\it v}}\big)$| ≥3 (van der Klis 2000) and Significance (σ = |$\frac{Norm}{ {Err}_\textrm {norm}}$|) ≥3 (Belloni, Sanna & Méndez 2012; Alam et al. 2014; Sreehari et al. 2019b) were classified as QPOs. Here, ν is the QPO frequency, Δv is its full width at half-maximum (FWHM), Norm is the normalization of the Lorentzian and Errnorm is the negative error in norm value (see also van der Klis 1989; van der Klis 1995; Remillard & McClintock 2006; Radhika & Nandi 2014; and references therein). The QPO-rms amplitude in percentage was obtained by finding the area under the Lorentzian corresponding to the QPO feature.
3.2 Spectral analysis
Broad-band spectral analysis and modelling across 0.7–60 keV (SXT: 0.7–7 keV and LAXPC: 3–60 keV) range was performed using XSpec v12.10.1f (Arnaud 1996) and HEASOFT v6.26. While performing the simultaneous fit, a normalization constant was taken into account in order to address the difference in calibration between the two instruments. A systematic error of 2 per cent was incorporated to both SXT and LAXPC data in the spectral fitting as suggested in SXT user manual7 and Antia et al. (2017). A gain fit command with the slope fixed to 1 was used to alter the SXT response to fit the edges at 1.8 and 2.4 keV produced due to Si and Au edges (see Singh et al. 2017 and Neil Gehrels Swift-XRT website8). SXT data were grouped with 25 counts in each bin before fitting. The interstellar absorption was taken into account with the TBabs model implementing the Galactic elemental abundance (Wilms, Allen & McCray 2000). The hydrogen column density (nH) was kept free for most of the observations and found to vary from ∼5–6.5 × 10²² atoms cm−2, which is comparable to the previous estimates (Yadav et al. 2016; Sreehari et al. 2020).
The best spectral fit for all the epochs was obtained with different combinations of two model components: (1) multicolour disc blackbody diskbb to address the soft X-ray emission from the disc al. (Mitsuda et al. 1984; Makishima et al. 1986), (2) thermal Comptonization nthcomp (Zdziarski, Johnson & Magdziarz 1996; Życki, Done & Smith 1999). A non-thermal hard component powerlaw was also occasionally used (see Sreehari et al. 2020). The sporadic appearances of fluorescent Fe line emission in 6–7 keV and smeared edge profile at ∼8 keV were addressed using Gaussian and smedge components, respectively. An additional edge was considered for the instrumental Xenon edge at ∼33 keV (Antia et al. 2017; Sreehari et al. 2019b).
We initially modelled the SXT data using the model combination – TBabs(diskbb), which resulted in a good fit for all the Epochs with physically reasonable parameter values. We then extended the above combination to fit the broad-band SXT and LAXPC spectrum. The combination of models, TBabs*constant(diskbb+nthcomp), hereafter referred to as Model-1, was used to fit all the Epochs. Here, we set the seed temperature in nthcomp model to inner disc temperature in diskbb model so as to constrain the value of disc temperature (kTin). The fit obtained for Epoch 2 using Model-1 yielded a χ2/dof of 562.12/446. Further, Gaussian and edge components were added to Model-1 in order to fit the Fe line emission at 6.9 keV and the Xenon edge at 34.6 keV. The combination of models TBabs*constant(diskbb+Gaussian+edge*nthcomp) gave the best-fitting parameters for Epoch 2 with a χ2/dof of 559.91/513. However, for Epoch 12, nthcomp model alone could not produce a satisfactory fit in the high energies. For example, the spectral fit of Epoch 12 data using Model-1 produced a χ2/dof of 667.46/439. We, therefore, incorporated an additional powerlaw model component to fit at the high energy range. This significantly improved the χ2/dof to 629.41/527 resulting in a F-test probability of 7 × 10⁻¹⁵. In order to ensure that the additional component is not a result of any statistical fluctuation (Protassov et al. 2002), we performed simulations using the simftest9 script from xspec (Bhalerao et al. 2015; Lotti et al. 2016; and references therein) to generate 1000 fake spectra. The maximum change in fit-statistic (Δχ2) obtained from our simulations was 10, whereas the actual Δχ2 for the data was 161, which is way higher than those obtained from simulations and hence reconfirms the significance of the additional powerlaw component. This combination of models, TBabs*constant(diskbb+nthcomp+powerlaw), will hereafter be referred to as Model-2.
We also computed the total unabsorbed flux along with the individual contributions from the disc and Comptonized components by implementing the cflux model, in the energy range 0.7–40 keV. The bolometric luminosity of the source is calculated for the energy range 0.3–100 keV, using the formula, L = flux × (4πD2) (Frank, King & Raine 1985), where D is the distance to the source in kpc (8.6 kpc; see Section 1). However, in this paper, the luminosity of the source is described in terms of Eddington luminosity (LEdd), where LEdd ≈ 1.3 × 1038(M/M⊙) erg s−1 (Rybicki & Lightman 1986).
In the following section, we present the results based on our in-depth analysis of the light curve, HID, CCD, PDS, and energy spectra.
4 RESULTS
4.1 Light curve and hardness-intensity diagram (HID)
The long term variation of the source intensity observed by MAXI from MJD 57700 (2016 November 8) to 58700 (2019 August 5) within the energy band of 2–20 keV is shown in the top panel of Fig. 1, while the bottom panel shows the variation of HR with time. The source is initially spotted to be in a high X-ray activity phase with flux value greater than 8 ph cm−2 s−1 and HR value between 0.28 and 0.32. The flux decreased to ∼1.5 ph cm−2 s−1 as it reached Epoch 2, ∼100 d after the first MAXI observation. The flux remained relatively low for ∼100 d, until it reached Epoch 7, which was also associated with an increase in HR to 0.4–0.5. The source, however, showed an unusual dip in the HR during Epochs 6 and 7. Post Epoch 7, there was a slow rise in the intensity (over ∼140 d) towards the peak, till Epoch 17. The HR values varied between 0.35 and 0.5. The source then exhibited a highly variable flux between MJD 58100 to 58180 (Epochs 20 and 21 for ∼180 d). There was a corresponding drop in the HR to ∼0.3. Subsequent to Epoch 21, the source showed decreasing X-ray activity and beyond MJD 58300 (2018 July 1), the flux remained steadily low. The HR value increased from 0.5 to 1 during the Epochs 21 to 29 corresponding to the hard state of the source, except Epoch 30 and 31, where the HR value increased suddenly from 1 to 6. Further increase in the HR, beyond MJD 58600, corresponds to the ‘harder’ spectral states exhibited by the source. Similar high HR values (>2) have been observed earlier in a few other BH binaries (Sreehari & Nandi 2021) including MAXI J1535–571 (Baglio et al. 2018; Shang et al. 2019; Sreehari et al. 2019b), XTE J1752–223 (Chatterjee et al. 2020) etc., during their hard state.
The HID of GRS 1915+105, starting from MJD 57800 to 58700 (2017 February 16 to 2019 August 5), is shown in Fig. 4, where the MAXI flux in 2–20 keV range is plotted against the X-ray colour (HR). The chronic variation of HR (Fig. 4) is explained in comparison to the flux variation with time seen in the light curve (Fig. 1). The black arrows in Fig. 4 represent the direction of evolution of the source during the entire observation period. The first arrow (Arrow – 1) tracks the HR variation from MJD 57800 to MJD 57960 (green), corresponding to the initial low luminosity phase of the light curve. Arrow – 2 shows the variation in HR during the rising phase between MJD 57960–58200 (blue). Arrow – 3 tracks the HR variation during the low intensity phase of the light curve from MJD 58200 to MJD 58600 (blue to yellow), while Arrow – 4 represents for observations beyond MJD 58600 (red).
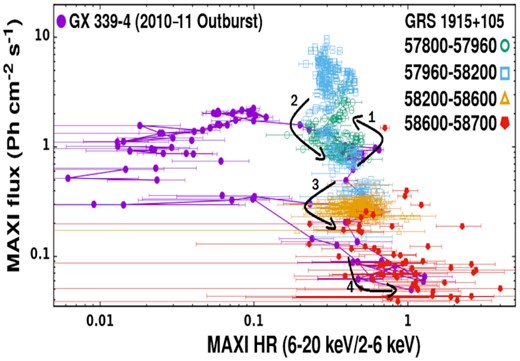
Hardness–intensity diagram (HID) of GRS 1915+105 showing evolution of hardness ratio (6–20 keV/ 2–6 keV) with MAXI 2–20 keV flux from MJD 57800 (2017 February 16) to MJD 58700 (2019 August 5). The numbered black arrows in the figure denote the direction of evolution of GRS 1915+105 along the HID. The green circles (Arrow-1) represent points from MJD 57800 (2017 February 16) to MJD 57960 (2017 July 26); the blue squares (Arrow-2) correspond to data points starting from MJD 57971 (2017 July 27) to MJD 58200 (2018 March 23). The yellow triangles (Arrow-3) represent the data points starting from MJD 58200 (2018 March 23) to MJD 58600 (2019 April 27), and the red points (Arrow-4) represent the data points from MJD 58600 (2019 April 27) to MJD 58700 (2019 August 5); the purple points represent the HID of GX 339–4 during its 2010–11 outburst. See the text for details.
In order to compare the evolution of HID with that of canonical LMXB BH transients, we have overplotted in Fig. 4 the HID of GX 339–4 during its 2010–11 outburst using data obtained from MAXI (represented by the purple points). The energy range chosen to plot the HID for GX 339–4 is the same as that of GRS 1915+105. This comparison between the HIDs is done by considering a few differences and similarities between the sources, and their possible effects on the HID. GRS 1915+105 is located at a distance of ∼8.6 kpc with an absorption column density of ∼5 × 10²² atoms cm−2, while GX 339–4 is located at a distance of 8–12 kpc (Zdziarski, Ziółkowski & Mikołajewska 2019) with an absorption column density of ∼0.5 × 10²² atoms cm−2 along the line of sight (Nandi et al. 2012). The relatively high nH value of GRS 1915+105 results in a higher absorption of low energy photons from the source. This causes an apparent increase in the HR of GRS 1915+105 with respect to that of GX 339–4 for the same flux, thus making it difficult to compare/quantify the HR of both sources. Never the less, we choose to compare the evolution of GRS 1915+105 with that of GX 339–4, in view of the similarity in the light curves of both sources, since GRS 1915+105 shows a rise and decay profile (Fig. 1) similar to canonical outbursting black holes.
The HID of GX 339–4 during the outburst shows a typical ‘q’-shaped track, with the HR varying from 1.6 to 1.2 during the hard state branch, 1.2 to 0.25 while in the HIMS, 0.25 to 0.06 during the SIMS, and 0.06 to 0.01 in the soft branch. The HIMS and the SIMS are seen as elongated horizontal branches in the HID. The left vertical and right vertical branches indicate the LHS and the HSS, respectively. During each spectral state, GX 339–4 exhibits a definite pivot in its path in the HID, thus exhibiting the ‘q’-shaped track. However, in case of GRS 1915+105, no particular structure could be assigned to its HID. The HR varies from 0.2 to 0.5 during the rising phase, 0.2 to 0.7 during the peak phase, and 0.3 to 0.8 during decay phase of the light curve. Beyond MJD 58600, the HR is seen to vary from 0.5 to 4. Every phase of the light curve of GRS 1915+105 occupies common range of HR values, whereas GX 339–4 has a distinct HR range corresponding to each phase of its light curve. A broad variation is seen in the HR of GX 339–4 during the intermediate states corresponding to the rise/decay of the flux in the light curve. This broad variation in the HR is not observed in GRS 1915+105. GX 339–4 also shows a significant drop in the luminosity as the source makes a transition from the SIMS to the Soft state (Cadolle Bel et al. 2011; Nandi et al. 2012). This drop in the luminosity (hysteresis) is also not very clearly noticed in GRS 1915+105. GRS 1915+105 shows an evolution in the intermediate state similar to another persistent source GRS 1758–258 (Obst et al. 2011) eventually returning to the LHS.
In the following sections, we have presented the broad-band ‘spectrotemporal’ features exhibited by the source during the AstroSat observations based on multiple criteria: (1) when the source is seen to be exhibiting features corresponding to a particular variability class, (2) when the source makes transitions from a ‘defined’ class to another class, and (3) the overall evolution of the spectral and timing parameters during the period of observations as mentioned in Table 1.
4.2 Broad-band features of ‘Canonical’ class variabilities
4.2.1 Class δ [Epochs – 1, 17, 18, 19, and 20]
The X-ray light curves obtained from Epochs – 1, 17, 18, 19, and 20 displayed a rather stable count rate superposed with red noise variability. These specific features along with identifiable dips in the light curve are distinctive of the source during δ variability class with reference to Belloni et al. (2000). The source during these Epochs are thus classified to belong to δ class (see also Fig. 3). The flux in the light curve varied between 2.5 and 5 kcts s−1. The data points in the CCD lie between 0.3 ≤ HR1 ≤ 0.6 and HR2 ≤ 0.06. The panels (a) and (b) of Fig. 5 show the typical light curve and CCD, respectively, corresponding to the δ variability class. The PDS does not show any distinct narrow frequency features (panel c of Fig. 5), and has a power-law noise for the broad frequency range. The total rms power of the PDS was found to vary within 5.3|$_{-1.8}^{+2.0}$| – 7.7|$_{-0.5}^{+0.3}$| per cent. The results obtained from all the Epochs belonging to class δ are given in Table 2.
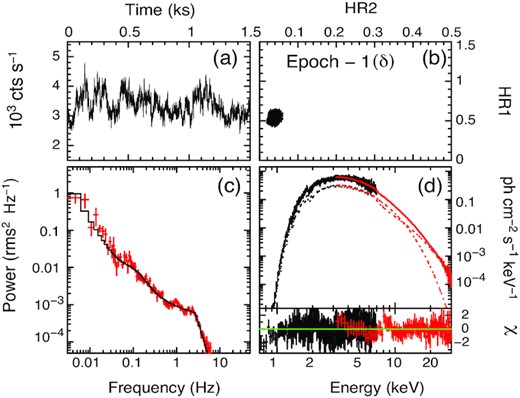
Background subtracted 1 s binned light curve and CCD of the source exhibiting δ variability class during Segment 3 of Epoch 1, are shown in panels (a) and (b). Panel (c) shows the PDS generated from the 0.01 s binned light curve in 3–60 keV energy band, while panel (d) depicts the broadband energy spectrum from the SXT and LAXPC for the energy range 0.7–30 keV. The SXT and LAXPC data are plotted in black and red colour, respectively. The spectrum is best fitted using Model-1. See the text for details.
Details of model fitted parameters of power spectra obtained from LAXPC 20 observations of GRS 1915+105 in 3–60 keV energy band for each Epoch. Multiple Lorentzians were used to fit the PDS. Here, ν represents the QPO frequency in Hz, σ denotes the QPO significance and the total rms for the entire PDS is given in percentage.
| Epoch | Fundamental QPO | Total rms | χ2/dof | |||
|---|---|---|---|---|---|---|
| v (Hz) | Q-factor | rms (per cent) | σ | (per cent) | ||
| 1 | – | – | – | – | 7.7|$_{-0.5}^{+0.3}$| | 228.84/214 |
| 2 | 4.31|$_{-0.02}^{+0.01}$| | 5.1|$_{-0.1}^{+0.4}$| | 12.8|$_{-0.4}^{+0.5}$| | 13.3 | 18.9|$_{-0.8}^{+0.9}$| | 235.61/199 |
| 3a | 3.91|$_{-0.02}^{+0.02}$| | 5.9|$_{-0.1}^{+0.2}$| | 13.9|$_{-0.9}^{+0.9}$| | 12.5 | 19.2|$_{-1.0}^{+1.2}$| | 209.51/192 |
| 3b | 4.69|$_{-0.05}^{+0.05}$| | 4.3|$_{-0.1}^{+0.3}$| | 12.1|$_{-0.8}^{+0.8}$| | 12.1 | 18.4|$_{-1.2}^{+1.4}$| | 194.75/169 |
| 3c | 4.06|$_{-0.02}^{+0.03}$| | 6.4|$_{-0.2}^{+0.3}$| | 12.9|$_{-0.9}^{+0.8}$| | 11.2 | 18.7|$_{-1.1}^{+1.0}$| | 441.84/374 |
| 3d | 4.54|$_{-0.05}^{+0.05}$| | 3.2|$_{-0.1}^{+0.3}$| | 11.3|$_{-1.0}^{+0.9}$| | 16.1 | 17.4|$_{-1.6}^{+1.0}$| | 363.75/293 |
| 4 | 4.69|$_{-0.03}^{+0.03}$| | 4.0|$_{-0.1}^{+0.4}$| | 10.2|$_{-0.7}^{+0.7}$| | 16.1 | 22.0|$_{-1.7}^{+1.8}$| | 320.70/294 |
| 5 | 4.51|$_{-0.08}^{+0.01}$| | 3.1|$_{-0.1}^{+0.3}$| | 5.9|$_{-0.4}^{+0.4}$| | 10.0 | 20.0|$_{-2.4}^{+1.7}$| | 283.34/216 |
| 6a | 5.15|$_{-0.06}^{+0.03}$| | 2.8|$_{-0.2}^{+0.3}$| | 10.4|$_{-0.9}^{+0.9}$| | 9.3 | 25.1|$_{-2.4}^{+2.4}$| | 349.08/329 |
| 6b | 5.12|$_{-0.01}^{+0.02}$| | 2.9|$_{-0.1}^{+0.5}$| | 9.9|$_{-0.8}^{+0.8}$| | 10.6 | 31.8|$_{-2.6}^{+2.8}$| | 509.61/380 |
| 7 | 5.64|$_{-0.08}^{+0.09}$| | 4.3|$_{-0.2}^{+0.6}$| | 5.2|$_{-0.6}^{+0.6}$| | 7.9 | 34.6|$_{-3.1}^{+2.6}$| | 529.59/445 |
| 8 | – | – | – | – | 62.8|$_{-6.5}^{+4.3}$| | 371.76/307 |
| 9a | – | – | – | – | 61.9|$_{-5.6}^{+3.6}$| | 284.86/229 |
| 9b | – | – | – | – | 63.0|$_{-4.2}^{+3.4}$| | 267.81/241 |
| 10 | – | – | – | – | 55.5|$_{-2.9}^{+2.1}$| | 199.17/146 |
| 11 | – | – | – | – | 53.1|$_{-2.3}^{+1.7}$| | 241.05/200 |
| 12 | – | – | – | – | 53.7|$_{-2.6}^{+2.2}$| | 169.57/140 |
| 13 | – | – | – | – | 51.4|$_{-2.4}^{+2.5}$| | 317.97/286 |
| 14 | – | – | – | – | 44.3|$_{-2.0}^{+1.9}$| | 153.10/140 |
| 15 | – | – | – | – | 30.5|$_{-1.8}^{+2.0}$| | 131.23/81 |
| 16a | – | – | – | – | 34.5|$_{-2.0}^{+1.6}$| | 167.40/130 |
| 16b | – | – | – | – | 16.9|$_{-1.0}^{+1.2}$| | 121.18/90 |
| 16c | – | – | – | – | 14.9|$_{-1.2}^{+1.2}$| | 149.96/111 |
| 17 | – | – | – | – | 6.8|$_{-0.9}^{+0.9}$| | 144.80/125 |
| 18 | – | – | – | – | 5.3|$_{-1.8}^{+2.0}$| | 241.21/219 |
| 19 | – | – | – | – | 6.2|$_{-1.0}^{+0.9}$| | 260.43/198 |
| 20 | – | – | – | – | 5.9|$_{-0.5}^{+0.7}$| | 189.36/185 |
| 21 | 3.44|$_{-0.01}^{+0.01}$| | 3.2|$_{-0.1}^{+0.4}$| | 12.9|$_{-0.7}^{+0.8}$| | 14.6 | 19.1|$_{-1.7}^{+1.0}$| | 262.42/228 |
| 22 | 3.80|$_{-0.01}^{+0.02}$| | 4.5|$_{-0.1}^{+0.4}$| | 12.6|$_{-0.7}^{+0.7}$| | 16.9 | 21.8|$_{-1.5}^{+1.3}$| | 258.30/203 |
| 23 | 2.24|$_{-0.01}^{+0.02}$| | 6.9|$_{-0.1}^{+0.7}$| | 14.1|$_{-0.4}^{+0.4}$| | 10.4 | 21.7|$_{-1.4}^{+1.6}$| | 310.16/276 |
| 24 | 3.04|$_{-0.01}^{+0.01}$| | 5.8|$_{-0.1}^{+0.6}$| | 14.4|$_{-0.8}^{+0.8}$| | 13.9 | 20.9|$_{-1.5}^{+1.5}$| | 194.35/218 |
| 25 | 3.32|$_{-0.03}^{+0.02}$| | 4.2|$_{-0.1}^{+0.4}$| | 14.1|$_{-0.6}^{+0.7}$| | 33.8 | 21.7|$_{-1.4}^{+1.6}$| | 163.28/168 |
| 26 | 1.85|$_{-0.02}^{+0.02}$| | 10.2|$_{-0.1}^{+0.5}$| | 13.2|$_{-0.6}^{+0.5}$| | 22.0 | 22.5|$_{-2.1}^{+1.8}$| | 236.04/217 |
| 27 | 1.38|$_{-0.01}^{+0.01}$| | 8.8|$_{-0.1}^{+0.1}$| | 13.3|$_{-0.3}^{+0.4}$| | 18.8 | 19.3|$_{-1.2}^{+0.9}$| | 243.51/217 |
| 28 | 1.83|$_{-0.01}^{+0.01}$| | 8.9|$_{-0.4}^{+0.1}$| | 14.0|$_{-0.3}^{+0.3}$| | 23.8 | 22.7|$_{-0.9}^{+1.0}$| | 262.13/208 |
| 29 | 2.08|$_{-0.01}^{+0.01}$| | 10.7|$_{-1.9}^{+2.0}$| | 11.9|$_{-0.6}^{+0.6}$| | 4.8 | 21.4|$_{-0.9}^{+1.1}$| | 281.06/260 |
| 30 | – | – | – | – | 22.9|$_{-0.6}^{+0.8}$| | 310.58/250 |
| 31 | – | – | – | – | 7.5|$_{-0.1}^{+0.2}$| | 196.21/183 |
The broad-band spectra for the δ class observations were well fitted with Model-1 along with additional Gaussian or smedge components for certain Epochs. During Epoch 1, the spectrum was described with a high index (Γ) value of 3.6 with 55 per cent disc flux contribution, indicating a soft nature (panel d of Fig. 5). The Γ value was ∼3.0|$_{-0.1}^{+0.1}$| during Epochs 17–20, while a gradual decrease of seed photon temperature (kTin) value from 1.9|$_{-0.1}^{+0.1}$| to 1.3|$_{-0.1}^{+0.1}$| keV, accompanied by a constantly increasing electron cloud temperature (kTe) from 2.7|$_{-0.1}^{+0.1}$| to 3.5|$_{-0.2}^{+0.5}$| keV was observed. The best-fit spectral parameters are mentioned in Table 3.
Broad-band spectral parameter values for GRS 1915+105 obtained from the best-fitting model for each Epoch. kTin (in units of keV) corresponds to disc temperature, Ndiskbb is disc normalization, Eline corresponds to the Fe line energy (keV) and the line width denotes the width of the Gaussian line (keV), kTe (keV) corresponds to electron temperature, and Nnthcomp corresponds to nthcomp normalization. Both disc and Comptonised flux fractions, in per cent, for every Epoch are also quoted. Lbol corresponds to the bolometric luminosity (0.3–100 keV) in the units of Eddington luminosity (per cent LEdd). The distance to the source is considered as 8.6 kpc. Errors for all the parameters are calculated with 90 per cent confidence.
| Epoch | nH × 1022 | Γ | kTin | Ndiskbb | Eline | Line width | kTe | Nnthcomp | Disc fl. fr. | Comp. fl. fr. | Lbol | χ2/dof |
|---|---|---|---|---|---|---|---|---|---|---|---|---|
| atoms cm−2 | (keV) | (keV) | (keV) | (keV) | (per cent) | (per cent) | (per cent LEdd) | |||||
| 1 | 5.82|$_{-0.24}^{+0.37}$| | 3.62|$_{-0.08}^{+0.08}$| | 2.02|$_{-0.01}^{+0.02}$| | 61|$_{-7}^{+8}$| | – | – | 5.1|$_{-0.2}^{+0.2}$| | 1.44|$_{-0.02}^{+0.03}$| | 55.6|$_{-4.2}^{+3.9}$| | 43.1|$_{-2.1}^{+3.6}$| | 16.0 | 719.5/630 |
| 2 | 5.86|$_{-0.14}^{+0.18}$| | 1.87|$_{-0.02}^{+0.02}$| | 1.33|$_{-0.01}^{+0.01}$| | 87|$_{-7}^{+7}$| | 6.97|$_{-0.16}^{+0.12}$| | 0.99|$_{-0.23}^{+0.26}$| | 13.3|$_{-0.9}^{+0.8}$| | 0.36|$_{-0.01}^{+0.01}$| | 29.7|$_{-1.2}^{+3.5}$| | 71.4|$_{-5.1}^{+6.8}$| | 6.4 | 559.9/513 |
| 3a | 5.41|$_{-0.16}^{+0.18}$| | 1.83|$_{-0.01}^{+0.01}$| | 1.35|$_{-0.01}^{+0.01}$| | 77|$_{-5}^{+6}$| | 7.30|$_{-0.17}^{+0.22}$| | 0.7* | 12.6|$_{-1.3}^{+1.6}$| | 0.32|$_{-0.01}^{+0.02}$| | 21.3|$_{-2.6}^{+4.1}$| | 77.5|$_{-6.5}^{+6.3}$| | 6.5 | 565.4/472 |
| 3b | 5.38|$_{-0.10}^{+0.16}$| | 1.83|$_{-0.02}^{+0.02}$| | 1.37|$_{-0.01}^{+0.01}$| | 81|$_{-6}^{+7}$| | 6.84|$_{-0.21}^{+0.26}$| | 0.7* | 11.6|$_{-1.1}^{+1.1}$| | 0.30|$_{-0.01}^{+0.01}$| | 23.1|$_{-2.3}^{+3.2}$| | 75.2|$_{-5.4}^{+7.2}$| | 6.1 | 582.5/476 |
| 3c | 5.46|$_{-0.24}^{+0.11}$| | 1.94|$_{-0.02}^{+0.01}$| | 1.25|$_{-0.02}^{+0.01}$| | 80|$_{-4}^{+3}$| | 6.18|$_{-0.28}^{+0.27}$| | 0.7* | 13.1|$_{-2.1}^{+1.9}$| | 0.50|$_{-0.09}^{+0.06}$| | 28.2|$_{-2.1}^{+4.8}$| | 71.1|$_{-6.1}^{+5.0}$| | 6.4 | 548.7/538 |
| 3d | 5.35|$_{-0.19}^{+0.31}$| | 1.95|$_{-0.01}^{+0.01}$| | 1.37|$_{-0.02}^{+0.01}$| | 95|$_{-5}^{+7}$| | 6.84|$_{-0.34}^{+0.28}$| | 0.91|$_{-0.20}^{+0.21}$| | 33.4|$_{-3.5}^{+4.7}$| | 0.35|$_{-0.01}^{+0.01}$| | 36.9|$_{-3.2}^{+4.1}$| | 63.8|$_{-4.2}^{+5.7}$| | 6.1 | 562.2/552 |
| 4 | 5.46|$_{-0.13}^{+0.13}$| | 1.87|$_{-0.03}^{+0.03}$| | 1.31|$_{-0.03}^{+0.02}$| | 107|$_{-13}^{+15}$| | 7.16|$_{-0.29}^{+0.25}$| | 0.7* | 13.4|$_{-1.1}^{+1.5}$| | 0.29|$_{-0.02}^{+0.03}$| | 37.2|$_{-3.1}^{+2.6}$| | 62.9|$_{-4.9}^{+5.3}$| | 5.8 | 612.1/536 |
| 5 | 5.41|$_{-0.21}^{+0.24}$| | 1.89|$_{-0.02}^{+0.02}$| | 1.28|$_{-0.03}^{+0.03}$| | 118|$_{-11}^{+13}$| | 7.16|$_{-0.35}^{+0.34}$| | 1.02|$_{-0.35}^{+0.38}$| | 13.7|$_{-0.9}^{+1.8}$| | 0.31|$_{-0.01}^{+0.01}$| | 36.1|$_{-3.0}^{+3.1}$| | 63.6|$_{-8.7}^{+8.2}$| | 5.8 | 525.1/525 |
| 6a | 5.55|$_{-0.46}^{+0.31}$| | 1.95|$_{-0.04}^{+0.04}$| | 1.32|$_{-0.02}^{+0.02}$| | 87|$_{-4}^{+3}$| | – | – | 18.7|$_{-1.4}^{+2.4}$| | 0.26|$_{-0.01}^{+0.01}$| | 38.6|$_{-1.6}^{+2.8}$| | 61.9|$_{-4.7}^{+6.1}$| | 4.7 | 635.6/528 |
| 6b | 5.42|$_{-0.37}^{+0.28}$| | 1.87|$_{-0.04}^{+0.04}$| | 1.38|$_{-0.03}^{+0.03}$| | 83|$_{-6}^{+5}$| | – | – | 15.6|$_{-2.4}^{+3.5}$| | 0.21|$_{-0.01}^{+0.01}$| | 42.5|$_{-2.8}^{+3.8}$| | 57.2|$_{-3.2}^{+6.1}$| | 4.8 | 392.8/384 |
| 7 | 5.76|$_{-0.33}^{+0.10}$| | 1.90|$_{-0.05}^{+0.04}$| | 1.37|$_{-0.01}^{+0.02}$| | 98|$_{-6}^{+5}$| | – | – | 14.9|$_{-1.9}^{+2.1}$| | 0.19† | 51.0|$_{-2.6}^{+4.5}$| | 51.0|$_{-2.1}^{+3.8}$| | 4.7 | 730.5/542 |
| 8 | 5.79|$_{-0.12}^{+0.11}$| | 2.55|$_{-0.09}^{+0.08}$| | 1.80|$_{-0.01}^{+0.02}$| | 52|$_{-3}^{+4}$| | – | – | 16.8|$_{-2.0}^{+2.8}$| | 0.24|$_{-0.01}^{+0.01}$| | 66.9|$_{-4.8}^{+3.1}$| | 33.1|$_{-3.1}^{+2.0}$| | 6.5 | 555.3/502 |
| 9a | 5.82|$_{-0.56}^{+0.79}$| | 2.36|$_{-0.05}^{+0.04}$| | 1.72|$_{-0.01}^{+0.01}$| | 57|$_{-5}^{+9}$| | – | – | 4.3|$_{-0.1}^{+0.1}$| | 0.32|$_{-0.01}^{+0.01}$| | 64.7|$_{-3.1}^{+6.4}$| | 34.6|$_{-2.3}^{+3.6}$| | 7.2 | 624.3/508 |
| 9b | 6.04|$_{-0.12}^{+0.10}$| | 2.74|$_{-0.05}^{+0.04}$| | 1.66|$_{-0.01}^{+0.01}$| | 66|$_{-4}^{+6}$| | – | – | 13.6|$_{-2.2}^{+1.6}$| | 0.47|$_{-0.01}^{+0.01}$| | 58.8|$_{-4.2}^{+5.3}$| | 42.6|$_{-4.3}^{+5.6}$| | 7.1 | 818.6/573 |
| 10 | 5.69|$_{-0.11}^{+0.18}$| | 3.55|$_{-0.02}^{+0.02}$| | 1.87|$_{-0.01}^{+0.01}$| | 29|$_{-3}^{+4}$| | – | – | 8.8|$_{-0.9}^{+1.4}$| | 0.80|$_{-0.02}^{+0.02}$| | 40.2|$_{-4.1}^{+4.2}$| | 59|$_{-5.5}^{+3.7}$| | 7.6 | 765.1/568 |
| 11 | 6.36|$_{-0.12}^{+0.18}$| | 3.80|$_{-0.03}^{+0.03}$| | 1.82|$_{-0.01}^{+0.01}$| | 24|$_{-2}^{+4}$| | – | – | 11.6|$_{-0.9}^{+1.8}$| | 1.32|$_{-0.04}^{+0.03}$| | 31.4|$_{-2.1}^{+2.2}$| | 68.2|$_{-3.9}^{+6.0}$| | 8.2 | 662.6/578 |
| 12 | 6.26|$_{-0.14}^{+0.17}$| | 2.34|$_{-0.01}^{+0.01}$| | 1.58|$_{-0.01}^{+0.01}$| | 48|$_{-3}^{+4}$| | – | – | 3.2|$_{-0.1}^{+0.1}$| | 0.26|$_{-0.01}^{+0.01}$| | 30.8|$_{-2.1}^{+2.8}$| | 68.4|$_{-3.4}^{+5.2}$| | 9.9 | 629.4/527 |
| 13 | 6.44|$_{-0.40}^{+0.43}$| | 3.31|$_{-0.05}^{+0.05}$| | 2.49|$_{-0.01}^{+0.01}$| | 21|$_{-3}^{+4}$| | – | – | 7.8|$_{-1.0}^{+1.7}$| | 0.64|$_{-0.01}^{+0.01}$| | 54.6|$_{-0.9}^{+1.9}$| | 45.1|$_{-5.5}^{+3.8}$| | 12.0 | 665.4/574 |
| 14 | 6.17|$_{-0.25}^{+0.20}$| | 2.98|$_{-0.04}^{+0.04}$| | 2.5|$_{-0.01}^{+0.01}$| | 28|$_{-4}^{+6}$| | – | – | 8.4|$_{-1.0}^{+1.0}$| | 0.60|$_{-0.03}^{+0.02}$| | 60.5|$_{-4.9}^{+5.9}$| | 39.3|$_{-1.4}^{+1.5}$| | 15.5 | 767.6/620 |
| 15 | 6.09|$_{-0.37}^{+0.21}$| | 2.87|$_{-0.04}^{+0.04}$| | 2.67|$_{-0.01}^{+0.01}$| | 24|$_{-3}^{+3}$| | – | – | 6.3|$_{-0.1}^{+0.2}$| | 0.57|$_{-0.02}^{+0.02}$| | 74.1|$_{-6.8}^{+6.0}$| | 26.2|$_{-1.4}^{+1.7}$| | 16.2 | 910.6/660 |
| 16a | 6.60|$_{-0.12}^{+0.11}$| | 2.33|$_{-0.06}^{+0.06}$| | 2.32|$_{-0.01}^{+0.03}$| | 51|$_{-4}^{+6}$| | – | – | 5.0|$_{-0.1}^{+0.4}$| | 0.43|$_{-0.02}^{+0.01}$| | 71.8|$_{-6.4}^{+8.2}$| | 28.0|$_{-1.8}^{+1.9}$| | 16.7 | 591.9/502 |
| 16b | 6.56|$_{-0.51}^{+0.69}$| | 3.39|$_{-0.04}^{+0.05}$| | 2.61|$_{-0.02}^{+0.02}$| | 31|$_{-3}^{+4}$| | – | – | 13.7|$_{-0.7}^{+0.7}$| | 0.78|$_{-0.04}^{+0.04}$| | 71.0|$_{-8.1}^{+5.3}$| | 29.3|$_{-3.1}^{+3.9}$| | 17.1 | 881.1/659 |
| 16c | 6.56|$_{-0.40}^{+0.68}$| | 3.13|$_{-0.07}^{+0.06}$| | 2.61|$_{-0.02}^{+0.02}$| | 30|$_{-4}^{+4}$| | – | – | 8.3|$_{-0.3}^{+0.6}$| | 0.66|$_{-0.01}^{+0.01}$| | 74.6|$_{-5.3}^{+4.2}$| | 27.7|$_{-6.2}^{+3.1}$| | 16.9 | 752.2/590 |
| 17 | 6.57|$_{-0.15}^{+0.14}$| | 2.98|$_{-0.06}^{+0.06}$| | 1.79|$_{-0.01}^{+0.01}$| | 73|$_{-5}^{+7}$| | – | – | 2.7|$_{-0.1}^{+0.1}$| | 3.99|$_{-0.09}^{+0.09}$| | 34.5|$_{-2.0}^{+2.1}$| | 66.0|$_{-3.7}^{+4.8}$| | 35.7 | 853.6/625 |
| 18 | 6.38|$_{-0.12}^{+0.12}$| | 3.07|$_{-0.03}^{+0.03}$| | 1.89|$_{-0.01}^{+0.01}$| | 61|$_{-5}^{+5}$| | – | – | 2.7|$_{-0.1}^{+0.1}$| | 4.12|$_{-0.01}^{+0.04}$| | 22.0|$_{-1.0}^{+1.9}$| | 68.1|$_{-4.4}^{+3.4}$| | 32.4 | 699.0/551 |
| 19 | 6.50|$_{-0.13}^{+0.11}$| | 3.06|$_{-0.02}^{+0.02}$| | 1.54|$_{-0.01}^{+0.01}$| | 44|$_{-3}^{+6}$| | – | – | 3.1|$_{-0.2}^{+0.2}$| | 4.28|$_{-0.16}^{+0.09}$| | 44.6|$_{-2.6}^{+4.6}$| | 64.2|$_{-4.2}^{+5.2}$| | 23.8 | 860.5/649 |
| 20 | 6.08|$_{-0.21}^{+0.19}$| | 3.18|$_{-0.01}^{+0.01}$| | 1.31|$_{-0.01}^{+0.01}$| | 67|$_{-5}^{+6}$| | – | – | 3.5|$_{-0.2}^{+0.5}$| | 2.65|$_{-0.07}^{+0.05}$| | 39.7|$_{-1.3}^{+3.6}$| | 61.1|$_{-4.5}^{+5.3}$| | 21.9 | 714.8/577 |
| 21 | 5.20|$_{-0.13}^{+0.13}$| | 1.97|$_{-0.01}^{+0.02}$| | 1.44|$_{-0.01}^{+0.01}$| | 593|$_{-24}^{+28}$| | – | – | 15.2|$_{-1.0}^{+1.8}$| | 1.03|$_{-0.05}^{+0.05}$| | 39.7|$_{-3.3}^{+2.8}$| | 61.2|$_{-4.9}^{+6.7}$| | 12.7 | 626.9/573 |
| 22 | 5.10|$_{-0.18}^{+0.20}$| | 1.87|$_{-0.01}^{+0.01}$| | 1.44|$_{-0.01}^{+0.01}$| | 117|$_{-20}^{+25}$| | 8.04|$_{-0.42}^{+0.37}$| | 0.7* | 11.5|$_{-1.0}^{+2.0}$| | 0.55|$_{-0.02}^{+0.02}$| | 35.2|$_{-1.2}^{+1.6}$| | 65.4|$_{-5.3}^{+4.5}$| | 10.9 | 1029.7/880 |
| 23 | 4.26|$_{-0.09}^{+0.11}$| | 1.73|$_{-0.03}^{+0.03}$| | 1.48|$_{-0.01}^{+0.01}$| | 33|$_{-2}^{+4}$| | 7.02|$_{-0.36}^{+0.33}$| | 0.82|$_{-0.24}^{+0.28}$| | 14.2|$_{-1.5}^{+2.1}$| | 0.25|$_{-0.01}^{+0.01}$| | 22.3|$_{-1.3}^{+2.8}$| | 77.6|$_{-6.4}^{+5.4}$| | 6.4 | 537.0/556 |
| 24 | 4.55|$_{-0.11}^{+0.11}$| | 1.79|$_{-0.04}^{+0.04}$| | 1.37|$_{-0.01}^{+0.01}$| | 46|$_{-3}^{+5}$| | 6.89|$_{-0.21}^{+0.19}$| | 0.74|$_{-0.29}^{+0.32}$| | 16.4|$_{-1.1}^{+2.5}$| | 0.24|$_{-0.01}^{+0.01}$| | 26.1|$_{-2.8}^{+3.6}$| | 74.7|$_{-4.5}^{+5.5}$| | 4.7 | 536.5/539 |
| 25 | 4.56|$_{-0.20}^{+0.16}$| | 1.79|$_{-0.03}^{+0.04}$| | 1.36|$_{-0.01}^{+0.02}$| | 52|$_{-3}^{+4}$| | 6.84|$_{-0.18}^{+0.20}$| | 0.78|$_{-0.28}^{+0.35}$| | 15.1|$_{-1.2}^{+1.5}$| | 0.22|$_{-0.01}^{+0.01}$| | 25.2|$_{-3.9}^{+1.1}$| | 74.7|$_{-5.1}^{+6.0}$| | 4.6 | 516.9/493 |
| 26 | 4.63|$_{-0.14}^{+0.14}$| | 1.66|$_{-0.02}^{+0.02}$| | 1.36|$_{-0.02}^{+0.02}$| | 21|$_{-1}^{+2}$| | 7.02|$_{-0.26}^{+0.24}$| | 0.82|$_{-0.303}^{+0.27}$| | 55.4|$_{-4.1}^{+6.7}$| | 0.12† | 27.5|$_{-3.2}^{+4.9}$| | 73.9|$_{-3.8}^{+5.6}$| | 3.1 | 442.4/438 |
| 27 | 4.61|$_{-0.13}^{+0.14}$| | 1.62|$_{-0.08}^{+0.08}$| | 1.32|$_{-0.02}^{+0.03}$| | 18|$_{-1}^{+2}$| | 7.05|$_{-0.14}^{+0.16}$| | 0.96|$_{-0.25}^{+0.27}$| | 28.1|$_{-3.5}^{+2.4}$| | 0.10† | 26.7|$_{-2.0}^{+4.1}$| | 74.1|$_{-7.7}^{+7.1}$| | 2.8 | 400.2/369 |
| 28 | 5.01|$_{-0.65}^{+0.51}$| | 1.62|$_{-0.02}^{+0.01}$| | 1.23|$_{-0.05}^{+0.04}$| | 27|$_{-1}^{+3}$| | 7.13|$_{-0.20}^{+0.22}$| | 1.12|$_{-0.22}^{+0.24}$| | 13.5|$_{-2.0}^{+1.8}$| | 0.10† | 26.5|$_{-1.2}^{+2.6}$| | 73.9|$_{-1.1}^{+1.6}$| | 2.7 | 94.1/89 |
| 29 | 5.13|$_{-0.21}^{+0.23}$| | 1.60|$_{-0.03}^{+0.03}$| | 1.36|$_{-0.02}^{+0.02}$| | 21|$_{-2}^{+3}$| | 6.88|$_{-0.15}^{+0.18}$| | 0.94|$_{-0.33}^{+0.37}$| | 11.6|$_{-0.4}^{+0.4}$| | 0.08† | 15.7|$_{-2.0}^{+2.4}$| | 84.2|$_{-4.2}^{+3.9}$| | 2.4 | 445.6/473 |
| 30 | 3.59|$_{-0.11}^{+0.13}$| | 1.28|$_{-0.01}^{+0.01}$| | 1.11|$_{-0.01}^{+0.01}$| | 10|$_{-1}^{+2}$| | 6.46|$_{-0.06}^{+0.06}$| | 0.6* | 11.6|$_{-1.2}^{+1.8}$| | 0.04† | 13.0|$_{-3.4}^{+2.6}$| | 83.8|$_{-6.3}^{+10.0}$| | 0.7 | 99.8/90 |
| 31 | 6.15|$_{-0.24}^{+0.21}$| | 1.18|$_{-0.08}^{+0.07}$| | 1.18|$_{-0.01}^{+0.02}$| | 5|$_{-1}^{+1}$| | 6.34|$_{-0.06}^{+0.07}$| | 0.61|$_{-0.09}^{+0.09}$| | 11.4|$_{-1.7}^{+2.5}$| | 0.01† | 10.1|$_{-3.3}^{+2.0}$| | 89.4|$_{-7.2}^{+8.8}$| | 1.1 | 197.6/137 |
Note. *Frozen; † Error values are insignificant
4.2.2 Class χ [Epochs – 2, 3, 21–31]
Flux exhibited by the source during the initial segments of Epochs 2 and 3 were relatively low over long time scales (∼3 ks). The light curve was devoid of any strong variability. The structure of the CCD was diagonally elongated for most of the observations with HR2 ≥ 0.06. This position in CCD is associated with state C of Belloni et al. (2000). Source exhibiting these characteristics is categorized to belong to χ variability class (Belloni et al. 2000). A few segments in Epochs 2 and 3 and Epochs 21–31 exhibit χ variability class. As seen in Fig. 1, Epochs 21 to 31 shows the steady decrease in X-ray flux. The average count rate from the LAXPC light curve during Epochs 21 to 31 is seen to have decreased from ∼1700 to 90 cts s−1 with a corresponding gradual increase in the HR values. A drastic increase in the HR values is seen during Epoch 31. In Fig. 6, the data corresponding to Epoch 2 is plotted. The PDS obtained from the observations belonging to class χ displayed a flat-top noise and QPOs with harmonics (panel c of Fig. 6). Fundamental QPOs for all the observations belonging to this class were varying between 1.3–4.3 Hz. Power spectra for all the Epochs also showed narrow 1st harmonic while Epoch 22 displayed 1st harmonic with less power. The PDS of Epoch 25 showed a sub-harmonic (Q-factor = 1.6) at 1.69 Hz, while Epochs 22 and 24 showed faint sub-harmonics. The total rms varied within the range of 18|$_{-1}^{+1}$| – 23|$_{-1}^{+1}$| per cent. The QPO rms was found to be >12.6 per cent during this class (see Table 2 for details).
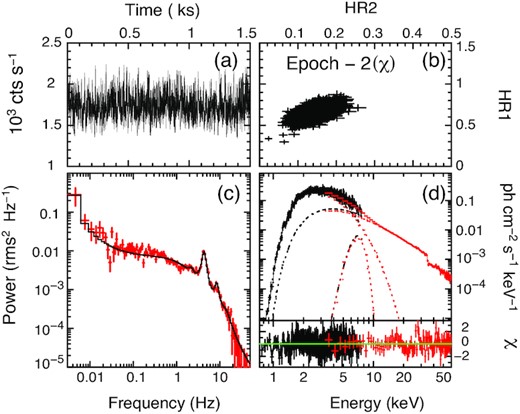
Plots for observations belonging to χ variability class (Segment 1 of Epoch 2). LFQPO at 4.31 Hz is observed in the PDS. The broadband energy spectrum (0.7–60 keV) is well fitted using Model-1. See text for details.
The broadband energy spectra were well fitted using Model-1 with kTin varying within 1.1|$_{-0.1}^{+0.1}$| – 1.5|$_{-0.1}^{+0.1}$| keV range and kTe varying between 11–55 keV. Γ was always found to be |$\sim \!1.8_{-0.1}^{+0.1}$| during Epochs 2, 3, and 21–25. Γ value dropped to ∼1.6|$_{-0.1}^{+0.1}$| during Epochs 26, 27, and 28 and further decreased to 1.2|$_{-0.1}^{+0.1}$| during Epoch 31. A Gaussian peak was always found with line energy varying around 6.3|$_{-0.1}^{+0.1}$| – 7.2|$_{-0.2}^{+0.2}$| keV having a width in the range of 0.6|$_{-0.1}^{+0.1}$| – 1.1|$_{-0.2}^{+0.2}$| keV respectively. Details of temporal and spectral properties of χ class are presented in Tables 2 and 3.
4.2.3 Class ρ [Epoch – 7]
Epoch 7a and 7b showed distinct regular flares in the light curve (see panel a of Fig. 7) repeating on a time-scale of 50–60 s with flux varying between 0.5 and 4 kcts s−1. This regular and characteristic pattern recurring on a time-scale of 1–2 min, is categorized as ρ variability class (Belloni et al. 2000). The peak amplitude of these flare profiles varied non-uniformly unlike that already seen in this source so far – which is typically uniform with constant amplitude (Belloni et al. 2000). These burst profiles were single peaked bursts whereas the regular bursts usually consist of a two-peak structure (Yadav et al. 1999; Belloni et al. 2000). The points in the CCD vary between 0.2 ≤ HR1 ≤ 0.8 and 0.03 ≤ HR2 ≤ 0.3 for Epoch 7a (see panel b of Fig. 7), whereas the HR2 value was seen to be increasing drastically to 0.6 during Epoch 7b. There exists a small branch extending towards higher HR1 values. However, the CCD from our analysis slightly differs in structure from that observed by Rossi X-ray Timing Explorer (RXTE), which exhibited a loop like structure (Belloni et al. 2000). The PDS from our observations belonging to ρ class showed a QPO at ∼5 Hz along with a faint 1st harmonic (panel c of Fig. 7). The PDS exhibited a powerlaw noise component with peaked noise at ∼0.1 Hz, which could be the result of quasi-periodic variations, between the flares, lasting for 25–30 s. The total rms amplitude varied between 34 and 60 per cent (see Table 2).
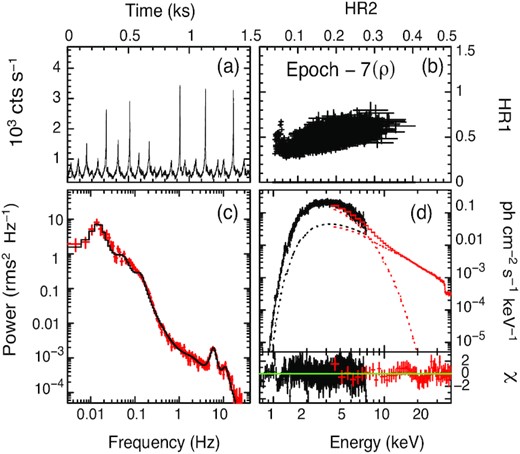
Plots for observation belonging to ρ variability class (Segment 3 of Epoch 7a). A strong QPO was obtained in the PDS at 5.64 Hz. mHz QPOs were also observed for this Epoch at 14.07 mHz (see Section 4.3.2 for details). The broad-band energy spectrum was fitted in the energy range of 0.7–60 keV using Model-1. See the text for details.
The broad-band energy spectra for Epoch 7a and 7b were well fitted using Model-1 along with a smedge component (panel d of Fig. 7). The disc temperature was found to be ∼1.3 keV with the photon index of ∼1.9, kTe at 14.8 keV and a disc flux contribution of ∼51 per cent. All model parameters are summarized in Table 3.
4.2.4 Class κ [Epochs – 10, 11, 12, and 13]
The light curves of Epochs 10 to 13 showed large amplitude variability. A steady rise and fall in luminosity, both lasting for ∼100 s was observed. This cycle repeated at a period of ∼250 s. The flux varied between 2 and 6 kcts s−1 during the rise, while in the dip it was at ∼1 kcts s−1 (panel a of Fig. 8). A C-shaped distribution was observed in the CCD (panel b of Fig. 8) with HR values ranging between 0.2 ≤ HR1 ≤ 1 and 0.03 ≤ HR2 ≤ 0.3. This quasi-periodic low-quiet, high-variable, and oscillating features in the light curve, with a C-shaped CCD are distinctive of κ variability class, with respect to Belloni et al. (2000). Hence, we classify Epochs 10–13 to belong to the same class. Associated with the periodicity of the flare, a QPO at 6 mHz was observed in the power spectrum. A broad QPO at ∼0.1 Hz was also observed corresponding to the multiple flares in the segment. This could be associated with the quasi-regular oscillations of shorter time-scale (∼20 s) observed within the cycles. The PDS showed a powerlaw noise with total rms variability decreasing from 55.5|$_{-0.3}^{+0.2}$| to 51.4|$_{-0.2}^{+0.2}$| per cent (see Table 2).
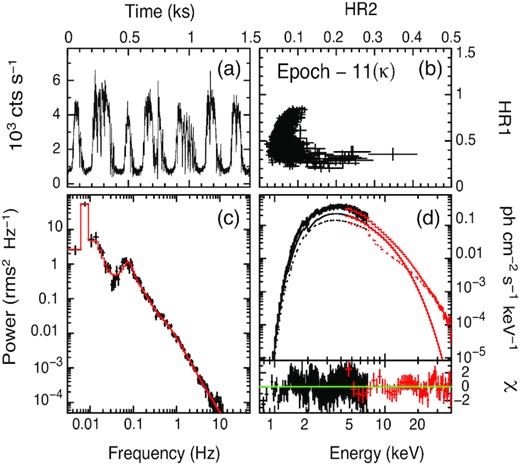
Plots for observations belonging to κ variability class (Segment 14 of Epoch 11). PDS shows a broad QPO at ∼0.1 Hz, along with a mHz QPO at 6 mHz. The energy spectrum (0.7–40 keV) is fitted with Model-1. See the text for details.
Model-1 along with a smedge component described the energy spectra for Epochs 10, 11, and 13. The spectrum corresponding to Epoch 12 was fitted using Model – 2, requiring an additional powerlaw component. In order to identify the origin of this powerlaw component, the light curve corresponding to Epoch 12 was further segregated into two categories, based on the count rates: one consisting of only the low counts and the other corresponding to the high counts in rise, peak, and the fall of the flux points. Spectral analysis revealed the presence of an additional powerlaw component, both during the low-count and the high-count states in the light curve with a power-law index of |$\sim \!1.15_{-0.01}^{+0.01}$|. From the overall analysis, it is observed that kTin varied between 1.6|$_{-0.1}^{+0.1}$| and 2.5|$_{-0.1}^{+0.1}$| keV, while kTe varied between 11.6|$_{-0.2}^{+0.1}$| and 3.2|$_{-0.2}^{+0.2}$| keV with Γ in the range of 2.3|$_{-0.1}^{+0.1}$| – 3.8|$_{-0.1}^{+0.1}$| (see Table 3) as the source evolves from Epoch 10 to Epoch 13. The disc flux contribution varied between 30 and 55 per cent of the total flux.
4.2.5 Class ω [Epochs – 14, 15]
Observations belonging to Epochs 14 and 15 showed periodic fluctuations between high (2–6 kcts s−1) and low intensities (∼0.8 kcts s−1) in their light curves with a branched distribution in the CCD (see panels a and b of Fig. 9). The points occupying the left branch, extending towards higher HR1 values, are of higher intensity, while those points extending towards higher HR2 values have lower intensity. The HR values range between 0.2 ≤ HR1 ≤ 0.8 and 0.02 ≤ HR2 ≤ 0.15. These transitions between two intensity states at these time-scales are distinctive of ω variability class as mentioned in Klein-Wolt et al. (2002), Naik, Rao & Chakrabarti (2002a), Zdziarski et al. (2005). Epochs 14 and 15 are thus classified into ω variability class. The PDS obtained from these observations showed a powerlaw noise component. No definite signature of QPOs were observed in any of the observations and the total rms for these observations varied between 30 and 45 per cent. The temporal results for the observations during Epoch 14 and 15 are given in Table 2. The energy spectra were well fitted using Model-1 with an additional smedge component. kTin was estimated to be ∼2.5 keV, Γ was ∼2.8, and kTe lay between 6.2|$_{-0.1}^{+0.1}$| and 8.4|$_{-0.1}^{+0.1}$| keV, respectively. A dominant disc flux contribution was observed which increased from 61 to 75 per cent during Epochs 14 and 15. Best-fitting model parameters are listed in Table 3.

The light curve, CCD, PDS, and broad-band energy spectrum of the source during ω class (Segment 2 of Epoch 15) are shown in panels (a), (b), (c), and (d). Model-1 produced a good fit for the broad-band energy spectrum for the energy range of 0.7–40 keV. See the text for details.
4.3 ‘Spectrotemporal’ characteristics during class transition
In the earlier section, we presented the ‘spectrotemporal’ features corresponding to canonical classes. However, using AstroSat observations, we were also able to detect class transitions within a few hours in an Epoch. We discuss the behaviour displayed by the source during each of these transitions.
4.3.1 |$\chi \longrightarrow \rho$| [Epochs – 2, 3]
As mentioned in Section 4.2.2, the source initially exhibited χ variability class during Epoch 3 (segment 1, MJD 57844.07; Epoch 3a in Fig. 10). The light curve exhibited a drift out of χ variability class, showing an arbitrary broad profile with an increase in intensity, indicating an intermediate (IM) state during segment 2 (Epoch 3b in Fig. 10). But for the third and fourth segments (i.e. MJD 57844.21 and 57844.28), the χ variability class is regained (see Epoch 3c in Fig. 10), followed by intermediate profiles until the seventh segment (MJD 57844.53). A ‘heart-beat’ state, which is similar to a ρ class (hence denoted here as ρ′), is exhibited since the eighth segment i.e. MJD 57844.53 (Epoch 3d, Fig. 10). Interestingly, the CCD for all these segments during the transition remained almost the same (see top panels of Fig. 10), except the ‘heart-beat’ state which exhibited a marginal decrease in the hardness. HR2 decreased from the range 0.14–0.36 to 0.1–0.3. We also observed a very significant change in the PDS, with segments 1 and 3 (χ profile) displaying a very narrow QPO along with a first harmonic, whereas, the first harmonic vanished during the second (intermediate state) and the last segment (‘heart-beat’ state). The total rms is seen to decrease from 19.2|$_{-0.1}^{+0.1}$| per cent to 17.4|$_{-0.1}^{+0.1}$| per cent, from χ class (Epoch 3a) to ‘heart-beat’ state (Epoch 3d). This decrease however cannot be considered significant (see Table 2). Although, the variation in other parameters, like the decrease in the Q-factor from 5.9|$_{-0.4}^{+0.4}$| to 3.1|$_{-0.1}^{+0.3}$|, increase in Γ from 1.83|$_{-0.01}^{+0.01}$| to 1.95|$_{-0.01}^{+0.01}$|, and increase in kTe from 12.6|$_{-1}^{+2}$| to 33|$_{-3}^{+4}$|, from 3a to 3d, respectively, is significant.
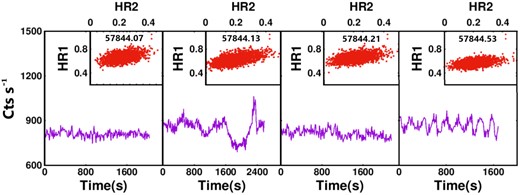
LAXPC light curves and corresponding CCDs of GRS 1915+105 indicating transition from the class χ → HB (ρ′) of GRS 1915+105 during Epochs 3a, 3b, 3c, and 3d (left-hand to right-hand panels). To be noted that for better representation the light curve has been shown with a bin-time of 10 s, while the CCD corresponds to 1s binning as mentioned in Section 3. The start time (Tstart) during each segment is also marked on the top panel.
A similar transition pattern is observed during Epoch 2, i.e. the source makes a transition in the sequence: |$\chi \longrightarrow$| IM |$\longrightarrow \chi \longrightarrow \rho ^\prime$| during Epoch 2 also. Following this, the source transited back to χ class (∼217 ks later) during the initial segment of Epoch 3. It is interesting to note that even after exhibiting one transition of |$\chi \longrightarrow \rho ^\prime$|, the source reverted to χ class and followed a similar transition to ρ′ during Epoch 3 (see Section 5 for a comparison with Rawat et al. 2019 and Misra et al. 2020).
4.3.2 ρ′, the variants of ρ [Epochs – 4, 5, 6a, and 6b]
Regular burst profiles were observed in the last few segments of Epochs 2 and 3. Epochs 4 to 6b also showed regular burst profiles of varying peak intensity, where the profiles became narrower but skewed with every Epoch. The flares during Epochs 2 and 3 were broader and less intense relative to the flares observed during Epochs 4 to 6b. Most of the flares during Epochs 4, 5, 6a, and 6b showed a steady rise initially, while a few flares showed a sudden increase in the peak intensity, as shown in Fig. 11. The periodicity of the bursts was 80–90 s during Epochs 4 and 5, while it decreased to ∼60 s during Epochs 6a and 6b. Considering the evolving nature of the ‘heart-beat’ profiles, we classify these as ρ′. Attributing to the periodicity of the flares, the source, during these Epochs, displayed mHz QPOs. Epochs 2 to 6 displayed narrow mHz features in the PDS while Epoch 7 was seen displaying a broad mHz QPO. The broadness could be due to the varying intensity of the burst (see Fig. 7). The QPO frequency increased from ∼5 mHz to 14 mHz from Epochs 2 to 7 (see Fig. 12). This evolution of the mHz QPO frequency is consistent with the evolving ‘heart-beat’ profile where the skewness, periodicity, and intensity varies with every Epoch. It appears that during AstroSat observations the source never reached the a canonical ρ class, unlike during RXTE era where a constant peak intensity is observed for ρ class. A much refined structure and periodicity is exhibited only when the source reached Epoch 7 (see Section 4.2.3)
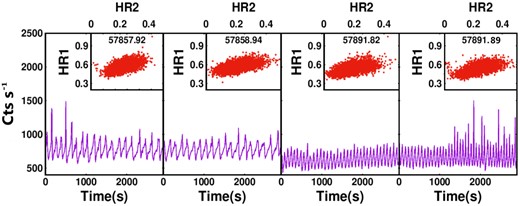
LAXPC light curves and corresponding CCDs of GRS 1915+105 exhibiting ‘heart-beat’(ρ′) profiles during Epochs 4, 5, 6a, and 6b (left-hand to right-hand panels). It can be seen that the burst profiles have varying intensity and are skewed during these observations. See the text for details.

Overplot of PDS obtained during Epochs 2, 3, 5, 6, and 7, for segments which exhibited a ‘heart-beat’ profile. The PDS during Epochs 2, 3, 5, and 6 are scaled w.r.t that of Epoch 7 by a factor of 108, 106, 104, and 102, respectively. QPO frequency (ν) evolved from 5.84 to 14.07 mHz during Epochs 2 to 7.
Low frequency QPOs were also observed during Epochs 2–6b, with the frequency increasing from 4.3 to 5.1 Hz and the Q-factor simultaneously decreasing from 5.1|$_{-0.1}^{+0.4}$| to 2.8|$_{-0.3}^{+0.2}$|. The total rms of the PDS is seen to increase from 18 per cent to 32 per cent. From the spectral fits, a steady photon index at ∼1.9 and disc temperature of ∼1.3 keV, respectively, were observed. Even though Γ and kTin were consistent, kTe was initially seen to increase to 33 keV (Epochs 2 and 3) and then further decrease to ∼14 keV during Epochs 4 to 7. These observations show a corresponding relative increase in the disc flux contribution of 36–43 per cent.
4.3.3 |$\rho \longrightarrow \kappa$| via an ‘unknown’ class [Epochs – 8, 9a, and 9b]
The X-ray light curves during Epochs 8 and 9 displayed random noise throughout the observation, interrupted by an aperiodically appearing steady dip lasting for ∼70 s, followed by a large amplitude flare. Fig. 13 shows the light curves and corresponding CCDs during Epochs 8, 9a and 9b, where 8 and 9b showed an aperiodic flare while Epoch 9a did not show any flare. The appearance of the dips and flares are observed within a few seconds duration in each segment. The CCDs for Epochs 8 and 9b show a cloud of points between 0.18 ≤ HR1 ≤ 0.8 and 0.01 ≤ HR2 ≤ 0.38, with the points tending to elongate towards higher HR values in the lower right-hand and the upper left-hand part. These change to 0.25 ≤ HR1 ≤ 0.6 and 0.03 ≤ HR2 ≤ 0.2 respectively, for Epoch 9a. Considering the hybrid nature of the light curve, we classify these Epochs as an ‘unknown’ class. We note that the previous observation during Epoch 7 showed a ρ variability class, and occurred 16 d prior to Epoch 8 (see Section 4.2.3, Table 1). Even though Epochs 8 and 9 are continuous observations, the next observation took place only 33 d later on Epoch 10 which depicted a κ variability class (see Section 4.2.4, Table 1). Since there is a significant observational gap, we limit to mentioning Epochs 8 and 9 as a transition from ρ to κ through an ‘unknown’ class. The temporal analysis during this ‘unknown’ class showed no detection of QPOs in the power spectra. A total rms value of ∼63 per cent was obtained for both Epochs, and the PDS nature exhibited a slight flattening at lower frequencies with dominant Poisson noise above 8 Hz.
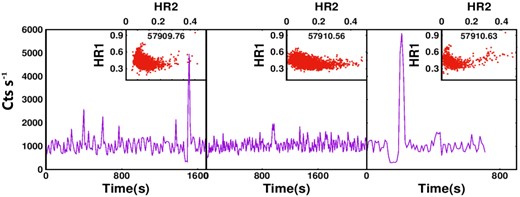
LAXPC light curves and corresponding CCDs of GRS 1915+105 during Epochs 8, 9a, and 9b (left-hand to right-hand panels). Aperiodically appearing sudden dip followed by a sharp flare is seen in the light curves of this ‘unknown’ class. See the text for details.
The energy spectral fits for this ‘unknown’ class showed a disc dominant emission with the flux contribution decreasing from 66 to 58 per cent during Epochs 8 to 9b. The disc temperature also slightly decreased from 1.8|$_{-0.1}^{+0.1}$| to 1.6|$_{-0.1}^{+0.1}$| keV while the photon index and the electron temperature varied between 2.4|$_{-0.1}^{+0.1}$| – 2.7|$_{-0.1}^{+0.1}$| and 4|$_{-1}^{+1}$| – 14|$_{-2}^{+1}$| keV, respectively.
4.3.4 |$\omega \longrightarrow \gamma$| [Epoch – 16]
A careful inspection of the light curve during Epoch 16 showed distinct pattern variation over a few segments. Fig. 14 shows the light curve from 2nd, 11th, and 14th segments during Epoch 16 and the inset displays the corresponding CCDs. The 2nd segment (i.e. Epoch 16a, MJD 58007.66 – left-hand panel in Fig. 14) displays ω variability class for ∼1800 s followed by a steady high count rate in the light curve. The 11th segment observed after ∼2.21 ks (Epoch 16b, MJD 58008.05 – middle panel in Fig. 14) displays sharp dips similar to γ variability class, as in Belloni et al. (2000). A very interesting profile is seen during the 14th segment (Epoch 16c, MJD 58008.19 – right-hand panel in Fig. 14), ∼10.2 ks after 11th segment, where the light curve has narrow and sharp dips of a γ class sandwiched between the dips of ω class. The CCD for the 2nd and 14th segments appear branched, with the upper branch extending towards higher HR1 and higher HR2 values and the lower branch towards higher HR2 values. In comparison, for the 11th segment the CCD does not appear branched, instead it is elongated towards higher HR1 and HR2 values (see inset panels of Fig. 14). It is evident that the lower branch in the CCDs, during 2nd and 14th segments, originate from the dip corresponding to ω variability class. We presume a possible transition of the source from ω to γ variability class, but ending up with a combined ω + γ structure during the final segment of the observation.

LAXPC light curves and corresponding CCDs of GRS 1915+105 during Epochs 16a, 16b, and 16c (left-hand to right-hand panels). Indications of an ω class during 16a, periodic sharp dips of a γ class in 16b and a combination of both ω and γ in 16c are evident in this figure. See the text for details.
From an independent study of the source during the same Epoch by Belloni et al. (2019), the source was classified to belong to μ variability class, whereas we did not observe any indication of μ variability class. In order to substantiate our case, we studied the RXTE-Proportional Counter Array (PCA) observation of the source particular to γ variability class during MJD 50654.02 (the same observation considered in Belloni et al. (2000); following the standard data reduction procedures10 (see also Radhika et al. 2016a)). A variability profile similar to 11th segment (MJD 58008.05 – middle panel in Fig. 14) and an elongated CCD without any branches was observed. In addition, a mHz QPO feature was obtained in the power spectra from the RXTE-PCA observation during γ class. An overplot of PDS for all the 4 segments during Epoch 16 along with that obtained from RXTE-PCA during γ variability class, is plotted in Fig. 15. Segments 11 and 14 show mHz QPOs at ∼13.6 and 18.1 mHz, respectively, with a broad Lorentzian peak at ∼2 Hz. The total rms variability of 16.9|$_{-1.0}^{+1.2}$| per cent obtained for the 11th segment is comparable to the value obtained from RXTE-PCA observation of the source during γ class i.e. 18.8|$_{-1.3}^{+0.9}$| per cent. The total rms for 14th segment was 14.9|$_{-1.2}^{+1.2}$| per cent. Segment 2 showed a total rms variability of 34.4|$_{-2.0}^{+1.6}$| per cent without any detection of QPO features in the PDS.
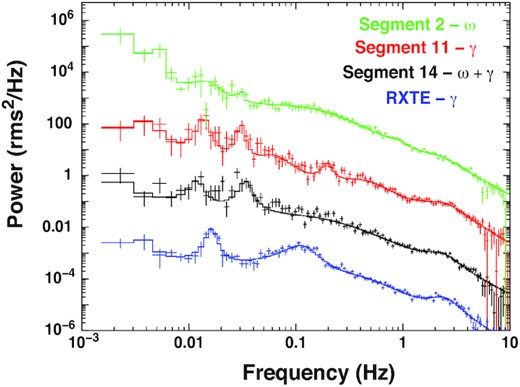
Overplot of PDS obtained from segments 2, 11, and 14 during Epoch 16 along with that obtained from RXTE-PCA observation of the source during γ variability class (plotted in blue). The PDS of segments 2, 11, and RXTE are scaled by a factor of 104, 102, 10−2, respectively w.r.t that of segment 14. See the text for details.
The energy spectra for these three classes: ω, γ, and ω + γ, are well fitted using Model-1. The spectral fit during ω class shows a Γ of 2.3|$_{-0.1}^{+0.1}$| with kTin of 2.3|$_{-0.1}^{+0.1}$| keV and kTe of 5|$_{-0.1}^{+0.4}$| keV, whereas the spectral fits during γ and ω + γ classes exhibited a decreased Γ of 3.4|$_{-0.1}^{+0.1}$| and 3.1|$_{-0.1}^{+0.1}$|, respectively, with a steady kTin of 2.6|$_{-0.1}^{+0.1}$| keV and kTe varying between 13.7|$_{-0.7}^{+0.7}$| and 8.3|$_{-0.3}^{+0.6}$| keV. All the three classes showed a dominant disc flux contribution varying between 71 and 75 per cent. Best-fitting model parameters for timing and spectral results are listed in Tables 2 and 3.
4.4 Evolution of ‘spectrotemporal’ features
Fig. 16 shows the overall time evolution of the spectral and temporal parameters during different Epochs of AstroSat observations. The variation of disc temperature (kTin), photon index (Γ), electron temperature (kTe), and fractional flux from the model components – Comptonized flux fraction (green points), and the disc flux fraction (red points) in per cent, are shown in the first four panels (top to bottom). Evolution of QPO frequency (ν) and the total rms (per cent) are shown in the bottom two panels in the figure.
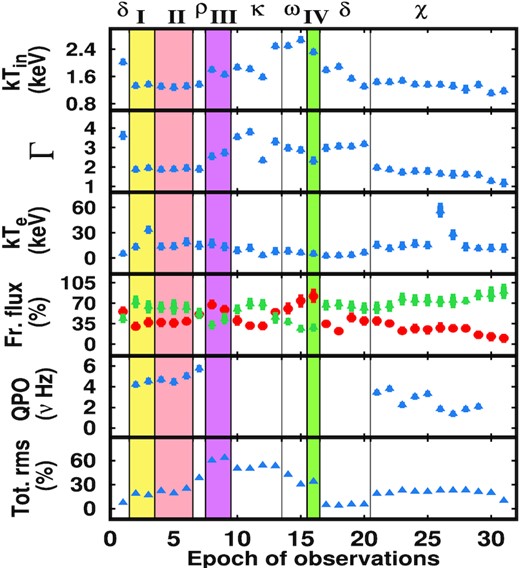
Overall time evolution of the spectral and temporal parameters of the source during the course of AstroSat observations are shown. Different class variabilities detected are denoted. The shaded regions in yellow (I), coral (II), magenta (III), and green (IV) represent the class transition from χ → HB (ρ′) (see Section 4.3.1), variants of ρ – ρ′ (see Section 4.3.2), ρ → κ via an ‘unknown’ class (see Section 4.3.3), and ω → γ (see Section 4.3.4), respectively. The evolution of spectral parameters, i.e. the electron temperature (kTe), disc temperature (kTin) in keV, Photon Index (Γ), fractional contribution of flux (fr. flux) i.e. disc flux (red points) and Comptonized flux (green points) are shown in the top four panels, respectively. The last two panels at the bottom show the evolution of temporal parameters; QPO frequency (ν) in Hz and the total rms variability (Tot. rms) of the PDS (in per cent), respectively.
The initial low intensity phase (Epochs 2 & 3 in Fig. 1), is characterized by an energy spectra with photon index of ∼1.8, kTe and kTin varying between 11.5|$_{-1.1}^{+1.1}$| and 13.3|$_{-0.9}^{+0.8}$| keV, and 1.87|$_{-0.01}^{+0.01}$| and 1.95|$_{-0.01}^{+0.01}$| keV, respectively, with the disc flux contributing 21–29 per cent. The PDS shows prominent detection of low frequency Type-C QPOs of 4.3–3.9 Hz and has a flat-top noise of total rms ∼18 per cent (see Table 2). These variations of the ‘spectrotemporal’ parameters are indicative of the source occupying a hard state in the initial phase. During the rising phase of the source intensity (Epochs 4 to 13), a further increase is observed in Γ from 1.9 to 3, kTin from 1.3 to 2.4 keV with the disc flux contribution increasing from 37 to 54 per cent. kTe is observed to decrease from 33 to 7 keV (see Fig. 16 and Table 3). Meanwhile, between Epochs 2–7, the QPO frequency shows an anticorrelation with the QPO rms (see Fig. 17). As the QPO frequency increases from 3.9 to 5.6 Hz, the QPO rms amplitude is seen decreasing from 13 per cent to 5 per cent. The PDS nature changes from a flat-top noise to power law, and total rms increases from ∼22 to 51 per cent. The LFQPOs are seen transiting from a strong narrow Type-C to a broad feature. Based on the evolution of these ‘spectrotemporal’ characteristics of the source, it is evident that the source undergoes a spectral state transition from hard to intermediate state.
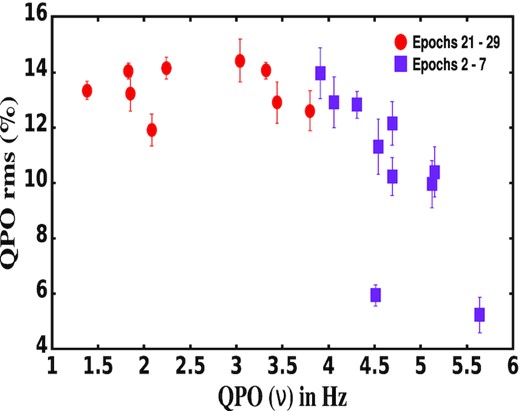
The plot shows the relationship between QPO rms and the QPO frequency. The red points represent the Type-C QPOs corresponding to Epochs 21 to 29. The purple points represent the parameters corresponding to Epochs 2 to 7. See the text for details.
As the source forges to the peak phase of light curve (from Epoch 14 to 20; Fig. 1), Γ reaches 3.4, and kTe decreases to 2.7 keV. An increase in disc flux contribution, from 60 per cent to 74 per cent is seen initially followed by an unusual decrease to 22 per cent. The source attains a softer state during this period. The source also exhibits a maximum bolometric luminosity of ∼36 per cent LEdd (calculated using the formula as stated in Section 3.2) during Epoch 17 (δ class). The PDS has a power-law nature with rare occurrence of a broad 0.1 Hz QPO (see panel d of Fig. 8). Finally, during the decline of source intensity in the light curve (Epochs 21 to 31 in Fig. 1), a steady decrease is observed in Γ from 1.9 to 1.1 with an associated increase in the Comptonized flux contribution from 61 per cent to 89 per cent (see Table 3). The minimum bolometric luminosity of ∼2.4 per cent LEdd was registered during Epoch 29 (χ class; see also Section 5). The PDS exhibited a flat-top noise with Type-C QPOs of frequency decreasing from 3.4 to 1.3 Hz and total rms remained in the range of 19|$_{-1}^{+1}$| – 23|$_{-1}^{+1}$| per cent (see Fig. 16; Table 2). In review of the correlation between QPO frequency and QPO rms during Epochs 21 – 29, it is observed that as QPO frequency increases from 1.3 to 2.2 Hz, QPO rms is seen to increase from 13.2|$_{-0.6}^{+0.5}$| per cent to 14.1|$_{-0.6}^{+0.7}$| per cent (see Fig. 17). However, the QPO rms shows a decreasing trend on further increase in the QPO frequency. This correlation pattern for Type-C QPOs, is in accordance with the results reported by Karpouzas et al. (2021), Zhang et al. (2020), Yan et al. (2013), who showed an initial increase in the QPO rms, reaching its maximum at ∼2 Hz and then decrease beyond 2 Hz. The source exhibited a sharp decline in the total rms amplitude, 22 per cent to 7 per cent, during the last observations. These characteristics trace the change in the state of the source, to hard state via an intermediate state. Following this, multiple flarings were seen in the light curve (Epoch 31 – Fig. 1) which probably held back the source from attaining quiescence.
The evolutionary trend seen in the ‘spectrotemporal’ features of the source, both during the rise and the decay, is analogous to that observed for any other outbursting black holes (see Fig. 16). Yet, the source fails in displaying a canonical HID (see Fig. 4). Another widely known attribute for an outbursting black hole is the total rms variability which is known to decrease as the source makes a transition from hard to soft state and increase as it makes a transition back to hard state. However, as seen in Fig. 16, for GRS 1915+105 the total rms variability has a different evolution pattern. Here, the total rms is seen to increase as the source evolves from hard to soft states. Significant change in the rms power is evident from Fig. 18, where we have shown the PDS for various Epochs corresponding to different classes. While the harder class (χ) have less power, the softer observations (|$\rho ,\ \kappa \ \& \ \omega$|) have high power in low frequencies. The increasing total rms variability during the rising phase (intermediate states), stands in accordance with the linear ‘total rms-flux’ relationship (Uttley & McHardy 2001) that has been, so far, observed in a few BHs like Cyg X-1 (see also Heil, Vaughan & Uttley 2012).
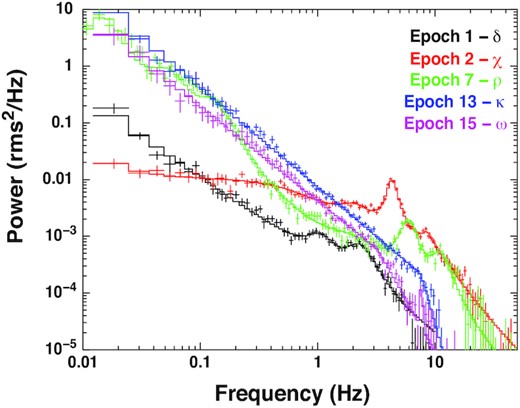
Overplot of PDS for the ‘canonical’ classes exhibited by the source indicating variation of total rms variability within the frequency range, 0.01–50 Hz. Lower values of rms power is observed for harder χ class, while the value increases for intermediate and softer classes (ρ, κ, ω, δ) in accordance with the rms–flux relation. See the text for details.
5 DISCUSSIONS AND CONCLUSIONS
In this paper, we perform an in-depth analysis of 31 AstroSat observations of GRS 1915+105 during the period of 2016 November to 2019 June 2019 by studying the broad-band ‘spectrotemporal’ features of the source. Based on the long-term variability of the source using MAXI light curve (see Fig. 1), we delineate the evolution track of the source. The source is found making large amplitude variations between MJD 57700 to 57760, where the X-ray intensity of the source is relatively high. The AstroSat observation of the source during MJD 57704 (Epoch 1) asserts the same. The flux of the source shows a slow increase during MJD 57800 to 58050, which corresponds to Epochs 2 to 17, followed by a highly varying phase (Epochs 17–20), and finally a gradual decrease beyond MJD 58200 (Epochs 21–31). The X-ray intensity variations since MJD 57760 resembled the light curve of a ‘canonical’ outbursting BH, exhibiting a slow-rise and slow-decay profile (Debnath, Chakrabarti & Nandi 2010). It has to be noted that the rise time (∼300 d) and decay time (∼200 d) of the light curve for this phase of GRS 1915+105, are longer in comparison to the canonical sources (except GX 339–4; Belloni et al. 2005; Nandi et al. 2012).
Although the HR values exhibit a decrease during high intensity state and an increase in the low intensity state, there appears a patternless variation in the overall HR track and the typical HR variation seen during an outburst is not observed. This resulted in the HID not achieving a complete ‘q’-shape or hysteresis (see also Radhika et al. 2016b; Baby et al. 2020, 2021), unlike canonical sources (see Fig. 4). Previous studies of the HID of GRS 1915+105, performed by Chen et al. (1997) using RXTE observations only during the peak (1996 May–October), also did not detect hysteresis. A mechanism for hysteresis is postulated by Begelman & Armitage (2014), where magnetic rotational instability (MRI) drives the viscosity parameter (α) to 1, resulting in L ∼ LEdd during the peak. This MRI strength is augmented during the quiescence by the net fields. This field diffuses during the outburst and hence leads to the drop in the luminosity, which is seen as a hysteresis. In the present scenario, GRS 1915+105 displays a maximum bolometric luminosity of ∼36 per cent LEdd during the peak. We refer to the aforementioned phenomena and presume a possibility as to why the hysteresis is not observed during the AstroSat observation period. Only in the event of quiescence, MRI is built up which further leads to LEdd during the outburst. Since GRS 1915+105 has never attained quiescence, it has not been driven to LEdd in this cycle. Thus, we do not observe any evidence of hysteresis in the HID during this period.
Throughout the 31 Epochs, the source is seen to exhibit various structured and non-structured variability classes. Referring to the light curve and CCD profiles as shown in Section 4.2 and with reference to Belloni et al. (2000), we deduce that the source was initially in a δ class during the peak, followed by a sequence of class transitions: χ → ρ → κ → ω → γ → δ in the rising phase, and δ → χ in declining phase of the three year observation period considered. During the δ class, the source has a softer energy spectrum and less electron temperature, along with the absence of QPOs (see Fig. 5). Similar characteristics, based on AstroSat observations, have been reported by Sreehari et al. (2020). These are indicative of a disc-dominated emission, where the Keplerian disc is closer to the central object. During the low flux phase of the light curve, the source exhibits χ variability class for a few segments during Epochs 2 and 3, where the energy spectra are harder with contribution of hard photons till 60 keV and a dominating Comptonized flux (see Fig. 6 and Table 3). These Epochs also exhibit relatively lower photon index and higher total rms variability with strong Type-C LFQPOs in the PDS (see also Rawat et al. 2019; Misra et al. 2020). During the ‘heart-beat’ ρ class, the source exhibited periodic single burst peaks with multiplicity 1 as referred by Yadav et al. (1999), Massaro et al. (2010). The burst profiles have varying peak intensity (see Fig. 7), in contrast to previous observations with RXTE (Belloni et al. 2000). The burst sequence is interpreted as an emptying/refilling cycle of the inner portion of the accretion disc. In our observations, we notice the gradual decrease in the recurrence time of the pulse accompanied by an increase in the burst strength over time (see Fig. 11). This observation also stands compatible with the anticorrelation between recurrence time and amplitude of the burst as proposed by Weng et al. (2018).
During transition to κ class, a gradual increase is observed in Γ from 2.5 to 3.8 and kTin from 1.8 keV to 2.4 keV (see Table 3). The disc flux, however, does not show any increase, whereas an increase in the Comptonized flux is noticed. The additional powerlaw coupled with the Comptonizing corona model, indicates the presence of an extended corona above the disc (see also Pahari & Pal 2010; Sreehari et al. 2020 for a similar reasoning). It is assumed that the soft photons from the disc are Comptonized from this extended corona. These are suggestive of an intermediate state where strong wind outflows are generated with a possible re-entry of matter into the Corona (Pal, Chakrabarti & Nandi 2013). During Epochs 14 and 15, where the source displayed ω variability class (Klein-Wolt et al. 2002), the light curve showed aperiodic dip (low) and non-dip (high) regions (see Fig. 9). A similar pattern was observed during the long-term observation study by Naik et al. (2002a), Pahari & Pal (2010), where the source is seen to be switching between high intensity and low intensity states and finally the variability disappears and settles down at a high intensity state. In this paper, we do not proceed with the detailed behaviour of the source during the low intensity and high intensity states. But an overall analysis of the source during this period shows an increasing disc flux contribution (see also Zdziarski et al. 2005), from 60–74 per cent, along with a relative decrease in kTe from 8.4|$_{-1.0}^{+1.0}$| to 6.3|$_{-0.1}^{+0.2}$| keV. No narrow QPOs were observed during this period, similar to Naik et al. (2002a). The χ class appears once again during the declining phase of the source flux from Epoch 21 to 31. This is supported by a constant decrease in the Γ and kTin values and a corresponding increase in the Comptonized flux (see Fig. 16 and Table 3). This refers to a very low Keplerian rate with a larger Comptonized corona resulting in a harder spectra (Pal et al. 2013). Very strong QPOs with harmonics have also been observed, and the fundamental frequency of the QPO decreases during the decline phase (see Table 2 and Fig. 16). A positive correlation is seen between the QPO frequency and rms amplitude of the QPO till 2.24 Hz, and beyond that an anticorrelation is seen between the two (see Fig. 17). Karpouzas et al. (2021) give a schematic picture of the evolution of the corona and the inner radius of the disc of the source, corresponding to the change in the behaviour of QPO rms-frequency around ∼1.8 Hz. Their analysis reveals that, as the QPO frequency decreases from 5 to 2 Hz, the size of the corona decreases and at a critical frequency ∼1.8 Hz and below that, the size of corona begins to increase again. They however do not explain the mechanism that triggers this switch in behaviour.
We also witness class transitions in the source (Section 4.3) within an Epoch itself. These transitions were accompanied by evident change in the light curve, CCD, spectral, and temporal parameters. Interestingly, during the transition of the source from |$\chi \longrightarrow \rho$| through an intermediate state (Fig. 10), the source returns to a χ class before proceeding to the intermediate state once again and settling at the ‘heart-beat’ state. In addition, the ‘heart-beat’ profile is broad and less intense during these Epochs, and not similar to what has been observed previously for this source (Belloni et al. 2000). It has to be noted that Rawat et al. (2019), Misra et al. (2020) had also reported on the transition from |$\chi \longrightarrow \rho$|. For comparison, the segment which they have quoted as intermediate state (segment-2 of Epoch 3 for an example) has similar ‘spectrotemporal’ characteristics as that of a ‘heart-beat’ class (see Section 4.3.1; last segment of Epoch 3 in Fig. 10). From our analysis based on the AstroSat observations, the burst profile of the ‘heart-beat’ state (ρ′) is seen pursuing evolution over a few days time (see Section 4.3.2). The profiles have significant variation in the source intensity, skewness of the flares (Fig. 11) and varying periodicity indicated by an increase in frequency of mHz QPOs from 5.8 to 14.1 mHz (Fig. 12; see also Katoch et al. 2021 on the report of mHz QPO during Epoch 2). Detection of these characteristics are unique and novel, and not been discussed till date for any observations of the source.
An unusual characteristic is exhibited in the light curve and CCD as the source transits from ρ to κ class, where a random appearance of dip and flares are observed, resulting in an ‘unknown’ class (see Section 4.3.3; Fig. 13). Since AstroSat did not observe the source continuously, it is difficult to comment on the exact Epoch which tracks the beginning of this feature and how it evolved until the source reached a complete κ class. In review of the transition from |$\omega \longrightarrow \gamma$|, an earlier study by Belloni et al. (2019) had reported about transition of the source from ω to μ class. Our in-depth analysis of the light curve, CCD, and the PDS showing the presence of mHz QPOs (see Fig. 15), prove the transition to be from ω to γ and a combination of both classes during the final segment of the observation (see Fig. 14). A comparative study with RXTE-PCA observations corroborate the result (see Section 4.3.4 and Fig. 15). All such transitions occurring within a few hours duration are very rare in this source.
Previous studies by Chakrabarti et al. (2005) using the Indian X-ray Astronomy Experiment (IXAE) and RXTE observations have shown transitions from κ → ρ, χ → ρ, χ → θ, and ρ → α. Naik et al. (2002b) further deduced that a transition from χ to ρ state happens through an intermediate class α. However, we note that even though we observe multiple intermediate states during the transition χ → ρ, they do not resemble that of an α class. From our studies, we observe a transition from |$\chi \longrightarrow \rho ^\prime$| within a time-scale of ∼2.1 ks. The transition from ω to γ variability classes in ∼2.2 ks, and the emergence of a combination of both ω and γ variability classes after a time-span of ∼10.2 ks was also observed. Initial studies account these time-scales to be associated with the time to fill up the inner disc, on a viscous time-scale (Belloni et al. 1997b). However, Chakrabarti et al. (2005) state that these time-scales are smaller in comparison to the viscous time for the Keplerian disc of this source and therefore conclude that the accretion flow is sub-keplerian in nature and is originating close to the compact object. Another study by Lasota (2001) states that although the thermal time-scale is much shorter than viscous time-scale in an equilibrium disc, during a local disc instability, both time-scales are comparable. In conjunction with Lasota (2001) and Mayer & Pringle (2006), we speculate that the time-scales for the transitions observed in this source correspond to the local disc instabilities induced by the radiation pressure domination within the inner disc, at thermal-viscous time-scales.
Although there have been many efforts in explaining the features and evolution of the source associated to a certain class, there are only a few attempts to explain the physical processes which trigger a specific class transition. Misra et al. (2004), Adegoke, Mukhopadhyay & Misra (2020), Massaro et al. (2020) use a non-linear time series (NLTS) analysis to explain the various types of long-term variability in terms of deterministic non-linear system with inherent stochastic noise. They attempt to derive the global equations that govern the temporal behaviour of the system. Alternatively, Chakrabarti & Nandi (2000), Chakrabarti et al. (2005) consider the advective disc paradigm of black hole accretion to study the variation of light curve of the source. It is postulated that the propagation of the source characteristics through three fundamental states, which primarily differ by the varied Keplerian and sub-Keplerian accretion rates, accounts for all the variabilities observed in the light curves (see also Nandi et al. 2001).
Owing to AstroSat’s broad-band spectral and temporal coverage, the evolution of ‘spectrotemporal’ features of the source during the different Epochs could be thoroughly studied. In the PDS during different Epochs in the rising phase, as the source evolves from hard state to intermediate states, Type-C QPOs are seen evolving into a broader feature with a monotonic increase in the QPO frequency (see Fig. 16). The noise associated with the PDS slowly advances from a flat-top to power-law noise. This rising phase is also associated with an increase in photon index and the disc flux contribution along with the decrease in kTe. During the decline, the contribution of Comptonized flux and kTe is seen to increase with a gradual reduction in photon index. Type-C QPOs reappear as the source descends into hard state (see Section 4.4). Such correlated ‘spectrotemporal’ features and systematic evolution of QPO frequencies of BH sources including GRS 1915+105, have been identified earlier by Shaposhnikov & Titarchuk (2007), Shaposhnikov & Titarchuk (2009) and is also in accordance with canonical sources like H 1743–322 (Debnath, Chakrabarti & Nandi 2013), GX 339–4 (Belloni et al. 2005; Nandi et al. 2012; Sreehari et al. 2019a), XTE J1859+226 (Casella et al. 2005; Radhika & Nandi 2014; Nandi et al. 2018), MAXI J1535–571 (Bhargava et al. 2019). Our results are in agreement with the hypothesis postulated by Molteni, Sponholz & Chakrabarti (1996), Ryu, Chakrabarti & Molteni (1997), Rao et al. (2000), Das et al. (2014), where it is speculated that the QPOs are generated by the oscillation of post-shock regions. As the post-shock region stretches closer to the BH, the QPO frequency increases along with the disc flux. The increased number of soft photons from the close-by disc cools down the Compton cloud, thereby decreasing the electron temperature as the source softens. A similar coronal oscillatory model proposed by Titarchuk & Fiorito (2004) also favours the scenario.
We also examined AstroSat data for evidences referring to internal obscuration beyond MJD 58600. The presence of intrinsic obscuration has been reported very recently using different partial covering absorption models along the continuum, in addition to the interstellar absorption model. Various researchers (Miller et al. 2020; Balakrishnan et al. 2021; Motta et al. 2021) used different combination of models to describe the observed obscuration. Our attempts with the model (phabslos(phabs1*cutoffpl+const*phabs2*cutoffpl+pexmon)) suggested by Balakrishnan et al. (2021) do not imply a statistically significant fit which gave a local absorption value of 0.07 × 10²² atoms cm−2 and a reduced chi-square of 1.72 during Epoch 31, whereas the local absorption column density value could not be constrained during Epoch 30. The model combination in Miller et al. (2020) uses photoionized absorption models on three highly resolved Chandra-High Energy Transmission Grating (HETG) spectra, one as the source enters the internal obscuration and the latter two when the source is deeply obscured. This model combination reveals strong absorption lines. Considering the moderate spectral resolution of SXT in comparison to Chandra, we did not implement the methodology used by Miller et al. (2020). We were able to adopt the simplest model that copes with the already existing model i.e. a partially covering absorber TBpcf along the continuum (Motta et al. 2021). Thus, we used the model form TBabs*constant(TBpcf(diskbb+gauss+nthcomp)) to fit the broad-band spectrum from AstroSat. Fig. 19 shows an overplot of two energy spectra corresponding to Epoch 31 obtained with (plotted in red) and without (plotted in black) considering the TBpcf model. The energy spectrum modelled without TBpcf yielded a χ2/dof of 197.6/137. Inclusion of TBpcf along the continuum significantly improved the fit with χ2/dof of 139.7/134. The absorption column density along the line of sight for both Epochs remained ∼5 × 10²² atoms cm−2, although our analysis showed an additional absorption of 45 × 1022 atoms cm−2 with a local partial covering fraction (PCF) of 0.13 during Epoch 30. A local absorption of 108 × 1022 atoms cm−2 with a corresponding PCF of 0.41 was seen during Epoch 31. The best-fitting spectral parameters obtained for Epochs 30 and 31 are mentioned in Table 4. These absorption values are comparable to that obtained by Motta et al. (2021), even though the observations considered by them falls 200 d behind our observations. The nH estimation from Balakrishnan et al. (2021) during these days also affirms our results. The intrinsic bolometric luminosity values were also estimated for Epochs 30 and 31 by using the cflux model, i.e. TBabs(cflux(TBpcf(diskbb+gauss+nthcomp))). Epoch 30 exhibited an intrinsic bolometric luminosity of 0.6 per cent LEdd, while Epoch 31 showed a value of 0.8 per cent LEdd. We also estimated the intrinsic bolometric luminosity for these two Epochs without including the TBpcf model along the continuum, i.e. TBabs(TBpcf(cflux(diskbb+gauss+nthcomp))). The bolometric luminosities were found to be 0.7 per cent LEdd during Epoch 30 and 1.5 per cent LEdd during Epoch 31. The decrease in the intrinsic bolometric luminosity, upon including the partial covering absorber along the continuum, is the result of obscuration around the source. Further detailed correlation study between the obscuration and the intrinsic bolometric luminosity of the source is beyond the scope of the present paper. Considering the low flux along with the high absorption values, we conclude that internal obscuration is a dominant effect at lower energies during the later stages in the light curve (after MJD 58600), in agreement with Miller et al. (2020), Balakrishnan et al. (2021), Motta et al. (2021). However, we did not observe any absorption lines as reported by Miller et al. (2020) (due to reduced spectral resolution of SXT/AstroSat in comparison to Chandra). Miller et al. (2020) also computed the magnetic field strength required to launch a disc wind from small radii. The magnetic field during this period was found to be too low, to expel the wind to infinity, causing a failed wind, which further envelopes the central engine leading to obscuration. It is intriguing to note that even after returning to a low-flux phase, GRS 1915+105 did not attain a quiescence. Repeated flaring in X-rays and radio have been detected (Homan et al. 2019b; Iwakiri et al. 2019; Motta et al. 2019; Trushkin et al. 2019b; Reynolds, Miller & Balakrishnan 2020); with a recent report of re-brightening in the source intensity by MAXI, Neutron Star Interior Composition Explorer – NICER, and AstroSat observations indicating an evolving energy spectrum and PDS with LFQPOs (Neilson et al. 2021; Ravishankar et al. 2021). A detailed study of the disc–jet coupling during the multiple flaring events based on near-simultaneous multimission observations will be performed and presented elsewhere (Athulya et al., in preparation).

Overplot of the broad-band energy spectra of the source corresponding to Epoch 31 obtained with and without the partial covering absorption model, TBpcf. The corresponding residuals obtained from both model combinations are shown in the middle (without TBpcf) and the bottom (with TBpcf) panels. The |$\chi ^{2}_{\rm red}$| values for both cases are also mentioned in the respective panels. See the text for details.
Best-fitting broad-band spectral parameters corresponding to Epochs 30 and 31 obtained by using the model combination TBabs(TBpcf(diskbb+gauss+nthcomp), where TBpcf is the partial covering absorption model along the continuum. The nH (× 1022 atoms cm−2) indicates the local absorption value; the PCF denotes the local partial covering fraction. The other parameters in this table are defined in the caption of Table 3. Errors for all the parameters are calculated with 90 per cent confidence.
| Epoch | nH × 1022 | PCF | Γ | kTin | Ndiskbb | Eline | Line width | kTe | Nnthcomp | Lbol | χ2/dof |
|---|---|---|---|---|---|---|---|---|---|---|---|
| atoms cm−2 | (keV) | (keV) | (keV) | (keV) | (percent LEdd) | ||||||
| 30 | 45.2|$_{-4.6}^{+8.1}$| | 0.13|$_{-0.02}^{+0.02}$| | 1.13|$_{-0.06}^{+0.06}$| | 1.32|$_{-0.04}^{+0.05}$| | 3.2|$_{-0.7}^{+0.7}$| | 6.47|$_{-0.14}^{+0.21}$| | 0.6* | 9.5|$_{-0.8}^{+1.2}$| | 0.01 † | 0.6 | 79.6/87 |
| 31 | 108.0|$_{-18.3}^{+11.7}$| | 0.41|$_{-0.01}^{+0.01}$| | 1.21|$_{-0.05}^{+0.06}$| | 1.09|$_{-0.07}^{+0.09}$| | 7.6|$_{-1.2}^{+0.9}$| | 6.63|$_{-0.31}^{+0.29}$| | 0.90|$_{-0.07}^{+0.05}$| | 16.6|$_{-1.4}^{+1.7}$| | 0.01 † | 0.8 | 139.7/134 |
Note. * Frozen; † Error values are insignificant
ACKNOWLEDGEMENTS
We thank the anonymous reviewer for his/her suggestions and comments that helped us to improve the quality of the manuscript. AMP, RD, SN, SM, AN acknowledge the financial support of Indian Space Research Organisation (ISRO) under RESPOND (Research Sponsored) program Sanction order No. DS-2B-13012(2)/19/2019-Sec.II. This publication uses data from the AstroSat mission of the ISRO archived at the Indian Space Science Data Centre (ISSDC). This work has been performed utilizing the calibration data bases and auxiliary analysis tools developed, maintained and distributed by AstroSat-SXT team with members from various institutions in India and abroad. This research has made use of MAXI data provided by RIKEN, JAXA, and the MAXI team. Also this research has made use of software provided by the High Energy Astrophysics Science Archive Research Center (HEASARC) and NASA’s Astrophysics Data System Bibliographic Services. VKA, RBT, AN also thank GH, SAG; DD, PDMSA and Director-URSC for encouragement and continuous support to carry out this research.
Facilities: AstroSat, MAXI, RXTE.
DATA AVAILABILITY
The data used for analysis in this article are available in AstroSat-ISSDC website (https://astrobrowse.issdc.gov.in/astro_archive/archive/Home.jsp), MAXI website (http://maxi.riken.jp/top/index.html), and RXTE observation from HEASARC data base (https://heasarc.gsfc.nasa.gov/docs/cgro/db-perl/W3Browse/w3browse.pl).
