


This is an erratum to the paper ‘Resolving the age bimodality of galaxy stellar populations on kpc scales’ (2017, MNRAS, 468, 1902–1916). Due to a bug in the code that applies the 1/Vmax volume weighting of the galaxies in the sample, the 1D and 2D distributions are incorrect. This affects all figures, except figs 4 and 5, which are based on individual galaxies. The new corrected figures are reported in this erratum with the correct weighting, including the two figures in appendix A and B. The qualitative conclusions from these figures and the general conclusions of the paper are not affected. In the majority of the cases the changes in the distributions are very limited or marginal from a qualitative point of view, however positions and shapes of the peaks of the distributions may slightly change quantitatively. In particular, with respect to the original figures, the new corrected ones display a less clear bimodality for the light-weighted and mass-weighted distribution of the complete sample.
The weighting scheme correction affects the inferred Cosmic Star-Formation History (CSFH), in a way that is significant from a quantitative point of view. In the original version, we noted that the stellar mass density inferred from our measurements exceeded the integral of the CSFH by a factor 1.8 roughly, which was actually quite puzzling. With the correct weighting scheme, the total inferred stellar mass density is now 0.67 times the integral of the CSFH, which is actually very reasonable considering the surface brightness cuts applied in our analysis (implying a systematic loss of luminosity and mass budget) and the effect of overshining of the young low-M/L populations over the old high-M/L ones. The fourth paragraph of section 5 must be changed as follows:
‘Fig. 9 shows the inferred CSFH adopting as age either the mean formed-stellar-mass weighted age (blue, thick histograms) or the mean r-band-luminosity weighted age (grey, thin histograms). In addition, with red circles and error bars we overplot the measurements of the cosmic averaged SFR as a function of time, extracted from the compilation of Madau & Dickinson (2014, MD14 hereafter, table 1). The two histograms for each age determination, solid lines with filled area and dotted lines without shading, correspond to the original normalization in total present-day stellar mass obtained from our analysis, and to the normalization to the present-day stellar mass derived from the CSFH in MD14, respectively. The internal normalization from our data is roughly a factor 1.5 lower than the one obtained by MD14 (which is, in turn, in rough agreement with the determination from the stellar mass functions in the local Universe in the literature). This may be caused primarily by the surface brightness cut we introduce in our analysis, and also by possible biases in the stellar mass estimates due to young and low-M/L populations outshining the higher-M/L ones in the optical-NIR emission. Leaving the overall normalization apart, the difference in shape between the age-distribution-inferred CSFH and the MD14 is apparent [...]’
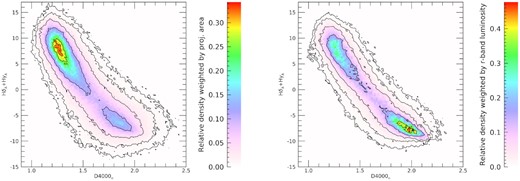
Distribution of regions in the age diagnostic diagram of HδA + HγA versus D4000n. In the left panel regions are weighted by their projected physical area, while in the right panel regions are weighted according to their r-band luminosity. Both distributions are corrected for Vmax. Contours represent densities of 0.9, 0.75, 0.3, 0.1, 0.03, 0.01 relative to the maximum in each distribution. An old peak, at high D4000n and low HδA + HγA, and a young peak, at low D4000n and high HδA + HγA, are present in both distributions, although the relative height is reversed.
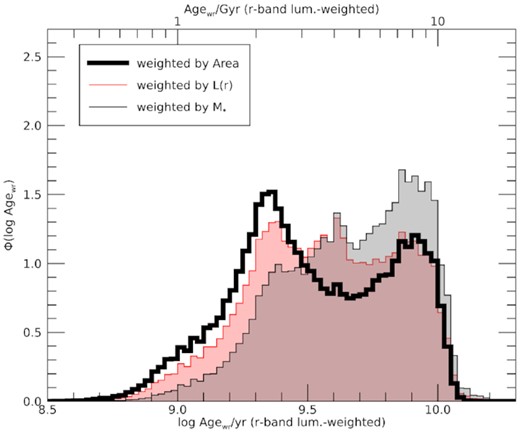
Distributions in r-band luminosity weighted age, Φ(log Agewr), for all regions in all galaxies, weighted by physical projected area, r-band luminosity and present-day stellar mass, respectively (see legend). All distributions are corrected for Vmax and normalized to unity integral.
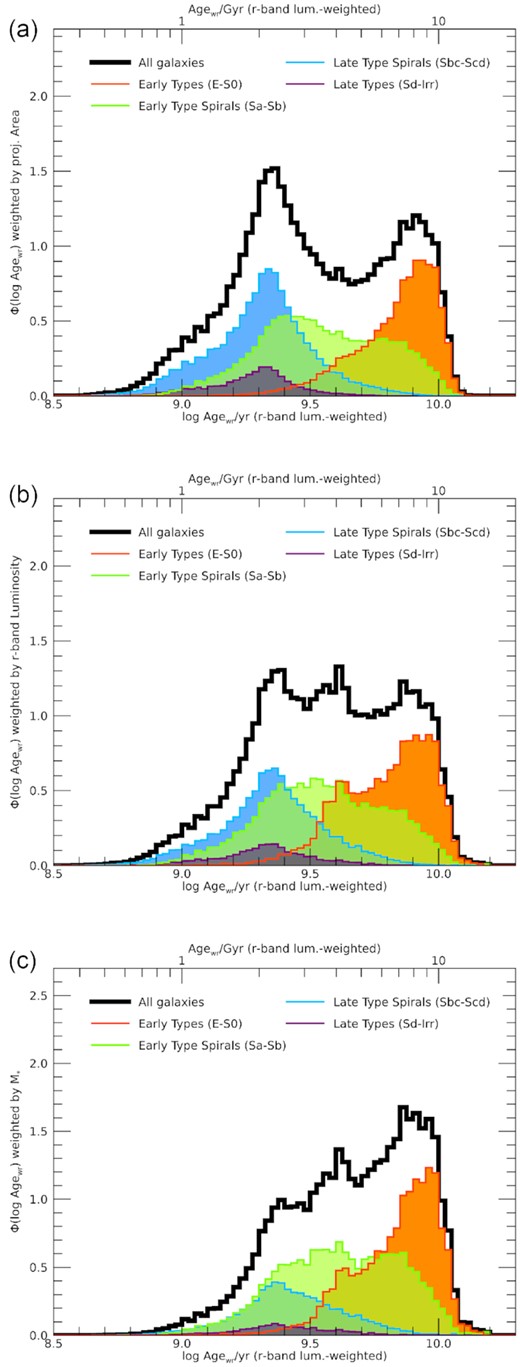
r-band luminosity weighted age distributions, Φ(log Agewr), for all regions split according to the morphology of the galaxy they belong to (see legend). The distribution for all galaxies is reported for reference by the black histogram. The three panels refer to the three weighting schemes: by physical projected area (panel a), r-band luminosity (panel b), and present-day stellar mass (panel c). All distributions are corrected for Vmax and normalized to unity integral.
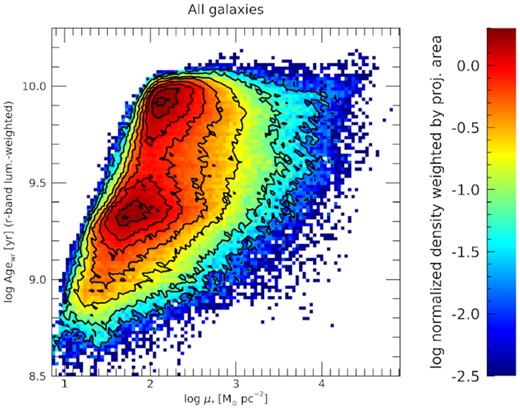
Distribution of all regions from all galaxies, volume corrected and weighted by physical projected area, in the log μ* − log Agewr plane. The distribution is normalized to unity integral. Contours mark densities that are 0.9, 0.75, 0.5, 0.35, 0.20, 0.1, 0.03, and 0.01 times the maximum density.
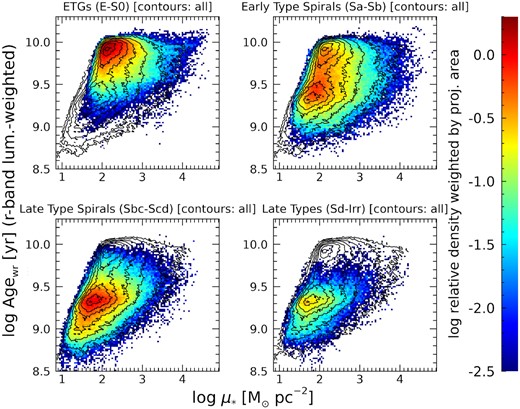
Distribution of regions belonging to galaxies of different morphological classes, volume corrected and weighted by physical projected area, in the log μ* − log Agewr plane. Distributions are normalized as in the overall distribution of Fig. 6, so that the sum of the four panels results in the overall distribution. Contours mark densities that are 0.9, 0.75, 0.5, 0.35, 0.20, 0.1, 0.03, and 0.01 times the maximum density of the overall distribution of Fig. 6.
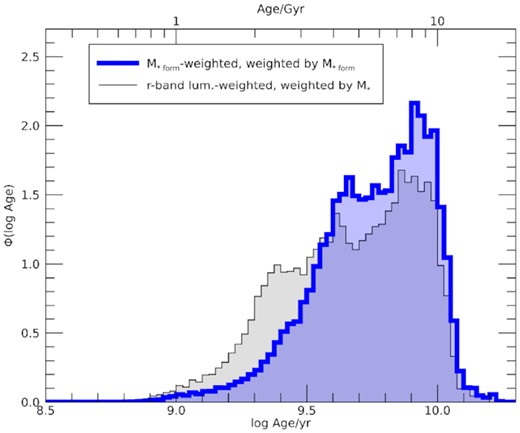
Distributions in formed stellar-mass-weighted age weighted by the formed stellar mass in each region (blue histogram) and in r-band luminosity weighted age weighted by present-day stellar mass (black histogram, reproduced from Fig. 2), including all regions in all galaxies. The distributions are corrected for Vmax and normalized to unity integral.
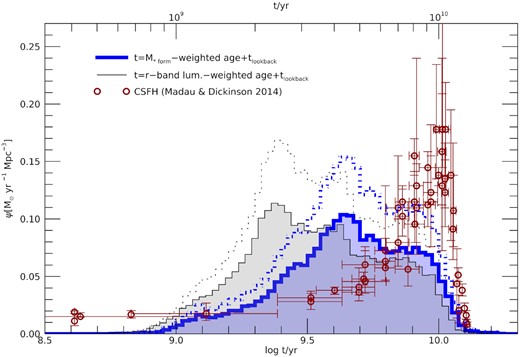
The Cosmic SFHs inferred from our age distributions compared to the comoving density of SFR as a function of time directly measured (data from the compilation of Madau & Dickinson 2014, points with errorbars). Blue histograms are based on the distributions of formed-stellar-mass-weighted age, weighted by the formed stellar mass of the regions; black histograms are based on the distributions of r-band luminosity-weighted age, also weighted by the formed stellar mass of the regions. Solid and dotted lines adopt two different normalizations for our data: the solid lines are for the natural normalization of our dataset, while for the dotted lines our data have been normalized so that the present-day stellar mass density equals the one obtained by Madau & Dickinson (2014).
The correction of the weighting scheme impacts significantly also Appendix A and Fig. A1. The trends in the balance between the young and the old peak as a function of galaxy inclination are now much closer to the expectations for the different geometrical projections of spherical bulges and flat disks. The second paragraph of Appendix A must be changed as follows:
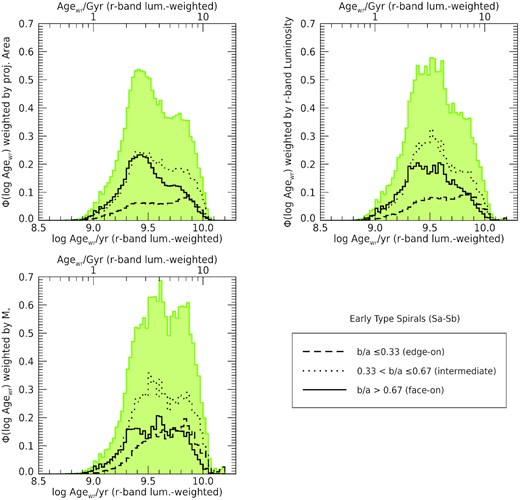
Distribution of galaxy regions for early-type spirals only (Sa-Sb), volume corrected and weighted by physical projected area (top left panel), r-band luminosity (top right panel) and present day stellar mass (bottom left panel). The shaded histogram includes all galaxies in these morphological classes (same as the green histogram in in Fig. 3, while different lines are for subsamples of different apparent axial ratio b/a, i.e. inclination (see legend).
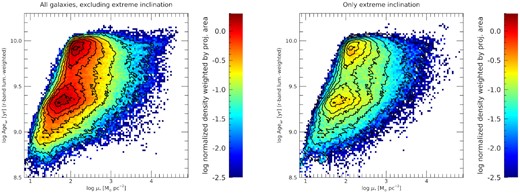
Distribution of galaxy regions, volume corrected and weighted by physical projected area, in the log μ* − log Agewr plane: contours display the distribution for the full galaxy sample (same as Fig. 6), while the colours show the distributions after excluding high inclination systems (left panel) and for highly inclined disks only (right panel). Note: the sum of these two distributions is exactly the distribution of Fig. 6.
‘Fig. A1 shows the age distributions for the entire early-type spiral sample and for the three sub-classes of inclination, each panel displaying one of the three weighting schemes discussed in the paper. Looking at the first two plots, which refer to the weighting by projected area and by r-band luminosity respectively, we note that the relative height of young peak is maximum for the low-inclination and minimum for the edge-on systems. The relative suppression of the young peak in galaxies with increasing inclination can be easily understood as a simple geometrical effect, as the projected area of the disc is reduced with respect to lower-inclination galaxies. We also note that the two peaks, especially in the intermediate- and low-inclination galaxies, are hardly separated. Within the relatively bright range in SB covered by our analysis, the contamination of the disc by the light of the bulge is ubiquitous in these early-type galaxies and this can explain why there is a smooth transition between the young and the old part of the distribution, which makes the emerging bimodality very mild.’
Furthermore, we would like to correct a typo in the formula for the SFH à la Sandage (1986) in Section 2.3, whereby a factor 2 was missing and should read instead: |$SFR_\tau (t)=\frac{t}{\tau }\exp (-\frac{t^2}{2\tau ^2})$|.
Finally, we amend and clarify the description of the α parameter for the metal enrichment, by changing the corresponding sentence in Section 2.3 as follows:
‘α is a shape parameter describing how fast Z*(t) moves from |$Z_{*\, \mathrm{0}}$| to |$Z_{*\, \mathrm{final}}$|, with small values corresponding to a delayed transition (α = 0 is an instantaneous transition occurring at t = tfinal) and larger values to an earlier and progressively more rapid transition as α becomes larger than 1 (1 corresponding to a linear increase).'
