


ABSTRACT
We investigate the origins of the uniquely elongated (1067 kpc in length and 97 kpc in width) association of galaxies known as NGC 3109, positioned at ∼ 1 Mpc from the Local Group (LG). To understand its likely origins, we have conducted a series of numerical simulations where the NGC 3109 association is represented as a regular, gravitationally bound N-body system of five galaxies, stripped from most of their dark matter due to previous tidal effects. The association evolves for 10 Gyr in an analytical potential representing the influence of the LG. We find that a loosely gravitationally bound system of five galaxies in a hyperbolic orbit toward the LG evolves into a tidally elongated structure similar to recent observations of NGC 3109. In this proof of concept model, the N-body simulations can reproduce the observations of the NGC 3109 association, such as its dimensions, as well as the radial velocity and distance from the LG.
1 INTRODUCTION
The Local Group (LG) of galaxies consists of more than 100 members. Milky Way (MW), Andromeda, and Triangulum are the most massive, but the dwarf galaxies dominate the number counts (McConnachie 2012, McConnachie et al. 2018, Drlica-Wagner et al. 2020). Galaxies belonging to the LG lie within a ∼ 1 Mpc sphere and have velocity dispersion σr = 61 ± 8 km s−1 (van den Bergh 1999). A large fraction of these galaxies is found to form large, thin planar structures around both MW and Andromeda (Ibata et al. 2013, Pawlowski, Kroupa & Jerjen 2013), and observations have discovered similar such configurations outside the LG (Tully et al. 2015, Muller et al. 2018).
On a smaller scale, dwarf galaxies are also found in small associations which can be gravitationally bound (Tully et al. 2006), and can be rich in dark matter (Behroozi, Wechsler & Conroy 2013; Moster, Naab & White 2013). NGC 3109 is one of these associations (Bellazzini et al. 2013). This association consists of five galaxies: NGC 3109, Antlia, Sextans A, Sextans B, and Leo P (Shaya & Tully 2013) which lie just outside of the radius of the LG at its edge (Bellazzini et al. 2013).
By far, the largest galaxy in the group is the gas-rich dwarf irregular galaxy NGC 3109 (Soszynski et al. 2006, McConnachie 2012, Carignan et al. 2013). Antlia is a dwarf spheroidal galaxy exhibiting a possible dynamical tail (Piersimoni et al. 1999, Blitz & Robishaw 2000, Penny et al. 2012). Sextans A and B are two dwarf irregular galaxies possibly in interaction (Ott et al. 2012; Bellazzini et al. 2014). Leo P is the smallest and latest discovered galaxy (McQuinn et al. 2013, McQuinn et al. 2015). Many works are focusing on these galaxies individually (Whiting, Irwin & Hau 1997, Penny et al. 2012, Bellazzini et al. 2014, McQuinn et al. 2015). In this work, we focus on the whole association and its properties over Hubble time.
Table 1 presents observational data for galaxies in the NGC 3109 association: Morphological classification (van den Bergh 1999, McConnachie 2012), distance to the MW’s galactic centre DMW (McConnachie 2012, McQuinn et al. 2013), radial velocity with respect to the MW galactic centre vMW (McConnachie 2012, Giovanelli et al. 2013), distance to the LG’s barycentre DLG (McConnachie 2012, McQuinn et al. 2013), radial velocity with respect to the LG barycentre vLG (McConnachie 2012, Giovanelli et al. 2013), mass in baryons Mbaryon (Valenzuela et al. 2007, Giovanelli et al. 2013, McQuinn et al. 2013, Bernstein-Cooper et al. 2014, Sand et al. 2015), and the effective radius ref (McConnachie 2012, Giovanelli et al. 2013). Mbaryon is the sum of the observed mass in stars and gas (Giovanelli et al. 2013, McQuinn et al. 2013, Bernstein-Cooper et al. 2014). McConnachie (2012) and Sand et al. (2015) (Fig. 3) provide baryon masses for all five galaxies in the association. However, a baryon mass of 8 × 10⁸ M⊙ for the NGC 3109 dwarf in Sand et al. (2015) is a lower limit. Numerical simulations suggest that the baryon mass of NGC 3109 dwarf might be as large as 2.1 × 10⁹ M⊙ (Valenzuela et al. 2007). Based on these estimates, we use a simple average of 1.45 ± 0.65 × 10⁹ M⊙. The stellar mass of Leo P is 5.7 × 10⁵ M⊙ (McQuinn et al. 2013), and the mass in H I gas is 1 × 10⁶ M⊙ (Giovanelli et al. 2013). For the observed baryon mass of Leo P, we adopt 1.5 × 10⁶ M⊙.
Observational data for the NGC 3109 association: Morphological classification, distance to the MW’s galactic centre DMW, radial velocity with respect to the MW galactic centre vMW, distance to the LG’s barycentre DLG, radial velocity with respect to the LG barycentre vLG, mass in baryons Mbaryon, and the effective radius ref.
| Object | Morphology | DMW | vMW | DLG | vLG | Mbaryon | ref |
|---|---|---|---|---|---|---|---|
| [Mpc] | km s−1 | [Mpc] | km s−1 | 109[M⊙] | [pc] | ||
| NGC 3109 | Irr | 1.30 ± 0.05 | 193 ± 2 | 1.63 ± 0.05 | 110 ± 2 | 1.45 ± 0.65 | 1626 ± 71 |
| Antlia | dIrr/dSph | 1.35 ± 0.07 | 151 ± 2 | 1.68 ± 0.07 | 66 ± 2 | 0.0021 | 471 ± 52 |
| Sextans A | dIrr | 1.44 ± 0.06 | 163 ± 2 | 1.71 ± 0.06 | 94 ± 2 | 0.121 | 1029 ± 52 |
| Sextans B | dIrr | 1.43 ± 0.02 | 171 ± 1 | 1.66 ± 0.02 | 114 ± 1 | 0.103 | 440 ± 42 |
| Leo P | dSph | 1.72|$^{+0.14}_{-0.40}$| | 177 | 1.92|$^{+0.13}_{-0.46}$| | 137 | 0.0015 | 290 ± 70 |
Galaxies in NGC 3109 form a rare structure in space. They are aligned along a very thin line, 1067 kpc in length, and 97 kpc in width (Bellazzini et al. 2013). This poses a question of the association’s origin which has been a matter of debate. The NGC 3109 association might have been accreted along the filaments in the cold flow scenario (Dekel et al. 2009, Lovell et al. 2011). It could also be the remnant of Andromeda’s ancient major merger which created a gigantic tidal tail and sent stellar material toward the MW (Hammer et al. 2013).
In this paper, we do not setup or test either one of the two origin scenarios. Instead, outside of the cosmological context, we investigate if the NGC 3109 association simply started as a regular gravitationally bound group of galaxies, passing at the edge of the LG. We first assume that most of the association’s dark matter has been stripped during this passage. The starting point of our simulations places the NGC 3109 inside the LG. Continual gravitational interaction with the LG would distort the association through tidal effects into a thin elongated string of galaxies. For that purpose, we construct a series of numerical simulations where we test various initial conditions that the NGC 3109 group might have had 10 Gyr ago. We examine the NGC 3109 as a compact, medium, and loose group of galaxies, and we assign various possible initial velocities. In this manner, we sent the NGC 3109 association on various orbits toward the LG. From the resulting spatial configurations, we identify the model which can best reproduce recent observations of the NGC 3109 association.
We describe our method in Section 2, where we construct the NGC 3109 association in an analytical potential representing the LG. In Section 3, we present the results focusing on the best-matching models. Section 4 is a discussion of the implications of our results and conclusions.
2 METHOD
In order to investigate gravitational interaction between the LG and the NGC 3109 association, we generate NGC 3109 members as N-body systems, using the GalactICS code (Kuijken & Dubinski 1995; Widrow & Dubinski 2005; Widrow, Pym & Dubinski 2008). The LG is described as an analytical NFW density profile (Navarro, Frenk & White 1997). We simulate the interaction between the LG and the association using GADGET-2 code (Springel 2005).
In this proof of concept model, we assume that galaxies in the NGC 3109 association form within massive dark matter haloes (DMHs). It is expected that the amount of dark matter in each dwarf galaxy might be ∼ 100 times larger than the baryonic component (Behroozi et al. 2013; Moster et al. 2013). However, we do not simulate the formation of the NGC 3109 association. We follow the approach of Fardal et al. (2006) where the starting point of the simulation is long after most of the dark matter in galaxies has been tidally stripped as the association moves through the outskirts of the LG. We chose the starting point for our simulations to be when only a small amount of dark matter (∼ 4–7 times the baryonic matter) is left in the galaxies. At that moment, the association is at 800 kpc from the centre of the LG.
2.1 Reproducing observational data
2.2 Numerical NGC 3109 association
Galaxies were built to approximately match the observed baryon mass and effective radius presented in Table 1. Table 2 shows the properties of each simulated galaxy, mass, and number of particles in the bulge and in the DMH, as well as the total mass. For simplicity, we assume that the entire baryon mass of each galaxy (stars plus gas) is contained within the bulge and represented with N-body particles. The mass of the NGC 3109 dwarf is estimated to be between 8 × 10⁸ M⊙ (Sand et al. 2015), and 2.1 × 10⁹M⊙ (Valenzuela et al. 2007). We chose 1.5 × 10⁹ M⊙ for the baryon mass of NGC 3109 dwarf. The amount of dark matter in all galaxies is only ∼ 4–7 times larger than the baryonic component because we assume that most of the dark matter has been tidally stripped previously.
Properties of simulated galaxies in the NGC 3109 association: Name of the galaxy; the number of particles in bulge; the number of particles in DMH; the mass of the bulge, the mass of the DMH; and the total mass of the galaxy.
| Name | Nbulge | NDMH | Mbulge | MDMH | Mtotal |
|---|---|---|---|---|---|
| 109[M⊙] | 109[M⊙] | 109[M⊙] | |||
| NGC 3109 | 25 500 | 74 500 | 1.5 | 4.4 | 5.9 |
| Antlia | 15 000 | 85 000 | 0.0023 | 0.0097 | 0.012 |
| Sextans A | 13 400 | 86 600 | 0.1 | 0.7 | 0.8 |
| Sextans B | 13 400 | 86 600 | 0.1 | 0.7 | 0.8 |
| Leo P | 21 500 | 78 500 | 0.0014 | 0.0053 | 0.0067 |
Galaxies are generated without initial rotation. We test the stability of modelled galaxies by evolving them in isolation for 10 Gyr, using the GADGET-2 code. After 10 Gyr, all galaxies are stable with only a small drop in density within the central 0.2 kpc. For the purposes of studying the alignment between the galaxies in the association, the only condition that needs to be satisfied is that galaxies do not disperse in 10 Gyr. Small changes in their central regions are beyond the scope of this work.
2.3 Positioning galaxies in the NGC 3109 association
Next, we use a Monte Carlo procedure to select the initial positions for the galaxies in the association, which will assure a stable gravitationally bound system during 10 Gyr in isolation. Since this investigation is focused on the properties of the association, and not the individual galaxies, we assume that each galaxy is represented by a particle with a corresponding mass. Next, we distribute all galaxies randomly in spherical coordinates (r, θ, ϕ) within a shell constrained by [rmin, rmax], [0, π], [0, 2π]. Depending on a compactness of the system, we have three models: a compact system when r = [30, 80] kpc; medium system when r = [40, 150] kpc; and loose system for r = [80, 300] kpc. For each selection of initial positions, the system is evolved from rest, over 10 Gyr. We assume that the system is stable if galaxies do not approach each other within 10 kpc to make sure gravitational interaction is too weak to disturb them. The procedure is repeated until such a system is found in all three models.
Table 3 shows the initial distance of galaxies from the centre of the spherical shell in three chosen models.
Initial distance of galaxies from the centre of the spherical shell in the compact, medium, and loose models.
| Model | NGC 3109 | Antlia | Sextans A | Sextans B | Leo P |
|---|---|---|---|---|---|
| r [kpc] | r [kpc] | r [kpc] | r [kpc] | r [kpc] | |
| Compact | 75 | 50 | 77 | 63 | 56 |
| Medium | 143 | 59 | 56 | 123 | 138 |
| Loose | 284 | 207 | 220 | 258 | 159 |
| Model | NGC 3109 | Antlia | Sextans A | Sextans B | Leo P |
|---|---|---|---|---|---|
| r [kpc] | r [kpc] | r [kpc] | r [kpc] | r [kpc] | |
| Compact | 75 | 50 | 77 | 63 | 56 |
| Medium | 143 | 59 | 56 | 123 | 138 |
| Loose | 284 | 207 | 220 | 258 | 159 |
Fig. 1 shows the initial coordinates for the chosen loose system, corresponding to the third row in Table 3.
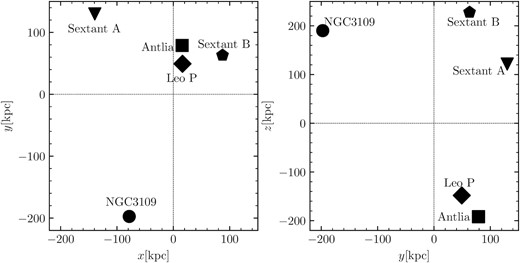
Initial coordinates for the selected stable loose system.
After the selection of the three stable configurations for our compact, medium, and loose systems, we check if those systems are stable for real association members. In all three models, we replace particles with real N-body representations of galaxies and rerun the simulations for 10 Gyr. We confirm that galaxies remain individually undisturbed and the systems remain gravitationally bound after 10 Gyr.
2.4 Analytical Local Group
Since the NGC 3109 association passes the outskirts of the LG, representing the LG as analytical gravitational potential instead of N-body system neglects dynamical friction. However, tidal effects are well represented even with analytical potential. This has been demonstrated in Fardal et al. (2006) where the same method has been used to investigate tidal distortion of the dwarf galaxy in the analytical potential of the Andromeda galaxy. Also, following the Fardal et al. (2006) approach, we assume that most of the dark matter is tidally stripped from the start of the simulations. With that approximation, the starting coordinates place the association at 800 kpc from the LG’s centre, inside the LG’s gravitational potential.
Assuming that the total mass of the LG is 3 × 10¹²M⊙ within virial radius of 3 Mpc (Penarrubia et al. 2016), after working out the equations above, we obtain the values for concentration parameter c = 20, and scale radius rs = 11 kpc.
2.5 Directing the NGC 3109 association toward the Local Group
After selecting initial conditions for the members of the NGC 3109 association, we continue with selecting the initial conditions for the association as a whole system with respect to the LG. We place the centre of mass of the association at a distance 800 kpc from the LG’s barycentre. Acceleration of the centre of mass is calculated as a = − ∇ϕ, where ϕ is defined in equation (4). In our test simulations, a particle representing the centre of mass of NGC 3109 is assigned various initial velocity intensities v0, and a range of directions toward the LG’s barycentre θ0. The selected parameters are presented in Table 4.
Initial velocity and angle of the association velocity toward the LG’s barycentre.
| θ0 | v0 | [ km s−1] | ||||
|---|---|---|---|---|---|---|
| 60° | 100 | 124 | 200 | 250 | 300 | 400 |
| 30° | 400 |
| θ0 | v0 | [ km s−1] | ||||
|---|---|---|---|---|---|---|
| 60° | 100 | 124 | 200 | 250 | 300 | 400 |
| 30° | 400 |
Values of θ0 and v0 in Table 4 determine the shape of the orbit. For θ0 = 60° and v0 = 100 km s−1 the association is sent on a parabolic orbit. Assuming the same direction and v0 = 124 km s−1, the orbit is circular. And for larger velocities the orbit is hyperbolic. We also consider one extreme case where θ0 = 30° and v0 = 400 km s−1.
2.6 Test simulations
Once the initial conditions are set, we launch the simulations where the association’s centre of mass is represented as a particle and evolved in the LG’s analytical gravitational potential.
The left hand of Fig. 2 shows the three types of orbits in x–y plane for θ0 = 60° and various velocities. Orbits have been evolved for 10 Gyr with respect to the LG’s barycentre presented as the cross-section of the horizontal and vertical dashed lines. The right hand shows the same for the simulation with the extreme orbit.
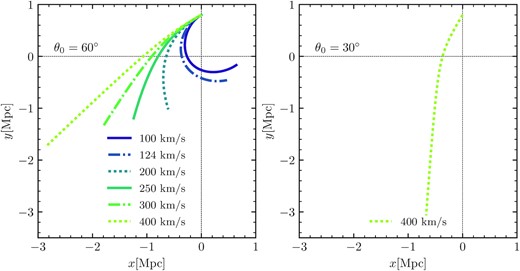
The left hand shows the three types of orbits in the x–y plane for θ0 = 60° and various velocity intensities. Orbits have been evolved for 10 Gyr with respect to the LG’s barycentre presented as the cross-section of the horizontal and vertical dashed lines. The right hand shows the same for our one extreme case orbit with θ0 = 30° and v0 = 400 km s−1.
Fig. 3 shows that over 10 Gyr, the velocities of the test simulation change significantly from the initial conditions. In test simulations with an initial velocity smaller than 200 km s−1, gravitational pull by the LG causes large variations in the association’s velocity.
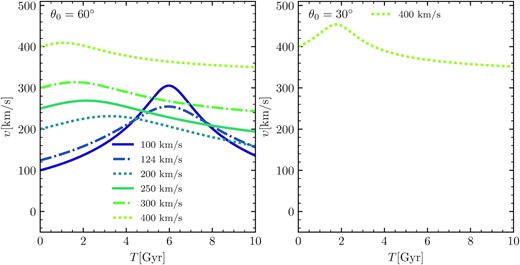
Left hand shows velocity as a function of time, for the three types of orbits in x–y plane for θ0 = 60° and various initial velocity intensities. Right hand shows the same for our one extreme case orbit with θ0 = 30° and v0 = 400 km s−1.
Fig. 4 shows which initial velocities are not likely to reproduce the expected distance of the association from the LG. For the extreme velocity values ∼ 400 km s−1, the association passes the LG and after 10 Gyr ends up more than 3 Mpc away from it. For a low velocity ∼ 100 km s−1, the association is captured by the LG at a distance of only ∼ 500 kpc. The observed distance, which we expect to reproduce in the simulation, is 1318 kpc. Although we compare simulated properties to the observed ones in every snapshot, it is clear from Fig. 4 that the best model will have an initial velocity ∼ 200 km s−1.
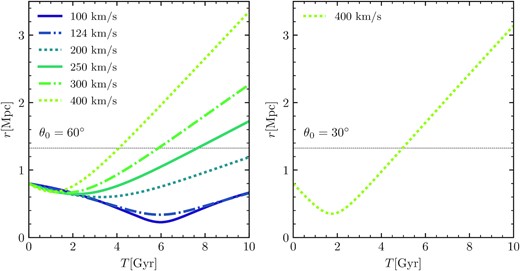
The left hand shows the distance as a function of time, for the three types of orbits in thex–y plane for θ0 = 60° and various initial velocities. The right hand shows the same for one extreme orbit with θ0 = 30° and v0 = 400 km s−1. The dashed horizontal line shows the observed distance between the LG and the NGC 3109 association.
3 RESULTS
The test simulations presented in the previous section suggest which set of initial conditions reproduces the observed NGC 3109 association. This mainly relates to the initial velocity necessary to assign to the association so that the resulting system can be expected to match the observed one.
After running simulations for all three models (compact, medium, and loose), we examine the outcome of the association after 10 Gyr of evolution in the vicinity of the LG. In all three models, a gravitationally stable association of galaxies starts at 800 kpc from the LG. Based on the initial velocity and direction of the system, the association takes various orbits toward the LG. In total, we ran seven simulations for each initial velocity and each model. As the association moves through the outskirts of the gravitational potential of the LG, it experiences tidal effects and starts stretching. Our goal is to simulate the stretching of the association into a line comparable to what is observed. At the same time, we expect that our choice of the initial velocity places the system at the observed distance from the LG centre. We note that we do not look for a perfect match to the observations as this would be computationally expensive due to a large number of parameters that one would have to explore.
We immediately dismiss the three most extreme cases in all three models. These are the simulations with the smallest initial velocities which result in parabolic (v0 = 100 km s−1) and circular orbits (v0 = 124 km s−1). Also, the case with the largest initial velocity 400 km s−1 and at an angle of 30° is not likely to reproduce the observations of the NGC 3109 in any of our models. If the initial velocity is too small, the association falls in the gravitational potential of the LG rapidly, to a distance from the centre of the LG much smaller than the observed 1318 kpc. If the velocity is too large, the association moves away from the LG. The results of the remaining simulations are presented in all the panels of Figs 5 –7.
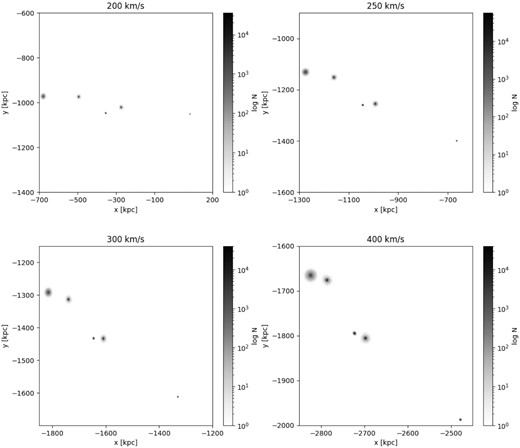
The compact model for NGC 3109 at t = 10 Gyr. The figure shows that the compactness of the system is too large and as a consequence, members of the association start interacting and start exchanging material. In the compact model, the NGC 3109 association is in a merger.
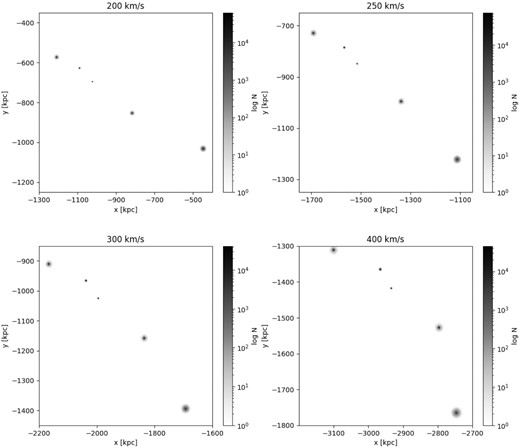
Medium model for NGC 3109 after 10 Gyr. To less extent in comparison to the compact system, members of the medium system also experience gravitational interaction between themselves resulting in mergers. Not as pronounced as in Fig. 5 but still perturbations are too big for the medium system to be considered as a valid model.
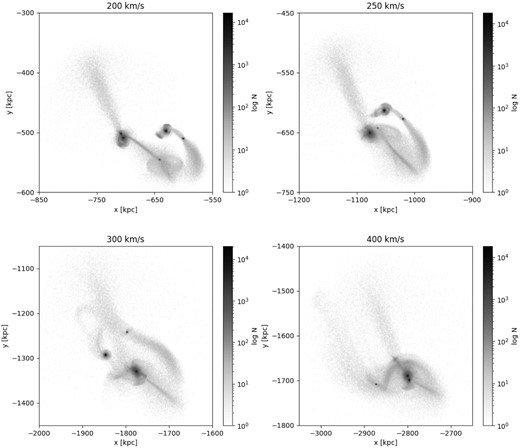
Loose model for NGC 3109 after 10 Gyr. This is the best-matching model since galaxies maintain stability and also stretch into a line formation, consistent with the observations.
Fig. 5 shows images of the NGC 3109 association with respect to the centre of the LG, 7.2 Gyr after the simulation started. Each panel corresponds to an initial velocity assigned to the association. We chose this moment because association disperses soon after. In Fig. 5, for the compact model, one cannot distinguish galaxies in any of the panels. Since this is the case of compact model simulations, galaxies belonging to the association do remain in a stable association if evolved in isolation. However, evolving compact group of galaxies in the LG gravitational potential, leads to tidal effects first, followed by the galaxy mergers to the point when individual galaxies cannot be distinguished. It is clear that the entire compact model can be ruled out. Figs 6 and 7 show snapshots of galaxies in the association at t = 10 Gyr which is the time of the last recorded snapshot.
Fig. 6 shows the NGC 3109 association in the medium model after 10 Gyr with various initial velocities. The initial separation between galaxies is increased in the medium model when compared to compact. The association remains stable since there are no interactions between member galaxies. The same occurs, as expected, in the loose model in Fig. 7. In the loose model, galaxies are initially separated at even larger distances. The gravitational interaction between them does not impact their stability after 10 Gyr. It can also be seen that galaxies take a line formation in the cases with an initial velocity of 200 and 250 km s−1.
Table 5 shows the values after 10 Gyr of evolution, for the length, width, and radial velocity of the association with respect to the LG’s barycentre. These values are presented for the medium and loose model, and for the initial angle of 60°, and initial velocities 200, 250, 300, and 400 km s−1. In that manner, Table 5 corresponds to Figs 6 and 7. We present values for these specific parameters because their values are well known from the observations. The table shows that cases with initial velocities 250, 300, and 400 km s−1 can be excluded in both the medium and loose models. When compared to the observations, the length of the association is too small and the radial velocity is too large for these three cases to be viable descriptions of the NGC 3108 association.
The dynamical parameters of NGC 3109 for the medium and loose models, at t = 10 Gyr. The table includes values for: Initial angle θ0, initial velocity v0, length of the association l, width of the association d, radial velocity vrad, and time t.
| Model | θ0 | v0 | l | d | vrad | t |
|---|---|---|---|---|---|---|
| [ km s−1] | [kpc] | [kpc] | [ km s−1] | [Gyr] | ||
| 60° | 200 | 774 | 79 | 100 | 10 | |
| Medium | 60° | 250 | 675 | 176 | 152 | 10 |
| 60° | 300 | 589 | 146 | 211 | 10 | |
| 60° | 400 | 479 | 100 | 328 | 10 | |
| 60° | 200 | 888 | 60 | 111 | 10 | |
| Loose | 60° | 250 | 762 | 40 | 172 | 10 |
| 60° | 300 | 677 | 76 | 232 | 10 | |
| 60° | 400 | 576 | 133 | 346 | 10 |
Values from Table 5 are better represented in Fig. 8 where simulated parameters are compared to their observed values. Fig. 8 shows (from bottom to top panels) the radial velocity, width, and length of the NGC 3109 association as a function of the initial velocity. Dots represent results in the loose model, while pluses represent results in the medium model. Dashed lines represent observed values for radial velocity, width, and length of the NGC 3109 association. The figure shows that simulated radial velocity increases as the initial velocity increases in both the loose and medium models. The length of the association on the other hand decreases as the initial velocity increases. At lower initial velocities, the association spends a larger amount of time being exposed to the tidal effects caused by the gravitational potential of the LG. As the result, the association is more extended than in the simulations with large initial velocities. The width of the association does not correlate with the value of the initial velocity. Widths in the medium model are larger than in the loose model. This is a consequence of galaxies pairing up in the medium model as they are initially placed at smaller separations than in the loose model. Over a time of 10 Gyr, the secondary gravitational effect in the association (tidal stretching of the association being primary) is that larger galaxies pull smaller ones into orbit giving them additional velocity component which takes them out of the alignment. This effect can be seen in Figs 6 and 7. Fig. 6 shows that galaxies have paired up. The self-gravitational interaction prevents them from the general alignment in the association which in turn is increasing the width of the alignment. This effect cannot be seen in Fig. 7 since galaxies in the loose model are initially separated more than in the medium model. On the other hand, the Fig. 7 shows that galaxies are still separated from each other and the tidal pull from the LG is stretching them along a line with a width close to the observed one (Fig. 8 middle panel).
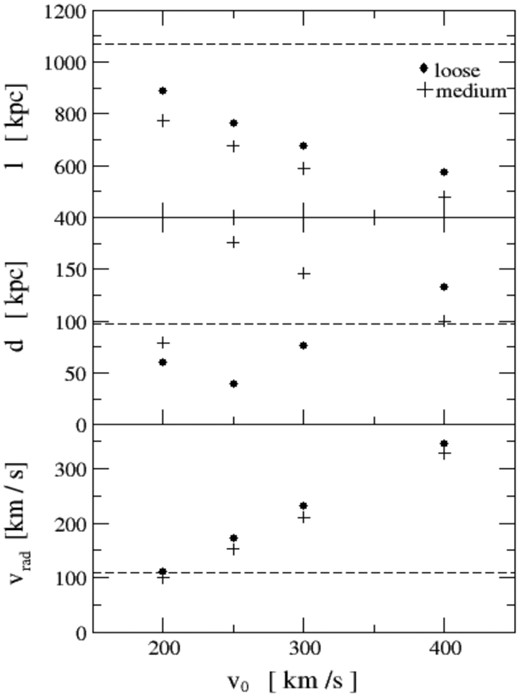
Three observed parameters as a function of the initial association velocity in the loose and medium models. The loose model is represented with dots and the medium model with pluses. The bottom panel shows the radial velocity of the association as a function of the initial velocity, the middle panel shows the same functionality for the width of the association, and the top panel shows the same for the length of association. Overplotted with dashed horizontal lines are the observed values for these three parameters.
At this point it is apparent that the best-matching models are the following two cases: The loose model for 200 km s−1, and the medium model with the same initial velocity. These are represented as the first data points in Fig. 8. Their radial velocity matches the observed value of 109.5 km s−1. The medium model is a better match for the width of the association with a value of 79 kpc. The observed value is 97 kpc. But the length of the association is much closer to the observed value of 1 067 kpc in the loose model. From here on we focus on presenting results for these two models.
In Fig. 9, we focus on the internal structure of galaxies. Fig. 9 shows density profiles for galaxies in the NGC 3109 association after 10 Gyr for both the loose (black line) and medium (red dots) models. The figure shows that galaxies in either model have not undergone changes due to gravitational interaction between them. Although galaxies have shown that they are paring up in the medium model, the interaction between them has not changed their internal structure yet. The density profiles are hence almost identical in both loose and medium models.
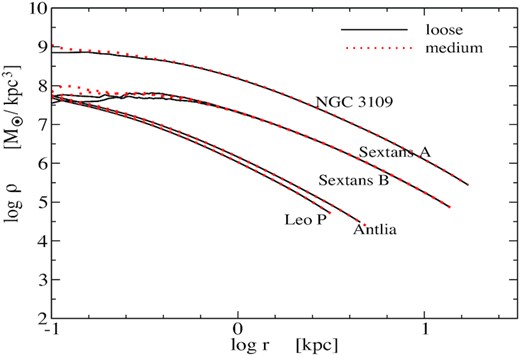
Density as a function of the radius of galaxies in the NGC 3109 association after 10 Gyr. Density for galaxies in the loose model are represented with a black line, while the density of galaxies in the medium model is represented with red dots. The discrepancy at the centres of galaxies is due to numerical noise. Other than that, density profiles are almost identical in both models.
There is one more observational parameter that we compare in Fig. 10. Fig. 10 shows the distance of galaxies in the association from the centre of the LG. One can see that in both simulated models, galaxies are closer to the LG centre compared to the observed values. Note that the order of galaxies in the alignment does not matter here as our simulations are not trying to reproduce it. That would simply be computationally too expensive and also would not be an important part of this investigation to qualitatively show the mechanism behind the formation of this association. The figure shows that the loose model is a better match to the observed distance than the medium model. We do note that this discrepancy from the observations is not too large as the distance is only ∼ 10 |${{\ \rm \%}}$| smaller than the observed one. A slight change in the initial velocity or a slightly longer simulation run would bring the distance to the LG even closer to the observed value.
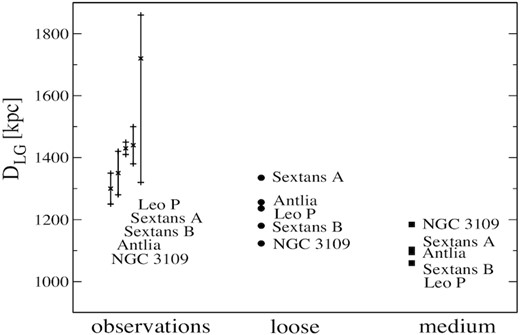
Distance from the centre of the LG for galaxies in the NGC 3109 association in the loose and medium models, and from observations. The loose model is a better match to the observations than the medium model.
4 DISCUSSION AND CONCLUSIONS
In this work, we have performed 27 N-body simulations of the NGC 3109 association of galaxies in the gravitational potential of the LG. The purpose of this work is to qualitatively reproduce the NGC 3109 association. Hence, the results of this paper should be viewed as proof of concept for future more rigorous treatment of the topic. With each simulation, we investigate plausible initial positions, velocities, orbit, and spatial configurations between galaxies in the association. The association is observed to have its galaxies arranged in a very thin and elongated structure. We propose that what is today a straight line of galaxies at the outskirts of the LG, started as a regular galaxy group. It later fell into the LG’s gravitational potential, and stretched into a line, due to the tidal effects of its interaction with the LG. We ran each simulation for 10 Gyr and at the end, compared the length, width, radial velocity, and the distance of the association from the LG, to the observed values of these parameters. We have produced qualitative matching between the simulated and the observed NGC 3109, and we note that a more precise agreement would take exploring a very large parameter space which would even include matching the exact order of galaxies in the association.
Our approach is similar to Fardal et al. (2006) where the formation of the modelled structure is also neglected. In Fardal et al. (2006), the dwarf galaxy (with no dark matter) is placed deep inside the gravitational potential of the Andromeda galaxy. The assumption is that the dwarf galaxy forms within DMH, outside of the Andromeda, and sinks toward the centre of Andromeda’s gravitational potential. The DMH which envelops the dwarf galaxy gets tidally stripped until the stellar remnant of the dwarf galaxy reaches the coordinates used as initial conditions for the numerical simulation that follows. The Andromeda galaxy is represented as an analytical potential and the dwarf galaxy as an N-body system. This approximate approach neglects dynamical friction together with the origin of the dwarf galaxy. The dwarf galaxy continues to sink toward Andromeda’s centre being exposed to tidal effects. In that sense, results can be viewed as proof of concept. In other words, these simulations are a demonstration that the Giant Stellar Stream can be formed from the disintegration of a dwarf galaxy. In a similar manner, we neglect cosmological formation of the NGC 3109 association, and dynamical friction which would lead to the stripping of the dark matter from galaxies in the association. We assume that all of these processes have occurred and that the baryonic remnant (with a small amount of remaining dark matter) reaches 800 kpc from the centre of the LG. That is the initial position for our simulations. We also neglect the fact that the MW and the Andromeda are in orbit and should be represented as N-body systems. Hence, this work should not be viewed as an accurate solution for the formation of the elongated NGC 3109 association as we observe it today, but rather as initial work on this dynamically complex problem.
We focus on the three possible initial configurations of the association: Compact, medium, and loose groups. Each model was assigned initial velocity in range 100–400 km s−1.
We find that if the initial velocity is too small, the association falls deep inside the LG’s gravitational potential and does not reach the observed 1 318 kpc distance from its centre. On the other hand, if the initial velocity is too large, the association will be too far away from the LG. This fact dismisses models with initial velocities below 200 km s−1 and above 400 km s−1. The compact set of models is also dismissed as the galaxies are placed too close to each other. Compact models stay stable if evolved in isolation. When placed in the gravitational potential of the LG, perturbations to the orbits of the individual galaxies ruin the internal stability of the association. This leads to gravitational interactions and mergers between the members and the destruction of the association.
We find two models that closely reproduce the observed behaviour of the NGC 3109 association. These are the medium and the loose model with initial velocity 200 km s−1. The radial velocity in both models is almost exactly reproduced. The length of the association is smaller than observed in both models. However, we measure a length l = 888 kpc in the loose model is similar to the observed value, 1 067 kpc. The width of the association is slightly closer to the observed value for the velocity of 200 km s−1 in the medium model. This is probably a coincidence because in the other medium models with larger initial velocities, the width is much larger than the observed one due to the additional gravitational component. Galaxies in these models have paired up as they are initially placed closer to each other than in the loose models. This additional gravitational interaction deters them from the general alignment in the association which in turn increases the width of the alignment. However, this pairing between galaxies did not cause any perturbations to the internal structure of the galaxies. Comparing the internal structure of the galaxies through density profiles after 10 Gyr does not show any differences between galaxies in the loose and medium models (for the initial velocity of 200 km s−1).
We conclude that in our qualitative search for the best model, the loose model for NGC 3109 with an initial velocity of 200 km s−1 is the best match to the observations of this association. The radial velocity and width are a good match while the length of the association and its distance from the centre of the LG are slightly smaller than expected. With this proof of concept approach, we have demonstrated that the elongated NGC 3109 association can be formed as the result of the tidal stretching of what initially was a regular gravitationally bound group of galaxies. The exact match to the observations is out of the scope of this paper. That would require further adjustment of the initial velocity and probably longer simulations. Moreover, the most challenging part would be to reproduce the order of galaxies in the line structure of NGC 3109. Future work on this topic will have to include N-body representations of the MW and the Andromeda galaxies, as well as cosmological initial DMHs around galaxies in the NGC 3109 association.
ACKNOWLEDGEMENTS
The authors acknowledge financial support from the Ministry of Education, Science and Technological Development of the Republic of Serbia through the project #ON176021 ‘Visible and invisible matter in nearby galaxies: Theory and observations’. This work was supported by the Ministry of Education, Science and Technological Development of the Republic of Serbia (MESTDRS) through the contract number 451-03-9/2021-14/200002 made with the Astronomical Observatory of Belgrade. IB would like to acknowledge the funding provided from the European Research Council (ERC) under the European Union’s Horizon 2020 research and innovation programme (grant agreement No.726384/Empire).
DATA AVAILABILITY
The data underlying this article will be shared on reasonable request to the corresponding author.
