


ABSTRACT
We present results from our analysis of the Hydra I cluster observed in neutral atomic hydrogen (H i) as part of the Widefield ASKAP L-band Legacy All-sky Blind Survey (WALLABY). These WALLABY observations cover a 60-square-degree field of view with uniform sensitivity and a spatial resolution of 30 arcsec. We use these wide-field observations to investigate the effect of galaxy environment on H i gas removal and star formation quenching by comparing the properties of cluster, infall, and field galaxies extending up to ∼5R200 from the cluster centre. We find a sharp decrease in the H i-detected fraction of infalling galaxies at a projected distance of ∼1.5R200 from the cluster centre from |$\sim 85{{\ \rm per\ cent}}$| to |$\sim 35{{\ \rm per\ cent}}$|. We see evidence for the environment removing gas from the outskirts of H i-detected cluster and infall galaxies through the decrease in the H i to r-band optical disc diameter ratio. These galaxies lie on the star-forming main sequence, indicating that gas removal is not yet affecting the inner star-forming discs and is limited to the galaxy outskirts. Although we do not detect galaxies undergoing galaxy-wide quenching, we do observe a reduction in recent star formation in the outer disc of cluster galaxies, which is likely due to the smaller gas reservoirs present beyond the optical radius in these galaxies. Stacking of H i non-detections with H i masses below |$M_{\rm {HI}}\lesssim 10^{8.4}\, \rm {M}_{\odot }$| will be required to probe the H i of galaxies undergoing quenching at distances ≳60 Mpc with WALLABY.
1 INTRODUCTION
The environment in which a galaxy resides has a large effect on its observed properties. This is clearly demonstrated by the morphology–density relation (e.g. Oemler 1974; Dressler 1980), in which the fraction of late-type galaxies decreases (and early-type galaxies increase) with increasing galaxy number density (i.e. moving from galaxies located in the field to the centre of clusters). The environments with the highest galaxy number and intergalactic medium (IGM) densities are galaxy clusters, containing hundreds to thousands of galaxies.
The fraction of passive, non-star-forming galaxies is also found to be larger in clusters than in the field (e.g. Kauffmann et al. 2004; Pintos-Castro et al. 2019). Some of the apparent relation between the level of star formation and environment is due to galaxy morphology, as clusters contain more early-type galaxies, which tend to be quenched. However, galaxies in clusters are found to be less star-forming than isolated field galaxies with similar stellar mass and bulge fraction (e.g. Balogh et al. 1997, 1998). In the Virgo cluster, the reduction in the total star formation traced by H|$\alpha$| emission of spiral galaxies is found to be caused by these galaxies having truncated star-forming discs compared to similar field galaxies (Koopmann & Kenney 2004a, b).
Star formation is connected to the neutral atomic hydrogen (H i) gas content of galaxies, as H i provides a potential reservoir for future star formation through its conversion to molecular gas, H2 (e.g. Bigiel et al. 2008; Leroy et al. 2008). For cluster galaxies, the size of the star-forming and optical discs estimated using a number of star formation indicators (e.g. ultraviolet, H|$\alpha$|, and 24 |$\mu$|m emission, Cortese et al. 2012; Fossati et al. 2013; Finn et al. 2018) shows a strong correlation with H i deficiency. Late-type, spiral galaxies are found to be more gas-poor in cluster and group environments than in the field (see the review by Cortese, Catinella & Smith 2021, and references therein) and the fraction of galaxies detected in H i decreases with increasing density (e.g. Hess & Wilcots 2013). Galaxies in clusters are also found to have truncated H i discs (e.g. Cayatte et al. 1990; Bravo-Alfaro et al. 2000; Yoon et al. 2017). Disc truncation is not only observed in H i gas. In the Virgo cluster, truncated discs have been observed also in the molecular gas (e.g. Boselli et al. 2014), in the dust (Cortese et al. 2010), and in the ionized gas disc (e.g. Koopmann & Kenney 2004b; Boselli & Gavazzi 2006; Boselli et al. 2015). This results in a reduction in fuel from which to form stars and may lead to the quenching of star formation. Boselli et al. (2016) find a decrease in the star formation of H i-deficient Virgo cluster galaxies. Yoon et al. (2017) also find that Virgo cluster galaxies which are H i-deficient are also less star-forming and have their star formation segregated towards their centres.
The lack of H i in cluster galaxies can be caused by a combination of the cessation of gas inflows replenishing a galaxy’s H i reservoir once the current gas content is depleted and/or the removal of gas through stripping. There are both gravitational and hydrodynamical environmental processes that can lead to H i-deficient cluster galaxies. Galaxy–galaxy interactions include tidal stripping (e.g. Moore et al. 1999), harassment (e.g. Moore et al. 1996; Moore, Lake & Katz 1998), and mergers (e.g. Toomre & Toomre 1972). Mechanisms acting between the IGM and a galaxy include ram pressure stripping (e.g. Gunn & Gott 1972), viscous stripping (e.g. Nulsen 1982; Quilis, Moore & Bower 2000), starvation (e.g. Larson, Tinsley & Caldwell 1980), and thermal evaporation (e.g. Cowie & Songaila 1977).
A galaxy’s H i gas normally extends to the outskirts of a galaxy and is generally the first easily detectable component of a galaxy to be influenced by the environment. Thus, the emission from H i serves as a sensitive probe of the impact of the environment in which the galaxy resides. While blind, single-dish surveys such as HIPASS and ALFALFA (Meyer et al. 2004; Haynes et al. 2018, respectively) have observed clusters in H i, they lack spatial resolution and are limited to measuring integrated H i properties. A number of nearby clusters have been the subject of targeted (e.g. Coma, Ursa Major, and Virgo, Bravo-Alfaro et al. 2000; Verheijen & Sancisi 2001; Chung et al. 2009, respectively) and blind (e.g. Abell 2626 and Fornax, Healy et al. 2021b; Loni et al. 2021, respectively) interferometric surveys and have provided spatially resolved H i information. However, these surveys have been limited to modest fields of view (e.g. ∼1–2 virial radii) due to the small field of view and long integration times required for traditional interferometric observations.
The Widefield ASKAP L-band Legacy All-sky Blind Survey (WALLABY, Koribalski et al. 2020) on the Australian Square Kilometre Array Pathfinder (ASKAP, Johnston et al. 2008; Hotan et al. 2021) is beginning to change this. WALLABY aims to cover three-quarters of the sky up to δ = +30° and detect H i emission in |$\sim 500\, 000$| galaxies of which |$\sim 5 000$| will be spatially resolved. ASKAP is fitted with phased array feed (PAF, DeBoer et al. 2009; Hampson et al. 2012; Hotan et al. 2014; Schinckel & Bock 2016) receivers which provide a 30-square-degree instantaneous field-of-view footprint on the sky. Full sensitivity across the field of view is reached by interleaving two ASKAP footprints diagonally offset by ∼0.64° (creating an ASKAP tile) and WALLABY is able to reach its nominal sensitivity of 1.6 mJy per beam per 4 km s−1 channel with an integration time of 16 h (8 h per footprint).
Prior to the full survey commencing, WALLABY is currently undertaking a pilot survey of a number of 30-square-degree tiles. This includes a 60-square-degree field comprising two adjacent ASKAP tiles covering the Hydra I cluster and extending out to ∼5R200 to the west of the cluster. These data have been used for the detailed study of individual objects (e.g. ESO 501−G075, Reynolds et al. 2021) and larger population studies (e.g. ram pressure of galaxies within ∼2.5R200, Wang et al. 2021).
1.1 The Hydra I cluster
The Hydra I cluster (‘Abell 1060’ in Abell 1958) is centred on α, δ = 10:36:41.8, −27:31:28 (J2000) and has a heliocentric recessional velocity of c|$z\sim 3 780$| km s−1 (Struble & Rood 1999; Panagoulia, Fabian & Sanders 2014). The centre of the Hydra I cluster is dominated by NGC 3311 and NGC 3309, two giant elliptical galaxies (indicated by the grey star in Fig. 1). The systemic velocity in the cosmic microwave background reference frame is c|$z=4 120$| km s−1. This gives a luminosity distance of DL = 61 Mpc, which we adopt as the distance of Hydra I throughout this work, and is in good agreement with the redshift-independent distance of 59 Mpc (Jorgensen, Franx & Kjaergaard 1996). Hydra I has a velocity dispersion of σdisp = 676 ± 35 km s−1 (Richter, Materne & Huchtmeier 1982). We adopt the cluster virial radius of R200 ∼ 1.44 ± 0.08 Mpc from Reiprich & Böhringer (2002) (∼1.35° projected on the sky at 61 Mpc). The corresponding cluster mass within R200 is |$M_{200}=(3.13\pm 0.50)\times 10^{14}\, \rm {M}_{\odot }$| (Reiprich & Böhringer 2002). Solanes et al. (2001) find Hydra I to be H i-deficient based on a sample of 96 galaxies within 5RAbell (Abell radius, RAbell = 2.16°) of the cluster centre, 20 of which are within RAbell.
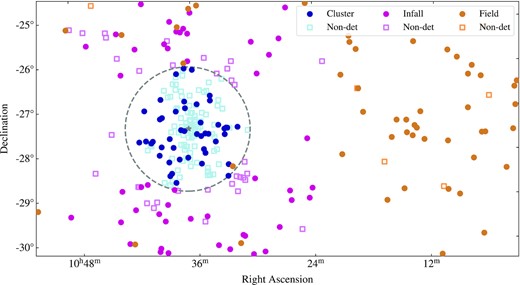
Position of galaxies with c|$z\lt 7 000$| km s−1 in the 60-square-degree WALLABY footprint. H i detections and non-detections are indicated by the filled circles and unfilled squares, respectively. The cluster, infall, and field galaxy populations defined using the phase space diagram in Fig. 2 are coloured blue, purple, and orange, respectively. The grey dashed circle indicates R200 (i.e. the virial radius) of the Hydra I cluster (1.44 Mpc) and the grey star indicates the positions of NGC 3311 and NGC 3309 (i.e. the approximate centre of the cluster).
There is tension in the literature over the dynamical state of Hydra I. Fitchett & Merritt (1988) find that the velocity distribution of galaxies within ∼40 arcmin of the centre of Hydra I is non-Gaussian and propose clumpy substructure as the cause for this non-Gaussian distribution. Hydra I is found to be slightly disturbed with a substructure in the process of falling into the cluster in the foreground (Lima-Dias et al. 2021). Arnaboldi et al. (2012) and Barbosa et al. (2018) find evidence for a recent sub-cluster merger event. These results suggest that Hydra I is not yet virialized. However, other studies have found that Hydra I has a fairly homogeneous X-ray distribution, which suggests that the cluster is relaxed and has not undergone any recent mergers (e.g. Fitchett & Merritt 1988; Hayakawa et al. 2004; Łokas et al. 2006), although a small offset between the X-ray centre of the cluster core and the centre of the brightest galaxy NGC 3311 has also been found (Hayakawa et al. 2006).
Hydra I is similar to the Virgo cluster, which has a virial mass of |$M_{\rm {vir}}=(6.3\pm 0.9)\times 10^{14}\, \rm {M}_{\odot }$| and velocity dispersion of σdisp = 638 ± 35 km s−1 (Kashibadze, Karachentsev & Karachentseva 2020), but is ∼3.5 times more distant (61 versus 16.5 Mpc, Mei et al. 2007). At this increased distance, a single ASKAP tile centred on Hydra I covers the cluster out to ∼2.5R200 (at the Virgo cluster distance this would cover out to ∼R200). This provides a more complete picture of the cluster environment by including the infall region surrounding the cluster core and enables us to study the effect of pre-processing on gas removal and star formation quenching in and around the cluster.
In this work, we investigate gas removal and star formation in the Hydra I cluster using wide-field, high spatial resolution WALLABY observations that cover 60 square degrees, going out to ∼5R200 from the cluster centre, by comparing the H i to optical disc diameter ratio and star formation rate (SFR) of cluster and infall galaxies with a control sample of field galaxies. We present the data we use for this work and derive physical quantities in Section 2. We present and discuss our results in Sections 3 and 4 and summarize our conclusions in Section 5. Throughout, we adopt optical velocities (cz) in the heliocentric reference frame, the AB magnitude convention and we assume a flat Λ cold dark matter cosmology with H0 = 67.7 km s−1 Mpc−1 (Planck Collaboration XIII 2016).
2 DATA
2.1 WALLABY observations and sample selection
The WALLABY pilot survey observations of the Hydra field cover 60 square degrees extending over 10:03:|$00\lt \alpha \, \rm {(J2000)}\lt 10$|:53:01 and −30:30:|$00\lt \delta \, \rm {(J2000)}\lt -24$|:30:00. We refer the reader to the following WALLABY publications for details of the WALLABY pilot survey observations of the Hydra I cluster: Reynolds et al. (2021), Wang et al. (2021) and the ASKAP/WALLABY data reduction process: Elagali et al. (2019), For et al. (2019), Kleiner et al. (2019), Lee-Waddell et al. (2019), Reynolds et al. (2019). The final H i spectral line cube has a synthesized beam size of 30 × 30 arcsec, spectral resolution of 4 km s−1, and an average root-mean-square (rms) sensitivity of ∼2.0 mJy per beam per 4 km s−1 over the cube. We note that the average sensitivity across the cube is higher than the nominal sensitivity due to a bandpass ripple artefact in the spectral line cube. The bandpass ripple is due to the ASKAP On-Dish Calibrators (ODC).1 Three beams (located in the corners of individual footprints), which are strongly affected by the ODC ripples, were removed from the 144 beams making up the 60-square-degree mosaic prior to running the H i source finding. The ASKAP operations team have since turned off the ODCs and this will not impact future spectral line observations.
We use the Source Finding Application 2 (SoFiA 2, Serra et al. 2015; Westmeier et al. 2021) to detect sources of H i emission across a redshift range of cz ∼ 500–25 000 km s−1 using the SoFiA smooth+clip (S+C) finder. We first apply preconditioning to the data cube using the following steps: (1) multiplication of the data by the square root of the weights cube produced by the ASKAP pipeline; (2) local noise normalization across a running window of 51 × 51 spatial pixels and 51 spectral channels in size; (3) autoflagging of bad data using an internal threshold of 5. For the S+C finder, we set Gaussian spatial filter sizes of 0, 5, and 10 pixels and spectral boxcar filter sizes of 0, 3, 7, and 15 channels. We set the source-finding threshold to 3.5σ with a replacement value of 2σ. Detections are linked across a spatial and spectral radius of 2 pixels/channels with a minimum size requirement for reliable source of 8 spatial pixels and 5 spectral channels. SoFiA’s reliability filter is then applied to remove all detections with a reliability below 0.8, using a Gaussian kernel density estimator of size 0.4 times the covariance. All remaining sources are then parametrized, assuming a restoring beam size of ∼30 arcsec for all integrated flux measurements.
After removing artefacts (i.e. related to the bandpass ripple) from the detection catalogue, the final catalogue contains 272 H i detections with integrated signal-to-noise ratios |$\rm {SNR}\gtrsim 5$| (i.e. |$\mathrm {SNR}=S_{\mathrm {sum}}/\sigma _{S_{\mathrm {sum}}}$|, where Ssum is the integrated flux from the SoFiA source mask and |$\sigma _{S_{\rm {sum}}}$| is the statistical uncertainty in the integrated flux). As Hydra I has a systemic velocity of c|$z\sim 3 780$| km s−1, we select a subsample of the H i detections below c|$z\lt 7 000$| km s−1 (i.e. detections for which the H i mass sensitivity will be similar to cluster members). This is to avoid the bias towards high stellar mass and gas-rich galaxies that WALLABY will detect at higher redshifts. We also exclude five detections of interacting systems contained within a H i envelope whose projected angular separation is less than the ASKAP beam size, as we are unable to measure individual H i properties for each galaxy in these systems. These cuts result in a sample of 145 individual galaxies with detected H i emission and systemic velocities c|$z\lt 7 000$| km s−1.
As a blind H i survey, WALLABY is most sensitive to gas-rich galaxies and will detect few gas-poor galaxies (predominantly early-types), which are the dominant type of galaxy found in clusters. Thus, H i detections alone do not provide a complete galaxy sample for probing the effect of the environment on H i content and star formation (e.g. demonstrated by Yoon & Rosenberg 2015, using ALFALFA2 data). We use the 6dF Galaxy Survey (6dFGS, Jones et al. 2009) to identify galaxies within the Hydra field footprint and with systemic velocities c|$z\lt 7 000$| km s−1 without detected H i emission. The 6dFGS survey is complete to near-infrared magnitudes of 12.65, 12.95, and 13.75 in the K-, H-, and J- bands and at the distance of Hydra I detects galaxies with stellar masses |$\gtrsim 10^9\, \rm {M}_{\odot }$|. Hence, due to the sensitivity limits of WALLABY and the magnitude limits of 6dFGS, our sample is biased against low-mass dwarf galaxies (e.g. low surface brightness and ultra-diffuse galaxies detected in Hydra I by Iodice et al. 2020). We derive H i mass upper limits for these non-detections in Section 2.1.1. Fig. 1 shows the projected sky distribution of H i-detected galaxies (filled circles) and galaxies from 6dFGS not detected in H i (unfilled squares) with c|$z\lt 7 000$| km s−1. The Hydra I cluster lies in the eastern half of the observed footprint (the dashed circle indicates R200) and shows a clear concentration of galaxies with H i non-detections dominating within R200.
We classify galaxies within the Hydra field footprint as cluster, infall, or field galaxies based on their location on a phase space diagram (e.g. Rhee et al. 2017) of the Hydra I cluster (Fig. 2). Cluster galaxies have projected distances from the cluster centre of r < R200 and velocities relative to the cluster systemic velocity, Δv/σdisp < 3σesc, where σesc is the uncertainty in the escape velocity, above the cluster escape velocity curve (i.e. below the dotted black curve). We calculate the escape velocity and σesc following equations (1)–(4) from Rhee et al. (2017) using R200, M200, and σdisp given in Section 1.1. Infall galaxies are defined by R200 < r < 2.5R200 and Δv/σdisp < 3σesc above the cluster escape velocity curve. All other galaxies are classified as field galaxies. We detect significantly more galaxies in H i with WALLABY compared to those listed by Solanes et al. (2001): 44 within 1.35° versus 20 within 2.16° and 129 within ∼6.75° versus 96 within 10.8° (also noting that the WALLABY observations extend out ∼6.75° to the West of the cluster and ∼2.5° in all other directions). We also detect approximately six times more galaxies than are included in the HIPASS catalogue within this region of sky (23 individual galaxies with integrated signal-to-noise ratio |$\rm {SNR}\gt 5$|, Barnes et al. 2001; Meyer et al. 2004) due to the increased sensitivity of WALLABY (∼2 versus ∼13 mJy beam−1). We tabulate the environment classifications and the galaxy properties we estimate/compute in Section 2 (i.e. H i and stellar mass, H i, r-band and NUV disc diameters, and SFRs) in Appendix A, with the full tables available as supplementary online material.
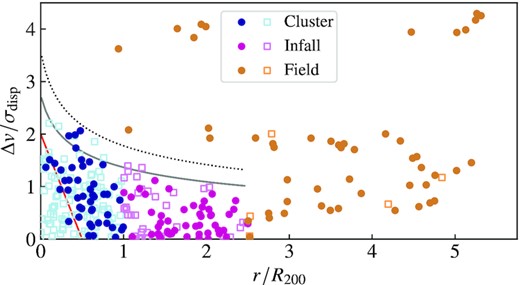
Hydra I cluster phase space diagram used to classify galaxies into the three populations: cluster, infall, and field (blue, purple, and orange, respectively). The filled circles and unfilled squares indicate H i detections and non-detections, respectively. The virialized region defined by Rhee et al. (2017) lies to the left of the red diagonal line. The escape velocity curve for Hydra I is indicated by the solid grey curve with 3σesc above the escape velocity curve indicated by the dotted grey curve.
2.1.1 H i mass
In this work, we use two H i properties: the total H i mass and the size of the H i disc. We use the integrated fluxes and integrated intensity (moment 0) maps to measure these quantities for the H i detections and derive upper limits for the H i non-detections.
2.1.2 H i diameter
For H i-detected galaxies, we measure the diameter of the H i disc, dHI, from the moment 0 (integrated intensity) map at a H i surface density of |$1\, \rm {M}_{\odot }\, \rm {pc}^{-2}$|. Defining a galaxy’s H i disc diameter at this surface density, Broeils & Rhee (1997) found a tight (<0.1 dex) correlation with the total H i mass. We note there is the potential of a bias of underestimating measured H i sizes from interferometric observations due to interferometers potentially missing extended emission due to the short spacing problem (e.g. Braun & Walterbos 1985). To address this, we compare the integrated fluxes and integrated spectra of the 23 galaxies detected with WALLABY that are catalogued in HIPASS (Meyer et al. 2004). We find good agreement between both the integrated fluxes and spectra from WALLABY and HIPASS with a median WALLABY to HIPASS flux ratio of Sint,W/Sint,H ∼ 1.03. This indicates that the WALLABY observations are recovering most the H i emission and our measured H i diameters should be reliable.
For galaxies not detected in H i, we estimate the maximum H i disc these galaxies may have based on the H i size–mass relation. We use the H i size–mass relation from Wang et al. (2016), |$\log (D_{\mathrm {HI}}/\mathrm {kpc})=0.506\log (M_{\mathrm {HI}}/\mathrm {M}_{\odot }) - 3.293$|, and the H i mass limit defined previously (Section 2.1.1) to estimate upper limit H i disc diameters for the galaxies not detected in H i. In dense environments where stripping is occurring, the H i size–mass relation holds tight (Wang et al. 2016).
2.2 PanSTARRS
We derive stellar masses and measure optical sizes using photometric images from the PanSTARRS (Chambers et al. 2016; Flewelling et al. 2020) g- and r-bands. We obtain image cut-outs at the position of each H i detection and non-detection using the PanSTARRS cut-out server.3 There are 14 galaxies for which the PanSTARRS image cut-outs have incomplete coverage and/or artefacts (e.g. close to a foreground star), making these galaxies unusable for deriving optical sizes or photometry. We exclude these from our sample (see Table 1 for our final galaxy totals for which we can measure stellar masses and optical diameters).
The number of galaxies in each of our three environment classifications (cluster, infall, and field) detected in H i with WALLABY and H i non-detections in 6dFGS.
| Total | Cluster | Infall | Field | |
|---|---|---|---|---|
| H i detections | 129 | 44 | 42 | 43 |
| H i non-detections | 142 | 102 | 35 | 5 |
| Total | Cluster | Infall | Field | |
|---|---|---|---|---|
| H i detections | 129 | 44 | 42 | 43 |
| H i non-detections | 142 | 102 | 35 | 5 |
We set isophotes with a mean of <5σy (i.e. <25 pixel−2, where σy ∼ 5 ADU pixel−2) to the surface brightness of 25.5 mag arcsec−2 (i.e. 25 ADU pixel−2). The surface brightness limits of the PanSTARRS data in the Hydra I cluster region are 27.6 and 27.0 mag arcsec−2 in the g- and r-bands, respectively, calculated as 3σ in 10 × 10 arcsec boxes following the surface brightness limit definition of Román, Trujillo & Montes (2020). This surface brightness limit is well below the isophotal contour of 25.5 mag arcsec−2 that we use in this work. We measure the total r-band magnitude within an aperture defined by the isophote at which the surface brightness drops to 25.0 mag arcsec−2 using the photutils task aperture_photometry. We also use this aperture to extract the total g-band image ADU and calculate the total g-band magnitude.
2.2.1 Stellar mass and r-band diameter
Our calculated stellar masses have uncertainties of ∼0.16 dex. We define a galaxy’s optical diameter4 as the size of the galaxy at which the r-band surface brightness reaches 23.5 mag arcsec−2. We measure this by interpolating between the two isophotes bridging this surface brightness. Similar to the H i diameter, we correct the r-band diameter for the size of the point spread function (PSF) using equation (4) and the PanSTARRS PSF full width at half-maximum (FWHM) of ∼1.25 arcsec.
2.3 GALEX and WISE
A galaxy’s recent (<100 Myr) unobscured star formation is traced by its ultraviolet (UV) luminosity emitted from young stars (e.g. Kennicutt 1998; Kennicutt & Evans 2012, and references therein). The UV emission suffers significant dust attenuation, whereby the UV emission is absorbed by dust and emitted in the infrared (IR, e.g. Buat et al. 2005; Hao et al. 2011). As a result, a correction for dust attenuation is required when the UV emission is used to trace a galaxy’s SFR. We derive SFRs using UV and IR photometric images from GALEX (Martin et al. 2005; Morrissey et al. 2007) and WISE (Wright et al. 2010), respectively. We also measure the size of the disc of recent star formation from the GALEX UV images.
2.3.1 GALEX
Our UV imaging comes from GALEX near-UV (NUV) band. We download all GALEX coadded images5 from GALEX DR6+7 (Bianchi et al. 2017) covering a region around each of our galaxies and mosaic a cut-out subregion around each source using swarp (Bertin et al. 2002). GALEX does not have complete sky coverage in the WALLABY footprint, resulting in 122 (133) galaxies with (without) H i detections having GALEX data. The majority of galaxies were only observed in the shallow GALEX All-sky Imaging Survey (AIS), with a handful of galaxies observed in the deeper Medium Imaging Survey (MIS) and Nearby Galaxy Survey (NGS).
Using the curve of growth, we measure total asymptotic magnitudes (e.g. Muñoz-Mateos et al. 2015). We perform a linear least squares fit to the total magnitude versus derivative of the curve of growth, Δm, for apertures where Δm < 0.05 (i.e. there is little variation in the curve of growth and it is approximately flat). The total asymptotic magnitude is then found by extrapolating this linear fit to Δmfit = 0.0. We correct GALEX NUV magnitudes for Galactic extinction following the same method as the PanSTARRS g- and r-bands, with RV = 8.2 from Wyder et al. (2007) for the NUV (Section 2.2.1).
2.3.2 WISE
For our IR imaging, we use unWISE (Lang 2014; Meisner, Lang & Schlegel 2017) coadds from WISE, which removes the blurring present in the original WISE coadded images. We follow the same method to create cut-out subregion images from unWISE as GALEX from coadded intensity images.6
2.3.3 Star formation rate
We calculate total SFRs for our galaxies by combining the contributions derived from GALEX NUV and WISE mid-infrared (MIR) magnitudes following Janowiecki et al. (2017). Both GALEX and WISE have published all-sky source photometry catalogues, whose automated photometry measurements are optimized for point sources and tend to underestimate the total magnitude (e.g. for WISE see Jarrett et al. 2013). As our sample includes all nearby, resolved galaxies, we measure magnitudes from image cut-outs in the WISE and GALEX photometric bands to ensure we recover all the source flux.
Similarly to the r-band, we measure NUV-band disc diameters at an isophotal surface brightness of 28 mag arcsec−2. We also correct the NUV disc diameter for the PSF using equation (4) adopting the NUV PSF of 4.9 arcsec (FWHM).
3 RESULTS
3.1 Sample characterization
We begin by characterizing the general properties of our sample of H i detections and non-detections. We quantify the fraction of galaxies detected in H i and where these galaxies lie with respect to the Hydra I cluster centre. It is clear in Figs 1 and 2 that within R200 the majority of galaxies are not detected in H i. In particular, only three galaxies detected in H i lie within the virialized region defined by Rhee et al. (2017) of Fig. 2 (to the left of the red diagonal line). In Fig. 3, we quantify the fraction of cluster (blue squares) and infall (purple diamonds) galaxies detected in H i as a function of projected distance from the cluster centre in radial bins of width 0.2R200, and compare this with the fraction of field (orange dashed line) galaxies detected in H i. Beyond 1.5R200, the fraction of galaxies detected in H i in the infall region is comparable to the H i-detected fraction in the field (∼0.85). The H i-detected fraction drops sharply to ∼0.3 at ∼1.5R200 and then decreases to ∼0.2 within the central ∼0.2R200.
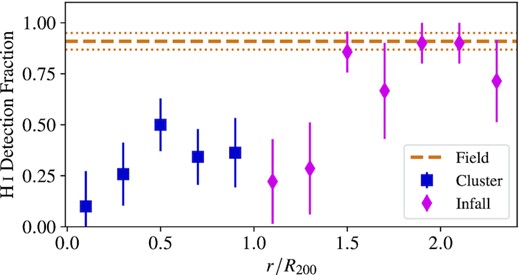
The fraction of galaxies detected in H i in radial bins of width 0.2R200 for the cluster and infall populations (blue squares and purple diamonds, respectively). The H i-detected fraction of the field population is shown by the horizontal dashed orange line with the dotted lines indicating the uncertainty. The error bars are calculated assuming that the uncertainties follow a binomial distribution.
We compare our H i detections to the xGASS H i gas fraction (fHI = MHI/M*) versus stellar mass scaling relation from Catinella et al. (2018) in Fig. 4. xGASS is a stellar-mass-selected (|$M_*\gt 10^9\, \rm {M}_{\odot }$|), gas-fraction-limited H i survey of |$\sim 1 200$| galaxies with 0.02 < z < 0.05, which is representative of the H i properties of galaxies in the local Universe. Around 50 per cent of the galaxies detected by WALLABY lie below the stellar-mass selection limit of xGASS (|$M_*\lt 10^9\, \rm {M}_{\odot }$|). The H i non-detections identified from 6dFGS are predominantly galaxies in the same stellar-mass range probed by xGASS. As expected for a blind H i survey, WALLABY detects gas-rich galaxies (i.e. on or above the xGASS median relation from Catinella et al. 2018 for galaxies with |$M_*\gt 10^9\, \rm {M}_{\odot }$| and when extrapolated to lower stellar masses). Our H i-detected populations also tend to be more gas-rich compared to the gas fraction scaling relation defined by Janowiecki et al. (2020) using star-forming galaxies from xGASS (dashed grey line). We do not find any environmental dependence on the gas fractions of the H i-detected cluster, infall, or field populations. H i stacking is required to probe the gas-poor regime at the Hydra I cluster distance of 61 Mpc.
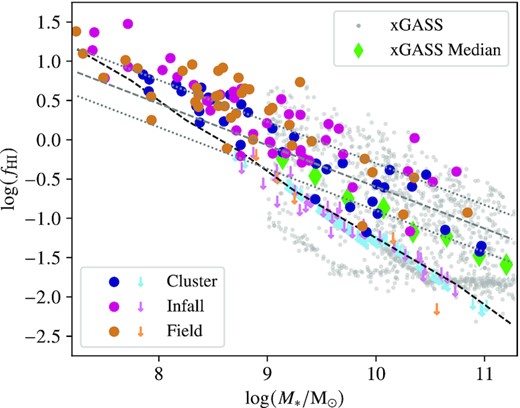
H i gas fraction (fHI = MHI/M*) versus stellar mass (M*) of galaxies in the Hydra field both with and without H i detections (filled circles and downward arrows, respectively). The cluster, infall, and field populations are the blue, purple, and orange symbols, respectively. The grey points are the xGASS sample, and the filled green diamonds show the median xGASS relation (Catinella et al. 2018). The dashed grey line is the gas fraction main sequence defined by Janowiecki et al. (2020) using star-forming galaxies in xGASS with the dotted grey lines indicating a scatter of 0.3 dex above and below the main sequence. The dashed black line indicates the gas fraction sensitivity limit at the distance of the Hydra I cluster (61 Mpc).
We plot our cluster, infall, and field populations of H i detections and non-detections in the SFR versus stellar mass plane in Fig. 5 and compare with the star-forming main sequence defined using the xGASS sample by Janowiecki et al. (2017). We can directly compare our galaxies to the xGASS star-forming main sequence as we have derived SFRs in a way identical to that of Janowiecki et al. (2017). All three H i-detected populations follow the xGASS-defined main sequence, while the majority of the cluster and infall H i non-detections lie below the main sequence in the region that contains passive, quenched galaxies. We investigate and quantify the distribution of our galaxy populations around the star-forming main sequence below in Section 3.2.2.
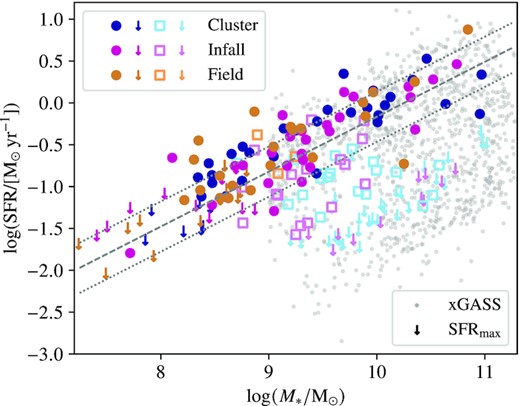
SFR versus stellar mass (M*) for galaxies in the Hydra field both with and without H i detections. The colours are the same as in Fig. 4. The H i detections and non-detections with measured SFRs are shown by filled circles and unfilled squares, respectively. Upper limit SFRs (SFRmax) are indicated by downward arrows. The grey points are the xGASS sample. The star-forming main sequence defined by Janowiecki et al. (2017) using xGASS is shown by the dashed grey line with the dotted grey lines indicating ±0.3 dex above and below the main sequence.
In Fig. 6, we look at the offset of galaxies above and below the star-forming main sequence, |$\Delta \rm {SFMS}$|, and gas fraction main sequence, |$\Delta \rm {GFMS}$|. The offset is defined as the vertical displacement (i.e. at fixed stellar mass) of each galaxy above or below the SFMS or GFMS. Unsurprisingly, we find that galaxies are concentrated in the top right quadrant (i.e. positive |$\Delta \rm {SFMS}$| and |$\Delta \rm {GFMS}$|). This indicates that galaxies which are more gas-rich are also more star-forming. We also find possible evidence for gas removal that is not yet affecting star formation (i.e. moving horizontally across Fig. 6) between the infall and cluster populations where the cluster points (blue) appear to the preferentially located to the left of the infall (purple) points, although we note that the majority of galaxies lie within the 1σ scatter of the main sequences. Additionally, the GFMS below |$M_*=10^9\, \rm {M}_{\odot }$| is just an extrapolation and no strong conclusions should be drawn for galaxies with |$M_*\lt 10^9\, \rm {M}_{\odot }$|. However, we find that the median |$\Delta \rm {GFMS}$| of high-mass (|$M_*\ge 10^9\, \rm {M}_{\odot }$|) cluster galaxies is lower than that of the infall and field, but there is no corresponding decrease in the median |$\Delta \rm {SFMS}$| (see Section 3.2.2).
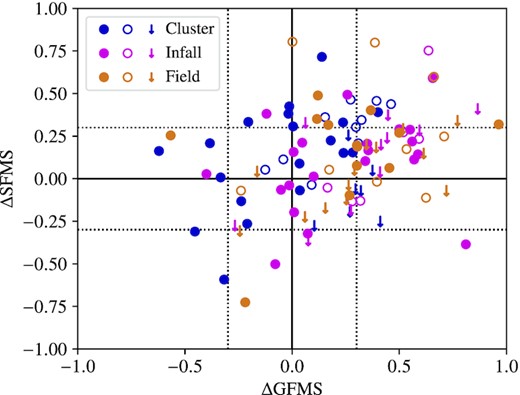
Offset from the star-forming main sequence (|$\Delta \rm {SFMS}$|) versus offset from the gas fraction main sequence (|$\Delta \rm {GFMS}$|) for galaxies detected in H i. The colours are the same as in Fig. 4. Upper limit SFRs are indicated by downward arrows and are all low-mass (|$M_*\lt 10^9\, \rm {M}_{\odot }$|). Low-mass galaxies with measured SFRs are indicated by unfilled circles. The star-forming and gas fraction main sequences in Figs 4 and 5 are shown by the solid black lines with the dotted black lines indicating ±0.3 dex above and below the main sequences.
3.2 Probing the environment
We investigate the influence of the environment on gas removal and star formation of galaxies falling into Hydra I using the ratios between H i, r-band, and NUV disc diameters (Fig. 7) and the offsets from the star-forming and gas fraction main sequences (Fig. 8). In these figures, we show the distributions of each measured property for our H i-detected cluster, infall, and field populations (blue square, purple diamond, and orange circle, respectively). The rows of Fig. 7 show, from top to bottom, histograms of the distributions of H i to optical r-band disc diameter ratio (dHI/dopt), the H i to NUV disc diameter ratio (dHI/dNUV), and the NUV to optical r-band disc diameter ratio (dNUV/dopt). The top and bottom rows of Fig. 8 show histograms of the offset from the star-forming main sequence (|$\Delta \rm {SFMS}$|) and the offset from the gas fraction main sequence (|$\Delta \rm {GFMS}$|). Above the histograms, we plot the median and 25th and 75th percentiles of each distribution. The H i non-detections are shown using light-coloured left-pointing arrows and dashed lines with the median of the combined H i detections and non-detections shown by the crosses.

Histograms of the H i to optical r-band diameter ratio, dHI/dopt, the H i to NUV disc diameter ratio, dHI/dNUV, and the NUV to optical r-band disc diameter ratio, dNUV/dopt (top, centre, and bottom rows, respectively) for the three galaxy populations: cluster, infall, and field (blue square, purple diamond, and orange circle, respectively). The solid dark lines/symbols show the distributions of H i-detected galaxies. The dashed light lines/left-pointing arrows show the distributions for H i non-detections. The large solid points and horizontal error bars indicate the median and 25th and 75th percentiles for the H i-detected distributions (tabulated in Table 2). The crosses indicate the medians including the H i non-detections. The numbers to the left of the medians are the total number of H i detections (non-detections) in each population. The vertical dashed lines indicate a diameter ratio of 1. The left column includes all galaxies. The centre and right columns show low- (|$M_*\lt 10^9\, \rm {M}_{\odot }$|) and high-mass (|$M_*\ge 10^9\, \rm {M}_{\odot }$|) subsamples, respectively. To ease the differentiation between bins with 0 or 1 count, we have plotted the total in each bin as one more than the number of galaxies (i.e. 100 means the bin contains no galaxies).
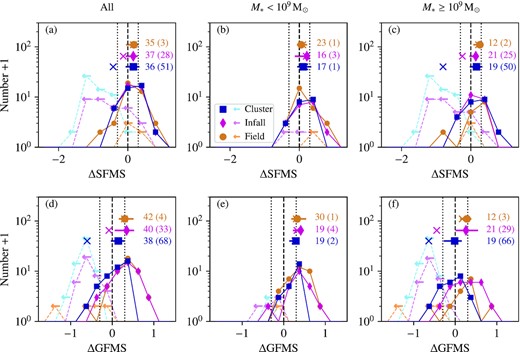
Similar to Fig. 7 showing histograms of the distance from the star-forming main sequence, |$\Delta \rm {SFMS}$|, and the distance from the gas fraction main sequence, |$\Delta \rm {GFMS}$| (top and bottom rows, respectively). The medians and 25th and 75th percentiles are tabulated in Table 3. The xGASS star-forming and gas fraction main sequences (vertical lines in the top and bottom panels, respectively) are as in Fig. 6.
The left columns of Figs 7 and 8 include all galaxies in each population. Galaxy properties show a dependence on stellar mass (e.g. gas fraction and SFR; see Figs 4 and 5 of this work and Catinella et al. 2018). To check if trends present in the full sample are driven by stellar mass, we subdivide the galaxy populations into low- and high-stellar-mass subsamples (M* < 109 and |$\ge 10^9\, \rm {M}_{\odot }$|, i.e. boundary between dwarf and giant galaxies) in the centre and right columns. Splitting the sample at |$M_*=10^9\, \rm {M}_{\odot }$| also produces a fairly even number of H i-detected galaxies in each subsample. Although we note that the majority of the H i non-detections are in the high-mass subsample. Moreover, not all quantities can be measured for all galaxies (e.g. some galaxies with PanSTARRS imaging are missing GALEX coverage, while others with GALEX imaging have artefacts in the PanSTARRS images) which results in different galaxy totals. Our results do not change if we limit our sample to galaxies measured in all wavelengths and we choose to use all galaxies for which we can measure each quantity to maximize our statistics. We discuss Figs 7 and 8 in more detail below.
3.2.1 Atomic gas disc extent
The H i to isophotal 23.5 mag arcsec|$^{-2}$| r-band disc diameter ratio, dHI/dopt, quantifies the relative size of the H i disc for a uniformly defined optical disc surface brightness and can be used to probe gas stripping. This parameter is most sensitive to gas removal in the outer disc (i.e. where environmental effects will be strongest and first felt by a galaxy). We find a clear decreasing trend in the median dHI/dopt from the field, dHI/dopt = 3.5, to the cluster, dHI/dopt = 2.0 (|$\sim 43{{\ \rm per\ cent}}$| smaller dHI/dopt for the cluster population, panel a of Fig. 7). We assess the significance of difference in the dHI/dopt distributions using the Kolmogorov–Smirnov (KS) test, where the difference between the distributions is statistically significant for p-values <0.05. For p-values ≥0.05, we reject the hypothesis that the distributions are different. We find that the cluster population is statistically different from the infall and field (p-values of 0.0061 and 0.0001), while the difference in the infall and field distributions is not statistically significant (p-value of 0.06). The reduction in the diameter ratio found in denser environments suggests that the environment is responsible for removing gas from the outskirts of the galaxies, thereby shrinking their H i discs. This trend is strengthened if H i non-detections with upper limits for dHI/dopt are included in the median (the cluster median dHI/dopt is 90 per cent smaller than that of the field). The upper limits from galaxies not detected in H i with WALLABY are all truncated within the optical disc (i.e. dHI/dopt < 1, see Section 2.1.2 for our method of estimating H i non-detection dHI upper limits). Hence, there are likely populations of cluster and infall galaxies with H i discs smaller than their optical discs, similar to those observed in the Virgo cluster (Chung et al. 2009; Yoon et al. 2017), which are below the WALLABY mass detection limit at the distance of Hydra (|$M_{\rm {HI}}\sim 10^{8.7}\, \rm {M}_{\odot }$| at 61 Mpc).
The median decrease in dHI/dopt from the field to the cluster is not mass-dependent, as the same trend is present in low- and high-mass (M* < 109 and |$\gt 10^9\, \rm {M}_{\odot }$|, respectively) subsamples (panels b and c of Fig. 7). These subsamples also show that lower mass galaxies tend to have larger, more extended H i gas reservoirs compared to their optical discs, which is expected from the H i gas fraction versus stellar mass scaling relation, where gas fraction decreases with increasing stellar mass (Fig. 4). We tabulate the medians and 25th and 75th percentiles from Fig. 7 in Table 2. Our results do not change if we exclude unresolved H i detections for which our measured dHI are upper limits (see Section 2.1.2).
Median H i to optical r-band diameter ratio (dHI/dopt), H i to NUV diameter ratio (dHI/dNUV), and NUV to optical diameter ratio (dNUV/dopt) for the cluster, infall, and field populations in Fig. 7. For the H i-detected samples, the 25th and 75th percentiles are the median ± the superscript and subscript, respectively.
| dHI/dopt | dHI/dNUV | dNUV/dopt | |||||||
|---|---|---|---|---|---|---|---|---|---|
| Sample | Cluster | Infall | Field | Cluster | Infall | Field | Cluster | Infall | Field |
| H i detections | |||||||||
| All | 1.9|$^{+1.3}_{-0.4}$| | 2.8|$^{+0.8}_{-0.8}$| | 3.5|$^{+1.1}_{-1.0}$| | 2.0|$^{+0.5}_{-0.2}$| | 2.2|$^{+0.3}_{-0.3}$| | 2.5|$^{+0.5}_{-0.5}$| | 1.0|$^{+0.2}_{-0.2}$| | 1.1|$^{+0.4}_{-0.2}$| | 1.4|$^{+0.4}_{-0.3}$| |
| |$M_*\lt 10^9\, \rm {M}_{\odot }$| | 3.2|$^{+0.7}_{-0.9}$| | 3.5|$^{+0.7}_{-0.5}$| | 4.3|$^{+0.9}_{-1.4}$| | 2.4|$^{+0.8}_{-0.4}$| | 2.5|$^{+0.5}_{-0.2}$| | 2.7|$^{+0.4}_{-0.2}$| | 1.1|$^{+0.4}_{-0.2}$| | 1.3|$^{+0.4}_{-0.3}$| | 1.4|$^{+0.4}_{-0.2}$| |
| |$M_*\ge 10^9\, \rm {M}_{\odot }$| | 1.5|$^{+0.2}_{-0.4}$| | 2.0|$^{+0.8}_{-0.3}$| | 2.5|$^{+0.4}_{-0.4}$| | 1.7|$^{+0.2}_{-0.2}$| | 2.0|$^{+0.5}_{-0.1}$| | 2.0|$^{+0.4}_{-0.2}$| | 0.9|$^{+0.1}_{-0.1}$| | 1.0|$^{+0.5}_{-0.1}$| | 1.2|$^{+0.2}_{-0.2}$| |
| H i detections and non-detections | |||||||||
| All | 0.4 | 1.7 | 3.1 | 1.0 | 1.8 | 2.5 | 0.6 | 0.8 | 1.3 |
| |$M_*\lt 10^9\, \rm {M}_{\odot }$| | 2.9 | 3.3 | 4.2 | 2.4 | 2.3 | 2.7 | 1.1 | 1.2 | 1.4 |
| |$M_*\ge 10^9\, \rm {M}_{\odot }$| | 0.4 | 0.5 | 2.1 | 0.8 | 1.5 | 1.9 | 0.5 | 0.7 | 1.1 |
| H i detections (dHI > 45 arcsec) | |||||||||
| All | 1.9|$^{+1.4}_{-0.5}$| | 2.6|$^{+1.1}_{-0.8}$| | 3.5|$^{+1.2}_{-1.0}$| | 2.0|$^{+0.5}_{-0.2}$| | 2.3|$^{+0.3}_{-0.3}$| | 2.5|$^{+0.5}_{-0.5}$| | – | – | – |
| |$M_*\lt 10^9\, \rm {M}_{\odot }$| | 3.2|$^{+0.8}_{-0.7}$| | 3.6|$^{+0.8}_{-0.6}$| | 4.2|$^{+1.1}_{-1.3}$| | 2.4|$^{+0.8}_{-0.4}$| | 2.5|$^{+0.4}_{-0.2}$| | 2.7|$^{+0.5}_{-0.2}$| | – | – | – |
| |$M_*\ge 10^9\, \rm {M}_{\odot }$| | 1.5|$^{+0.2}_{-0.4}$| | 2.0|$^{+0.7}_{-0.3}$| | 2.5|$^{+0.4}_{-0.4}$| | 1.7|$^{+0.2}_{-0.2}$| | 2.0|$^{+0.5}_{-0.2}$| | 2.0|$^{+0.3}_{-0.2}$| | – | – | – |
Median offset from the star-forming main sequence (|$\Delta \rm {SFMS}$|) and gas fraction main sequence (|$\Delta \rm {GFMS}$|) for the cluster, infall, and field populations in Fig. 8. For the H i-detected samples, the 25th and 75th percentiles are the median ± the superscript and subscript, respectively.
| |$\Delta \rm {SFMS}$| | |$\Delta \rm {GFMS}$| | |||||
|---|---|---|---|---|---|---|
| Sample | Cluster | Infall | Field | Cluster | Infall | Field |
| H i Detections | ||||||
| All | 0.2|$^{+0.2}_{-0.2}$| | 0.2|$^{+0.1}_{-0.2}$| | 0.2|$^{+0.1}_{-0.2}$| | 0.1|$^{+0.2}_{-0.2}$| | 0.3|$^{+0.2}_{-0.3}$| | 0.3|$^{+0.2}_{-0.1}$| |
| |$M_*\lt 10^9\, \rm {M}_{\odot }$| | 0.1|$^{+0.2}_{-0.2}$| | 0.2|$^{+0.1}_{-0.3}$| | 0.1|$^{+0.2}_{-0.1}$| | 0.3|$^{+0.0}_{-0.2}$| | 0.4|$^{+0.1}_{-0.2}$| | 0.3|$^{+0.2}_{-0.1}$| |
| |$M_*\ge 10^9\, \rm {M}_{\odot }$| | 0.2|$^{+0.2}_{-0.2}$| | 0.1|$^{+0.1}_{-0.2}$| | 0.3|$^{+0.1}_{-0.2}$| | 0.0|$^{+0.2}_{-0.3}$| | 0.3|$^{+0.3}_{-0.3}$| | 0.3|$^{+0.1}_{-0.2}$| |
| H i detections and non-detections | ||||||
| All | −0.4 | −0.1 | 0.2 | −0.6 | −0.1 | 0.3 |
| |$M_*\lt 10^9\, \rm {M}_{\odot }$| | 0.2 | 0.2 | 0.1 | 0.3 | 0.3 | 0.3 |
| |$M_*\ge 10^9\, \rm {M}_{\odot }$| | −0.8 | −0.2 | 0.2 | −0.6 | −0.4 | 0.2 |
To illustrate the H i disc truncation observed as galaxies fall into Hydra I, we show PanSTARRS r-band and GALEX NUV-band images for three field, infall, and cluster galaxies in Fig. 9 (top, centre, and bottom rows, respectively). The measured sizes of the r-band, NUV, and H i discs are shown by the overlaid solid red and dashed blue ellipses and purple contour, respectively. The columns show a galaxy from each population with similar stellar masses of M* ∼ 108.7, 109.5, and |$10^{10.5}\, \rm {M}_{\odot }$| (left, centre, and right columns, respectively). We observe the H i disc truncation across all stellar masses (lower rows of Fig. 7). We also see that H i discs are more extended compared to their optical discs in the low-mass galaxies than the high-mass galaxies. Although we note that due to the H i detection limit, it will be more difficult to detect H i-poor low-mass galaxies.
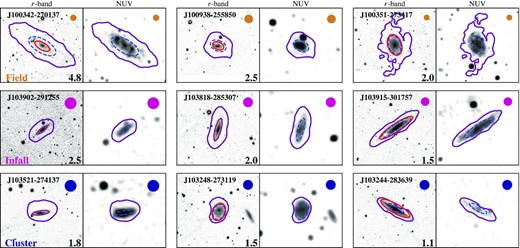
Example field, infall, and cluster galaxies (top, centre, and bottom rows, respectively). The three galaxies from each population are taken from across the sample stellar mass range and have similar stellar masses of M* ∼ 108.7, 109.5, and |$10^{10.5}\, \rm {M}_{\odot }$| (left, centre, and right columns, respectively). The PanSTARRS r-band and GALEX NUV-band images for each galaxy are shown, with overlaid ellipses (solid red and dashed blue, respectively) showing the measured sizes in each band. The purple contour shows the inclination-corrected H i surface density of |$1\, \rm {M}_{\odot }\, \rm {pc}^{-2}$|. The filled circle in the top right corner of each panel shows the WALLABY synthesized beam, which is coloured according to its parent population: cluster (blue), infall (purple), field (orange). The number in the bottom right of the r-band panels is the measured dHI/dopt of each galaxy. For added clarity, the NUV images are smoothed using a 3 × 3 pixel kernel. The NUV disc diameters are measured using the original, unsmoothed data.
3.2.2 Offset from the star-forming and gas fraction main sequences
At a fixed stellar mass, galaxies significantly (>0.3 dex) above (below) the star-forming main sequence are forming more (less) stars than those that lie on the main sequence, and are referred to as star-bursting (quenched). Hence, a galaxy population’s offset from the star-forming main sequence at fixed stellar mass provides information on the population’s average star formation relative to normal star-forming galaxies. Similarly, the offset of a galaxy population from the gas fraction main sequence for star-forming galaxies provides an indication of population’s gas-richness.
Panel a of Fig. 8 collapses the SFR versus stellar mass plot (Fig. 5) in stellar mass to show the distribution of the cluster, infall, and field populations about the star-forming main sequence, |$\Delta \rm {SFMS}$| (vertical dashed line at 0) from xGASS. The three populations of H i-detected galaxies are centred on the star-forming main sequence and are indistinguishable (KS test p-values between each population pair are >0.5). There is only a clear difference in median offset below the star-forming main sequence for the cluster population once H i non-detections are included (KS test p-value of <0.0001 between the cluster and field populations). These quenched galaxies in the cluster and infall populations are responsible for the peaks in the H i non-detections at ∼1.2 dex below the star-forming main sequence (i.e. ∼4σ below the star-forming main sequence). The H i non-detections dominate the cluster population (|$\sim 66{{\ \rm per\ cent}}$|) and lower the median offset to below the star-forming main sequence by ∼0.8 dex. The median of the infall population also decreases, but remains within the star-forming main sequence scatter (non-detections only account for |$\sim 43{{\ \rm per\ cent}}$| of the infall population). The three H i non-detections in the field lie on the star-forming main sequence and have stellar masses |$\lt 10^{9.3}\, \rm {M}_{\odot }$|. We find no dependence on stellar mass if we split the populations into low and high stellar mass (panels b and c of Fig. 8). We tabulate the medians and 25th and 75th percentiles from Fig. 8 in Table 3. Similar to the |$\Delta \rm {SFMS}$| behaviour for the three populations, we find no difference in the distributions of |$\mathrm{NUV}-r$| colour for the cluster, infall, and field galaxies.
We plot the distributions of |$\Delta \rm {GFMS}$| for the cluster, infall, and field galaxies in panel d of Fig. 8. As hinted at in Fig. 6, we see that the cluster population median is offset by |$\sim 66{{\ \rm per\ cent}}$| to lower |$\Delta \rm {GFMS}$| compared to the infall or field. Performing a KS test, we find that the difference between the cluster and infall/field populations is statistically significant (p-values of 0.003 and 0.024 with the infall and field, respectively). All medians are above |$\Delta \rm {GFMS}=0$|, which illustrates that we are most sensitive to gas-rich and gas-normal galaxies. There are no cluster galaxies with |$\Delta \rm {GFMS}\gt 0.5$| compared to 12 infall and 9 field galaxies. This follows our findings of smaller dHI/dopt moving from the field to the cluster (panel a of Fig. 7) as the gas fraction will presumably be lower in galaxies with smaller dHI/dopt. Similar to the results for dHI/dopt and |$\Delta \rm {SFMS}$|, including H i non-detections increases the difference in medians among the three populations by lowering the cluster median to ∼2σ below |$\Delta \rm {GFMS}=0$| and the infall median to |$\Delta \rm {GFMS}\sim 0.1$| due to large number of H i non-detections in these two populations. Unlike dHI/dopt and |$\Delta \rm {SFMS}$|, the results for |$\Delta \rm {GFMS}$| show a mass dependence. In the low-mass subsample (panel e of Fig. 8) there is no difference in the median offset. This is likely due to our extrapolation of the gas fraction main sequence below |$M_*\lt 10^9\, \rm {M}_{\odot }$|. For the high-mass subsample (panel f of Fig. 8), the trend of decreasing |$\Delta \rm {GFMS}$| from the field to the cluster remains with the cluster and infall medians 100 per cent and 33 per cent lower than the field. The significance of the difference between the cluster and field populations is unchanged. However, the difference between the cluster and infall populations becomes less significant (KS test p-value of 0.038).
3.2.3 NUV disc extent
Although the H i-detected cluster population is not offset below the star-forming main sequence, indicating no disc-wide quenching is occurring, there may be a reduction in the star formation in the outer disc (i.e. beyond the optical disc). This would indicate that gas is being predominantly stripped from the disc outskirts. NUV emission traces recently formed, young stars and we find that it extends beyond the optical r-band disc in a large fraction of galaxies detected in H i (dNUV > dopt, panel g of Fig. 7, see also Fig. 9). We note that our results for the NUV disc sizes are true for diameters measured to an isophotal surface brightness of 28 mag arcsec−2. With sufficiently deep observations, galaxies are found to possess NUV discs with comparable extents as in the H i (e.g. Meurer et al. 2018).
We compare the H i to NUV (dHI/dNUV) and NUV to optical (dNUV/dopt) disc diameter ratios of the three galaxy populations in panels d and g of Fig. 7, respectively. We find a small decrease in the median dHI/dNUV and dNUV/dopt moving from the field, through the infall and to the cluster, although these trends are more subtle than for the H i to optical diameter ratio (i.e. |$\sim 40{{\ \rm per\ cent}}$| smaller dHI/dopt versus |$\sim 20{{\ \rm per\ cent}}$| smaller dHI/dNUV and |$\sim 30{{\ \rm per\ cent}}$| smaller dNUV/dopt between the cluster and field). Only the differences between the cluster and field dHI/dNUV and dNUV/dopt distributions are statistically significant according to a KS test (p-values of 0.0068 and 0.0004, respectively). Including H i non-detection upper limits has a similar effect on dHI/dNUV as we find for dHI/dopt (the cluster median becomes 80 per cent smaller than the field). This indicates two things: (1) that galaxies in the cluster population have smaller gas reservoirs than galaxies with similar NUV discs in the field and (2) that the cluster galaxies have on average smaller star-forming discs than the field population. The stronger trend in dHI/dopt than dNUV/dopt with environment also illustrates the sensitivity of H i for probing environmental effects. We find the same trends of decreasing median dHI/dNUV and dNUV/dopt in subsamples of low- and high-mass galaxies (panels e, f, h, and i of Fig. 7). The truncation of the NUV disc relative to the r-band disc is also illustrated in Fig. 9 (dashed blue and solid red ellipses, respectively). We note that we have smoothed the NUV images for clarity, but measure the NUV disc sizes from the original, unsmoothed data. This smoothing is the cause of the apparent underestimation of the NUV disc diameters.
4 DISCUSSION
4.1 Gas removal
In agreement with the results of previous studies (e.g. Giovanelli & Haynes 1985; Solanes et al. 2001; Hess & Wilcots 2013; Brown et al. 2017; Yoon et al. 2017), we find clear evidence that the environment of Hydra I is affecting the H i gas content and extent of galaxies in the cluster and infall populations. The fraction of galaxies detected in H i within <1.5R200 of Hydra I (∼0.35) is significantly lower than that of infall galaxies at >1.5R200 (∼0.85). The H i-detected fraction of infall galaxies at >1.5R200 is also comparable to the fraction of galaxies detected in the field (∼0.9). This indicates that environmental processes are likely responsible for the removal and/or depletion of H i to below the WALLABY detection limit of |$M_{\rm {HI}}\sim 10^{8.7}\, \rm {M}_{\odot }$| at projected distances of <1.5R200 from Hydra I.
A significant population of galaxies (|$\sim 50{{\ \rm per\ cent}}$|) in the VLA Imaging survey of Virgo galaxies in Atomic gas (VIVA, Chung et al. 2009) are found with H i discs truncated to within the stellar disc with the smallest dHI/dopt ∼ 0.2 (Chung et al. 2009; Yoon et al. 2017). In Hydra I, we only find four H i-detected cluster galaxies (|$\sim 10{{\ \rm per\ cent}}$| of the cluster population) with dHI/dopt < 1 (dHI/dopt = 0.8–0.9 of which two are only marginally resolved, i.e. dHI < 60 arcsec). We note that the two marginally resolved galaxies may not have their H i truncated within the optical disc (i.e. dHI/dopt ≥ 1.0) due to the synthesized-beam-induced bias in the inclination correction of the H i surface density (see Section 2.1.2). Although we do not find a similarly large population of severely truncated H i discs in Hydra I, we can still see H i disc truncation as galaxies move from the field, through the infall region and into the cluster from the dHI/dopt distributions and medians for the three populations (panel a of Fig. 7). We also find that high-mass (|$M_*\ge 10^9\, \rm {M}_{\odot }$|) cluster galaxies have smaller offsets from the gas fraction main sequence (|$\Delta \rm {GFMS}$|) than those in the infall or field. This indicates H i gas is being removed from cluster galaxies even though these galaxies are not yet gas-poor. The galaxies we observe with WALLABY are in an earlier stage of losing their H i gas reservoirs than the Virgo galaxies observed in the VIVA survey, which are gas-poor unlike the population we detect in Hydra I. The smaller dHI/dopt of infall and cluster galaxies is likely the result of a combination of environmental processes stripping gas from the H i discs (e.g. ram pressure and tidal stripping) and inflows, which would replenish gas, being cut off (e.g. starvation) as galaxies enter and traverse the cluster. While our data are not particularly sensitive to strong H i disc truncation, we are able to probe the early stages of gas removal as galaxies fall into the cluster. WALLABY is simply not sensitive to galaxies with severely truncated H i discs due to its sensitivity limit at the distance of Hydra I.
Using galaxies within <2.5R200 of Hydra I from the same WALLABY data, Wang et al. (2021) investigated ram pressure stripping of H i in Hydra I and classified the majority (|$\sim 75{{\ \rm per\ cent}}$|) of galaxies within R200 as candidates for experiencing ram pressure. Our analysis is in agreement with the results of Wang et al. (2021) and we conclude that ram pressure is contributing to the systematically smaller dHI/dopt of cluster galaxies compared to our field population. Our infall population also has systematically smaller dHI/dopt than the field. Wang et al. (2021) find that |$\lesssim 10{{\ \rm per\ cent}}$| of galaxies beyond R200 to be ram-pressure-stripped candidates. This does not exclude ram pressure as the cause for the smaller dHI/dopt of the infall population as our analysis probes small variations in the disc outskirts which are not included in the Wang et al. (2021) criteria for ram pressure stripping. Wang et al. (2021) find gas for which the ram pressure strength is greater than the galaxy’s gravitational potential can be stripped on short time-scales (i.e. ≲200 Myr). Hence, ram pressure may have already removed the gas that could be stripped, producing the smaller dHI/dopt for infall galaxies relative to the field.
Fig. 10 shows the PanSTARRS r-band and GALEX NUV images with overlaid ellipses indicating the r-band and NUV disc diameters (solid red and dashed blue, respectively) and the purple contour showing the H i surface density of |$1\, \rm {M}_{\odot }\, \rm {pc}^{-2}$| of the galaxy with the smallest dHI/dopt = 0.8: WALLABY J103702−273359 (hereafter referred to by its NGC number: NGC 3312). The projected distance of NGC 3312 from the centre of Hydra I is r < 0.1R200. For NGC 3312, ram pressure stripping is likely the dominant mechanism responsible for the truncated H i disc due to the coincident NUV emission and compressed H i column density contours on the left (eastern) side of the galaxy. This interpretation is in agreement with the results of Wang et al. (2021), who also find that NGC 3312 to be experiencing ram pressure stripping.
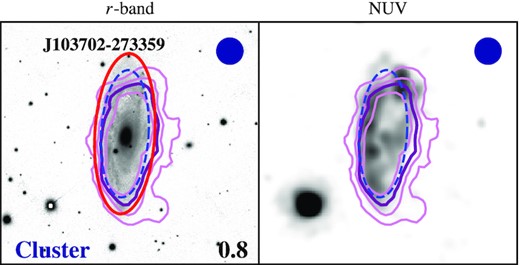
Similar to Fig. 9, showing the galaxy with the most truncated H i disc (dHI/dopt = 0.8) in our sample: WALLABY J103702−273359 (NGC 3312). The additional pink contours show H i column densities of 5, 20, and |$50\times 10^{19}\, \rm {cm}^{-2}$|. Wang et al. (2021) find this galaxy to be experiencing ram pressure stripping, which is supported by the observed H i morphology and NUV map (i.e. NUV emission coincident with the compression of H i column density contours on the left (eastern) side, right panel).
4.2 Star formation
The H i-detected galaxies across each of the cluster, infall, and field populations are predominantly star-forming. All three populations contain a small number of galaxies with SFRs more than 1σ = 0.3 dex below or above the star-forming main sequence, which shows the scatter of the star-forming main sequence is found in all environments. Similar variations of potentially enhanced and suppressed star formation in individual galaxies have been found in the Virgo cluster (e.g. Koopmann & Kenney 2004a). The majority of galaxies either currently undergoing quenching or already quenched in and around Hydra I are not detected in H i with WALLABY. The ATLAS3D H i survey detected four Virgo early-type galaxies in H i with H i masses of MHI ∼ 107–|$10^{8.75}\, \rm {M}_{\odot }$| and placed upper limits of |$M_{\rm {HI}}\lt 10^8\, \rm {M}_{\odot }$| on H i non-detections (Serra et al. 2012). Assuming this is representative of the H i in cluster early-type galaxies, it is unsurprising that we do not detect these galaxies in Hydra I, as these systems fall below the WALLABY detection limit at 61 Mpc. The fraction of cluster galaxies that are experiencing/have experienced quenching is higher than that of the infall population as expected. Cluster galaxies will have experienced environmental processes capable of stripping or depleting their gas content over longer time-scales, which in turn will lead to star formation quenching.
A small number of cluster and infall H i non-detections and all the field non-detections lie on the star-forming main sequence. Unlike the H i non-detections with large offsets from the main sequence, which likely have limited gas reservoirs, these galaxies will presumably still have significant quantities of H i and would be detected with deeper H i observations. Cortese et al. (2021) illustrate the decreasing sensitivity of blind H i surveys at increasing distance by determining which galaxies in the xGASS sample would be detected at different distances assuming the nominal WALLABY sensitivity (σ = 1.6 mJy beam−1). At distances ≳60 Mpc, the majority of the passive population from xGASS falls below the WALLABY detection limit, in agreement with our results. We also conclude that H i stacking will be required to look for H i in quenching galaxies (e.g. as done for the Coma Cluster, Healy et al. 2021a). The fact that we do not find a reduction in the galaxy-wide star formation of the infall or cluster populations, but do find smaller H i discs, leads us to conclude that gas is mainly being stripped from the galaxy outskirts and is not yet affecting the inner star-forming disc. We also find that cluster galaxies have lower |$\Delta \rm {GFMS}$| relative to the infall and field populations without a corresponding decrease in |$\Delta \rm {SFMS}$| (Figs 6 and 8). This indicates that there is a time delay between the removal of H i gas and star formation quenching.
Our conclusions are supported by Li et al. (2020), who find that cluster galaxies in the EAGLE simulation show H i gas loss while remaining on the star-forming main sequence, as H i is preferentially lost from the galaxy outskirts. This suggests that there is a time delay between H i gas removal and quenching. Oman & Hudson (2016) and Oman et al. (2021) also show this using N-body simulations. Other cosmological simulations that properly account for environmental effects have been demonstrated to produce galaxies that fit this description (e.g. Stevens & Brown 2017; Cora et al. 2018; Stevens et al. 2021) as well.
Focusing on the outskirts of our galaxy populations’ discs (i.e. beyond the optical disc), we find that recent star formation as traced by the NUV emission is truncated in cluster galaxies compared with field galaxies (panel g of Fig. 7). We also find that cluster galaxies have smaller H i to NUV disc size ratios, which explains the smaller discs of recent star formation, as these galaxies have smaller gas reservoirs in their outskirts. Truncation of the star-forming disc of cluster galaxies is also found in other clusters using different tracers (e.g. NUV, H α, and 24 |$\mu$|m) of recent star formation (e.g. Cortese et al. 2012; Fossati et al. 2013; Finn et al. 2018). The reduction in the size of the disc of recent star formation in cluster and infall galaxies supports our conclusion that H i is being stripped from the outskirts of these galaxies.
5 CONCLUSIONS
In this work, we take advantage of the wide-field capabilities of ASKAP using WALLABY pilot survey observations of the Hydra I cluster covering a 60-square-degree field of view. We probe the effect of the environment by comparing uniformly measured H i properties in populations of cluster, infall, and field galaxies out to ∼5R200 from the cluster centre. We find that the H i-detected fraction decreases from ∼0.85 (comparable to the field fraction of ∼0.9) to ∼0.35 at a projected distance of r ∼ 1.5R200, indicating that the environment begins strongly affecting the H i content of galaxies at projected distances r ≲ 1.5R200 from Hydra I.
Previous studies that compared the H i of cluster and field galaxies over a similarly large field of view were limited to integrated properties from single-dish surveys (e.g. Solanes et al. 2001). Using the high spatial resolution of WALLABY (30 arcsec), we measure the H i isodensity to optical isophotal 23.5 mag arcsec|$^{-2}$| r-band diameter ratio, dHI/dopt, for the three galaxy populations and find that the median dHI/dopt decreases from the field, through the infall regime, and further into the cluster. This indicates that environmental processes are stripping gas as galaxies enter the denser cluster environment and producing smaller H i discs. We do not find a population of severely truncated H i discs analogous to those found in the Virgo cluster (Chung et al. 2009; Yoon et al. 2017). At the distance of Hydra I (61 Mpc), WALLABY is not sensitive to galaxies with H i discs truncated to within the stellar disc with H i column densities ≲1020 cm−2. Galaxies with severely truncated H i discs probably have H i masses below the sensitivity of WALLABY (e.g. |$M_{\rm {HI}}\lt 10^{8.4}\, \rm {M}_{\odot }$| for unresolved sources or |$M_{\rm {HI}}\lt 10^{8.7}\, \rm {M}_{\odot }$| for a typical resolved source with a stellar mass of |$M_*\sim 10^9\, \rm {M}_{\odot }$|). Although our data are not sensitive to strong H i disc truncation, we can probe the first stages of gas removal and disc truncation.
We also investigate star formation in the three galaxy populations. We find that the distributions of H i-detected cluster, infall, and field galaxies are all centred on the star-forming main sequence. Cluster and infall galaxies that are undergoing quenching or are already quenched, which lie below the main sequence, are not detected in H i with WALLABY at a distance of 61 Mpc. Using the NUV emission to trace recent star formation, we find that there is less recent star formation occurring beyond the optical disc of galaxies in the cluster than in the field as a result of smaller gas reservoirs in the outer discs of cluster galaxies. We conclude that H i gas is primarily being stripped from the outskirts of infalling galaxies and not yet affecting the gas reservoir of their inner star-forming discs.
These results demonstrate the transformational power of WALLABY to provide statistically significant galaxy samples to probe resolved galaxy properties in a uniform manner over a wide range of environments. The full WALLABY survey will enable similar analyses to that presented here of environment densities ranging from low-density, isolated galaxies to intermediate groups and high-density clusters using |$\sim 500\, 000$| galaxies, of which |$\sim 5 000$| will be spatially resolved (Koribalski et al. 2020). The WALLABY reference simulation (Koribalski et al. 2020) predicts that, with (without) accounting for stripping, ∼500 (1500) spatially resolved galaxies detected with WALLABY reside in clusters |$\gt 6\times 10^{14}\, \rm {M}_{\odot }$| (e.g. Virgo like) and |$\sim 1 500$| (4500) reside in clusters |$\gt 3\times 10^{14}\, \rm {M}_{\odot }$| (e.g. Hydra I like). This will enable studies of resolved H i properties that were previously limited to integrated parameters from single-dish all-sky surveys (e.g. HIPASS). Further insights into the gas properties of galaxies not directly detected will be made possible through stacking of H i non-detections (e.g. to probe H i in gas-poor galaxies and galaxies below the star-forming main sequence).
SUPPORTING INFORMATION
suppl_data
Please note: Oxford University Press is not responsible for the content or functionality of any supporting materials supplied by the authors. Any queries (other than missing material) should be directed to the corresponding author for the article.
ACKNOWLEDGEMENTS
We thank F. Lelli, H. Courtois, D. Pomarede, A. Boselli, and F. Bigiel for helpful discussions and comments. We also thank the anonymous referee for their comments.
This research was conducted by the Australian Research Council Centre of Excellence for All Sky Astrophysics in 3 Dimensions (ASTRO 3D), through project number CE170100013.
The Australian SKA Pathfinder is part of the Australia Telescope National Facility which is managed by the Commonwealth Scientific and Industrial Research Organisation (CSIRO). Operation of ASKAP is funded by the Australian Government with support from the National Collaborative Research Infrastructure Strategy. ASKAP uses the resources of the Pawsey Supercomputing Centre. Establishment of ASKAP, the Murchison Radio-astronomy Observatory (MRO), and the Pawsey Supercomputing Centre are initiatives of the Australian Government, with support from the Government of Western Australia and the Science and Industry Endowment Fund. We acknowledge the Wajarri Yamatji as the traditional owners of the Observatory site. We also thank the MRO site staff. This paper includes archived data obtained through the CSIRO ASKAP Science Data Archive, CASDA (http://data.csiro.au).
LC acknowledges support from the Australian Research Council Discovery Project and Future Fellowship funding schemes (DP210100337, FT180100066).
DO is a recipient of an Australian Research Council Future Fellowship (FT190100083) funded by the Australian Government.
JR acknowledges support from the State Research Agency (AEI-MCINN) of the Spanish Ministry of Science and Innovation under the grant ‘The structure and evolution of galaxies and their central regions’ with reference PID2019-105602GB-I00/10.13039/501100011033.
LVM acknowledges financial support from the State Agency for Research of the Spanish Ministry of Science, Innovation and Universities through the ‘Center of Excellence Severo Ochoa’ awarded to the Instituto de Astrofísica de Andalucía (SEV-2017-0709), from the grant RTI2018-096228-B-C31 (Ministry of Science, Innovation and Universities/State Agency for Research/European Regional Development Funds, European Union), from the grant RED2018-102587-T (Spanish Ministry of Science, Innovation and Universities/State Agency for Research), and grant IAA4SKA (Ref. P18-RT-3082) from the Consejeria de Transformacion Economica, Industria, Conocimiento y Universidades de la Junta de Andalucia and the European Regional Development Fund from the European Union.
AB acknowledges support from the Centre National d’Etudes Spatiales (CNES), France.
ARHS acknowledges receipt of the Jim Buckee Fellowship at ICRAR-UWA.
SHO acknowledges support from the National Research Foundation of Korea (NRF) grant funded by the Korea government (Ministry of Science and ICT: MSIT) (No. NRF-2020R1A2C1008706).
This project has received funding from the European Research Council (ERC) under the European Union’s Horizon 2020 research and innovation programme (grant agreement no. 679627; project name FORNAX).
This research has made use of the NASA/IPAC Extragalactic Database (NED) which is operated by the Jet Propulsion Laboratory, California Institute of Technology, under contract with the National Aeronautics and Space Administration.
The Pan-STARRS1 Surveys (PS1) and the PS1 public science archive have been made possible through contributions by the Institute for Astronomy, the University of Hawaii, the Pan-STARRS Project Office, the Max-Planck Society and its participating institutes, the Max Planck Institute for Astronomy, Heidelberg and the Max Planck Institute for Extraterrestrial Physics, Garching, The Johns Hopkins University, Durham University, the University of Edinburgh, the Queen’s University Belfast, the Harvard-Smithsonian Center for Astrophysics, the Las Cumbres Observatory Global Telescope Network Incorporated, the National Central University of Taiwan, the Space Telescope Science Institute, the National Aeronautics and Space Administration under Grant No. NNX08AR22G issued through the Planetary Science Division of the NASA Science Mission Directorate, the National Science Foundation Grant No. AST-1238877, the University of Maryland, Eotvos Lorand University (ELTE), the Los Alamos National Laboratory, and the Gordon and Betty Moore Foundation.
This publication makes use of data products from the Wide-field Infrared Survey Explorer (WISE), which is a joint project of the University of California, Los Angeles, and the Jet Propulsion Laboratory/California Institute of Technology, funded by the National Aeronautics and Space Administration.
This work is based in part on observations made with the Galaxy Evolution Explorer (GALEX). GALEX is a NASA Small Explorer, whose mission was developed in cooperation with the Centre National d’Etudes Spatiales (CNES) of France and the Korean Ministry of Science and Technology. GALEX is operated for NASA by the California Institute of Technology under NASA contract NAS5-98034.
DATA AVAILABILITY
The derived galaxy properties used in this work are available as supplementary material. We show the first five rows of the tables for the H i detections and non-detections in Appendix A. The full 36-beam, 30-square-degree H i spectral line cubes (SBIDs 10269, 10609, 10612, and 10626), which are combined to create the full sensitivity 60-square-degree field, are available from the CSIRO ASKAP Science Data Archive (CASDA, Chapman 2015; Huynh et al. 2020) using the DOI https://doi.org/10.25919/5f7bde37c20b5. PanSTARRS (Chambers et al. 2016; Flewelling et al. 2020) g- and r-band imaging is available through the PanSTARRS cut-out server https://ps1images.stsci.edu/cgi-bin/ps1cutouts. GALEX DR6+7 (Bianchi et al. 2017) NUV band imaging is available from http://galex.stsci.edu/data. unWISE band imaging data are available for W1 from http://unwise.me/data/neo6/unwise-coadds/fulldepth and for W3 and W4 from http://unwise.me/data/allwise/unwise-coadds/fulldepth (Lang 2014; Meisner et al. 2017).
Footnotes
ASKAP Update, November 2020 https://www.atnf.csiro.au/projects/askap/ASKAP_com_update_v44.pdf
Arecibo Legacy Fast ALFA Survey (Giovanelli et al. 2005)
We note that optical diameters are often defined at the B-band 25 mag arcsec−2 surface brightness. However, we define the radius at a surface brightness of 23.5 mag arcsec−2 to ensure that we are well above the noise level of the images. Comparing with the 25 mag arcsec|$^{-2}\, B$|-band diameters given in the 1989 ESO-Uppsala Catalogue (Lauberts & Valentijn 1989, 2006), our measured optical diameters are on average 20–30 per cent smaller.
REFERENCES
APPENDIX A: DATA TABLES
We show the first five rows of the online supplementary data tables containing the parameters used in this work for the galaxies detected and not detected in H i in Tables A1 and A2, respectively.
Measured and derived properties for galaxies detected in H i with WALLABY. The full table is available as supplementary material.
| WALLABY ID | Environment | DL | |$\frac{r}{R_{200}}$| | |$\frac{\Delta v}{\sigma _{\rm {disp}}}$| | |$\log \left(\frac{M_*}{\rm {M}_{\odot }}\right)$| | |$\log \left(\frac{M_{\rm {HI}}}{\rm {M}_{\odot }}\right)$| | dHI | dopt | dNUV | |$\log \left(\frac{\rm {SFR}}{\rm {M}_{\odot }\, \rm {yr}^{-1}}\right)$| |
|---|---|---|---|---|---|---|---|---|---|---|
| [Mpc] | [arcsec] | [arcsec] | [arcsec] | |||||||
| J100336−262923 | field | 13.3 | 5.3 | 4.3 | 6.4 | 8.0 | 98 | 10 | 8 | – |
| J100342−270137 | field | 14.2 | 5.2 | 4.2 | 8.5 | 9.4 | 425 | 88 | 164 | −0.87 |
| J100351−263707 | field | 12.9 | 5.3 | 4.3 | 7.2 | 8.6 | 151 | 28 | 44 | −1.69 |
| J100351−273417 | field | 41.5 | 5.2 | 1.5 | 10.4 | 9.9 | 148 | 126 | 111 | 0.25 |
| J100426−282638 | field | 16.0 | 5.1 | 4.0 | 9.0 | 9.4 | 332 | 150 | 162 | −0.75 |
Measured and derived properties for galaxies in the 6dFGS catalogue that are not detected in H i with WALLABY. The full table is available as supplementary material.
| 6dFGS ID | Environment | DL | |$\frac{r}{R_{200}}$| | |$\frac{\Delta v}{\sigma _{\rm {disp}}}$| | |$\log \left(\frac{M_*}{\rm {M}_{\odot }}\right)$| | |$\log \left(\frac{M_{\rm {HI}}}{\rm {M}_{\odot }}\right)$| | dH i | dopt | dNUV | |$\log \left(\frac{\rm {SFR}}{\rm {M}_{\odot }\, \rm {yr}^{-1}}\right)$| |
|---|---|---|---|---|---|---|---|---|---|---|
| [Mpc] | [arcsec] | [arcsec] | [arcsec] | |||||||
| g1006222−264958 | field | 68.3 | 4.8 | 1.2 | 8.9 | <8.7 | <13 | 19 | 14 | −0.38 |
| g1010470−285406 | field | 63.1 | 4.2 | 0.7 | 10.2 | <8.9 | <16 | 51 | – | – |
| g1019338−264156 | field | 36.0 | 2.8 | 2.0 | 10.6 | <8.4 | <9 | 150 | 72 | – |
| g1023024−260448 | infall | 54.1 | 2.4 | 0.2 | 9.4 | <8.6 | <11 | 23 | 30 | −0.20 |
| g1025185−295118 | infall | 59.6 | 2.4 | 0.3 | 8.8 | <8.6 | <11 | 22 | 18 | −1.01 |
