


ABSTRACT
The physics of Cosmic ray (CR) transport remains a key uncertainty in assessing whether CRs can produce galaxy-scale outflows consistent with observations. In this paper, we elucidate the physics of CR-driven galactic winds for CR transport dominated by diffusion. A companion paper considers CR streaming. We use analytic estimates validated by time-dependent spherically symmetric simulations to derive expressions for the mass-loss rate, momentum flux, and speed of CR-driven galactic winds, suitable for cosmological-scale or semi-analytic models of galaxy formation. For CR diffusion coefficients κ ≳ r0ci, where r0 is the base radius of the wind and ci is the isothermal gas sound speed, the asymptotic wind energy flux is comparable to that supplied to CRs, and the outflow rapidly accelerates to supersonic speeds. By contrast, for κ ≲ r0ci, CR-driven winds accelerate more slowly and lose most of their energy to gravity, a CR analogue of photon-tired stellar winds. Given CR diffusion coefficients estimated using Fermi gamma-ray observations of pion decay, we predict mass-loss rates in CR-driven galactic winds of the order of the star formation rate for dwarf and disc galaxies. The dwarf galaxy mass-loss rates are small compared to the mass-loadings needed to reconcile the stellar and dark matter halo mass functions. For nuclear starbursts (e.g. M82, Arp 220), CR diffusion and pion losses suppress the CR pressure in the galaxy and the strength of CR-driven winds. We discuss the implications of our results for interpreting observations of galactic winds and for the role of CRs in galaxy formation.
1 INTRODUCTION
Galactic winds play a key role in galaxy evolution, shaping the galaxy stellar mass function, the mass–metallicity relation, and affecting the morphology of galaxies over cosmic time (e.g. Somerville & Davé 2015). Despite their importance, many puzzles persist. These include the acceleration mechanism for the cool atomic and molecular gas seen in emission and absorption from rapidly star-forming galaxies across the Universe (e.g. Veilleux et al. 2020), the very large mass fluxes and low star formation efficiencies inferred for dwarf galaxies, and the apparent need for massive outflows from normal star-forming galaxies in the local Universe in order to match some models of Galactic chemical evolution (e.g. Andrews et al. 2017).
Among the physical mechanisms suggested for driving large amounts of cool gas from star-forming galaxies, cosmic rays (CRs) are of particular interest because their pressure is dynamically important with respect to gravity in the Milky Way disc (Boulares & Cox 1990). In this picture, CRs are injected into the disc of the galaxy by supernovae and stellar processes, and scatter off of magnetic fluctuations in the ISM, slowly diffusing (or streaming) away from the disc. This process sets up a pressure gradient that can in principle accelerate gas away from the host galaxy.
Many treatments of CR-driven winds exist in the literature, starting with the foundational work of Ipavich (1975) who computed time-steady solutions for CR-driven winds assuming streaming transport at the Alfvén velocity. More detailed models including CR streaming and hydromagnetic wave pressure were computed by Breitschwerdt, McKenzie & Voelk (1991), deriving a mass-loss rate of the order of M⊙ yr−1 from the Galaxy. Everett et al. (2008) further developed a hybrid thermal and CR-driven wind model for the Galaxy while Recchia, Blasi & Morlino (2016) solved for the Milky Way’s CR spectrum and wind dynamics self-consistently using the CR kinetic equations. More generally, on the basis of momentum conservation, Socrates, Davis & Ramirez-Ruiz (2008) argued that CRs could drive significant mass fluxes from star-forming galaxies.
In parallel to these more analytic and steady-state treatments, there is a large and growing body of work on multidimensional simulations of galaxy formation with CRs, which suggest that they can play a number of important roles: e.g. driving cold-gas outflows from galaxies (e.g. Booth et al. 2013), modifying the thermal and ionization state of the CGM (e.g. Ji et al. 2020), and heating gas in galaxy groups and clusters, suppressing cooling flows (e.g. Ruszkowski, Yang & Zweibel 2017). These numerical models vary in their treatment of CR transport, including isotropic diffusion (e.g, Uhlig et al. 2012; Simpson et al. 2016), anisotropic diffusion along magnetic fields (e.g. Pakmor et al. 2016; Chan et al. 2019; Hopkins et al. 2020), and/or CR streaming along magnetic fields (e.g. Ruszkowski et al. 2017; Chan et al. 2019; Hopkins et al. 2020).
As suggested by the diversity of approaches in the literature, one of the significant uncertainties in modelling the properties of CRs in galaxy formation is that the physical mechanism(s) coupling CRs to the thermal plasma are not fully understood (e.g. Amato & Blasi 2018). Small-scale fluctuations in the magnetic field scatter CRs, setting their mean free path. On scales larger than this mean free path, the CRs can be approximated as a fluid (Skilling 1971). However, it is not clear whether the fluctuations that scatter CRs are self-excited by the CRs themselves (e.g. the streaming instability; Kulsrud & Pearce 1969) or produced by background turbulent fluctuations in the interstellar/circumgalactic-medium (ISM/CGM) cascading to small-scales where they couple to the CRs (e.g. Yan & Lazarian 2002). Nor is it clear whether the dominant scattering mechanism depends on the thermodynamic phase of the ISM/CGM, the local magnetic field strength, or other physical properties. The distinction between self-excited versus background turbulence as the source of scattering that sets the CR mean free path is at the core of the streaming/diffusion dichotomy that dominates CR transport modelling.
Wiener, Pfrommer & Oh (2017) explored the difference between galactic winds driven with CR diffusion and CR streaming in simulations, finding that diffusive CR transport results in much larger overall mass-loss rates than in CR streaming models. Chan et al. (2019) and Hopkins et al. (2020) found similar results and further argued that models with CR transport dominated by diffusion were required for CRs to efficiently escape Milky way, M31, and Magellanic Cloud-like galaxies, as is required by gamma-ray observations of pion decay produced by CRs interacting with the ISM (Abdo et al. 2010a, b; Ackermann et al. 2012). These results highlight that a better understanding of CR microphysics is critical for understanding the role of CRs in galaxy formation.
Together with the numerical and analytic treatments of CR-driven winds in the literature, there is also a body of phenomenological work interpreting the non-thermal radio and gamma-ray emission from star-forming galaxies. This directly informs our understanding of the underlying CR population and their role in driving galactic winds. The far-infrared-radio correlation and the gamma-ray emission from star-forming galaxies, including those with strong winds like M82, NGC 253, and Arp 220 can be used to constrain the average CR injection rate per unit star formation, the gas density seen by CRs as they propagate, the magnetic field strength, and the CR escape time-scale (e.g. Pavlidou & Fields 2001; Torres 2004; Lacki, Thompson & Quataert 2010; Lacki & Thompson 2013; Yoast-Hull et al. 2013, 2014; Buckman, Linden & Thompson 2020; Crocker, Krumholz & Thompson, 2021). These works thus provide benchmarks for understanding how the inner or ‘base’ boundary conditions for a putative CR-driven wind vary as a function of galaxy properties.
This paper is the first in a series that aims to elucidate the physics of galactic winds driven by CRs using a combination of analytic calculations and idealized numerical simulations. In this paper, we focus on the case of CR diffusion. A companion paper discusses the case of CR streaming, which turns out to be much physically richer than the diffusion limit considered here. In Section 2, we present analytic estimates of the mass-loss rate and terminal velocity of galactic winds driven by CRs in the diffusion approximation. In Section 3, we validate these estimates with time-dependent numerical simulations, which further show that the winds reach a laminar steady state. Section 4 calibrates CR diffusion coefficients and CR pressures in galaxies using Fermi gamma-ray observations of pion decay, and calculates the resulting implications for CR-driven galactic winds. We summarize and discuss the implications of our results in Section 5. Appendix A presents a linear stability analysis and shows that although sound waves are formally unstable in CR-driven winds with diffusion (Drury & Falle 1986), the growth rates are too slow for the instability to be dynamically important in almost all cases (the exception is extremely low gas sound speeds). We also derive the linear WKB dispersion relation for the two-moment cosmic ray transport model simulated in Section 3 and show that entropy and sound waves are linearly stable in the WKB limit for CR transport by diffusion in the two-moment CR transport model.
2 ANALYTIC APPROXIMATIONS FOR COSMIC RAY-DRIVEN WINDS WITH DIFFUSION
In this section, we focus on analytic approximations to the spherical steady state galactic wind problem in the presence of cosmic rays. Following these analytical approximations, in Section 3 we treat the more complete numerical problem and solve the time-dependent spherically symmetric CR-driven wind problem using the numerical scheme of Jiang & Oh (2018). We show that the analytic approximations in this section do an excellent job of reproducing the more complete numerical results.
Throughout this paper, we focus exclusively on the case of CR diffusion, which corresponds to vs = 0 in equation (3). In a companion paper, we consider the case of CR streaming. We further assume a hydrodynamic model which drops the field-aligned diffusive flux in equation (3) in favour of an effective isotropic diffusion equation with a spatially constant diffusion coefficient κ. We also consider a simple model for the gravity of a galaxy and its host dark matter potential: an isothermal sphere for which |$\Phi = 2 V_g^2 \ln r$|, where |$\sqrt{2} V_g$| is the circular velocity of the potential. Finally, we simplify the thermodynamics of the gas by using an isothermal equation of state with sound speed ci, as would be appropriate for a warm gas in ionization equilibrium, or which might approximate the effects of turbulence in the atmosphere of the host galaxy. In addition, we consider a single phase flow and do not consider possible variation of CR transport with, e.g. the ionization state of the gas.
The two power laws in equation (14), namely ρ ∼ r−ξ and ρ ∼ r−1, correspond to the gas pressure and CR pressure dominated phases of the solution, respectively. The transition between the two happens at a radius |$r_{tr} \simeq r_0 \, A^{-1/(\xi -1)}$|. The CR-dominated hydrostatic ρ∝pc, 0/r solution in equation (14) was derived by Ji et al. (2020) for the CGM in their cosmological zoom-in simulations with CRs. Hopkins et al. (2021a) further used this solution to estimate the properties outflows on CGM scales driven by CRs. The key difference between the solutions here and their estimates is that we self-consistently match our CR-dominated solution on to the gas-pressure-dominated solution near the galaxy in order to calculate the properties of galaxy-scale winds. We do not include a CGM at larger radii in our calculations.
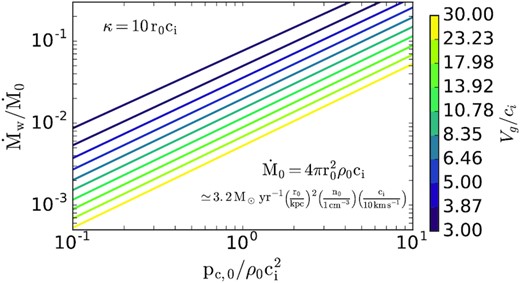
Analytic mass-loss rates for CR-driven galactic winds in the limit of rapid diffusion (equation (28) with hc from equation 27), as a function of the strength of gravity relative to the gas sound speed in the disc (Vg/ci) and the base CR pressure (|${\rm p_{c,0}/\rho _0 c_i^2}$|). The mass-loss rates are normalized by equation (29). Labelled values of Vg/ci on the colour bar are logarithmically distributed and correspond to the curves on the plot.
2.1 Wind energetics, momentum flux, and velocity
2.2 Maximum mass-loss rate
Equations (31), (39), and (42) highlight the importance of the value of the diffusion coefficient for assessing the implications of our results for CR-driven galactic winds. The maximum mass-loss rate a given CR energy flux can sustain is significantly larger than the galaxies’ star formation rate (equation 39). However, this is only realizable for relatively small diffusion coefficients, κ ≲ r0ci. If, on the other hand, κ ≫ r0ci, |$\dot{M}_w/\dot{M}_* \lesssim 1$| (equation 31) and thus less dynamically important. In Section 4, we estimate the diffusion coefficient in star-forming galaxies using gamma-ray constraints on pion losses.
3 NUMERICAL SIMULATIONS
3.1 Equations
We solve the time-dependent cosmic ray hydrodynamic equations based on the two moment approach as developed by Jiang & Oh (2018) in 1D spherical polar coordinates.4 This algorithm has been implemented in the magnetohydrodynamic code ATHENA++ (Stone et al. 2020). As in Section 2, we use an isothermal equation of state for the gas with isothermal sound speed ci and take the gravitational potential to be |$\Phi =2V_g^2\ln r$|.
Substituting the right-hand-side of the fourth of equations (43) into the 3rd term on the right-hand-side of the 2nd of equations (43) produces the usual ∂pc/∂r cosmic ray pressure gradient in the momentum equation, along with another term related to the time variation of the CR flux. Likewise, the term on the right-hand-side of the 3rd of equations (43) becomes the usual v∂pc/∂r term related to CR pdV work, again with another term related to the time variation of the CR flux. The steady state versions of equations (43) are thus equivalent to the steady state equations (4)–(6) solved in Section 2.
3.2 Initial and boundary conditions
For the bottom boundary condition at r0, the cosmic ray energy density Ec and gas density ρ are fixed to be the initial values. The flow velocity in the ghost zones is set such that mass flux ρvr2 is continuous from the last active zone to the ghost zones. We keep the gradient of the cosmic ray flux continuous across the bottom boundary. For the boundary condition at the top of the simulation domain, we keep the gradient of ρ, Ec, and Fc continuous across the boundary. The flow velocity at the top boundary is set by requiring the mass flux ρvr2 to be continuous.
3.3 Overview of simulations
Table 1 summarizes our suite of simulations. The key physical parameters of each simulation are Vg/ci and |$p_{c,0}/\rho _0 c_i^2$|, as in the analytics of Section 2, as well as the diffusion coefficient κ (in units of r0ci). The key numerical parameters are the resolution, reduced speed of light, and box size.
Parameters and properties of our numerical simulations. Numerical resolution is δr/r = 5.25 × 10⁻⁴ unless otherwise noted. Columns are diffusion coefficient κ, velocity Vg of the isothermal gravitational potential, base CR pressure pc, 0, outer radius of domain rout, reduced speed of light Vm, simulation mass-loss rate |$\dot{M}_{\rm sim}$| in units of |$\dot{M}_0$| (equation 29), simulation mass-loss rate in units of |$\dot{M}_{\rm max}$| (the maximum mass-loss rate allowed by energy conservation; equation 47), the dimensionless base CR scale-height hc (equation 10), and the kinetic energy and CR enthalpy fluxes at the top of the domain relative to the diffusive CR flux at the base |$(\dot{E}_k(r_{\rm out}) + \dot{E}_{c,\rm adv}(r_{\rm out}))/\dot{E}_c(r_0)$|. When the latter is ≃1, most of the CR energy flux at the base of the wind goes into kinetic energy at large radii, while when it is ≲1, most of the CR energy goes into work against gravity, and |$\dot{M}_w \simeq \dot{M}_{\rm max}$| (equations 40 and 47).
| κ | Vg | pc, 0 | rout | Vm | |$\dot{M}_{\rm sim}$| | |$\dot{M}_{\rm sim}$| | v(rout) | hc | |$\dot{E}_k(r_{\rm out}) + \dot{E}_{c,\rm adv}(r_{\rm out})$| |
|---|---|---|---|---|---|---|---|---|---|
| (r0ci) | (ci) | (|$\rho _0 c_i^2$|) | (r0) | (ci) | (|$\dot{M}_0$|) | (|$\dot{M}_{\rm max}$|) | (Vg) | – | |$(\dot{E}_c[r_0])$| |
| 20a | 200 | 400 | 7.6 | 60 000 | 0.21 | 0.032 | 13.8 | 0.023 | 0.95 |
| 10b | 100 | 100 | 7.6 | 30 000 | 0.16 | 0.067 | 9.5 | 0.03 | 0.94 |
| 3.3c | 33 | 11 | 7.6 | 10 000 | 0.09 | 0.19 | 5 | 0.053 | 0.8 |
| 30 | 10 | 1 | 5 | 3000 | 0.016 | 0.018 | 13.6 | 0.32 | 0.93 |
| 10 | 10 | 1 | 5 | 3000 | 0.022 | 0.054 | 8.2 | 0.23 | 0.93 |
| 3.3 | 10 | 1 | 5 | 3000 | 0.03 | 0.15 | 4.6 | 0.16 | 0.83 |
| 2 | 10 | 1 | 5 | 3000 | 0.03 | 0.42 | 3.3 | 0.13 | 0.57 |
| 1 | 10 | 1 | 15 | 3000 | 0.03 | 0.75 | 0.5 | 0.14 | 0.23 |
| 0.33 | 10 | 1 | 15 | 3000 | 0.007 | 0.78 | 0.4 | 0.21 | 0.16 |
| 0.11 | 10 | 1 | 25 | 3000 | 0.0019 | 0.85 | 0.43 | 0.23 | 0.08 |
| 10 | 10 | 0.3 | 5 | 3000 | 0.007 | 0.058 | 8.2 | 0.23 | 0.99 |
| 10 | 10 | 0.1 | 5 | 3000 | 0.0027 | 0.056 | 8.1 | 0.24 | 0.95 |
| 10 | 10 | 3 | 15 | 3000 | 0.065 | 0.089 | 9.4 | 0.23 | 0.9 |
| 10 | 6 | 1 | 5 | 3000 | 0.043 | 0.055 | 7.5 | 0.33 | 0.89 |
| 3.3 | 6 | 1 | 15 | 3000 | 0.055 | 0.26 | 4.9 | 0.24 | 0.67 |
| 10 | 3 | 1 | 15 | 3000 | 0.136 | 0.11 | 7.6 | 0.5 | 0.9 |
| 3.3 | 3 | 1 | 15 | 3000 | 0.156 | 0.3 | 4.2 | 0.4 | 0.74 |
Notes. aδr/r = 8.25 × 10⁻⁶ for 1 ≤ r ≤ 1.14; ci is 1/20 of κ = 1, Vg = 10 sim
bδr/r = 2.5 × 10⁻⁵ for 1 ≤ r ≤ 1.11; ci is 1/10 of κ = 1, Vg = 10 sim
cδr/r = 6.6 × 10⁻⁵ for 1 ≤ r ≤ 1.11; ci is 1/3 of κ = 1, Vg = 10 sim
The units for the results of our numerical simulations are summarized in Table 2: gas density is in units of the base density ρ0, speeds are in units of the gas isothermal sound speed ci, CR pressure is in units of the base CR pressure pc, 0, and CR fluxes are in units of pc, 0ci.
Summary of units for numerical simulations. ci is the gas isothermal sound speed (assumed to be a constant), ρ0 is the gas density at the base of the wind (at radius r = r0), and pc, 0 is the base CR pressure.
| Quantity | Symbol | Units |
|---|---|---|
| Radial velocity | v | ci |
| ‘Isothermal’ CR sound speed | |$c_c \equiv \left(\frac{p_c}{\rho }\right)^{1/2}$| | ci |
| Gravitational velocity | Vg | ci |
| Density | ρ | ρ0 |
| CR pressure | pc | pc, 0 |
| CR flux | Fc | cipc, 0 |
| CR diffusion coefficient | κ | cir0 |
Nearly all of our numerical solutions reach a steady state that does not evolve significantly in time once we run for a few box crossing times. Because the solutions reach a steady state, they are independent of the reduced speed of light Vm, which only enters into the time-dependent terms in equations (43).
Drury & Falle (1986) showed that rapid CR diffusion drives sound waves unstable in the presence of a background CR pressure gradient, so it is not a priori obvious that our wind solutions should reach a steady state. We show in Appendix A that the growth rate of this instability is too slow to grow significantly in galactic winds, unless the gas sound speed is extremely small (the Vg = 200 simulation, which is our lowest ci simulation, is the only one to show significant time dependence; see Fig. A1). We also derive the linear WKB dispersion relation for sound waves and entropy modes in the two-moment CR system of equations, and show that the linear modes are stable, consistent with the simulations.
3.4 Numerical solutions for κ ≳ r0ci
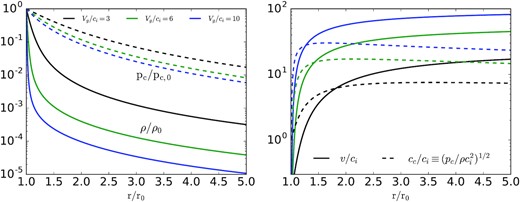
Fig. 2 shows the resulting density, CR pressure, fluid velocity, and CR sound speed profiles for Vg/ci = 10, varying κ from 0.33 to 30 (in units of r0ci; Table 2). The vertical dotted line in Fig 2 (as well as Figs 3 and 4 below) is the critical point predicted in equation (21), namely rs ≃ 1.047r0.
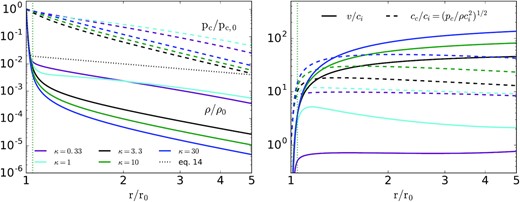
Left-hand panel: CR pressure and gas density as a function of radius for Vg = 10 and several diffusion coefficients (in units of r0ci; see Table 2). The dotted profile is the analytic hydrostatic solution in equation (14) for hc = 1/4. The analytic density profile is reasonable interior to the sonic point (and thus for estimating |$\dot{M}$|) but not at larger radii for the higher κ solutions. Right-hand panel: Flow velocity and CR sound speed for the same solutions, in units of gas sound speed ci. The vertical green dotted line in both panels is the analytic estimate of the location of the critical point (equation 21). For the κ = 3 − 30 solutions, the flow accelerates very rapidly and the velocity exceeds the escape velocity just exterior to the base of the wind. For κ = 1 the flow is significantly slower, and the density profile is closer to hydrostatic. For κ = 0.33 the velocities are subsonic and well below the escape speed at all radii shown here. We return to the κ = 0.33 solution in Fig. 6 and show that it does drive a wind but one whose properties are very different from the high κ simulations.
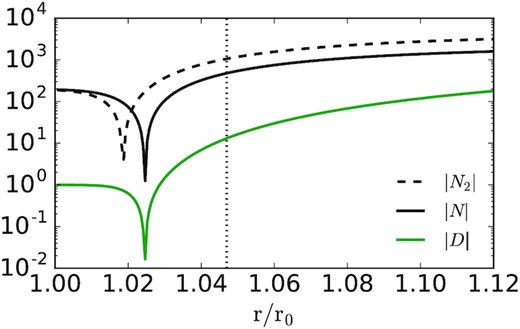
Numerator and denominator (equations 45) of the steady state wind equation evaluated for our κ = 10, Vg = 10 simulation. N2 is the approximation to the numerator of the wind equation used in our analytics (equation 46). The vertical dotted line is the analytic estimate of the location of the critical point (equation 21). The numerical simulation reaches a steady state that passes through a critical point close to that predicted by our (approximate) analytics.
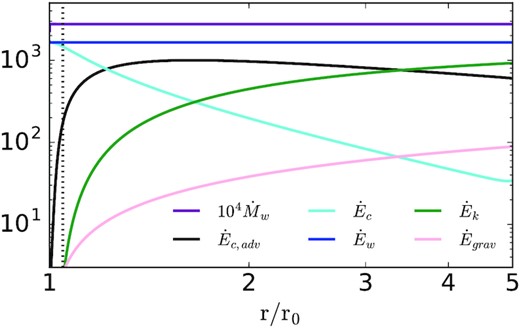
Energetics of the wind evaluated for our κ = 10, Vg = 10 simulation. The total energy flux (|$\dot{E}_w$|; see equation 34) and mass flux (|$\dot{M}_w$|) are independent of radius. At the base of the wind, nearly all of the energy is carried by the diffusing CRs (|$\dot{E}_c$|). Advection of CR enthalpy by the motion of the gas (|$\dot{E}_{c,\rm adv}$|) is important at intermediate radii while at large radii most of the energy is in the kinetic energy of the outflowing gas (|$\dot{E}_{k}$|). For the logarithmic potential used in our simulations, we define |$\dot{E}_{\rm grav}$| using |$\Phi =2 V_g^2 \ln (r/r_0)$| so that |$\dot{E}_{\rm grav} \gt 0$|.
The left-hand panel of Fig. 2 shows that for all of the solutions, the CR pressure falls off much more slowly than the density near the base. This is because the gas density scale-height is initially quite small, ∼r0(ci/Vg)2 ∼ 10−2r0 while the CR pressure scale-height is significantly larger due to CR diffusion ∼hcr0 ∼ 0.25r0 (equation 27). For all of the solutions, the hydrostatic equilibrium approximation for the density profile (equation 14) is reasonable at very small radii. There is, however, a bifurcation in the density profiles as a function of κ. The solutions with κ = 0.33 and 1 are closer to hydrostatic over the entire radial range while for κ ≳ 1 the density falls off much more rapidly at large radii. The right-hand panel of Fig. 2 shows that this bifurcation in density profiles corresponds to a bifurcation in velocity profiles. The solutions with κ ≳ 3 drive strong winds that accelerate to a velocity larger than the escape speed by r ∼ 1.2r0. By contrast, for κ = 1 the velocities are much lower and for κ = 0.33 the solution is subsonic for all of the radii shown in Fig. 2. We return to the lowest κ simulation in Section 3.5 and show that it does produce a wind, but one whose character is very different from the higher κ simulations focused on here.
Fig. 4 quantifies the radial profiles of the mass-loss rate |$\dot{M}$| and various contributions to the wind energy flux in the numerical solution for κ = 10. The mass-loss rate |$\dot{M}$| is independent of radius as expected for a steady state solution. The contributions to the energy flux shown in Fig. 4 are defined in and below equation (34) (we do not show the gas enthalpy/advective flux, which is negligible). We note that for the logarithmic potential used here, we define |$\Phi =2 V_g^2 \ln (r/r_0)$|. The zero-point of the potential is thus at the base of the wind (r = r0), rather than at infinity, as is more common; the latter is not possible given the divergence of the logarithmic potential as r → ∞. As a result of this choice of zero-point, |$\dot{E}_{\rm grav} \gt 0$|.
Fig. 4 shows that interior to the critical point, the energy flux is dominated by CR diffusion, as assumed in the analytic calculation in Section 2. At intermediate radii the CR advective flux dominates the energy transport while eventually at large radii, when the CR pressure has accelerated the gas to well above the CR sound speed and escape speeds, the gas kinetic energy flux dominates. Note that the gravitational contribution to the energy flux is small at all radii, consistent with |$\dot{M}_w \ll \dot{M}_{\rm max}$| and v > Vg. The qualitative features of Fig. 4 are the same for κ = 3−30. For κ = 1, however, most of the energy at the outer edge of the domain is in CR enthalpy rather than gas kinetic energy.6 For κ = 0.33, the energetics of the flow is yet more different from that in Fig. 4, as we discuss in Section 3.5.
Fig. 5 shows how the κ = 10 solutions depend on the depth of the gravitational potential Vg (in units of the isothermal sound speed ci). The solutions are qualitatively very similar. The primary difference is that weaker gravity (lower Vg) implies a larger density scale-height at the base of the wind. Correspondingly, the wind accelerates significantly more slowly.
Dependence of density and pressure profiles (left-hand panel) and velocity and CR sound speed profiles (right-hand panel) on the depth of the gravitational potential Vg (in units of ci, the isothermal gas sound speed). All solutions are for κ = 10 and equal gas and CR pressures at the base of the wind (|$p_{c,0}=\rho _0 c_i^2$|). The CR pressure profiles are relatively independent of the gravitational potential, being largely set by rapid CR diffusion. By contrast, the density falls off more gradually, and the flow accelerates more gradually, for weaker gravity.
3.5 Low κ ≲ r0ci solutions
The analytic derivations in Section 2 primarily assumed κ ≳ r0ci. Our numerical simulations with κ ≳ r0ci are consistent with the properties of these analytic solutions, as we discuss further in the next section. Here we present numerical wind models with κ ≲ r0ci, which differ dramatically from their high κ counterparts. We stress that the higher κ solutions are likely the most astrophysically relevant, given estimates of diffusion coefficients from MW CR data (Section 2) and gamma-ray data from pion decay (Section 4).
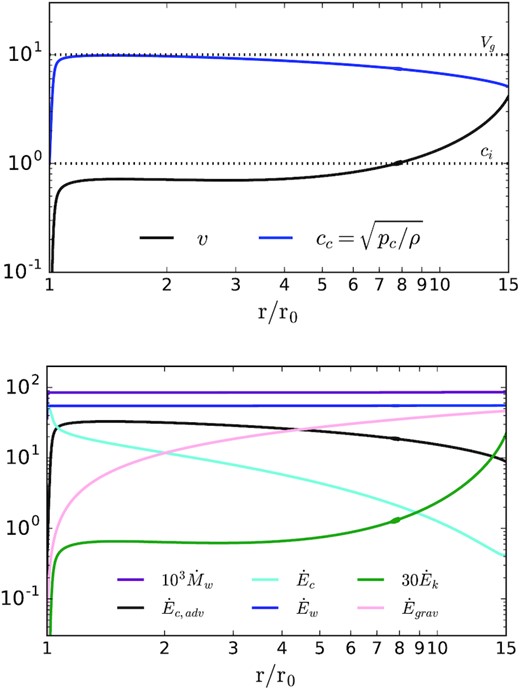
Kinematics (top) and energetics (bottom) of the wind for our κ = 0.33, Vg = 10 simulation, which differs dramatically from the higher κ simulations. The flow accelerates very gradually, reaching the sonic point (v/ci = 1) only at r ∼ 8r0, compared to r ≃ 1.02r0 for high κ solutions. The flow velocity is also significantly lower (≲ Vg) than for the high κ solutions (Fig. 2). At the base of the wind, nearly all of the energy is carried by the diffusing CRs (|$\dot{E}_c$|). However, almost all of this energy is used to overcome the gravitational potential, leading to |$\dot{E}_{\rm grav} \simeq \dot{E}_w$| at large radii (note that |$\dot{E}_{\rm grav} \gt 0$| for our logarithmic potential with |$\Phi = 2 V_g^2 \ln (r/r_0)$|). This corresponds to |$\dot{M}_w \simeq \dot{M}_{\rm max}$| (equation 40) and is a CR analogue of photon-tired winds in stellar wind theory (Owocki & Gayley 1997). For larger κ the energy lost to gravity is negligible and nearly all of the CR energy at the base goes into CR enthalpy and kinetic energy at larger radii (see Fig. 4).
The importance of gravity for the low κ solution in Fig. 6 implies that some of the details of the solution – though not the fact that |$\dot{M}_w \simeq \dot{M}_{\rm max}$| – will likely be sensitive to the form of the gravitational potential. In particular, we suspect that the exact acceleration profile for the gas, including the final terminal speed (which depends on the small residual energy not lost to work against gravity), will depend on the details of the potential.
3.6 Synthesis of analytics versus numerics
Fig. 7 compares our numerical and analytic solutions for the mass-loss rate, terminal velocity, and base CR scale-height. We focus on the κ > r0ci solutions for which we have the most detailed analytic estimates. For κ < r0ci, |$\dot{M}_{w} \simeq \dot{M}_{\rm max}$| (equation 47), but we do not have a prediction for the terminal velocity in this regime.
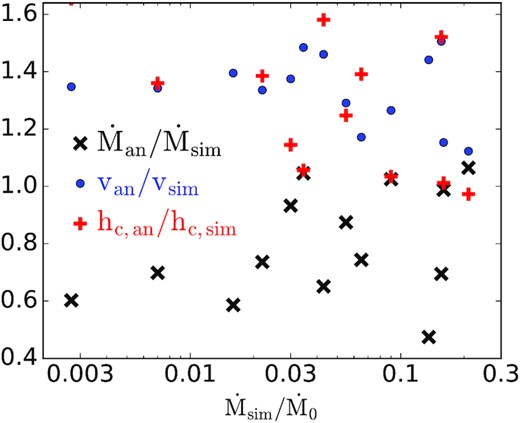
Ratio of the analytically predicted mass-loss rate (equation 28 with hc from equation 27), terminal velocity (equation 35), and base CR scale-height (equation 27) compared to the simulation results. The agreement is good for the full range of simulated parameters. Multiplying hc in equation (27) by ≃0.75 would remove the small systematic offset in hc and |$\dot{M}_w$|.
Overall, Fig. 7 shows that the analytics and numerics agree well using our analytically estimated base CR scale-height (equation 27). The latter in turn agrees well with the full numerical simulations (bottom panel of Fig. 7). There is a slight systematic offset in the mean analytical estimates of hc and |$\dot{M}$| that could be removed by multiplying equation (27) by ≃0.75.
The agreement in Fig. 7 holds over a factor of ∼30 in CR diffusion coefficient, ∼100 in base CR pressure, and ∼104 in the ratio of gravity to gas pressure (|$\propto V_g^2$|) which is also a proxy for galaxy mass; see Table 1 for the full range of simulations. Fig. 7 also compares the analytic estimate of the wind terminal velocity (equation 35) to the speed in the simulations at the top of the box. There is again reasonably good agreement, though the analytic speeds tend to be somewhat (|$\sim 30 {{\ \rm per\ cent}}$|) larger than the simulations. This is primarily because some of the energy remains in the CRs in the simulations given the finite outer radius of the computational domain, while the analytic estimate assumes that all of the CR energy has been transferred to the gas.
4 IMPLICATIONS OF GAMMA-RAY OBSERVATIONS FOR COSMIC-RAY WIND MODELS
The analytic and numerical calculations in Sections 2 and 3 show how the properties of galactic winds driven by CR diffusion depend on the diffusion coefficient. For example, winds lose most of their energy to gravity if κ ≲ r0ci (Table 1), while if κ ≳ r0ci, the terminal speed of the wind ∝κ1/2 (equation 35) and the base CR pressure and the wind mass-loss rate depend on κ for a given star formation rate (equation 24). To assess the implications of our results for CR-driven galactic winds we must thus have a handle on κ in other galaxies. Unfortunately, however, there is still sufficient uncertainty in CR transport that it is non-trivial to determine from first principles if the transport is indeed diffusive (versus streaming), let alone the value of the diffusion coefficient in different phases of the ISM and for the full range of conditions realized in galaxy formation. As a result, we appeal instead to observations to calibrate physically reasonable diffusion coefficients (see also Chan et al. 2019; Hopkins et al. 2020) and then use those, together with the results of Sections 2 and 3, to quantify the implications for CR-driven galactic wind models.
4.1 Non-thermal emission from pion decay
The non-thermal radio and gamma-ray emission from galaxies provide direct observational constraints on the properties of CRs in external galaxies. These in turn inform the CR pressure and diffusion coefficient that are critical for setting the strength of CR-driven galactic winds. In this section, we provide simple estimates to elucidate these constraints. We focus on the gamma-ray emission from pion decay in star forming galaxies observed by Fermi (Abdo et al. 2010b, a; Ackermann et al. 2012), rather than non-thermal radio emission, despite the fact that there are far more observations available for the latter (see Lacki et al. 2010). The reason is that the Fermi data directly constrains the properties of the GeV protons that dominate the CR energy density.
Observations of star-forming galaxies by Fermi show that there is a correlation between gamma-ray luminosity and star formation rate (or infrared luminosity; Ackermann et al. 2012; Griffin, Dai & Thompson 2016; Linden 2017) and a correlation between gamma-ray luminosity and gas surface density (Lacki et al. 2011). Both correlations imply that high star formation rate and high gas surface density systems approach the ‘proton calorimeter’ limit (Pohl 1994; Thompson et al. 2007) in which most of the CR proton energy is lost to pion decay before the CRs escape the galaxy. Because the correlation between gamma-ray luminosity and infrared luminosity is better constrained than the correlation between gamma-ray luminosity and gas surface density, we use the former to calibrate the diffusion coefficients in our models: Lγ ≃ 2.3 × 10⁴L⊙(LTIR/109L⊙)1.25 (Griffin et al. 2016) where LTIR is the total infrared luminosity from |$0.1\!-\!1000 \,\rm \mu m$|.
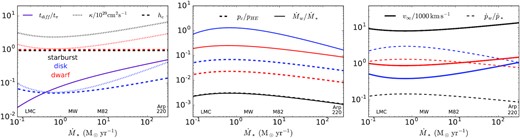
Empirically constrained cosmic ray properties in star-forming galaxies inferred from gamma-ray observations of pion decay by Fermi, as a function of galaxy star formation rate. All calculations assume gas isothermal sound speed |$c_i=10 \, {\rm km \, \, s}^{-1}$|; scalings to other values of ci are shown in Fig. 9 and discussed in the text. Star formation rates of example galaxies are indicated near the x-axis. Three examples are considered corresponding to nuclear starbursts (black lines; r0 = 0.3 kpc, |$V_g=150 \, {\rm km \, \, s}^{-1}$|), dwarf galaxies (red lines; r0 = 1 kpc, |$V_g= 50\, {\rm km \, \, s}^{-1}$|), and star-forming disc galaxies (blue lines; r0 = 3 kpc, |$V_g=150 \, {\rm km \, \, s}^{-1}$|). Left-hand panel: tdiff/tπ∝Lγ/L* is the ratio of the CR diffusion time to the pion loss time and sets the gamma-ray luminosity of the galaxy (equation 49). We infer tdiff/tπ for different galaxy star formation rates using the Fermi correlation between Lγ and star formation rate. We then calculate the CR diffusion coefficient κ and the dimensionless CR scale-height hc = Hc/r0 using equations (48), (32), and (27). Middle: The fractional contribution of CR pressure to the pressure in the galactic disc (|$p_{HE}=\pi G \Sigma _g^2 \phi)$| depends on the assumed size of the star-forming disc r0, with nuclear starbursts having suppressed pc/pHE because of rapid pion losses and CR diffusion in the dense nuclear regions. The predicted mass-loss rate relative to the star formation rate |$\dot{M}_w/\dot{M}_*$| is largest for the disc galaxy model. Right-hand panel: Asymptotic wind speed v∞ and momentum flux in the wind |$\dot{p}_w$| relative to the stellar radiation field (|$\dot{p}_* = L_*/c$|).
4.2 Models calibrated to gamma-ray data
Given tdiff/tπ as a function of galaxy star formation rate (purple line Fig. 8), we now use equation (48) to constrain the CR diffusion coefficient. To do so, however, we need an estimate of the CR scale-height and gas surface density as a function of star formation rate. We model hc = Hc/r0 using equation (27) which assumes that the CR scale-height is set by diffusion in a CR-driven galactic wind. We model the gas surface density Σg using equation (32) which yields |$\dot{M}_* \simeq \pi r_0^2 \sqrt{8} \pi G \Sigma _g^2 \phi /v_*$| where r0 is the size of the galactic disc. The free parameters of our model are thus the size of the star-forming galactic disc r0, the galaxy circular velocity set by Vg, the gas isothermal sound speed ci, and the dimensionless stellar contribution to the gravitational potential ϕ (as well as several ‘microphysics’ parameters such as the CR energy per supernovae). Given choices for these parameters, as well as the observed Lγ − L* correlation, we solve equations (27), (32), and (48) for κ, hc, and Σg. In what follows, we initially assume |$c_i=10 \, {\rm km \, \, s}^{-1}$| and consider parameters approximating three different classes of galaxies. Results for these classes are given in Fig. 8:
Nuclear starbursts: black lines in Fig. 8; r0 = 0.3 kpc, |$V_g=150 \, {\rm km \, \, s}^{-1}$|, ϕ = 1. This model is meant to approximate the nuclear starbursts M82 and NGC 253 with |$\dot{M}_*\simeq 10$| M⊙ yr−1, as well as ultraluminous starbursts like Arp 220 with |$\dot{M_*} \sim 10^2$| M⊙ yr−1.
Dwarf galaxies: red lines in Fig. 8; r0 = 1 kpc, |$V_g= 50\, {\rm km \, \, s}^{-1}$|, ϕ = 5. This model is meant to approximate normal star-forming dwarf galaxies like the LMC or SMC and their potentially much more rapidly star-forming counterparts.
Star-forming disc galaxies: blue lines in Fig. 8; r0 = 3 kpc, |$V_g=150 \, {\rm km \, \, s}^{-1}$|, ϕ = 5. This model is meant to approximate the Milky Way, M31, and other star-forming spirals in the local (|$\dot{M}_* \sim \, {\rm M_\odot \, yr^{-1}}$|) and high-redshift (|$\dot{M}_* \sim 10-100 \, {\rm M_\odot \, yr^{-1}}$|) Universe.
We discuss below (Fig. 9 and equations 55–65) the scaling of our results to other gas sound speeds ci.
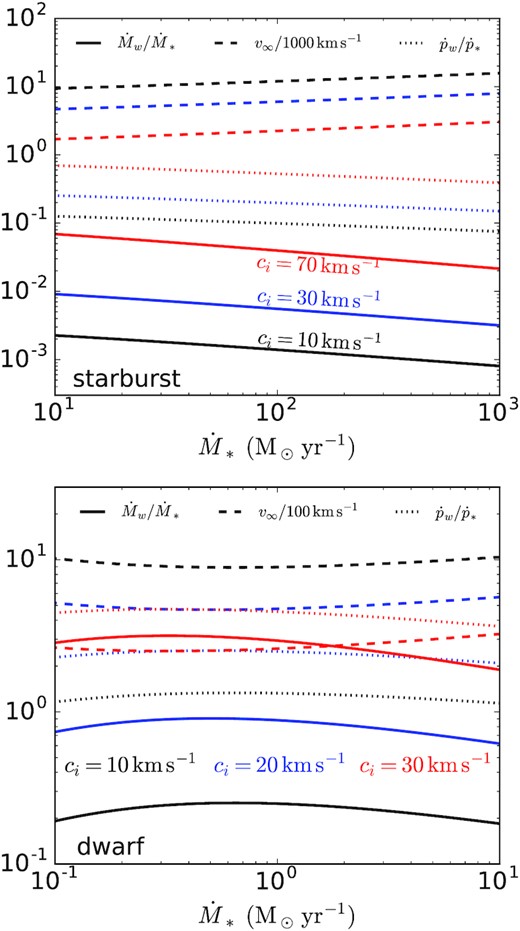
Empirically constrained mass-loss rates, terminal velocities, and momentum fluxes in galactic winds, as a function of galaxy star formation rate, for different values of the gas isothermal sound speed ci. The nuclear starburst model (top) assumes r0 = 0.3 kpc, |$V_g=150 \, {\rm km \, \, s}^{-1}$|, and ϕ = 1 while the dwarf galaxy model assumes r0 = 1 kpc, |$V_g= 50\, {\rm km \, \, s}^{-1}$|, and ϕ = 5. Note the different x-axis range and normalization of v∞ for the two panels. The results for the star-forming disc galaxy model shown in Fig. 8 are nearly independent of ci (see the text) and so are not plotted here. Starburst mass-loss rates are |$\ll \dot{M}_*$| independent of ci while dwarf galaxy mass-loss rates can reach |$\sim \dot{M}_*$| for larger values of ci. For starbursts with high star formation rates, the terminal speed and momentum flux are best interpreted as upper limits (see Section 4 for details).
The dotted lines in the left-hand panel of Fig. 8 show the CR diffusion coefficient in units of 1029 cm2 s−1 required to explain the gamma-ray luminosities of star-forming galaxies, per the method described in the previous paragraph. Fig. 8 also shows the dimensionless CR scale-height hc we derive (dashed lines). For the dwarf and starburst models in Fig. 8, hc ≃ 1 and the diffusion coefficient is ∼2 × 1029 cm2 s−1 ≫r0ci with only a modest factor of few variation with star formation rate. For the star forming disc model, however, hc ∼ 0.1 and κ ∼ r0ci ∼ 1028 cm2 s−1. The dimensionless scale-height for our ‘disc’ model is comparable to that inferred from synchrotron emission in nearby star-forming disc galaxies (e.g. Krause et al. 2018), though the latter depends on both the magnetic field and CR scale-heights. Our inferred values of hc ∼ 0.1 and κ ∼ 1028 cm2 s−1 for disc galaxies in Fig. 8 are, however, factors of ∼5 smaller than preferred in phenomenological models constrained by Milky Way CR data (e.g. Trotta et al. 2011). However, the estimated gamma-ray luminosity of the Milky Way ≃ 8 × 1038 erg s−1 (Strong et al. 2010) is a factor of ≃ 3 lower than what would be predicted by its infrared luminosity given the correlations from Ackermann et al. (2012) and Griffin et al. (2016) used here. hc and κ would then be 3 and 10 times larger, respectively (see equations 55 and 61 below), in better agreement with detailed Milky-Way modelling. In addition, we show below that for hc ≲ 1, hc∝ci and κ∝ci (equations 55 and 61). Our disc galaxy model in Fig. 8 would thus have a larger scale-height and diffusion coefficient if we assumed that the CRs primarily coupled to the warm-hot phase of the ISM, as is quite plausible.
The key dimensionless number from Section 3 that determines the properties of CR-driven galactic winds is κ/(r0ci); winds accelerate rapidly and reach speeds significantly larger than Vg if κ/(r0ci) ≳ 1 (Fig. 2). For our three galaxy models in Fig. 8, we note that r0ci ≃ 1027 cm2 s−1 (starburst; black lines), r0ci ≃ 3 × 1027 cm2 s−1 (dwarf; red lines), and r0ci ≃ 1028 cm2 s−1 (disc; blue lines). A key conclusion from Fig. 8 is that the gamma-ray data on star-forming galaxies are consistent with diffusion coefficients that are in the regime of κ ≳ r0ci, though only marginally so for our star-forming disc model. This does not prove that such diffusion coefficients are correct, at a minimum because it is possible that CR escape is not set by diffusion but rather by streaming or advection in winds driven by other mechanisms (e.g. supernovae), in which case our constraint on the CR diffusion coefficient using equation (49) would not apply. But the diffusion coefficients inferred in Fig. 8 are none the less a useful and instructive observational check on diffusive CR-driven galactic wind models.
The solid lines in the middle panel of Fig. 8 shows the mass-loading of CR-driven galactic winds |$\dot{M}_w/\dot{M}_*$| from equation (53) using κ in the left-hand panel of Fig. 8 calibrated to gamma-ray observations. We again show results for our three fiducial galaxy models. The mass-loss rates in CR-driven winds are significant for a wide range of normal disc galaxy conditions with |$\dot{M}_w \sim \dot{M}_*$|, but are strongly suppressed (|$\dot{M}_w \sim 10^{-3} \dot{M}_*$|) in nuclear starbursts like M82, NGC 253, and Arp 220 because rapid CR diffusion and pion losses suppress the base CR pressure (Fig. 8) and thus the mass-loss rate in the wind. Dwarf galaxies lie somewhere in between with |$M_w \sim 0.2 \dot{M}_*$|.
The right-hand panel of Fig. 8 shows the terminal velocity (equation 35) and momentum flux |$\dot{p}_w=\dot{M}_w v_\infty$| (in units of the photon momentum flux |$\dot{p}_*=L/c$|) for the same three galaxy models (compare with Lochhaas, Thompson & Schneider 2021). For the disc and dwarf models |$v_\infty \sim 1000 \, {\rm km \, \, s}^{-1}$| and |$\dot{p}_w \sim \dot{p}_*$| while for the starburst model |$v_\infty \sim 10^4 \, {\rm km \, \, s}^{-1}$| and |$\dot{p}_w \sim 0.1 \dot{p}_*$|. The large velocities and correspondingly lower momentum fluxes for the starburst model are a consequence of κ ≫ r0ci needed to avoid overproducing the gamma-ray luminosities.
One of the uncertainties in assessing the implications of our results for observations is the appropriate value of the gas isothermal sound speed. Most of the mass in the ISM is in cooler phases but most of the volume is in warmer phases. As a result, it is plausible, though not guaranteed, that the warmer phases set the scattering rate and diffusion coefficient for the cosmic-rays. Fig. 9 shows how the mass-loss rates, terminal velocities, and momentum fluxes we infer from gamma-ray data in our starburst and dwarf models depend on the assumed value of ci. We do not show similar results for the normal star-forming disc model because that model is in the regime hc ≲ 1 where the mass-loss rate, terminal velocity, and momentum flux given gamma-ray inferred diffusion coefficients are a very weak function of ci (e.g. the results in Fig. 8 for the ‘disc’ model apply to better than a factor of 2 accuracy for |$c_i \lesssim 100 \, {\rm km \, \, s}^{-1}$|); this is derived analytically below. Fig. 9 shows that the mass-loss rate increases notably with increasing ci for both our starburst and dwarf galaxy models. The momentum flux increases more slowly with ci and the terminal velocity of the wind decreases due to the larger mass-loadings. However, the qualitative conclusions drawn from Fig. 8 remain robust. Namely, for the starburst models |$\dot{M}_w \ll M_*$| and for the dwarf models |$\dot{M}_w$| is at most |$\sim {\rm few \times } \, \dot{M}_*$|. The latter is, however, still smaller than the large mass-loadings in dwarf galaxies typically needed to reconcile the galaxy stellar mass and dark matter halo mass functions (e.g. Somerville & Davé 2015).
Luminous starbursts (e.g. Arp 220, and to a lesser extent M82) have gamma-ray luminosities approaching the calorimeter limit Lγ ≃ AγL* due to tπ ≲ tdiff (e.g. Lacki et al. 2011; Ackermann et al. 2012; Griffin et al. 2016). In the calorimeter limit, the constraints on κ in Fig. 8 are best interpreted as upper limits, since the gamma-ray emission is roughly independent of κ for tπ ≲ tdiff. In this regime, the estimated mass-loss rate is independent of κ because the base CR pressure is set by tπ in equation (52) rather than tdiff. However, because the asymptotic wind speed is ∝κ1/2 (equation 59), in the calorimeter limit, we can only empirically derive an upper limit on v∞ and the asymptotic wind kinetic energy and momentum flux. Thus, particularly for the more luminous starbursts in Figs 8 and 9, our results may be better interpreted as upper limits on the wind terminal velocity and momentum flux. This further strengthens our conclusion that winds due to cosmic-rays alone are weak in starburst galaxies and cannot drive their exceptional outflows (e.g. see Barcos-Muñoz et al. 2018).
4.3 Analytic scalings
Equations (55)–(65) do a good job of reproducing many key results shown in Fig. 8: (1) the characteristic diffusion coefficient ∼1028−29 cm2 s−1 relatively independent of galaxy properties required to reproduce the observed gamma-ray-star formation rate correlation, and (2) a base CR pressure pc, 0 and wind mass-loading |$\dot{M}_w/\dot{M}_*$| that are relatively independent of star formation rate, but a strong function of the size of the star-forming disc r0 at fixed star formation rate (because diffusion is much more rapid for smaller r0 and decreases pc, 0 and |$\dot{M}_w$|)..
Equations (55)–(65) also elucidate how our gamma-ray inferences depend on the gas isothermal sound speed. Fig. 8 takes |$c_i=10 \, {\rm km \, \, s}^{-1}$|. Our star-forming disc model in Fig. 8 is in the regime with hc ≲ 1, so that equations (61)–(65) apply. In this regime κ∝ci so that κ/r0ci ∼ 1 from Fig. 8 is in fact true relatively independent of ci. Moreover, for hc ≲ 1, |$\dot{M}_w$| is independent of ci (equation 63). The results in the middle and right-hand panels of Fig. 8 are thus applicable over a wide range of ci (this is the reason that we do not plot the ‘disc’ model in Fig. 9). Our conclusion that CR-driven winds constrained by gamma-ray observations of disc galaxies are dynamically important with |$\dot{M}_w \sim \dot{M}_*$| is thus robust to uncertainties in ci.
In contrast to the disc model, the dwarf and starburst models in Fig. 8 are in the regime where hc ∼ 1 so that equations (56)–(60) apply. In this case the inferred κ is independent of ci (equation 56); however, even |$c_i \sim 100 \, {\rm km \, \, s}^{-1}$| still corresponds to κ/r0ci ≳ 1 so that the qualitative physics of the wind does not change. Equations (58), (59), and (60) predict that the inferred mass-loss rate, terminal velocity, and momentum flux given gamma-ray constraints scale |$\propto c_i, c_i^{-1/2}$| and |$c_i^{1/2}$|, respectively. This is consistent with, though weaker than, the trends in Fig. 9. The stronger dependence on ci in Fig. 9 is because for larger values of ci the approximation |$\left(4 h_c V_g^4/[c_{c,0}^2 c_i^2]\right)^{c_i^2/(2V_g^2)} \sim 1$| used to derive equations (56)–(65) is no longer as accurate. Physically, this is because for larger values of ci and smaller cc, 0 the sonic point rs is at somewhat larger radii ∼few ×r0, which increases |$\dot{M}_w$| (equation 28) and decreases v∞ (equation 35).
We conclude this section by reiterating that our most general expressions for the base CR pressure pc, 0, mass-loss rate |$\dot{M}_w$|, terminal velocity v∞, and momentum flux |$\dot{p}_w$| in CR-driven galactic winds are given in Section 2. Those results depend, however, on a theoretically and observationally uncertain CR diffusion coefficient. In this section (and in Figs 8 and 9) we have estimated the CR diffusion coefficient κ using the existing (but limited) gamma-ray data from Fermi on pion-decay in star-forming galaxies, thus enabling more concrete predictions of the properties of CR-driven galactic winds.
5 SUMMARY AND DISCUSSION
The physics of cosmic ray (CR) transport in galaxies and in the circumgalactic medium remains a significant uncertainty in assessing the impact of CRs on galaxy formation. A central question is what determines the scattering mean free path of CRs, and how this depends on local plasma conditions (e.g. Amato & Blasi 2018; Hopkins et al. 2021b). In this paper, we have assumed that CR transport can be modelled by a spatially independent diffusion coefficient. The diffusion approximation for CR transport is particularly appropriate if ambient turbulence scatters the CRs (versus scattering by fluctuations excited by the CRs themselves). A companion paper will consider the case of CR transport mediated by the streaming instability. These two mechanisms of CR transport differ dramatically in their predictions for how the CR pressure decreases away from a galaxy: in the limit of rapid CR diffusion, pc∝r−1 (equation 8), i.e. the CR pressure scale-height is of the order of the size of the system, while in the limit of rapid CR streaming, pc∝ρ2/3 (for a split-monopole field geometry; e.g. Mao & Ostriker 2018) and so the CR pressure scale-height is tied to that of the gas. This difference in the dynamics of the CRs in general leads to significantly different wind properties for the two CR transport models, as has been highlighted previously in numerical simulations (e.g. Wiener et al. 2017; Chan et al. 2019). One aim of this paper and its companion is to understand these differences analytically and using idealized time-dependent numerical simulations, thus elucidating how the properties of CR-driven galactic winds depend on global galaxy properties and the physics of CR transport.
In this paper, we analytically estimated the properties of galactic winds driven by diffusion by assuming that the CR diffusion time-scale is short compared to the flow time (or dynamical time) near the base of the wind; this requires CR diffusion coefficients κ ≳ r0ci where r0 is the size of the galaxy (i.e. the star-forming disc) and ci is the gas sound speed. In this limit, the asymptotic kinetic energy flux carried by the wind is comparable to that supplied to the CRs at the base of the wind, i.e. the wind is energy conserving. The mass-loss rate of CR driven winds has the form |$\dot{M}_w \sim 2 \pi r_0^2\, \rho _0\, c_i \, (c_{c,0}/V_g)^2 \sim 2 \pi r_0^2 p_{c,0} c_i/V_g^2$| (equation 28; see Fig. 1), and the asymptotic wind speed is V∞ ≃ 2Vg(3κ/r0ci)1/2 (equation 35) where ρ0, pc, 0, and cc, 0 are the gas density, CR pressure, and CR sound speed at the base of the outflow and |$\sqrt{2}V_g$| is the rotation velocity of the galaxy. Equation (31) compares this estimate of the mass-loss rate in CR-driven winds to the galaxy star formation rate, with |$\dot{M}_w/\dot{M}_* \propto 1/\kappa$|. Physically, for a given rate of CR production, set by the star formation rate, the CR pressure in the galaxy, and thus the strength of the wind, decreases with increasing diffusion coefficient since the CRs escape the galaxy more rapidly.
In addition to our analytic estimates, we also carried out time-dependent spherically symmetric simulations of CR-driven winds using the two-moment CR transport scheme for Athena++ developed by Jiang & Oh (2018). The simulations show that, for κ ≳ r0ci, the analytic estimates for the mass-loss rate, terminal speed, and CR scale-height near the base of the wind are accurate to |$\sim 50{{\ \rm per\ cent}}$| over a factor of ∼30 in CR diffusion coefficient, ∼30 in base CR pressure, and ∼100 in the ratio of the escape speed to the gas sound speed (Fig. 7; see Table 1 for the full range of simulations). In addition, the simulations show that there is a critical value of the CR diffusion coefficient κ ≃ r0ci below which the character of the solution changes considerably. For κ ≲ r0ci, CR-driven winds accelerate much more slowly and are nearly hydrostatic over a very extended radial range. In this regime most of the energy supplied to CRs at the base of the wind goes into work against gravity expanding to large radii (Fig. 6): the asymptotic kinetic energy flux in the wind is only a small fraction of that initially supplied to the CRs (see the last column of Table 1). These low κ solutions are CR analogues of photon-tired stellar winds (Owocki & Gayley 1997). The mass-loss rate in this regime can be accurately estimated from global energy conservation as |$\dot{M}_w \simeq \dot{M}_{\rm max} \simeq 2 \dot{E}_c/v_{esc}^2$| (equations 40 and 47), where |$\dot{E}_c$| is the energy per unit time supplied to CRs at the base of the wind. This maximum possible mass-loss rate in CR-driven winds is quite large, |$\simeq \dot{M}_* (300 \, \, {\rm km \, \, s}^{-1}/v_{esc})^2$| (equation 39). For κ > r0ci, however, the actual outflow rate is much less than this maximal value (equation 42).
A key difference between our treatment of CR-driven winds in this paper and analogous treatments of stellar winds driven by radiation in the diffusion approximation (e.g. Owocki, Townsend & Quataert 2017) is that stellar wind theory is typically formulated in terms of a given photon-matter cross-section σ, which sets the Eddington luminosity. By contrast, here we are considering a fixed CR diffusion coefficient, equivalent to a fixed value of the mean-free path 1/(σρ). This difference means that many solutions in stellar wind theory do not directly carry over to the CR problem, although many of the important concepts do.
In our models with κ ≳ r0ci, the properties of CR-driven winds are largely set close to the ‘base’ of the wind, i.e. near the galaxy. In particular, the sonic point – which sets the mass-loss rate – is close to the base of the wind (equation 21) unless ci ∼ Vg and the energy flux in the wind – which sets the terminal velocity – is set by the CR diffusive flux at the base (equation 35 and associated discussion). As a result, we suspect that the properties of these solutions are unlikely to be that sensitive to spatial variation in the CR diffusion coefficient unless there are large variations at small radii near the sonic point. By contrast, our solutions with κ ≲ r0ci accelerate much more slowly (Fig. 6) and are likely much more sensitive to spatial variation in the microphysics of CR transport. In addition, because the low κ solutions have a kinetic power |$\dot{E}_k$| at large radii that is small compared to the cosmic ray power at the base of the wind, they are likely more sensitive to the ambient pressure in the CGM, which could confine lower |$\dot{E}_k$| outflows.
Our time-dependent simulations allow us to study the stability of the analytic steady state wind solutions. Nearly all of our simulations reach a laminar steady state with no evidence of instability. This is at first glance surprising since Drury & Falle (1986) showed that CR diffusion in the presence of a background CR pressure gradient renders sound waves linearly unstable. We show in Appendix A, however, that the growth rate of the sound wave instability is not fast enough compared to the flow time in the wind for the instability to grow significantly; the one exception to this is our lowest gas sound speed simulation (the Vg = 200ci simulation in Table 1; see Fig. A1). Appendix A also carries out a WKB linear stability calculation (neglecting the background cosmic ray pressure gradient) for the two-moment CR transport scheme used in our simulations, and shows that sound waves and entropy modes are linearly stable in the presence of CR diffusion, consistent with the steady state solutions found in the simulations.
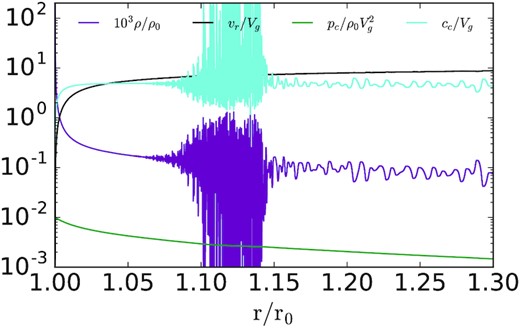
Density, velocity, cosmic ray pressure profiles, and CR sound speed (|$c_c = \sqrt{p_c/\rho }$|) for our Vg = 200 simulation (see Table 1). For this plot, because of the very low base gas sound speed, we have normalized the velocity, CR sound speed, and and CR pressure using Vg, Vg, and |$\rho V_g^2$|, respectively. Note the onset of an instability and strong fluctuations at r ∼ 1.07 (the resolution decreases at r ≃ 1.14 due to a change in mesh refinement, which likely is responsible for suppressing the short wavelength fluctuations exterior to that radius). Despite the large density fluctuations, the mass-loss rate and terminal velocity in the simulation are well-described by our steady state analytic solutions.
A key parameter that sets the strength of the galactic wind in our models is the CR pressure in the bulk of the ISM (with |$\dot{M}_w \propto p_{c,0}$|). If |$p_{c,0} \sim \pi G \Sigma _g^2 \phi$| (the pressure required for hydrostatic equilibrium), CR-driven winds will have dynamically important mass-loss rates with |$\dot{M}_w \gtrsim \dot{M}_*$| (equation 29). If, however, |$p_{c,0} \ll \pi G \Sigma _g^2 \phi$|, then since |$\dot{M}_w \propto p_{c,0}$| (equation 28), the mass-loss rates will be significantly smaller. The equilibrium CR pressure pc, 0 is in turn set by CR escape (i.e. the diffusion coefficient κ) and/or hadronic losses (equation 51). To assess the implications of our results for the role of CRs in driving galactic winds, it is thus necessary to estimate the CR diffusion coefficient in other galaxies. This remains a daunting task from first principles, so we instead turned to observations (see Section 4). In particular, observations of the non-thermal emission from CRs in other galaxies provide direct constraints on CR diffusion coefficients and the CR pressure in galaxies (e.g. Lacki et al. 2010, 2011; Crocker et al. 2021). The non-thermal gamma-ray emission from neutral pion decay is particularly important in this regard because (1) it constrains the properties of CR protons (versus synchrotron emission), and (2) observations at GeV energies by Fermi, though modest in number, directly constrain the CRs that dominate the total CR pressure. In Section 4, we developed a simple analytic model interpreting gamma-ray observations in the context of diffusive CR transport. This model essentially derives the theoretically and observationally uncertain diffusion coefficient as a function of the observed gamma-ray luminosity of galaxies. We find that a model with a diffusion coefficient ∼1028−29 cm2 s−1 (Fig. 8, equations 56 and 61) is consistent with the Fermi data on gamma-ray emission from star-forming galaxies. This is consistent with similar estimates by Chan et al. (2019) and Hopkins et al. (2020) and their more detailed numerical calculations. We stress that these diffusion coefficients are derived assuming that diffusion dominates CR transport and hence CR observables, rather than streaming or advection in a wind driven by other processes (e.g. supernovae). If the latter dominate CR transport then the diffusion model used in this paper is not applicable.
Our constraint on the diffusion coefficient in other galaxies also translates into an estimate of the CR pressure in galactic discs. For typical star forming galaxies with disc sizes r0 ∼ 3 kpc, we find that the CR pressure is of the order of 10 per cent of the pressure required for vertical hydrostatic equilibrium in the disc (Fig. 8 and equation 57). This is reasonably consistent with Milky Way measurements. However, the fractional contribution of CRs to pressure support in the disc is ∝r0 and is only ∼10−2.5 for typical nuclear starburst conditions (Fig. 8 and equation 57). Physically, this is because in more compact star-forming regions, the gas densities are higher and thus pion losses are stronger. In addition, the CR diffusion time is shorter. There is thus less time for the CR pressure to build up and so the equilibrium CR pressure in the disc is lower. These conclusions are consistent with the earlier work of Lacki et al. (2010) based on modeling the far-infrared-radio correlation.
Our results on the CR diffusion coefficient and CR pressure implied by gamma-ray observations can be used to estimate the properties of CR-driven galactic winds across a wide range of galaxies. The middle panel of Fig. 8 plots the resulting ratio of the CR-driven mass-loss rate to the star formation rate for three fiducial galaxy models, while the right-hand panel shows the terminal velocity and momentum flux of the wind. We find that for massive star-forming disc galaxies, the mass-loss rates are of the order of the star formation rate, momentum fluxes are of the order of |$\dot{p}_* = L/c$|, and terminal velocities are |$\sim 500 \, {\rm km \, \, s}^{-1}$| (a few times the circular velocity). For lower mass dwarf galaxies, however, we find that CRs are somewhat less efficient at driving winds (|$\dot{M}_w \sim 0.2 \dot{M}_*$| and |$\dot{p}_w \sim L/c$|), primarily because the CR diffusion time is so short (to explain the gamma-ray data) that the CR pressure in the disc is comparatively low. This is even more true in nuclear starbursts: CRs become much less efficient at driving winds with |$\dot{M}_w/\dot{M}_* \propto r_0$| (equation 58) and |$\dot{M}_w/\dot{M}_* \sim 10^{-2}-10^{-3}$| for well-studied local starbursts like M82 and Arp 220 (Fig. 8). This conclusion fundamentally rests on our inference that |$p_{c,0} \ll \pi G \Sigma _g^2 \phi$| given CR diffusion coefficients and pion loss time-scales motivated by gamma-ray observations. An independent observational probe of the CR proton pressure in other galaxies would be a valuable test of our models.
One of the uncertain parameters in applying our results to observations is the appropriate isothermal gas sound speed. This depends on the phase of the ISM that the cosmic-rays most effectively couple to. Fig. 8 assumes |$c_i = 10 \, {\rm km \, \, s}^{-1}$|, which is an appropriate mass-averaged value in the Milky Way. For typical star-forming disc galaxy parameters, we find that the properties of the winds using gamma-ray constrained diffusion coefficients are weakly dependent on ci (also derived analytically in equations 63–65). Our conclusion that cosmic-rays are a significant source of winds in normal disc galaxies is thus reasonably robust to the uncertainty of the phase of the ISM that primarily determines CR transport. We note, however, that the CR diffusion coefficient we infer for disc galaxies using gamma-ray data scales linearly with the assumed isothermal sound speed. We find the best agreement with phenomenological models (|$\kappa \sim 3 -10 \, 10^{28}$| cm2 s−1; e.g. Trotta et al. 2011; Evoli et al. 2020) for |$c_i \sim 100 \, {\rm km \, \, s}^{-1}$| (see Section 4.3) while |$c_i \sim 10 \, {\rm km \, \, s}^{-1}$| yields a significantly smaller diffusion coefficient (Fig. 8). This is consistent with the hypothesis that CR transport is set primarily by the hot volume-filling phase of the ISM. We also find that for star-forming disc galaxies, κ ∼ r0ci so that the winds are on the border between the rapidly accelerating high-speed solutions we find for κ ≳ r0ci and the slower more hydrostatic solutions obtained for κ ≲ r0ci.
Fig. 9 shows our gamma-ray inferred wind properties for dwarf galaxy and nuclear starburst models for larger values of ci, appropriate if cosmic-rays primarily couple to volume filling warm-hot gas. For these galaxy models, the mass-loss rate can increase significantly for larger values of ci, as does the momentum flux in the wind; the terminal speed of the wind is correspondingly smaller for larger ci. However, our general conclusions are reasonably robust to uncertainties in ci: the mass-loss rates due to CRs alone in starburst galaxies are |$\ll \dot{M}_*$| and in dwarf galaxies are at most |$\sim {\rm few} \times \dot{M}_*$|. The latter is still below what is typically needed to reconcile the stellar and dark matter halo mass functions (see e.g. Muratov et al. 2015, table 3).
As noted earlier in the discussion, the maximum mass-loss rate in CR-driven winds allowed by energy conservation is appreciable, |$\dot{M}_{\rm max} \simeq \dot{M}_* (300 \, \, {\rm km \, \, s}^{-1}\,v_{\rm esc}^{-1})^2$| (equation 39). Mass-loss rates |$\sim \dot{M}_{\rm max}$| would be particularly important in dwarf galaxies. However, these large mass-loss rates are only realized when the outflow is very slow and most of the energy supplied to CRs by star formation goes into work leaving the gravitational potential of the galaxy (Fig. 6). This in turn requires low CR diffusion coefficients. Such slow outflows would produce gamma-ray luminosities in dwarf galaxies and compact nuclear starbursts larger than are observed. This is the fundamental observational constraint that leads us to favour larger diffusion coefficients and modest mass-loss rates in dwarf and starburst galaxies. A corollary of this result is that in all of our models calibrated to explain gamma-ray luminosities well below the proton-calorimeter value, most of the CR proton energy is vented into the CGM. Even if the CR-driven mass-loadings on galactic scales are modest, CRs may play an important ‘preventive’ feedback role on CGM scales and/or may significantly modify the dynamics and thermodynamics of the CGM (as was indeed found in the simulations of Ji et al. 2020).
It is instructive to compare our results to related results in the literature. For example, Booth et al. (2013) assumed κ = 3 × 1027 cm2 s−1 in their simulations of the impact of cosmic-rays on star-forming galaxies. By contrast, Salem & Bryan (2014) considered a range of diffusion coefficients κ = 3 × 1027 − 1029 cm2 s−1 in a similar study. Neither work compared to gamma-ray observations. Our results strongly disfavour the low diffusion coefficient used by Booth et al. (2013) and favour the upper end of the values modelled in Salem & Bryan (2014). Chan et al. (2019) studied 3D simulations of idealized galaxies with CRs and other forms of stellar feedback, and directly compared to gamma-ray observations. They also concluded that CR diffusion coefficients of ∼1029 cm2 s−1 were required for consistency with gamma-ray observations. Hopkins et al. (2020) reached similar conclusions using cosmological zoom-in simulations. Our analytics help firm up the conclusions drawn from these simulations and show how they depend on other stellar feedback parameters and the galaxy model (see, in particular, our analytic scalings in equations 56–65). Both Chan et al. (2019) and Hopkins et al. (2020) also found, as we do, that while CRs can drive winds in Milky-way mass galaxies, CRs are not very important wind-drivers in dwarf galaxies relative to other mechanisms.
A significant difference between our solutions and the cosmological zoom-in simulations with CRs of Hopkins et al. (2020), Ji et al. (2020), and Hopkins et al. (2021a) is that we find that advection of CR energy by the gas motion becomes the dominant CR transport mechanism relatively close to the base of the wind, with the gas kinetic energy flux taking over at yet larger radii (see Fig. 4 and equation 25). By contrast, Hopkins et al. (2020), Ji et al. (2020), and Hopkins et al. (2021a) argue that diffusion sets up a pc∝r−1 profile throughout the CGM. A possible resolution of this difference is that diffusion would likely again be the dominant CR transport mechanism exterior to a termination shock between a galactic wind and the CGM, which is not included in our calculations. It is also worth noting that our simulations require high resolution to resolve the acceleration of the gas at small radii, particularly for colder phases of the ISM, i.e. larger Vg/ci (see Table 1). This is not achievable in cosmological simulations. If we take our fiducial κ = 10, Vg = 10 simulation (Table 1) and reduce the resolution to dr/r = 0.05, the mass-loss rate increases by a factor of ∼4. This is, however, almost certainly boundary condition dependent, and it is not clear how this result would change for cosmological simulations which do not have any boundary in the galaxy.
Finally, we stress that our observational calibration of CR diffusion coefficients using Fermi gamma-ray data is based on a limited sample of galaxies, primarily those in the Local Group, M82, NGC 253, and Arp 220 (Ackermann et al. 2012; Griffin et al. 2016). It is thus entirely possible that there are physical correlations of CR transport with galaxy properties (gas density, metallicity, galaxy size,...) that are not revealed by the current data. Despite this caveat, given the particularly large theoretical uncertainties in the microphysics of CR transport, we believe that observational calibration of the models is an important constraint, and one that will hopefully improve in the coming years.
ACKNOWLEDGEMENTS
We thank Andrea Antoni, Phil Hopkins, Philipp Kempski, S. Peng Oh, Eve Ostriker, and Jono Squire for useful conversations. EQ thanks the Princeton Astrophysical Sciences department and the theoretical astrophysics group and Moore Distinguished Scholar program at Caltech for their hospitality and support. EQ was supported in part by a Simons Investigator Award from the Simons Foundation and by NSF grant AST-1715070. The Center for Computational Astrophysics at the Flatiron Institute is supported by the Simons Foundation. TAT is supported in part by NSF grant #1516967 and NASA grant #80NSSC18K0526. TAT acknowledges support from a Simons Foundation Fellowship and an IBM Einstein Fellowship from the Institute for Advanced Study, Princeton, while a portion of this work was completed. This research made extensive use of matplotlib (Hunter 2007) and astropy,10 a community-developed core python package for Astronomy (Astropy Collaboration 2013, 2018).
DATA AVAILABILITY
The numerical simulation results used in this paper will be shared on reasonable request to the corresponding author.
Footnotes
Even given this restrictive assumption, the diffusion term in equation (3) in general depends on local plasma conditions. It can also depend on the cosmic ray energy density itself, in which case the ‘diffusion’ term in equation (3) is not even truly diffusive (e.g. Skilling 1971; Wiener, Oh & Guo 2013). We do not consider this complication in this work.
vesc(r0) is formally not defined for the ln (r) potential focused on here, but it is ∼2Vg for a more realistic potential which deviates from isothermal at larger radii (and/or for a computational domain of reasonable size even with a ln (r) potential).
The two-moment approach enables a much more accurate treatment of CR streaming, which is not essential for this paper but will be in later publications in this series.
Jiang & Oh (2018) follow the conventions of the radiation transfer literature in which the diffusive flux is |$F_c = -\sigma _c^{-1} \nabla p_c$|. In the rest of this paper, we follow the conventions of the CR literature and define the diffusive flux as Fc = −κ∇Ec (equation 2). This accounts for the factor of 3 relating κ and |$\sigma _c^{-1}$|.
Note that there are small oscillations in the solution near the sonic point; these remain at late times even once the solution settles into a steady state. We do not have a definitive explanation for these oscillations but they are not present in any of our κ ≳ r0ci solutions (the majority in Table 1).
Note that ϵc defined in equation (30) is given by ϵc = Ecr/m*c2. In this section, it is convenient to separate out ϵc into a part that depends on the initial mass function (m*) and a part that depends on the CR energy supplied per SN (Ecr).
Note that this expression for pc, 0 is larger than its spherical counterpart used in Section 2 (equation 9) by a factor of 2. The difference is the surface area of a sphere (|$4 \pi r_0^2$|) versus that of the bottom and top of the disc (|$2 \times \pi r_0^2$|). We use the disc version in this section but our results are not sensitive to factor of 2 changes in pc, 0.
REFERENCES
APPENDIX A: LINEAR STABILITY
In this Appendix, we study the linear stability of the CR magnetohydrodynamic equations. Since the simulations are 1D, we restrict ourselves to 1D perturbations and also consider a local Cartesian approximation instead of the global spherical geometry used in Section 3. Physically, this system of equations admits longitudinal sound waves, in which both gas and CR pressure are the restoring force, as well as gas and CR entropy modes. In what follows, we show that ignoring background gradients, the two-moment CR system is linearly stable in the presence of cosmic ray diffusion. There is, however, an instability driven by a background cosmic ray pressure gradient that is present in the one-moment CR system (Drury & Falle 1986), i.e. the instability does not rely on the finite speed of light. We show, however, that this instability grows too slowly to be dynamically important in galactic winds, consistent with the laminar numerical solutions we found in Section 3. The only exception to this is if the gas sound speed is very low, as we show in Fig. A1.
A1 Instabilities of the two-moment system
We assume here that perturbations are ∝exp (− iωt + ikr) and that kH ≫ 1 (where H is a characteristic length-scale in the equilibrium state) so that a WKB analysis is appropriate. For now, we neglect the background gradients in the problem.
We reiterate that the rapid diffusion ordering used to derive equation (A6) is the appropriate one for our simulations in Section 3. The absence of any growing modes in equation (A6) is consistent with the numerical solutions which find laminar wind solutions.
A2 Instabilities of the one-moment CR system with background gradients
Instabilities of the one-moment CR system for a homogeneous background can be derived using the results in Section A1 by taking vM → ∞. The sound and entropy modes are both stable in this limit. Including background gradients in the calculation, however, leads to an instability of sound waves that was discussed by Drury & Falle (1986). We briefly summarize a derivation of this instability for completeness and then discuss its relevance to our galactic wind simulations. The Drury & Falle (1986) instability is present in the one-moment CR system and so we restrict our analysis to this limit for ease of algebra.
From equation (A14), the Drury & Falle (1986) instability is most likely to grow when ci is small and/or Vg is large (gravity is strong), both of which decrease the CR scale-height (equation 27). Indeed, we find that our simulation with the smallest value of the gas isothermal sound speed does show evidence of an instability. In this case (the first row in Table 1), we predict A(r) ≃ 0.5 near the base of the wind, and a somewhat larger value at the sonic point where cc is larger. Fig. A1 shows that there is indeed evidence of an instability that sets in at r ∼ 1.07 in this simulation. This may be a manifestation of the Drury & Falle (1986) instability. However, the instability in Fig. A1 sets in at radii well exterior to the sonic point and even exterior to where the flow speed equals the CR sound speed. We suspect that these are fluctuations generated by the Drury & Falle (1986) instability at small radii and advected out to large radii where they become non-linear due to conservation of wave action. Despite the large density fluctuations, however, the wind mass-loss rate and terminal velocity in this simulations are still well-described by the analytic solution in Section 2. We note that the resolution of the simulation in Fig. A1 decreases at r ≃ 1.14 due to a change in mesh refinement, which likely is responsible for suppressing the short wavelength fluctuations exterior to that radius.
