


ABSTRACT
Mapping the large-scale magnetic field in late F-type stars is important for understanding the nature of the stellar dynamo and the dynamics of thin outer convection zones. We use Zeeman Doppler Imaging to produce multi-epoch maps of the surface magnetic field for two mature late F-type stars: β Virginis (F9V) and θ Draconis (F8IV). We also provide a magnetohydrodynamic model for the stellar winds from the corona to the inner astrosphere, which exists in an environment at the hot end of habitability for exoplanets. Our results show that either simple or complex dynamo magnetic fields are present in mature late F-type stars, with shallow outer convection zones. The results of stellar wind modelling show the average space weather for β Vir at a distance of 1 au falls within the range of space weather conditions observed at Earth, while θ Dra produces a wind pressure an order of magnitude stronger than the Sun’s wind pressure.
1 INTRODUCTION
As part of our study of magnetism in F-type stars, we present surface magnetic maps for β Vir (F9V) and θ Dra, (F8IV) using Zeeman Doppler Imaging (ZDI), and provide a magnetohydrodynamic (MHD) model of their magnetospheres. ZDI (Semel 1989; Donati & Brown 1997; Donati et al. 2006b) is a powerful technique for studying stellar magnetism since it reconstructs both the location and orientation of surface magnetic features (Kochukhov 2016), and is suitable for both fast and slow rotators (Petit et al. 2008). This contrasts with brightness mapping using Doppler imaging (Deutsch 1958; Vogt & Penrod 1983; Vogt et al. 1987) which is best used for fast rotators with vsin i ≳ 20 km s−1 (Vogt 1988; Rice 2002). ZDI allows the strength, complexity, and axisymmetric nature of the large-scale magnetic field to be determined, including its poloidal, and toroidal components.
The large-scale magnetic field may be described in terms of the poloidal and toroidal components (Elsasser 1946; Chandrasekhar 1961), as well as the axisymmetric/non-axisymmetric and dipole/quadrupole/octupole and higher multipoles (Deutsch 1955; Piskunov & Kochukhov 2002; Donati et al. 2006b). For axisymmetric fields, the poloidal magnetic fields lie in the meridional plane, while toroidal fields have field lines which circle the axis (Elsasser 1956). Both components are expected to be present in stars over the long-term in order to provide magnetic stability, since purely toroidal or purely poloidal fields have been shown to be unstable (Prendergast 1956; Tayler 1973; Wright 1973). Describing the surface magnetic fields in terms of poloidal and toroidal components has been used in dynamo equations (Parker 1955; Backus 1958; Roberts & Stix 1971) and is useful in explaining how stars regenerate, and sustain, a dynamo magnetic field via the αΩ-effect (Parker 1979; Krause & Rädler 1980; Choudhuri et al. 1995; Moffatt & Dormy 2019).
F-star magnetic fields exist in shallow outer convection zones and may have different dynamo properties to solar-type stars (Giampapa & Rosner 1984). The observable effects of magnetism in F-stars differs from later spectral types, and includes strong differential rotation (Barnes et al. 2005a; Reinhold & Reiners 2013; Reinhold & Gizon 2015), weaker X-ray emission (Stern, Schmitt & Kahabka 1995; Lisse et al. 2017; Freund et al. 2020), weaker magnetic fields (Marsden et al. 2014), shorter magnetic cycles (Lopes et al. 2015; Mittag et al. 2019), and inefficiency in producing toroidal magnetic fields (Kitchatinov & Olemskoy 2011). F-stars also span a range of masses where rapid rotational braking occurs (Schatzman 1962; Skumanich 1972; Guedel, Guinan & Skinner 1997; Vidotto et al. 2014c) due to wind-driven angular momentum loss as a consequence of the onset of dynamo magnetic fields (Krause & Rädler 1980; Brandenburg & Subramanian 2005; Moffatt & Dormy 2019) in the outer convection zone. This magnetic braking results in a decrease in rotation from early to late F-stars (Gray 1988; Nielsen et al. 2013) coinciding with an increase in depth of the outer convection zone (Mullan 1972). The properties of stellar winds and the link with magnetic activity is poorly understood in cool stars (Johnstone et al. 2015b), therefore modelling of the stellar magnetosphere (Lammer & Khodachenko 2014; Alvarado-Gómez et al. 2020) is important for understanding how wind properties evolve on the main sequence, and has implications for the habitability of exoplanets (See et al. 2014; Johnstone et al. 2015a). Due to lifespans as short as one billion years, F-stars are considered the hottest stars which allow the possibility of exobiology to develop (Sato et al. 2014).
Relatively little information has been published on the nature of the vector magnetic field in F-stars. Mengel (2005) studied the young, fast rotating F8V star HR 1817 and found a weak complex radial magnetic field with a large rotational shear, which was different from that seen in G and K solar-type stars. The moderately rotating, and hot Jupiter hosting star, τ Boo (F7V) has been studied by several authors with the first magnetic map produced by Catala et al. (2007) who found a predominately poloidal field more complex than that of the Sun, and a high differential rotation rate. Mengel et al. (2016) found a very rapid 120 d chromospheric cycle that was broadly solar-type in contrast to other F-type stars. A chromospheric cycle of 120 d and magnetic cycle of 240 d was found by Jeffers et al. (2018) with the polarity flip of the large-scale magnetic field in phase with the chromospheric cycle. Morgenthaler et al. (2011) found a fast magnetic cycle of ∼3 yr on the slow rotating F9V star HD 78366 and a strong polar radial field and equatorial rotation period of 11.4 d. Fares (2013) presented a magnetic map for the moderately rotating star HD 179949 (F8V) which showed 90 per cent of the magnetic energy in the poloidal component, mainly radial. Waite et al. (2015) showed the young moderately rotating F8V star (HD 35296) contained a complex large-scale magnetic field with significant toroidal component and high level of differential rotation. A short magnetic cycle of 1.06 yr for the F7V star HD75332 was found by Brown et al. (2021), but only a single magnetic field reversal was detected from 12 magnetic map reconstructions over a 12-yr observation period. The authors speculate they may have missed the majority of polarity reversals due to the low frequency of observations. Further studies are needed for F-stars because exactly how the magnetic field topology changes across this spectral class remains to be determined.
In our previous paper (Seach et al. 2020), hereafter called paper I, we determined the longitudinal magnetic field of β Vir (+1.7 ± 0.5 G) and θ Dra (+7.4 ± 2.9 G); however, we were not able to determine if the field was a dynamo, or weak fossil field, from a single night’s observation. In this paper, we use ZDI to reconstruct the surface magnetic field of β Vir and θ Dra, and determine equatorial rotation period, differential rotation, and inclination of the rotational axis. We also present a MHD model of their magnetospheres. Maps of the large-scale magnetic field of F-type stars are important for understanding magnetism and convection in stars with thin outer convection zones, and provide input for models of the coronal magnetic field, and stellar winds. Since F-stars span a range of stellar masses where the transition from fossil to dynamo fields is expected to occur (Durney & Latour 1977; Seach et al. 2020), mapping the large-scale magnetic field will offer insight into the magnetic topology of stars with shallow outer convection zones, and constrain dynamo models.
2 OBSERVATIONS AND DATA REDUCTION
2.1 Target selection
β Vir and θ Dra were identified as magnetic stars in our earlier magnetic snapshot survey of F-type stars (paper I) and the original observations contained a sufficient number of spectra to allow this follow up paper reconstructing the large-scale surface magnetic field using ZDI (Section 3.2). Data were obtained as part of the BRITEpol survey (Neiner et al. 2017), which is a systematic spectropolarimetric survey of stars brighter than magnitude V = 4, which compliments the optical two-colour photometry collected by the BRITE-Constellation Nanosatellite Space Mission (Handler et al. 2017).
β Vir (HIP 57757) is a bright (V = 3.60) F9V star (Morgan & Keenan 1973), with an age of 3.1 ± 0.8 Gyr (Casagrande et al. 2011), metal rich ([Fe/H] = 0.24) (Jofré et al. 2018), and Teff 6083 ± 58 K (Jofré et al. 2018). It is a slow rotator with vsin i = 6.1 ± 2.6 km s−1 (Glebocki & Gnacinski 2005). β Vir is close to the end of its hydrogen burning phase, or just evolved off the main sequence (Eggenberger & Carrier 2006; North et al. 2009), and is located in a region of the HR diagram where the evolutionary tracks form a loop (Heiter et al. 2015). While β Vir has appeared in planet search programs (Wittenmyer et al. 2006) no exoplanet companion has been found. β Vir is a frequently studied star in the solar neighbourhood (Gehren 1978); however, the nature of its magnetic field is not well known.
θ Dra (HIP 78527) is a bright (V = 4.00), spectroscopic binary consisting of an F8IV primary (Pounds et al. 1991) and a late type secondary (Duquennoy & Mayor 1991; Mazeh et al. 2002) with a mass of 0.62 M⊙ (Tokovinin 2014) placing it later than spectral type K2. A possible third component was suggested by Mayor & Mazeh (1987) through analysis of radial velocity variations. θ Dra rotates unusually fast for a late F-type star with vsin i = 28.1 ± 0.1 km s−1 (Glebocki & Gnacinski 2005). It is a mature F-star with age = 2.1 ± 0.2 Gyr (Casagrande et al. 2011), based on Padova isochrones (Bertelli et al. 2008, 2009), a Teff = 6392 ± 63 K (Ramírez et al. 2012), and has been identified as an X-ray source by the Einstein observatory (Maggio et al. 1987).
2.2 Observations
Observations of β Vir and θ Dra were obtained between 2017 February 14 and June 18 using the NARVAL spectropolarimeter at the Telescope Bernard Lyot (TBL) at the Observatoire du Pic du Midi, France (Aurière 2003). NARVAL consists of a cross-dispersed, bench mounted, echelle spectrograph, with a wavelength coverage in a single exposure of 370–1050 nm with small gaps at 922.4–923.4, 960.8–963.6, and 1002.6–1007.4 nm. The full spectrum spans 40 grating orders from #22 in the red to #61 in the blue, with a resolving power of ≈68 000 when using the spectropolarimetric mode. The polarimeter consists of a quarter-wave and two half-wave Fresnel rhombs coupled to a Wollaston prism, which is composed of two perpendicular calcite prisms which produce achromatic polarization (Donati et al. 2006a). One stellar observation consists of four sub-exposures which are combined to produce the Stokes I, combined constructively to produce the V spectrum, and combined destructively to give the null spectrum where the Zeeman signature cancels out, and only non-magnetic effects remains in the profile (Semel, Donati & Rees 1993).
We obtained 47 polarized spectra of β Vir over 108 d between 2017 February 14 and April 24 spanning 7.5 rotation cycles. We obtained 105 polarized spectra of θ Dra over 73 d between 2017 April 06 and June 18, spanning 25.3 rotation cycles. On many nights we obtained multiple spectra for θ Dra, therefore individual LSD profiles were combined to produce nightly averages with higher SNR which were used as inputs for the ZDI code. The averaged LSD profiles were obtained over a time period covering less than 2 per cent of the stellar rotational period, and was considered a small enough time frame to avoid rotational smearing of the results. Using mean nightly LSD profiles did not change the magnetic map compared to using individual LSD profiles. A journal of observations for β Vir are shown in Table 1. A journal of nightly averaged observations for θ dra are shown in Table 2, and the full 105 observations are shown in Table A2.
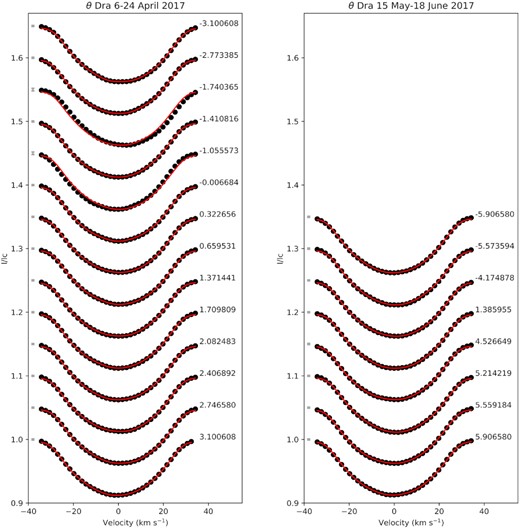
Stokes I maximum entropy fit for θ Dra. The black circles represent the observed signatures, while the red lines represent the modelled lines. The radial velocity range of the individual line profiles are shifted to the same range, and line profiles are separated vertically to allow better visibility. The 1.0σ error bars are shown on the left. The rotation cycle is shown on the right with the zero rotation cycle set to the mid JD of observations for each map and assumes Prot = 9.3 d for β Vir and Prot = 2.88 d for θ Dra. All figures are set to the same scale.
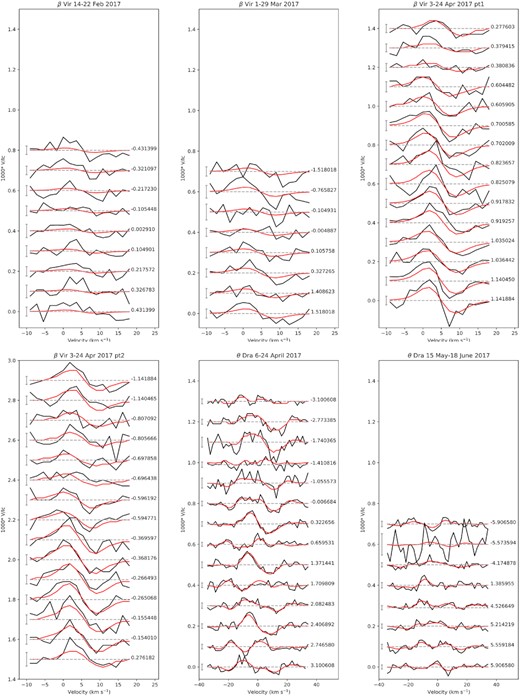
Stokes V maximum entropy fit for β Vir and θ Dra. The black lines represent the observed Zeeman signatures, while the red lines represent the modelled lines. The radial velocity range of the individual line profiles are shifted to the same range, and line profiles are separated vertically to allow better visibility. The 1.0σ error bars are shown on the left. The rotation cycle is shown on the right with the zero rotation cycle set to the mid JD of observations for each map and assumes Prot = 9.3 d for β Vir and Prot = 2.88 d for θ Dra. All figures are set to the same scale.
Journal of observations and magnetic detection for β Vir LSD profiles in 2017, showing date and time of the observation, Stokes I profile SNR, rotation cycle with respect to observations starting at HJD = 2457799.6214, radial velocity (RV), chromospheric activity (S-index and H α-index), longitudinal magnetic field (Bl), null value (Nl), and magnetic detection flag for the presence of a magnetic field in individual LSD profiles where D is a definite detection, M is marginal, and N is no detection. The Stokes V observations consist of a sequence of four subexposures as described in section. The RV is calculated using the centre of gravity method on the Stokes I profiles. The mean RV of our observations is 4.588 ± 0.013 km s−1. For magnetic mapping, we assume a constant RV of 4.6 km s−1.
| Date 2017 | HJD | SNR | Rot. | RV | S-index | H α-index | Bl | Nl | Det. |
|---|---|---|---|---|---|---|---|---|---|
| (local time) | 2450000+ | Stokes I | cycle | (km s−1) | (G) | (G) | N,M,D | ||
| Feb 14 | 7799.6214 | 534 | 0.000 | 4.54 | 0.162 | 0.275 | 1.3 ± 0.4 | 0.0 ± 0.4 | M |
| Feb 15 | 7800.6362 | 548 | 0.110 | 4.53 | 0.161 | 0.275 | 0.9 ± 0.3 | 0.1 ± 0.3 | N |
| Feb 16 | 7801.5917 | 548 | 0.214 | 4.52 | 0.162 | 0.275 | 0.5 ± 0.2 | 0.1 ± 0.2 | N |
| Feb 17 | 7802.6201 | 548 | 0.326 | 4.57 | 0.162 | 0.274 | 0.6 ± 0.3 | 0.3 ± 0.3 | N |
| Feb 18 | 7803.6170 | 543 | 0.434 | 4.54 | 0.162 | 0.275 | 0.9 ± 0.3 | −0.2 ± 0.3 | N |
| Feb 19 | 7804.5554 | 540 | 0.536 | 4.50 | 0.161 | 0.276 | 0.4 ± 0.3 | −0.4 ± 0.3 | N |
| Feb 20 | 7805.5919 | 516 | 0.649 | 4.60 | 0.160 | 0.275 | 0.4 ± 0.2 | 0.2 ± 0.2 | N |
| Feb 21 | 7806.5967 | 530 | 0.758 | 4.53 | 0.160 | 0.276 | 0.1 ± 0.2 | −0.2 ± 0.3 | N |
| Feb 22 | 7807.5591 | 526 | 0.863 | 4.58 | 0.162 | 0.275 | 1.4 ± 0.5 | 0.0 ± 0.5 | N |
| Mar 01 | 7814.5545 | 526 | 1.623 | 4.66 | 0.161 | 0.275 | 1.0 ± 0.3 | 0.0 ± 0.3 | M |
| Mar 08 | 7821.4747 | 493 | 2.375 | 4.63 | 0.162 | 0.275 | 3.0 ± 0.7 | 0.2 ± 0.7 | M |
| Mar 14 | 7827.5549 | 494 | 3.036 | 4.56 | 0.161 | 0.276 | 0.2 ± 0.3 | 0.1 ± 0.3 | N |
| Mar 15 | 7828.4753 | 563 | 3.136 | 4.57 | 0.159 | 0.276 | 0.3 ± 0.2 | 0.3 ± 0.2 | N |
| Mar 16 | 7829.4932 | 525 | 3.247 | 4.60 | 0.160 | 0.275 | 0.7 ± 0.2 | 0.2 ± 0.2 | N |
| Mar 18 | 7831.5311 | 529 | 3.468 | 4.62 | 0.157 | 0.273 | 0.8 ± 0.2 | −0.4 ± 0.2 | M |
| Mar 28 | 7841.4796 | 538 | 4.550 | 4.58 | 0.160 | 0.276 | 0.5 ± 0.2 | 0.3 ± 0.2 | N |
| Mar 29 | 7842.4860 | 554 | 4.659 | 4.59 | 0.160 | 0.276 | 1.3 ± 0.2 | 0.0 ± 0.2 | M |
| Apr 03 | 7847.3993 | 554 | 5.193 | 4.56 | 0.163 | 0.276 | 1.0 ± 0.2 | 0.1 ± 0.2 | D |
| Apr 03 | 7847.4124 | 543 | 5.195 | 4.55 | 0.163 | 0.276 | 1.6 ± 0.6 | 0.2 ± 0.6 | M |
| Apr 06 | 7850.4794 | 505 | 5.528 | 4.59 | 0.163 | 0.276 | 1.0 ± 0.6 | 0.2 ± 0.6 | N |
| Apr 06 | 7850.4925 | 512 | 5.529 | 4.58 | 0.164 | 0.276 | 0.8 ± 0.4 | −0.1 ± 0.4 | N |
| Apr 07 | 7851.4844 | 523 | 5.637 | 4.59 | 0.162 | 0.276 | 0.3 ± 0.2 | 0.1 ± 0.2 | N |
| Apr 07 | 7851.4974 | 521 | 5.639 | 4.59 | 0.163 | 0.276 | 1.6 ± 0.7 | 0.4 ± 0.7 | N |
| Apr 08 | 7852.4197 | 559 | 5.739 | 4.60 | 0.166 | 0.275 | 0.7 ± 0.2 | −0.3 ± 0.2 | N |
| Apr 08 | 7852.4328 | 561 | 5.740 | 4.61 | 0.166 | 0.275 | 0.6 ± 0.3 | 0.0 ± 0.3 | N |
| Apr 10 | 7854.5044 | 514 | 5.966 | 4.61 | 0.162 | 0.275 | 1.7 ± 0.4 | −0.2 ± 0.4 | D |
| Apr 10 | 7854.5174 | 499 | 5.967 | 4.61 | 0.163 | 0.275 | 2.4 ± 0.7 | −0.5 ± 0.7 | D |
| Apr 11 | 7855.4529 | 535 | 6.069 | 4.60 | 0.162 | 0.274 | 1.0 ± 0.2 | −0.3 ± 0.2 | D |
| Apr 11 | 7855.4660 | 522 | 6.070 | 4.60 | 0.162 | 0.275 | 2.0 ± 0.6 | 0.2 ± 0.6 | D |
| Apr 12 | 7856.4745 | 524 | 6.180 | 4.61 | 0.163 | 0.276 | 3.1 ± 0.6 | −0.4 ± 0.6 | D |
| Apr 12 | 7856.4878 | 518 | 6.181 | 4.62 | 0.164 | 0.276 | 1.1 ± 0.4 | −0.1 ± 0.4 | D |
| Apr 16 | 7860.4455 | 552 | 6.611 | 4.58 | 0.162 | 0.276 | 0.8 ± 0.3 | −0.2 ± 0.3 | D |
| Apr 16 | 7860.4586 | 555 | 6.613 | 4.58 | 0.163 | 0.276 | 0.9 ± 0.3 | 0.3 ± 0.3 | N |
| Apr 17 | 7861.3953 | 546 | 6.715 | 4.59 | 0.162 | 0.276 | 0.5 ± 0.2 | 0.0 ± 0.2 | M |
| Apr 17 | 7861.4083 | 559 | 6.716 | 4.59 | 0.161 | 0.276 | 0.3 ± 0.2 | −0.1 ± 0.2 | N |
| Apr 19 | 7863.4659 | 555 | 6.940 | 4.52 | 0.162 | 0.276 | 1.7 ± 0.6 | 0.4 ± 0.6 | N |
| Apr 19 | 7863.4790 | 552 | 6.941 | 4.52 | 0.161 | 0.277 | 0.9 ± 0.3 | −0.1 ± 0.3 | N |
| Apr 20 | 7864.3500 | 550 | 7.036 | 4.56 | 0.162 | 0.277 | 1.5 ± 0.3 | 0.2 ± 0.3 | D |
| Apr 20 | 7864.3631 | 553 | 7.037 | 4.56 | 0.162 | 0.277 | 1.4 ± 0.2 | 0.0 ± 0.2 | D |
| Apr 21 | 7865.4823 | 518 | 7.159 | 4.61 | 0.164 | 0.277 | 1.3 ± 0.3 | −0.4 ± 0.3 | M |
| Apr 21 | 7865.4954 | 518 | 7.160 | 4.61 | 0.164 | 0.277 | 2.7 ± 0.8 | 0.0 ± 0.8 | D |
| Apr 22 | 7866.3487 | 543 | 7.253 | 4.60 | 0.164 | 0.276 | 1.1 ± 0.5 | 0.1 ± 0.5 | D |
| Apr 22 | 7866.3618 | 555 | 7.254 | 4.60 | 0.164 | 0.276 | 1.3 ± 0.3 | 0.2 ± 0.3 | D |
| Apr 23 | 7867.4269 | 549 | 7.370 | 4.62 | 0.164 | 0.276 | 1.7 ± 0.3 | 0.3 ± 0.3 | D |
| Apr 23 | 7867.4399 | 553 | 7.372 | 4.62 | 0.163 | 0.276 | 1.2 ± 0.3 | 0.0 ± 0.3 | D |
| Apr 24 | 7868.3968 | 512 | 7.476 | 4.66 | 0.165 | 0.275 | 1.5 ± 0.2 | −0.1 ± 0.2 | D |
| Apr 24 | 7868.4100 | 512 | 7.477 | 4.66 | 0.164 | 0.275 | 1.8 ± 0.2 | −0.2 ± 0.2 | D |
Journal of observations and magnetic detection for θ Dra for the nightly averaged LSD profiles in 2017 showing date and time of the observation, number of spectra added for each mean LSD profile, Stokes I profile SNR, rotation cycle with respect to observations starting at HJD = 2457850.6525, radial velocity (RV), longitudinal magnetic field (Bl), null value (Nl), and magnetic detection flag for the presence of a magnetic field in the mean LSD profiles, where D is a definite detection, M is marginal, and N is no detection. Each Stokes V observation consists of a sequence of four subexposures. The RV is the mean and SD for each night. Table of observations for individual LSD profiles for θ Dra are shown in the Appendix.
| Date 2017 | HJD | No. of | SNR | Rot. | RV | Bl | Nl | Det. |
|---|---|---|---|---|---|---|---|---|
| (local time) | 2450000+ | spectra | Stokes I | cycle | (km s−1) | (G) | (G) | N,M,D |
| Apr 06 | 7850.6525 | 5 | 1280 | 0.00 | −31.65 ± 0.30 | 3.3 ± 1.2 | 1.1 ± 1.2 | N |
| Apr 07 | 7851.5949 | 5 | 1271 | 0.327 | −5.93 ± 1.25 | 1.8 ± 0.7 | 0.3 ± 0.7 | D |
| Apr 10 | 7854.5700 | 5 | 1271 | 1.360 | −10.55 ± 1.23 | 2.5 ± 0.7 | −0.4 ± 0.7 | D |
| Apr 11 | 7855.5191 | 5 | 1227 | 1.690 | 15.59 ± 0.30 | 0.9 ± 0.8 | −0.3 ± 0.8 | N |
| Apr 12 | 7856.5422 | 5 | 1263 | 2.045 | −25.32 ± 0.90 | 0.5 ± 0.5 | 0.2 ± 0.5 | D |
| Apr 15 | 7859.5630 | 5 | 1334 | 3.094 | −23.53 ± 1.00 | −0.5 ± 0.6 | −0.6 ± 0.6 | D |
| Apr 16 | 7860.5115 | 5 | 1313 | 3.423 | −20.13 ± 1.07 | 2.2 ± 0.7 | −0.4 ± 0.7 | D |
| Apr 17 | 7861.4817 | 5 | 1336 | 3.760 | 16.41 ± 0.12 | −1.4 ± 0.8 | 0.5 ± 0.8 | D |
| Apr 19 | 7863.5320 | 5 | 1320 | 4.472 | −22.36 ± 1.02 | 1.2 ± 0.9 | 0.2 ± 0.9 | D |
| Apr 20 | 7864.5065 | 5 | 1313 | 4.810 | 15.93 ± 0.24 | 1.0 ± 0.7 | −0.2 ± 0.7 | N |
| Apr 21 | 7865.5798 | 5 | 1265 | 5.183 | −18.27 ± 1.16 | −1.8 ± 0.9 | 0.3 ± 0.9 | M |
| Apr 22 | 7866.5141 | 5 | 1310 | 5.508 | −25.64 ± 0.86 | 1.1 ± 0.6 | −0.2 ± 0.6 | D |
| Apr 23 | 7867.4924 | 5 | 1318 | 5.847 | 14.82 ± 0.46 | 1.3 ± 0.8 | −0.1 ± 0.8 | D |
| Apr 24 | 7868.5120 | 3 | 950 | 6.201 | −11.60 ± 0.72 | −0.8 ± 0.7 | 1.0 ± 0.7 | D |
| May 15 | 7889.4685 | 5 | 1134 | 13.478 | 12.02 ± 0.70 | 1.2 ± 1.0 | −0.1 ± 1.0 | M |
| May 16 | 7890.4275 | 2 | 685 | 13.811 | −28.66 ± 0.24 | −12.6 ± 4.0 | 3.0 ± 4.0 | N |
| May 20 | 7894.4558 | 5 | 1346 | 15.209 | −12.43 ± 1.22 | −1.6 ± 0.8 | −0.2 ± 0.8 | N |
| Jun 05 | 7910.4710 | 5 | 1198 | 20.770 | 14.60 ± 0.48 | −1.6 ± 0.6 | 0.4 ± 0.6 | N |
| Jun 14 | 7919.5162 | 5 | 1138 | 23.911 | 10.16 ± 0.84 | −1.1 ± 0.8 | −1.2 ± 0.8 | N |
| Jun 16 | 7921.4964 | 5 | 1255 | 24.599 | −32.00 ± 0.23 | 0.2 ± 0.5 | 0.4 ± 0.5 | N |
| Jun 17 | 7922.4899 | 5 | 1291 | 24.944 | 6.50 ± 1.19 | −0.7 ± 0.9 | 0.9 ± 0.9 | D |
| Jun 18 | 7923.4904 | 5 | 1173 | 25.291 | 2.90 ± 1.13 | −1.4 ± 0.8 | −0.6 ± 0.8 | M |
2.3 Spectropolarimetric analysis
We reconstruct surface magnetic maps using circularly polarized spectra (Stokes V) and enhance the SNR by the line addition technique of least squares deconvolution (LSD; Donati et al. 1997; Kochukhov, Makaganiuk & Piskunov 2010). LSD analysis combines thousands of individual spectral lines into a single line with mean parameters and is useful in boosting the SNR in our F-stars that are expected to show weak magnetic fields (Marsden et al. 2014). Each observation consists of 4 x 223 s sub-exposures for β Vir and 4 x 320 s sub-exposures for θ Dra. The individual exposures are combined to produce an intensity profile (Stokes I), combined constructively to produce a circularly polarized profile (Stokes V), and combined destructively to give a null spectrum. The null spectrum acts as a check to ensure that spurious signals have not contaminated the spectrum. Examples of LSD profiles for β Vir and θ Dra are shown in Fig. 1. See paper I for more details on our spectropolarimetry and extraction of spectra.
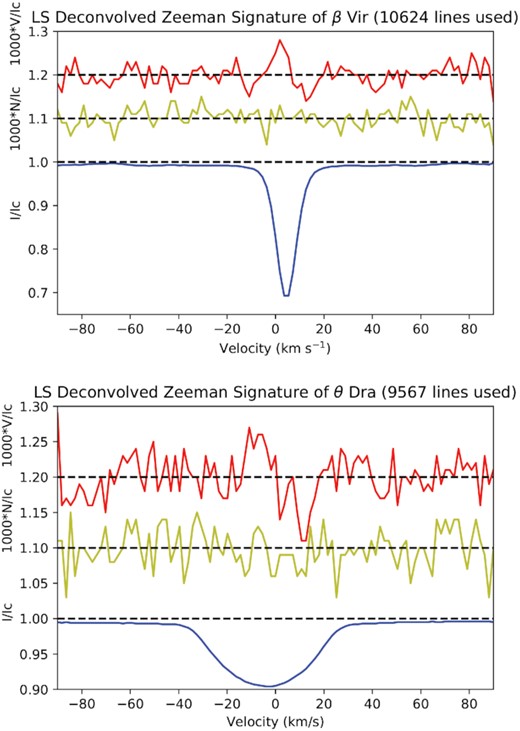
Example of LSD profiles (single spectra) for β Vir on 03 April 2017 (top), and θ Dra on 07 April 2017 (bottom). The upper line (red) shows the Stokes V profile (y-axis expanded by 1000 times and shifted up by 0.2 to allow better visibility). The middle line (yellow) shows the null profile (expanded by 1000 times and shifted up by 0.1), which is used as a check for any spurious signals contaminating the spectra. The lower line (blue) shows the Stokes I profile.
We determine the mean longitudinal magnetic field (Bl) for individual Stokes V and Null spectra as described in paper I. Bl is the line-of-sight magnetic field component averaged over the stellar disc (Babcock 1947; Schwarzschild 1950). The local magnetic field strength is larger than Bl that suffers from cancellation effects where regions of opposite polarity cancel out, resulting in as little as 5 per cent of the field being detected (Reiners & Basri 2009). Nevertheless, Bl has been a widely used measure of stellar magnetic field strength for many decades due to its relative ease of measurement and because it is measured from the strongest of the Stokes parameters (Stokes V). We use an additional method to determine the presence of a stellar magnetic field, the false alarm probability (FAP), which is a statistical method to determine if a magnetic signature is present in the Stokes V LSD profile or a spurious signal in the Null profile (Donati et al. 1992, 1997).
2.4 Radial velocity
The radial velocity (RV) is a basic stellar parameter (Lindegren & Dravins 2003) and is determined from the Stokes I profile for β Vir and θ Dra using the centre of gravity method (Uitenbroek 2003). The centre of gravity method finds the centroid of the area under an intensity line profile (Rees & Semel 1979) and is considered more accurate than applying a Gaussian fit to the intensity profile, especially for faster rotating stars (Dravins 1975). We use the RV as an input into the ZDI code (Section 3.2) and our determined values are shown in Tables 1, 2, and A2.
3 LARGE-SCALE MAGNETIC FIELD TOPOLOGY
3.1 Brightness map
Doppler Imaging (DI) is a tomographical technique used for mapping bright and dark regions on the surface of a star associated with magnetic activity (Vogt & Penrod 1983; Vogt et al. 1987; Rice et al. 1989; Piskunov & Kochukhov 2002; Rice 2002). We use DI to produce a brightness map for θ Dra to identify regions of enhanced magnetic activity. We are unable to create a brightness map for β Vir, since it rotates too slowly to enable DI to be used. The input parameters for DI are the same as derived for ZDI described in (Section 3.2). The DI code we use (zdipy) is the same as described in Folsom et al. (2018), which inverts the Stokes I LSD profiles using the maximum entropy fitting routine of Skilling & Bryan (1984) to produce a regularized fit to the data which maximizes entropy and minimizes χ2. The output of DI produces a map of the stellar surface which we set to show both bright and dark areas compared to the quiet photosphere corresponding to starspots and plages. The rotation cycle for each LSD profile is determined from ZDI using the zero rotation phase as the first observation date for each map. The Stokes I maximum entropy fits for θ Dra from DI is shown in Fig. A1, where we plot the observed signatures and modelled lines. The plot allows a visualization of the agreement between observations and model prediction.
3.2 Magnetic maps
We use ZDI to reconstruct the large-scale magnetic field topology of β Vir and θ Dra using the same ZDI code described above for DI, except for magnetic mapping we use a time-series of Stokes V profiles rather than Stokes I profiles. While there are a large number of possible solutions to the inverse problem of reconstructing a magnetic map from Stokes V LSD profiles, a unique map is achieved by imposing a number of criteria. One criteria is to minimize the sum of χ2 of the model fit of the observations. Secondly, we choose the maximum entropy method (Jaynes 1957a, b) that maximizes the Shannon entropy of Hobson & Lasenby (1998), derived from Skilling & Bryan (1984). The Stokes V data are used to reconstruct the magnetic maps of the radial azimuthal and meridional fields (Piskunov & Kochukhov 2002), using the spherical harmonics expansion of the surface magnetic field (Donati et al. 2006b) that allows the strength of the various field modes determined. The magnetic maps are represented using spherical harmonics. Each map comprises an orthogonal sum of components representing simple oscillations on the sphere. The expansion is parametrized by the degree ℓ, ranging from 1 to ℓmax, and the order m, ranging from 0 to ℓ. The degree (ℓ) governs the total number of oscillations over the sphere for the spherical harmonics expansion (Ismail-Zadeh & Tackley 2010), so that higher values of ℓ correspond to smaller-scale features on the reconstructed magnetic field. ℓmax is the maximum degree of spherical harmonics expansion used in the magnetic map reconstruction and ℓmax thus determines the resolution of the magnetogram (Gerth & Yu 2004); however, the resolution is limited in low vsin i stars (Morin et al. 2010). The order (m) can be considered the number of zeros of the spherical harmonic component in the longitudinal direction (Ismail-Zadeh & Tackley 2010). It also determines if the field is axisymmetric (m = 0) or non-axisymmetric (m > 0) (Saikia et al. 2016).
The quantities derived from ZDI are the mean unsigned magnetic field (Bmean), maximal field strength over stellar surface (Bmax), the fraction of the large-scale magnetic energy reconstructed in the poloidal and toroidal field components, the fraction of the magnetic energy in the dipolar (ℓ = 1), quadrupolar (ℓ = 2), octopolar (ℓ = 3), and higher (ℓ > 3) components. The fraction of the magnetic energy in the axisymmetric field component (m = 0), as well as the axisymmetry of the poloidal and toroidal fields are determined which gives an indication of the degree of alignment of the magnetic field with the rotation axis (Lehmann et al. 2019). We calculate the maximum degree of spherical harmonic expansion (ℓmax) by running ZDI over a range of ℓ values and find the value at the point where no more energy is contained in the higher multipoles. For β Vir, we use ℓmax = 10, and for θ Dra ℓmax = 20. For θ Dra, we use the brightness map as an input into the ZDI code to account for suppression of the Zeeman signal in dark spots (Gregory et al. 2010; Johnstone et al. 2010; Morgenthaler et al. 2012; Kochukhov et al. 2017).
Using the stellar parameters estimated by the method above, we then determine optimal values and uncertainties for vsin i, inclination, Prot, and dΩ using the entropy landscape method (Petit et al. 2002). For each stellar parameter, we use ZDI to perform a search across a range of stellar parameter values at a fixed χ2 of 1.0, and find the map with the corresponding maximum entropy. This entropy value is then used as an input into a further search using a fixed entropy and variable χ2, producing an output of χ2 versus stellar parameter. We then fit a Gaussian curve to the results and choose the optimal value as the minimum of the Gaussian curve, and the formal 1σ uncertainties are found from the Gaussian curve χ2 statistics. The optimal stellar parameter derived from both the fixed χ2 search and fixed entropy search are similar, which adds to the robustness of our results. The values for Prot and dΩ are further estimated from a grid search described in more detail in Section 3.3. The vsin i for β Vir was taken from Glebocki & Gnacinski (2005), since χ2 minimization did not produce a well-defined minimum.
Limitations of ZDI relating to missing information due to axial tilt and only reconstructing the large-scale magnetic field are disused in more detail elsewhere; see for example Gregory et al. (2010), Johnstone et al. (2010), Morgenthaler et al. (2012), and Kochukhov et al. (2017). Despite some limitations, ZDI remains a powerful technique for reconstructing the surface magnetic field in both cool and hot stars (Kochukhov 2016).
3.3 Differential rotation
Differential rotation (dΩ) is one of the key ingredients for creating a large-scale stellar dynamo, whereby non-uniform rotation generates a toroidal field from a poloidal field and helical turbulence recreates the poloidal field (Parker 1955; Steenbeck & Krause 1969; Gilman 1980). A detailed analysis of dΩ is essential for understanding the magnetic activity of the stars (Donahue et al. 1996). While dΩ can be directly measured on the surface of the Sun through sunspot tracing (Kambry & Nishikawa 1990; Beck 2000), different methods must be used to determine stellar surface dΩ due to the inability to directly resolve the stellar surface.
We also provide an estimate of uncertainty in dΩ by producing a variation ellipse which encompasses all the values and 1σ uncertainties generated by individually varying stellar parameters and determining the corresponding dΩ and Ωeq pairs. The parameters varied for β Vir are vsin i (± 2.6 km s−1), inclination angle (± 2 deg), and χ2 aim (± 0.05), for θ Dra vsin i (± 0.2 km s−1), inclination angle (± 2 deg), and χ2 aim (± 0.05). The individual error bars indicate the 1σ errors of a Gaussian fit to the χ2 landscape.
4 CHROMOSPHERIC ACTIVITY INDICATORS
4.1 S-Index
We investigate presence of chromospheric cycles by applying a generalized Lomb-Scargle (GLS) periodogram (Zechmeister & Kürster 2009) to a time series of our S-index measurements for β Vir and θ Dra. The results are plotted as power versus frequency where the height of the peak is a measure of the goodness of fit of a sine curve to the data. We also calculate the FAP (Baluev 2008; Zechmeister & Kürster 2009) that quantifies the probability of the maximum peak being produced by a signal without a periodic component (VanderPlas 2018). The most likely period is chosen as the peak with the smallest FAP (Baliunas et al. 1995), although it is possible for more than one significant peak to be present which may indicate multiple magnetic cycles (VanderPlas 2018). A detection is considered excellent when FAP is ≤10−9, good 10−9 to ≤10−5, fair 10−5 to ≤10−2, and poor 10−2 to ≤10−1 (Baliunas et al. 1995). The GLS periodogram takes into account measurement errors by introducing weighted sums (Gilliland & Baliunas 1987; Irwin et al. 1989), and a floating mean (Cumming et al. 1999), which allows for statistical fluctuation in the mean. The GLS periodogram is considered more suitable for small numbers of observations, with uneven sampling, and cases where the period is greater than the length of observations (Zechmeister & Kürster 2009). Discussion of our S-index and magnetic cycle determinations are found in (Section 6.5).
4.2 H α Index
5 STELLAR WIND MODELLING
The stellar wind models for β Vir and θ Dra are created using the Alfvén Wave Solar Model (Sokolov et al. 2013; van der Holst et al. 2014) of the Space Weather Modelling Framework (Tóth et al. 2005, 2012) to solve the two-temperature MHD equations along with equation describing the Alfvén wave propagation, reflection, and dissipation along magnetic field lines. We model the wind in two partially overlapping three-dimensional regions. The inner region uses a spherical grid that is irregular in the radial direction; far away from the star the radial spacing is logarithmic, while more radial grid points are added near the star using the methodology of Oran et al. (2013). The outer region uses a Cartesian grid. The wind model covers the regions between the chromosphere and the inner astrosphere, and includes a physical model of the transition region in which the wind is heated to coronal temperatures by Alfvén wave energy emanating from deeper stellar layers, resulting in a Poynting flux |$\Pi _{\small {A}}\propto |\boldsymbol{\mathbf {B}}|$| at the inner model boundary. Other heat exchange and cooling terms are also included as they are necessary (Roussev et al. 2003) to reproduce the slow-fast wind bimodality. The radiative cooling is given by Qrad = NiNeΛ(Te) where the rate of cooling curve Λ(Te) is calculated using the CHIANTI data base (Landi et al. 2013) and Solar elemental abundances.
The radial component of the boundary magnetic field is fixed to the local magnetogram value in Figs 2 and 3. The surface parallel components of the magnetic field varies freely as the MHD solution evolves towards a steady state. The outgoing Alfvén wave energy density at the inner boundary is |$(\Pi _{\small {A}}/B)\sqrt{\mu _0 \rho }$|. The model and boundary conditions are similar to the ones in Evensberget et al. (2021); i.e. Solar values are used for the chromospheric base temperature and density, the Poynting flux-to-field ratio, the turbulence transverse correlation length and the Coloumb logarithm (see Table 3). The last three of these parameters control the supply of Alfvén wave energy, the Alfvén wave dissipation rate, and the rate of ion-electron heat exchange respectively. These values have been chosen to reproduce observed Solar conditions, see Sokolov et al. (2013), van der Holst et al. (2014). The simulation is stepped forward until a steady state is reached, in which the magnetic and hydrodynamic forces are in balance.
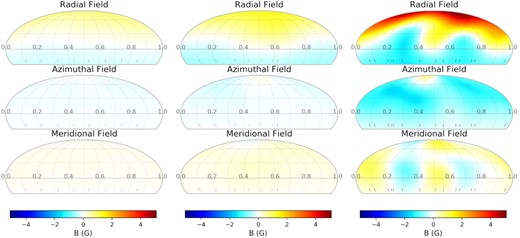
Reconstructed magnetic maps using ZDI for β Vir (F9V) at three epochs in 2017. Figure on left uses observations from February 14 to 22. Middle: March 1–29. Right: April 3–24. The rotational phases of the three maps are aligned with zero rotation phase set to MJD = 2457799.62139 (February map), MJD = 2457827.55489 (March map), and MJD = 2457854.5174 (April map). Tick marks at bottom of figure represent phase of individual observations. The colour bar at bottom indicates the magnetic field strength in Gauss.
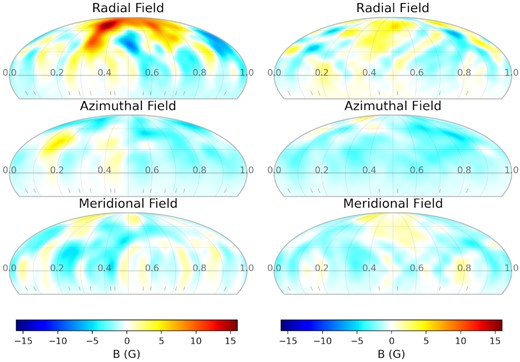
Reconstructed magnetic maps using ZDI for θ Dra at two epochs in 2017. The map at left spans observations from April 6 to 24. The map at right spans observations from 15 May to 18 June. The rotational phases of the two maps are aligned with the zero phase set to MJD = 2457861.4817 (April map) and MJD = 2457910.4710 (May–June map). Tick marks at bottom of figure represent phase of individual observations. The colour bar at bottom indicates the magnetic field strength in Gauss.
Parameters for β Vir (2017 April 3–24) and θ Dra ( 2017 April 6–24) derived from the maximum-entropy image reconstructions, wind modelling inputs, and magnetic cycle determination using GLS periodogram of S-index. All parameters are from this work except where marked. ZDI determined parameters use Stokes V data except where marked and include χ2 minimization and Ωeq versus dΩ grid search.
| Parameter | β Vir | θ Dra |
|---|---|---|
| zdi determined parameters | ||
| Inclination (deg) (χ2 min) | 36 ± 2 | 37 ± 2 |
| vsin i (km s−1) (χ2 min) | 6.1 ± 2.6a | 28.1 ± 0.2 |
| Prot (d) (χ2 min) | 9.2 ± 0.2b | 2.88 ± 0.02 |
| Prot (d) (grid search) | 9.1 ± 0.4 | 2.88 ± 0.02 |
| dΩ (rad d−1) (χ2 min) | 0.21 ± 0.02 | 0.18 ± 0.02 |
| dΩ (rad d−1) (grid search) | 0.23 ± 0.09 | 0.18 ± 0.03 |
| Eq-pole lap time (d) | |$29.9^{+3.1}_{-2.6}$| | |$34.9^{+4.4}_{-3.9}$| |
| S-index cycle | ||
| No. observations | 49 | 105 |
| Observation baseline (d) | 68 | 73 |
| Cycle length (d) | 83 ± 14 | 43 ± 2 |
| No. cycles observed | 0.8 | 1.7 |
| FAP | <10−3 | <10−9 |
| Wind model input | ||
| Stellar mass (M⊙)c | 1.13 | 1.17 |
| Stellar radius (R⊙)c | 1.75 | 2.67 |
| Wind model parameter | Value | |
| Chromospheric base temperature, Tchr | |$5 \times 10^{4}\, \mathrm{K}$| | |
| Chromospheric base density, nchr | |$2 \times 10^{17}\, \mathrm{m}^{-3}$| | |
| Poynting flux-to-field ratio, |$\Pi _{\small {A}}/B$| | |$1.1 \times 10^{6} \, \mathrm{Watt\, m^{-2}\, T^{-1}}$| | |
| Turbulence trans. corr. length, |$L_\perp \sqrt{B}$| | |$1.5 \times 10^{5}\, \mathrm{m\, T^{1/2}}$| | |
| Coulomb logarithm, |$\Lambda _{\small {C}}$| | 20 | |
6 RESULTS
6.1 Magnetic maps for β Vir
The large-scale magnetic field topology for β Vir at three epochs derived using ZDI is shown in Fig. 2. The stellar parameters used to construct the map are vsin i = 6.1 km s−1, inclination = 36 deg, and dΩ = 0.19 rad d−1. The spherical harmonics expansion is limited to ℓmax = 10, since no further magnetic energy in higher multipoles was found by increasing ℓ further, and the chosen value of χ2 for β Vir and θ Dra is 0.95. The data sets comprise 9 LSD profiles between 2017 February 14–22, 8 LSD profiles between 2017 March 1–29, and 30 LSD profiles between 2017 April 3–24. We divide observations into three subsets in order to reduce the effects of magnetic field evolution on the final maps, while providing adequate phase coverage to produce a reliable magnetic map. The April map uses more LSD profiles due to the more intensive sampling for that epoch and splitting the data into two maps using a smaller number of LSD profiles does not provide any significant changes in the resulting maps with increased magnetic field complexity still visible in the April β Vir map.
The radial field for β Vir shows a relatively simple structure in February and March 2017, while slightly stronger and more complex in April 2017. The increase in magnetic field strength and complexity of the April 2017 map is not an artefact of the larger number of LSD profiles used in the magnetic map reconstruction but appears to be a real change in the surface magnetic field. We verified this by creating a magnetic map using a subset of 8 LSD profiles, and showed that the April map contained the same maximum and mean magnetic field as the reconstruction using 30 LSD profiles. The simple radial field topology may partly be due to a low vsin i of 6.1 km s−1 where the resolution of a map produced by ZDI is dependent on the number of resolved surface elements (Morin et al. 2010). At all three epochs the radial magnetic field is very dipolar, with a single region of positive field in the Northern hemisphere and negative field in the Southern hemisphere. The magnetic field remains very dipolar despite the moderate differential rotation, a feature which was also seen in the F7V star τ Boo (Donati et al. 2008). The azimuthal field is predominantly negative at all epochs with only a small positive region visible near the north pole. The meridional field is mostly positive with a small region of negative field near the north pole.
The complexity of the magnetic field for β Vir is quantified by calculating the fractional strengths of the magnetic field components (Table 5). Most of the magnetic energy for β Vir is stored in the poloidal field (82–98 per cent) while between 2 and 18 per cent of the magnetic energy is toroidal. The high percentage of poloidal field in β Vir is consistent with the finding of Petit et al. (2008) and Jouve, Brown & Brun (2010) who find stars with rotation periods slower than ∼12 d contains predominantly poloidal magnetic fields. The dominant term in the spherical harmonics expansion for β Vir in the three magnetic maps is the dipole (ℓ = 1) with 73–91 per cent of the magnetic energy. The second largest spherical harmonics term is the quadrupole (ℓ = 2) with 8–18 per cent of the magnetic energy. The octupolar and higher components contain less than 7 per cent of the magnetic energy. The poloidal field is predominantly axisymmetric (80–97 per cent) while the toroidal field is also mainly axisymmetric (85–98 per cent). The uncertainties in magnetic quantities are derived by varying the stellar parameters over the 1σ errors for each individual parameter, and taking the extreme values of the results as the variation. The parameter ranges used are inclination (± 2 deg), vsin i (± 2.6 km s−1), Prot (± 0.4 d), dΩ (± 0.09 rad d−1), and target χ2 (± 0.05) (see Table 5).
6.2 Brightness maps for θ Dra
The reconstructed brightness maps for θ Dra are shown in Fig. 4. The maps are comprised of 14 LSD profiles between 6–24 April 2017 and 8 LSD profiles between 15 May and 18 June 2017. The fast rotation of θ Dra (vsin i = 28.1 km s−1) allows us to use Doppler Imaging to produce brightness maps for two epochs. The brightness maps show both bright and dark areas on the stellar surface compared to the average photospheric brightness at the same latitude (Petit et al. 2017). The dark areas correspond to cooler regions on the surface of the star which are likely associated with starspots (Berdyugina 2005; Strassmeier 2009) and are regions of enhanced magnetic activity which suppresses convection, creating cooler, darker regions on the stellar surface (Chugainov 1966; Vogt 1975, 1983). The brighter regions are thought to correspond to plages which are formed in the upper layers of the stellar atmosphere and are regions of enhanced magnetic activity (Linsky 1983).
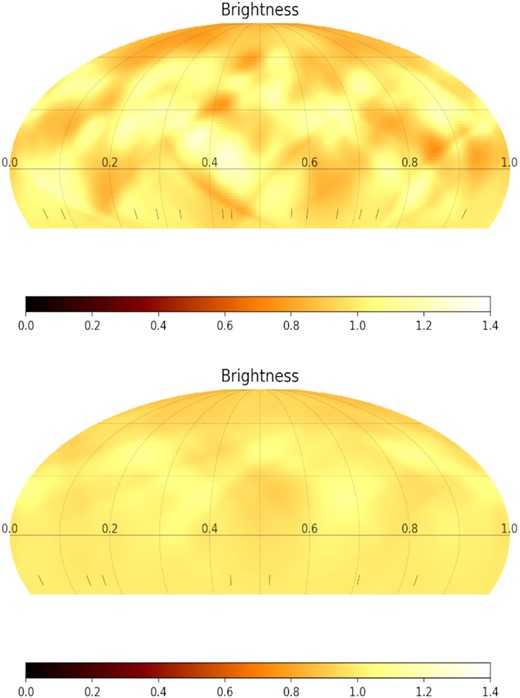
Brightness map for θ Dra at two epochs in 2017. Observations of the top Fig span from 2017 April 6–24. Bottom: Observations span from 2017 May 15 to June 18. The rotational phases of the two maps are aligned with the zero phase set to MJD = 2457861.4817 (April map) and MJD = 2457910.4710 (May–June map). The colour bar at bottom indicates the pixel brightness on a linear scale, where a value of 1.0 represents the quiet photosphere, values less than one are cool spots and values greater than one are bright spots.
The April 6–24 map for θ Dra shows the presence of both lighter and darker areas that are smaller and more numerous compared with the 15 May–18 June map. This may be due to the larger number of profiles used in constructing the April 6–24 map, which results in better resolution of the surface features. We see a large dark patch at the north polar region on both maps. Similar dark polar regions have been found on other F-stars; see for example one component of σ2 CrB, F6V (Strassmeier & Rice 2003), AF Lep, F8V (Marsden et al. 2006a), and τ Boo, F7V (Fares et al. 2009). The presence of a polar spot on θ Dra and other rapid rotators has been described by Schüssler & Solanki (1992) as being the result of a dominance of Coriolis force over buoyancy in the dynamics of magnetic flux tubes. This results in rising flux tubes following a path nearly parallel to the axis of rotation and erupting at higher latitudes. Our brightness maps for θ Dra are used an input for the ZDI reconstruction of the magnetic maps.
6.3 Magnetic maps for θ Dra
The reconstructed magnetic maps for θ Dra are shown in Fig. 3. The maps are comprised of 14 LSD profiles between 2017 April 6 and 24 and 8 LSD profiles between 2017 May 15 and June 18. The stellar parameters used to construct the map are vsin i = 28.1 km s−1, inclination = 37 deg, and dΩ = 0.18 rad d−1. The spherical harmonic expansion is limited to ℓmax = 20, since no further detail is obtained with higher degrees. The large polar spot on the brightness maps (Fig. 4) corresponds to regions of enhanced radial field in the magnetic maps (Fig. 3). The magnetic map for θ Dra in 2017 April has a stronger average magnetic field (2.5 ± 0.2 G) and larger S-index (0.2085 ± 0.0019) compared to 2017 May–June map (Bmean = 1.9 ± 0.2 G, S-index = 0.2029 ± 0.0023) (Fig. 3 and Table 4) which also corresponds to the brightness map with the more complex structure. These observations are consistent with θ Dra being more magnetically active in 2017 April compared with 2017 May and June, which indicates θ Dra contains a dynamo magnetic field due to its changing strength over time.
Stellar parameters for β Vir and θ Dra in 2017 determined from our ZDI analysis including 1σ uncertainties. All values are determined using Stokes V data except where marked.
| Star | Obs | No. | Incl | vsin i | Prot | dΩ | S-indexa | H α-indexa |
|---|---|---|---|---|---|---|---|---|
| Epoch | Rot. | LSD | Using χ2 min | Using χ2 min | ||||
| cycles | profiles | (deg) | (km s−1) | (d) | (rad d−1) | (mean) | (mean) | |
| β Vir Feb 14–22 | 0.9 | 9 | b | c | b | b | 0.1613 ± 0.0006 | 0.2752 ± 0.0005 |
| β Vir Mar 1–29 | 3.0 | 8 | b | c | b | b | 0.1604 ± 0.0008 | 0.2753 ± 0.0010 |
| β Vir Apr 3–24 | 2.3 | 30 | 36 ± 2 | c | 9.2 ± 0.4 | 0.21 ± 0.02 | 0.1623 ± 0.0011 | 0.2760 ± 0.0006 |
| θ Dra Apr 6–24 | 6.2 | 14 | 37 ± 2 | 28.1 ± 0.2 | 2.88 ± 0.02 | 0.18 ± 0.02 | 0.2085 ± 0.0019 | 0.2856 ± 0.0008 |
| θ Dra May 15–Jun 18 | 11.8 | 8 | 41 ± 2d | 28.1 ± 0.2 | 2.93 ± 0.02d | 0.21 ± 0.02d | 0.2029 ± 0.0023 | 0.2842 ± 0.0011 |
Determined from Stokes I data. bFor these inclination values χ2 minimization does not produce a well-defined minimum, therefore we use the parameters from the April 3–24 map. cvsin i of 6.1.1 ± 2.6 used from Glebocki & Gnacinski (2005). dFor the θ Dra 15 May–18 June map, we use the parameters determined from April 6–24 map, since it is reconstructed using a larger number of LSD profiles.
At both epochs the magnetic maps for θ Dra show a strong region of positive radial field at the north polar region, while the mid-northern latitudes shown a mix of positive and negative regions. The azimuthal field is predominantly negative at both epochs with only a small positive regions near the north pole, and a larger region of positive field at mid northern latitudes in April 2017. The meridional field at both epochs contain a mix of positive and negative areas. The complexity of the magnetic field for θ Dra as described by fraction of the large-scale magnetic energy reconstructed in various components is shown in Table 5. The largest terms in the spherical harmonics expansion for θ Dra are dipole (ℓ = 1) with 19–20 per cent of the magnetic energy. The second largest spherical harmonics term is the quadrupole (ℓ = 2) with 14–18 per cent of the magnetic energy, followed by octupolar (ℓ = 3) with 11–16 per cent of magnetic energy. θ Dra has a large amount of magnetic energy stored in the higher multipoles (ℓ > 3) with values ranging from 47 to 55 per cent, which is consistent with a complex dynamo magnetic field.
Fraction of the large-scale magnetic energy reconstructed in the poloidal and toroidal field components for β Vir (2017) and θ Dra (2017). The quantities derived from ZDI are the mean unsigned magnetic field (Bmean), maximal field strength over stellar surface (Bmax), the fraction of the large-scale magnetic energy reconstructed in the poloidal and toroidal field components, the fraction of the magnetic energy in the dipolar (ℓ = 1), quadrupolar (ℓ = 2), octopolar (ℓ = 3), and higher (ℓ > 3) components, the fraction of the magnetic energy in the axisymmetric field component (m = 0), as well as the axisymmetry of the poloidal and toroidal fields. The uncertainties are derived by varying the stellar parameters over the 1σ errors for each individual parameter, and taking the extreme values of the results as the variation. The parameter ranges used for β Vir are: inclination (± 2 deg), vsin i (± 2.6 km s−1), Prot (± 0.4 d), dΩ (± 0.09 rad d−1), and target χ2 (± 0.05). The parameter ranges used for θ Dra are: inclination (± 2 deg), vsin i (± 0.2 km s−1), Prot (± 0.02 d), dΩ (± 0.02 rad d−1), and target χ2 (± 0.05).
| Star | Bmean | Bmax | Pol | Tor | Dipolar | Quad. | Oct. | (ℓ > 3) | Axisym. | Axi-pol | Axi-tor |
|---|---|---|---|---|---|---|---|---|---|---|---|
| (G) | (G) | (% tot) | (% tot) | (% pol) | (% pol) | (% pol) | (% pol) | (% tot) | (% pol) | (% tor) | |
| β Vir 14–22 Feb | |$0.3^{+0.3}_{-0.0}$| | |$0.7^{+1.0}_{-0.0}$| | |$98^{+2}_{-0}$| | |$2^{+0.0}_{-2}$| | |$90^{+1}_{-2}$| | |$9^{+1}_{-1}$| | |$1^{+0}_{-0}$| | |$0^{+0}_{-0}$| | |$97^{+0}_{-5}$| | |$97^{+0}_{-5}$| | |$98^{+0}_{-16}$| |
| β Vir 1–29 Mar | |$0.5^{+0.1}_{-0.1}$| | |$1.3^{+0.1}_{-0.1}$| | |$98^{+0}_{-0}$| | |$2^{+0}_{-0}$| | |$91^{+1}_{-2}$| | |$8^{+2}_{-1}$| | |$1^{+1}_{-0}$| | |$0^{+0}_{-0}$| | |$94^{+1}_{-2}$| | |$94^{+1}_{-8}$| | |$87^{+9}_{-4}$| |
| β Vir 3–24 Apr | |$1.6^{+0.2}_{-0.1}$| | |$4.9^{+1.8}_{-1.0}$| | |$82^{+4}_{-10}$| | |$18^{+10}_{-4}$| | |$73^{+5}_{-8}$| | |$18^{+3}_{-2}$| | |$6^{+4}_{-2}$| | |$3^{+2}_{-1}$| | |$81^{+3}_{-12}$| | |$80^{+4}_{-15}$| | |$85^{+2}_{-6}$| |
| θ Dra 6–24 Apr | |$2.5^{+0.2}_{-0.2}$| | |$16.2^{+1.0}_{-1.0}$| | |$84^{+1}_{-1}$| | |$16^{+1}_{-1}$| | |$19^{+1}_{-1}$| | |$18^{+1}_{-1}$| | |$16^{+0}_{-1}$| | |$47^{+2}_{-2}$| | |$38^{+2}_{-3}$| | |$38^{+2}_{-4}$| | |$38^{+3}_{-2}$| |
| θ Dra 15 May–18 Jun | |$1.9^{+0.2}_{-0.2}$| | |$7.7^{+0.8}_{-0.7}$| | |$56^{+2}_{-1}$| | |$44^{+1}_{-2}$| | |$20^{+1}_{-2}$| | |$14^{+4}_{-2}$| | |$11^{+1}_{-1}$| | |$55^{+13}_{-6}$| | |$48^{+1}_{-1}$| | |$26^{+3}_{-2}$| | |$76^{+1}_{-1}$| |
The amount of energy contained in higher multipoles for θ Dra compared to β Vir is most likely determined by its faster rotation and therefore the number of resolved surface elements (Morin et al. 2010). An increase in surface resolution results in an ability to reconstruct smaller scale magnetic features and therefore higher multipoles. The uncertainties in magnetic quantities are derived by varying the stellar parameters over the 1σ errors for each individual parameter, and taking the extreme values of the results as the variation. The parameter ranges used are inclination (± 2 deg), vsin i (± 0.2 km s−1), Prot (± 0.02 d), dΩ (± 0.02 rad d−1), and target χ2 (± 0.05) (see Table 5).
6.4 Differential rotation
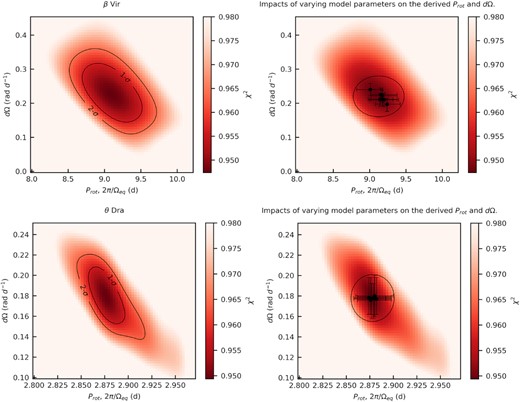
Figures at left: Surface differential rotation contour plot for β Vir 2017 April 3–24 (top) and θ Dra 6–2017 April 24 (bottom) with 1σ, and 2σ confidence contours marked with black lines. From the χ2 landscape we determine the rotation period at the 1σ level of β Vir as 9.1 ± 0.4 d and θ Dra 2.88 ± 0.02. The dΩ for β Vir is 0.23 ± 0.09 rad d−1 and θ Dra 0.18 ± 0.03 rad d−1. Figures at right: Surface differential rotation using χ2 minimization landscape of Stokes V profiles for β Vir (top) and θ Dra (bottom). The variation ellipse is generated by individually varying stellar parameters and determining the corresponding Ωeq and dΩ pairs. The parameters varied for β Vir are vsin i (± 2.6 km s−1), inclination angle (± 2 deg), and χ2 aim (± 0.05), for θ Dra vsin i (± 0.2 km s−1), inclination angle (± 2 deg), and χ2 aim (± 0.05). The individual error bars indicate the 1σ errors of a Gaussian fit to the χ2 landscape.
6.5 Chromospheric emission
6.5.1 S-index
The S-index determinations for β Vir over the 83 d observation period are shown in Table 1. The S-index varies from 0.1593 to 0.1658 that indicates the star is only showing weak chromospheric activity. The S-index range during our observation period is within the range of values for β Vir published in the literature of 0.138–0.186 (Pace 2013). A plot of the S-index versus rotational phase for β Vir (Fig. 6) shows a possible difference between the three epochs of observations, and the map with the highest S-index (April 3–24) corresponds to the map with the largest mean magnetic field strength (Fig. 7). The S-index determinations for θ Dra are shown as nightly means in Table 2, while the full 105 observations are shown in Table A2. The S-index variation over the observation period of 73 d is from 0.1990 to 0.2144 which indicates the star is showing strong chromospheric activity. Our S-index values for θ Dra are within the published range of 0.164–0.271 by Pace (2013) and indicates the star displays a large range of chromospheric activity. A plot of the S-index versus rotational phase for θ Dra (Fig. 6) shows a difference between the two epochs of observations, and the map with the highest S-index (April 6–24) corresponds with the largest mean magnetic field strength (Fig. 7). The higher S-index for θ Dra compared to β Vir is consistent with observations (Pallavicini et al. 1981) that a faster rotating star is more likely to produce stronger magnetic activity.
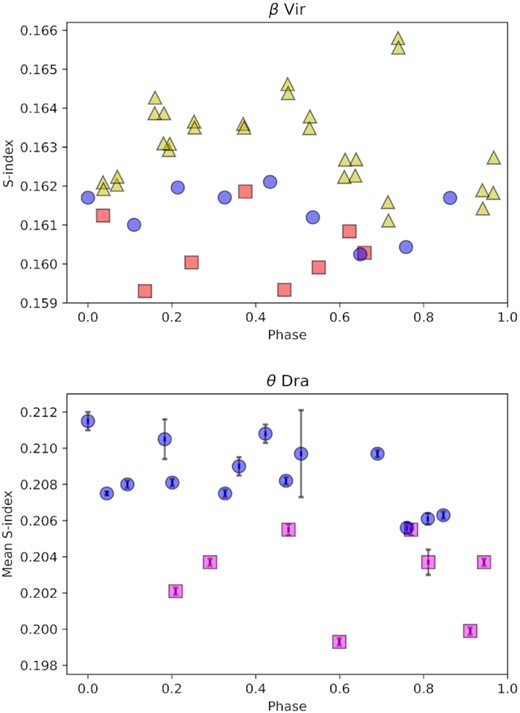
Top: S-index versus rotational phase for β Vir (top). Blue circle indicates data from 2017 February 14 to 22. Red squares indicates data from 2017 March 1 to 29 . Yellow triangle indicates data from 2017 April 3 to 24. The data hint at a possible difference between the three epochs; however, there is no significant difference between the mean S-index of each epoch (see Fig. 7). Bottom: Nightly averaged S-index versus rotational phase for θ Dra. Blue circles indicate data from 2017 April 6 to 24. Pink squares represent data for 2017 May 15 to June 18. The map with the strongest mean magnetic field (see Fig. 7) has a significantly higher S-index.
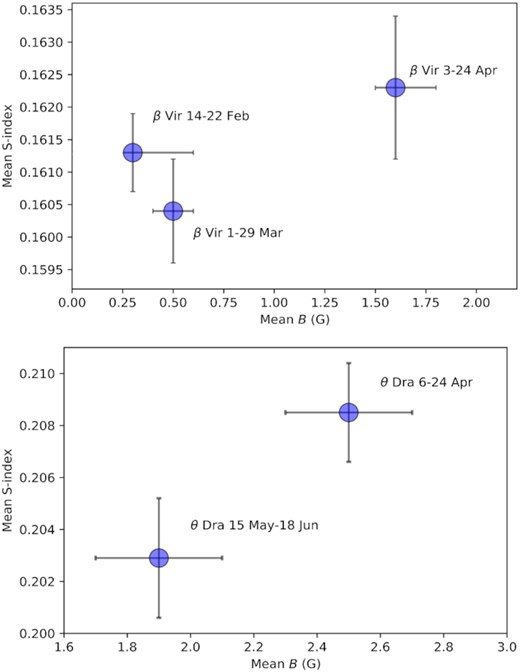
Mean S-index versus mean magnetic field strength (from ZDI) for β Vir (top) and θ Dra (bottom). There is no significant difference between the mean S-index of the 3 maps for β Vir, while there is a significantly larger mean magnetic field strength for the April map. For θ Dra there is a significantly larger mean S-index for the April map that coincides with stronger magnetic field strength (Table 5).
6.5.2 Chromospheric activity cycles
Results of our GLS periodogram search for chromospheric activity cycles for β Vir and θ Dra are shown in Table 3 and Fig. 8. Since nightly observations may lead to a window function which can create a signal in the periodogram (VanderPlas 2018), we need to look for its presence in our data. We calculate a window function for both stars by applying a Lomb–Scargle periodogram to the data while setting the S-index values to unity. For β Vir, we find a window function with a period of 688 d. Since the window function is much larger than the observation baseline, it does not have a significant effect on the chromospheric cycle period determination for β Vir. For θ Dra, we find a window function with a period of 729 d which is a possibly an harmonic of the highest peak found in the power versus frequency plot that shows the highest peak corresponding to a period of 183 d. We can possibly discount this peak as being an artefact of the nightly observations; however, in Fig. 8, we plot a sine curve with a period of 183 d since this appears to fit the S-index data better than a period of 43 d. On the power versus frequency plots there are no peaks coinciding with the Prot for β Vir of 9.2 d, (f = 0.109), and 2.88 d (f = 0.347) for θ Dra; therefore, we did not remove any rotational signal from the periodograms.
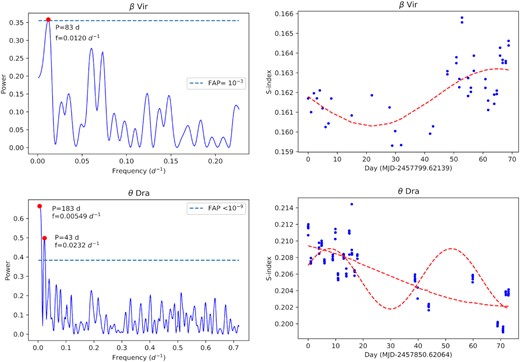
Chromospheric cycle determinations for β Vir 2017 (top) and θ Dra 2017 (bottom) applying a GLS periodogram a time-series of S-index measurements. The figures at left show the power versus frequency and FAP, with the highest peaks marked with a red circle, and text describes the associated period and frequency. The dashed horizontal line represents a FAP of <10−3 for β Vir and <10−9 for θ Dra. The figures at right show individual S-index measurements shown with blue circles. The red dashed curves indicate the fitted cycle using a GLS periodogram, and assumes a strictly periodic sine curve with a period of 83 d for β Vir. For θ Dra both 183 d and 43 d sine curves are plotted. The figures at right have the zero day set to the first date of S-index measurements for each star.
We estimate a chromospheric cycle of 83 ± 14 d for β Vir by applying a GLS periodogram to 49 S-index values over a period of 68 d from 06 January 2017 to 24 April 2017. A FAP of <10−3 indicates the detection is considered fair. For θ Dra, we apply a GLS periodogram to 105 S-index values over a period of 73 d from 2017 April 06 to 2017 June 18. We see two peaks with a FAP ≤ 10−9. The peak corresponding to a cycle length of 43 ± 2 d is chosen as the possible chromospheric cycle length since the highest peak is discounted as an observational artefact as described above. Since we have a short baseline of observation of S-index for β Vir of 69 d (0.8 chromospheric cycles), and for θ Dra 73 d, which is 0.4 or 1.7 cycles (depending on which cycle length is chosen), we can only consider our determination of chromospheric activity cycles for the two stars as a lower limit. A longer baseline of S-index measurements is needed to verify these short cycles.
Our chromospheric activity cycles compared with other F-stars are shown in Fig. 9 and Table A1. The chromospheric cycle periods of 83 ± 14 d for β Vir and 43 ± 2 d for θ Dra are potentially shorter than cycles for other F-stars with published values ranging from 109 d for CoRoT 102780281 (F8V) determined by photometry (Lopes et al. 2015), and 120 d for τ Boo from chromospheric emission (Mengel et al. 2016), to a maximum of 21 yr for KIC 5955122 (F9V) determined by photometry (Bonanno et al. 2014). The older Mt Wilson survey data (Baliunas & Vaughan 1985; Baliunas et al. 1995) may have missed short cycles in some F-stars. The previous biasing of data towards longer chromospheric cycles may be hinted at from Fig. 9, where generally longer cycle lengths are visible in the older data.

Chromospheric cycle determined from S-index for β Vir and θ Dra versus Teff compared with 30 F-stars from the literature. Data from Mt Wilson survey papers (Baliunas & Vaughan 1985; Baliunas et al. 1995) are shown in light blue, which may have missed short cycles for F-stars. β Vir data is shown as yellow triangle (period 83 ± 14 d) and θ Dra data are shown as pink square (43 ± 2 d). The dashed grey trend line and orange 95 per cent confidence intervals are shown. No significant trend observed. The data are shown in Table A1.
6.5.3 H α index
Along with emissions in the core of Ca ii H and K lines and Ca ii triplet lines λ8498, 8542, 8662, the H α-index is one of the best indicators of stellar activity in solar-type stars (Gray & Corbally 2009). In Fig. 10, we show a plot of S-index and H α-index for both β Vir and θ Dra. We see a weak correlation between the two measures of chromospheric activity for β Vir with a Pearson correlation coefficient of r = 0.31, while there is a stronger correlation for θ Dra with correlation coefficient of r = 0.63. The correlation between S-index and H α-index for β Vir and θ Dra is consistent with the trend found in G and K-type stars by Zarro (1983), where the H α absorption increases with Ca ii K strength. We find θ Dra has a larger H α index compared to β Vir and this trend has been observed in K, G, and F stars by Cram & Giampapa (1987), where the strength of the photospheric absorption line increases with increasing Teff. The increased scatter observed in the S-index for β Vir compared to θ Dra may be due to the low values measured for β Vir which range from 0.159 to 0.166 and may contain a lower relative SNR.
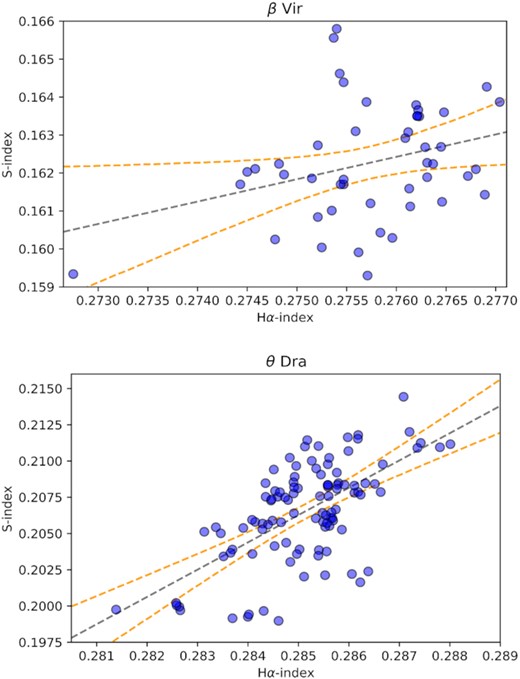
Individual S-index versus individual H α index for β Vir (top) and θ Dra (bottom). The dashed grey trend line and orange 95 per cent confidence intervals are shown. Significant trend observed for both plots with a Pearson correlation coefficient of r = 0.31 for β Vir and r = 0.63 for θ Dra. These plots indicate the correlation between S-index versus individual H α index holds for late F-stars.
6.6 Bl versus rotational phase
The nightly average of Bl versus rotational phase for β Vir is shown in Fig. 11. The figure indicates there is no significant change in Bl between the three maps. There is a large scatter in Bl during 2017 April, which is not accounted for by a magnetic field evolution over the two rotational cycles of observations. This was checked by separating the Bl observations into different rotational cycles and observing that the scatter in Bl remained. The scatter in Bl for β Vir in April 2017 is possibly due to the more complex nature of the magnetic field geometry and the location of the fields on the visible surface during an observation may lead to more or less cancellation effects. The nightly average of Bl versus rotational phase for θ Dra is shown in Fig. 11, which also indicates there is no significant difference in Bl between the two maps.
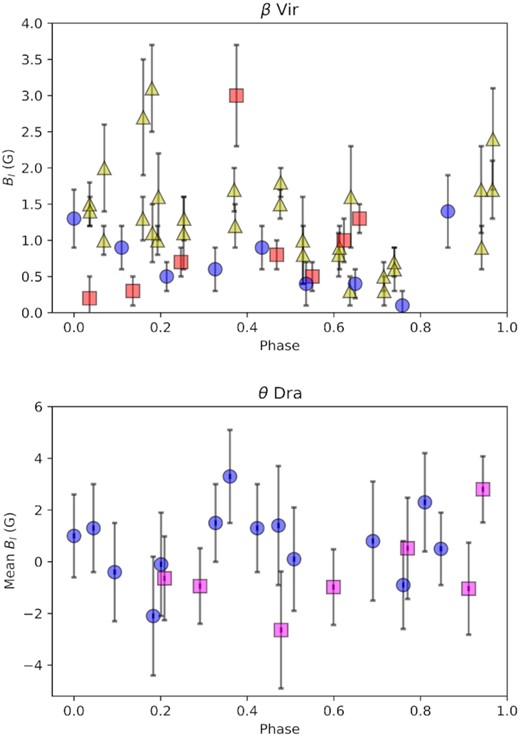
Bl versus rotational phase for β Vir (top) and θ Dra (bottom). Symbols are the same as Fig. 6. There is no significant difference between the means within the data set for each star. The Bl observations for θ Dra with a mean Bl of −13.1 ± 5.1G at rotation phase 0.811 was cropped from the figure to allow better visibility of data. This value with large errors was caused by cloud interference resulting in an V mag extinction ∼3.
A possible reason no difference in Bl is observed between the two epochs for θ Dra, while the mean S-index for magnetic maps show a significant difference, is that Bl suffers from cancellation effects from regions of opposite polarity, which does not occur for the S-index. We also find that unlike Bl, the calculation of Bmean using ZDI does show a significant difference between the two maps. This difference may be explained by the reduced amount of flux cancellation that occurs when calculation Bmean using ZDI in faster rotating stars (Lehmann et al. 2019) where θ Dra is a reasonably fast rotator with vsin i = 28.1 km s−1. Another possible reason for the lack of visible change in Bl between the two θ Dra maps is that the error bars are a similar magnitude to Bl.
6.7 Stellar wind modelling
The coronal magnetic field structure when the wind model has reached as steady state is shown in Fig. 12. The mostly dipolar surface magnetic field of β Vir (see Fig. 2) produces a region of closed magnetic field lines surrounding the surface Br = 0 line, and two regions of open field lines around the north and south magnetic poles. The alignment of the magnetic dipole appears to vary somewhat between the February 14–22 observations and the other two. The region of closed field lines appears smaller for the Febuary 14–22 observation, where the magnetic field is at its weakest. The more complex surface magnetic field geometry of θ Dra (see Fig. 3) gives rise to a similarly complex coronal field; no clear dipolar structure is visible in the coronal field. At both epochs, θ Dra exhibits a large, uniform region of open field lines in the lower hemisphere; this is likely caused by the ZDI regularization in unobservable regions of the star past ∼140○.
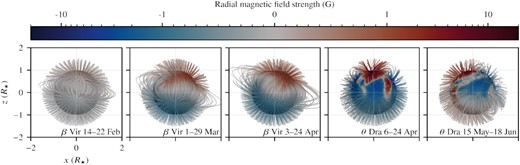
Coronal field structure and radial field strength for the wind model. The open field lines are truncated at two stellar radii. The stellar surface and the field lanes are coloured according to the local radial magnetic field strength. Note that the colour scale is linear from −1 G to 1 G and logarithmic outside of this range. β Vir, which occupies the three leftmost panels, exhibits a typical dipolar coronal field at all three epochs. A strengthening of the surface field may be observed between the first epoch February 14–22 and the second epoch March 1–29. The increase in field strength is accompanied by an increase in the size of the regions of closed magnetic field lines. θ Dra exhibits similar magnetic field strengths at both epochs. The change in polarity around the south pole region of the star can be seen between April 6–24 and May 15–Jun 18.
The wind accelerates as it flows away from the star, and eventually the wind speed exceeds the Alfvén wave speed |$v_{\small {A}}= B / \sqrt{\mu _0 \rho }$| (Alfvén 1942). The surface where this first occurs is shown in Fig. 13. The wind states, as it crosses this Alfvén surface determines the stellar angular momentum loss, as the surface functions as an effective lever arm (Schatzman ) increasing the torque effected by the wind upon the star. The xz plane and the Alfvén surface are coloured by the local wind speed. A two-lobed Alfvén surface develops for β Vir at all three epochs; this is typical for a dipole-dominated magnetic field. θ Dra exhibits an irregular Alfvén surface; this is associated with a more complex magnetic field. Fig. 13 also shows the current sheet (Schatten 1972), which we characterize by the radial magnetic field Br changing sign. The inner current sheet of β Vir appears quite flat but with slightly varying inclinations (see Table 6). The current sheet of θ Dra has multiple kinks and undulations, reflecting the complex magnetic geometry.
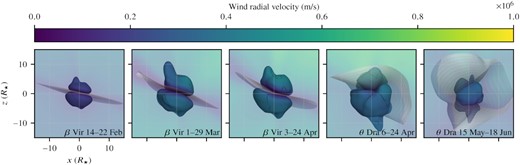
Alfvén surface and inner current sheet. The z-axis coincides with the stellar axis of rotation, and we show the inner current sheet edge-on to emphasize the two-lobed structure of the Alfvén surface. The Alfén surface and the plane of sky (i.e. the xz plane) is coloured according to the wind radial velocity ur. The current sheet is truncated at 30R⋆. β Vir exhibits a two-lobed Alfvén surface at all three epochs. An increase of the average Alfvén radius and of the current sheet inclination is seen between February 14 and 22 and the two other epochs, see the aggregate quantities in Table 6. The complicated magnetic field geometry of θ Dra gives rise to a multi-lobed Alfvén surface at both epochs. A decrease in the average Alfvén radius is observed between April 6–24 and May 15–June 18.
Overview of the wind aggregates quantities considered. Φ0 is the absolute amount of magnetic flux exiting the stellar surface, Φopen/Φ0 is the fraction of Φ0 contained in open field lines, Sopen/S is the fraction of the stellar surface area where the field lines are open, |$i_{B_r=0}$| is the angle between the inner current sheet and the stellar axis of rotation; this corresponds to the dipole inclination for a dipolar magnetic field, Φaxi/Φopen is the axisymmetric open flux fraction, |$R_{\small {A}}$| is the distance to the Alfvén surface averaged over the stellar surface, |$|\boldsymbol{\boldsymbol {r}}_{\small {A}}\times \boldsymbol{\boldsymbol {\hat{z}}}|$| is the torque arm length at the Alfvén surface averaged over the stellar surface, |$\dot{M}$| is the stellar mass-loss, |$\dot{J}$| is the stellar angular momentum loss, |$P_{\small {W}}^{\oplus }$| is the average wind pressure for an Earth-like planet at 1 au, and Rmag/Rp is the magnetospheric stand-off distance in Earth radii for an Earth-like planet.
| Case | Φ0 | Φopen | Sopen | |$i_{B_r=0}$| | Φaxi | |$R_{\small {A}}$| | |$|\boldsymbol{\boldsymbol {r}}_{\small {A}}\times \hat{z}|$| | |$\dot{M}$| | |$\dot{J}$| | |$P^{\oplus }_{\small {W}}$| | Rmag |
|---|---|---|---|---|---|---|---|---|---|---|---|
| (Wb) | (Φ0) | (S) | (○) | (Φopen) | (R⋆) | (R⋆) | |$\left(\mathrm{kg\, s}^{-1}\right)$| | |$\left(\mathrm{N\, m}\right)$| | (Pa) | (Rp) | |
| β Vir 14–Feb 22 | 2.9 × 10+14 | 0.86 | 0.56 | 13.6 | 0.90 | 4.3 | 3.3 | 8.8 × 10+8 | 1.2 × 10+23 | 1.0 × 10⁻⁹ | 11.1 |
| β Vir 1– Mar 29 | 1.3 × 10+15 | 0.66 | 0.32 | 24.5 | 0.82 | 6.1 | 4.7 | 4.2 × 10+9 | 1.1 × 10+24 | 4.9 × 10⁻⁹ | 8.6 |
| β Vir 3– Apr 24 | 1.6 × 10+15 | 0.68 | 0.37 | 23.0 | 0.81 | 6.4 | 4.9 | 5.4 × 10+9 | 1.5 × 10+24 | 6.1 × 10⁻⁹ | 8.3 |
| θ Dra 6– Apr 24 | 7.7 × 10+15 | 0.81 | 0.32 | 30.2 | 0.69 | 6.5 | 5.0 | 2.5 × 10+10 | 4.2 × 10+25 | 3.4 × 10⁻⁸ | 6.2 |
| θ Dra May 15–Jun 18 | 3.8 × 10+15 | 0.90 | 0.35 | 82.1 | 0.34 | 4.6 | 3.6 | 2.0 × 10+10 | 1.8 × 10+25 | 1.6 × 10⁻⁸ | 7.1 |
The wind pressure in the stellar equatorial plane is shown in Fig. 14. The non-uniformity of the coronal field creates regions of varying wind pressure as the wind density and acceleration is affected by local differences in the magnetic field. The stellar rotation shapes these regions into spirals. The dipolar coronal field of β Vir creates two spiral co-rotating interaction regions (CIRs) of locally overdense wind, while the θ Dra cases are more complex, showing up to four spiral CIRs. The faster rotation of θ Dra creates a more tightly wound spiral in comparison to β Vir.
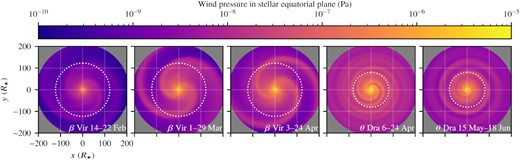
Wind pressure in the star’s equatorial plane from the corona to the inner astrosphere. The dotted circle corresponds to an orbital distance of 1 au. The dipolar magnetic field of β Vir gives rise to two spiral ‘arms’ of overdense wind. These co-rotating interaction regions (CIRs) form when regions of fast, tenuous wind collide with regions of slower, denser wind. The complex field of θ Dra gives rise to multiple CIRs; for the April 6–24 epoch these CIRs persist past 1 au, while the CIRs appear to coalesce into a single spiral at the May 15–June 18 epoch.
The wind models permit the calculation of a range of wind-related parameters; we give some of these parameters in Table 6. The surface magnetic flux Φ0 is the total magnetic flux emerging from the stellar surface, and the open magnetic flux fraction Φopen is the fraction of Φ0 that extends past the Alfvén surface. This parameter has been studied by Vidotto et al. (2014a) and Réville et al. (2015a, b) as a proxy for wind mass loss and angular momentum loss. A related parameter is the open surface fraction Sopen, which quantifies the fraction of the stellar surface from which open magnetic field lines emanate. The current sheet inclination |$i_{B_r}$| gives a quantitative indication of the tilt of the current sheet and Alfvén surface lobes relative to the stellar axis of rotation. The axisymmetric magnetic flux fraction modulates the amount of galactic cosmic rays in the vicinity of the star (see Wang, Sheeley Jr & Rouillard 2006; Vidotto et al. 2014b). The average Alfvén surface |$R_{\small {A}}$| and the torque-averaged Alfvén surface |$|\boldsymbol{\boldsymbol {r}}_{\small {A}} \times \boldsymbol{\boldsymbol {\hat{z}}}|$| are used in lower-dimensional models and empirical scaling laws, e.g. Weber & Davis (1967), Mestel (1984), Kawaler (1988), and Finley & Matt (2018). A more detailed description of the calculation of these parameters is described in Evensberget et al. (2021).
The wind mass-loss |$\dot{M}$| and the wind angular momentum loss is calculated by integrating the flux across the Alfvén surface. The Alfvén surface is chosen for its uniqueness, but the quantities could also be calculated across a spherical surface giving similar results. The |$\dot{M}$| values of β Vir increase from 1–4 times the average solar wind mass loss rate of |$\dot{M}_\odot = 1 \times 10^{9}\, \mathrm{kg\, s}^{-1}$| (e.g. Wood 2004; Mishra et al. 2019), while the angular momentum loss |$\dot{J}$| increases from about 1–5 times the average solar values of |$2 \times 10^{23}\, \mathrm{N\, m}$| (Finley et al. 2019) between the first observation and the last two observations. The biggest change occurs between February 14–22 and March 1–29. θ Dra is does not exhibit as much variation as β Vir; the |$\dot{M}$| values only change by 25 per cent, while the |$\dot{J}$| changes by a factor of about 2. θ Dra’s large radius of 2.67R⊙ and rapid rotation of 2.88 d means that this star is not quite Sun-like. The numerical model used has mainly been validated for the solar case so some caution should be taken in interpreting θ Dra’s |$\dot{M}$| values which range from 20 to 25 |$\dot{\rm M}_\odot$| and |$\dot{J}$| values which range from 90 to 240 |$\dot{\rm J}_\odot$|, although it can be expected that this large, rapidly rotation star should have high values for both |$\dot{M}$| and |$\dot{J}$|. Compared to the 86 G sub-giant of Ó Fionnagáin et al. (2021) our mass-loss values are lower, and our angular momentum loss values are significantly lower. This is however to be expected due to the sensitivity of |$\dot{J}$| to the magnetic field strength.
We also include the wind pressure for an Earth-like planet at 1 au and the magnetospheric stand-off distance for an Earth-like planet; these quantities permit comparison to the local Earth space weather. The wind pressure is dominated by the wind radial velocity, |$P_\text{w} \approx \rho u_r^2$|. The magnetospheric stand-off distance is calculated from a pressure balance argument similar to Vidotto et al. (2009). The wind pressure and stand-off distance at β Vir is comparable to Earth conditions, where the wind pressure varies from ∼0.1 nPa to ∼10 nPa (King & Papitashvili 2005). The conditions at θ Dra are characterized by more powerful winds; however, they are still comparable to the strong Solar wind conditions when the Sun is at Solar maximum.
7 DISCUSSION
A detailed understanding of surface magnetism and space weather surrounding mature late F-stars has been lacking in the literature, and our study provides an insight into magnetism in stars with thin outer convection zones. The reconstructed surface magnetic maps for β Vir and θ Dra allow us to compare dynamo magnetic fields in fast and slowly rotating late F-stars. The large-scale magnetic topology for the slowly rotating β Vir is relatively simple, and is mostly poloidal and dipolar. The surface field shows some changes between the three epochs and is slightly more complex in the 2017 April 3–24 map, compared with the two earlier maps, which is possibly partly due to a more complete rotational phase coverage of the map. The relatively simple magnetic structure is most likely a dynamo magnetic field due to the changing topology and varying amount of magnetic energy contained in the spherical harmonic modes between epochs. Both the maximum and mean magnetic field strength is significantly larger in the April 3–24 map compared to the two earlier maps, which is also consistent with a dynamo magnetic field present for β Vir.
The magnetic maps for the faster rotating θ Dra show more complex magnetic field topology than β Vir, which may be partly due to a greater surface resolution produced by ZDI for faster rotating stars, and also may be due to faster rotation which drives a stronger and more complex dynamo (Noyes et al. 1984; Pizzolato et al. 2003). θ Dra also has a greater mean magnetic field strength than β Vir due to a higher vsin i, where a strong correlation exists between vsin i and magnetic activity for late F-stars (Wolff et al. 1986) and other cool stars (Noyes et al. 1984). θ Dra has more magnetic energy stored in the toroidal field compared to the slower rotating β Vir, which is consistent with finding by Petit et al. (2008) and Jouve et al. (2010) where the proportion of toroidal energy increases with rotation rate.
F-stars are expected to show faster dΩ compared to cooler stars. Our determinations of dΩ for β Vir (F9V) and θ Dra (F8IV) are smaller than 0.50 ± 0.12 rad d−1 for τ Boo (F7V) (Donati et al. 2008) and comparable to the 0.25 rad d−1 for HD75332 (F7V) (Brown et al. 2021). This is consistent with the trend of increasing dΩ with increasing Teff (Kitchatinov & Rüdiger 1999b; Barnes et al. 2005a; Küker & Rüdiger 2005a; Reiners 2006; Marsden et al. 2006b; Collier Cameron 2007; Marsden et al. 2011; Waite et al. 2011). Both β Vir and θ Dra have similar dΩ despite their large differences in vsin i of 28.1 ± 0.2 km s−1 and 6.1 ± 0.2 km s−1, respectively. Our results are consistent with findings that dΩ only shows a weak correlation with rotation (Hall 1991; Donahue et al. 1996; Messina & Guinan 2003; Reiners & Schmitt 2003b; Barnes et al. 2005a; Küker & Rüdiger 2005a; Reinhold, Reiners & Basri 2013).
There is evidence that dΩ can vary over short and medium time-scales (Cameron & Donati 2002; Donati et al. 2003; Marsden, Carter & Donati 2005; Barnes et al. 2005b; Yu et al. 2019). We do not detect a change in dΩ for β Vir from 2017 February–April, which may be partly due to its slow rotation (vsin i = 6.1 ± 0.2 km s−1), resulting in a reduced spatial resolution of the stellar surface by ZDI, resulting in larger uncertainties in dΩ determination (Fig. 5). Similarly, no change is observed in dΩ for θ Dra between 2017 May–June, even with an increased spatial resolution of the surface compared to β Vir due to its faster rotation (vsin i = 28.1 ± 0.2 km s−1). The lack of change in dΩ shows a repeatability in our measurements, which often can be difficult to reliably measure.
Another measure of photospheric shear is the equator-pole lap time (Donati & Cameron 1997), which is an absolute value measuring the time for the equatorial region to lap the pole, and is often used as an indicator of dynamo efficiency (Reiners & Schmitt 2003a). This value measures the lap time in days 1/dΩ rather than the relative term Ω/dΩ that measures the lap time in rotation cycles (Donati & Cameron 1997) and is a useful comparison of surface shear between stars. We determine equator-pole lap times of |$29.9^{+3.1}_{-2.6}$| d for β Vir and |$34.9^{+4.4}_{-3.9}$| d for θ Dra (Table 3), which are both shorter than the 130 d for the Sun (Reiners & Schmitt 2003b). The short lap times in our late F-stars is consistent with the trend that equator-pole lap time decreases with increasing Teff (Barnes et al. 2005a). Similar short equator-pole lap times have been shown in other F-stars, for example; HD 67483 (F3V, lap time 5.7 d) (Reiners & Schmitt 2003b), τ Boo (F7V, lap time 12 d) (Donati et al. 2008), and HD 75332 (F7V, lap time 25 d) (Brown et al. 2021).
The discovery of short magnetic cycles in F-stars has occurred more recently. For example, τ Boo was originally found to have a magnetic cycle 11.6 ± 0.5 yr (Baliunas et al. 1995), but more recently Mengel et al. (2016) found a very short cycle of 120 d. Using re-analysed Mt Wilson Ca ii H& K data, Olspert et al. (2018) found magnetic cycles for 10 F-type stars with periods ranging from 3.6 to 16.6 yr. These are longer than our magnetic cycle determination for β Vir and θ Dra, but are mostly shorter than the solar value of approximately 11 yr (Charbonneau 2014). Calculations using mixing-length theory by Belvedere et al. (1980) have predicted magnetic cycles for a G5 star is 9.5 yr and decreases to 0.88 yr for an F5, which is roughly consistent with the literature values shown in Fig. 9.
The short observation baseline for our S-index measurements of approximately 0.8 cycles for β Vir and 0.4 or 1.7 cycles for θ Dra means our cycle determinations can only be considered tentative, and may be considered a lower limit on the chromospheric activity cycle. The limitations of our cycle determinations are the short observation spans of the stars, and the use of periodograms that assume strictly periodic cycles. It is known from solar studies that the magnetic cycle of the Sun varies from 8–14 years and does not follow a strict period (Olspert et al. 2018). Many cool stars from spectral type F-K have been shown to exhibit chaotic chromospheric activity which cannot be represented by a regular cycle (Bruevich et al. 2001). It is also known that cool stars may show multiple magnetic cycles of different lengths operating simultaneously (Baliunas et al. 1996; Oláh et al. 2009; Vida, Oláh & Szabó 2014). F-stars provide good targets for studying magnetic activity cycles, because in some cases, it is possible to observe a full cycle in less than a year compared to more than a decade for the Sun. Due to its simple magnetic topology, β Vir may be a good target to study magnetic polarity reversals, however we did not observe any polarity reversal for β Vir in our 3 magnetic maps reconstructed over an 83 d timescale. A possible reason we did not find a magnetic polarity reversal for β Vir is that the chromospheric cycle we determined is very uncertain and possibly a longer observation period is required to see a polarity reversal.
The H α line core brightening and Ca ii line strength are usually used interchangeably as indicators of stellar activity (Zarro 1983; Giampapa et al. 1989; Robinson et al. 1990; Strassmeier et al. 1990; Montes et al. 1995); however, Da Silva et al. (2011) noted it is not clear if this correlation holds for all stellar types or levels of activity. Cincunegui et al. (2007) studied these two indices for a sample of 109 stars ranging in spectral type from F6 to M5 and found the correlation between H α and Ca ii flux held for the sample as a whole, but individual variations were noted between stars, with behaviours ranging from tight correlations with different slopes to anticorrelations, and in some cases no correlations were found. In a sample of M-dwarfs Walkowicz & Hawley (2009) found the relationship between H α and Ca ii is not linear and weak absorption of the H α line can be associated with both weak and moderate Ca K emission as suggested by Cram & Giampapa (1987) and observed in M dwarfs by Stauffer & Hartmann (1986) and Da Silva et al. (2011). We find for β Vir there is a weak correlation between H α-index and S-index, while for θ Dra there is a stronger correlation (Fig. 10) where a correlation between the two indicators of stellar activity is consistent with the generally accepted trend.
The space weather surrounding β Vir and θ Dra show differences that are related to the strength and orientation of the reconstructed surface radial magnetic field. The stellar wind pressure at a distance of 1 au and the size of the magnetosphere for an Earth-like planet give an indication of the space weather surrounding β Vir and θ Dra compared to our own Solar system. Considering an average solar wind pressure of 2 nPa and a planetary magnetosphere size of 10 Earth radii, the average space weather at β Vir at the three observed epochs falls within the range of space weather conditions observed at Earth. θ Dra produces a wind pressure an order of magnitude stronger than the Sun’s wind pressure; this does, however, not strongly affect the size of the magnetosphere as |$R_\text{m}/R_\text{p} \propto (P^\oplus _\text{w})^{-1/6}$|. As always when modelling the steady state wind, it should be remembered that transient phenomena such as flares and coronal mass ejections may contribute significantly to the wind mass- and angular momentum loss; these effects cannot be accounted for by a steady-state model.
8 CONCLUSIONS
We use ZDI to reconstruct surface magnetic maps for two mature late F-type stars, β Vir (F9V), and θ Dra (F8IV). The magnetic field in the slower rotating β Vir shows a simple radial magnetic field which is predominately dipolar and axisymmetric. The azimuthal field shows two areas of stronger magnetic field in the 0–30 deg north latitude, while the meridional field shows two areas of stronger field about 30 deg north latitude. Due to its simple magnetic topology, β Vir may be a good target to look for polarity reversals. The faster rotating star θ Dra shows a more complex surface magnetic field with a strong radial field in the north polar region. The azimuthal field is predominately negative, while the meridional field shows a mix of both positive and negative regions. Our observations of β Vir and θ Dra indicate dynamo magnetic fields are present these two late F-stars with shallow outer convection zones. The space weather conditions surrounding β Vir at 1 au are similar to the conditions observed at Earth, while for θ Dra the wind pressure is an order of magnitude stronger than the Sun’s wind pressure. Further magnetic mapping, and wind modelling needs to be done for early to mid F-type stars to better understand the transition between fossil and dynamo magnetic fields, and the space weather environment surrounding stars at the hot end of habitability for exoplanets.
ACKNOWLEDGEMENTS
This work is based on observations obtained at the Bernard Lyot Telescope (TBL, Pic du Midi, France) of the Midi-Pyrénées Observatory, which is operated by the Institut National des Sciences de l’Univers of the Centre National de la Recherche Scientifique of France. This research was supported by an Australian Government Research Training Program (RTP) Scholarship. This research has made use of the SIMBAD data base, operated at CDS, Strasbourg, France, and the VizieR catalogue access tool, CDS, Strasbourg, France.
DATA AVAILABILITY
All NARVAL data presented here are publicly available through the PolarBase data base (http://polarbase.irap.omp.eu/).
REFERENCES
APPENDIX A: ADDITIONAL RESULTS
| Star | Spectral | Teff | Mag. cycle | Cycle det. | Reference |
|---|---|---|---|---|---|
| type | (K) | (yr) | method | ||
| HD 3229 | F2V | 6471 ± 136 | 4.9 ± 0.1 | S-index | Baliunas et al. (1995) |
| HD 76572 | F3V | 6375 ± 187 | 7.1 ± 0.2 | S-index | Baliunas et al. (1995) |
| HD 49933 | F3V | 6585 ± 132 | 0.33 | Asteroseismology | García et al. (2010) |
| HD 18256 | F5V | 6359 ± 91 | 6.8 ± 0.2 | S-index | Baliunas et al. (1995) |
| HD 157856 | F5V | 6377 ± 75 | 15.9 ± 0.8 | S-index | Baliunas et al. (1995) |
| HD 194012 | F5V | 6224 ± 169 | 16.7 ± 0.9 | S-index | Baliunas et al. (1995) |
| HD 100563 | F5.5V | 6461 ± 93 | 0.61 | S-index | Mittag et al. (2019) |
| HD 178971 | F5IV-V | 6787 ± 77a | 3.85 | Modified S-index (Sph) | Mathur et al. (2014) |
| HD 175226 | F6IV | 6350 ± 111b | 2.96 | Asteroseismology | Régulo et al. (2016) |
| HD 207978 | F6IV-V | 6382 ± 60 | 17 | S-index | Baliunas & Vaughan (1985) |
| KIC 11415049 | F6V | 6182 ± 216 | 2 | Photometry | Montet et al. (2017) |
| HD 18256 | F6V | 6359 ± 91 | 5.89 | S-index | Boro Saikia et al. (2018) |
| HD 182101 | F6V | 6344 ± 86 | 5.1 ± 0.1 | S-index | Baliunas et al. (1995) |
| HD 111456 | F6V | 6290 ± 90 | 7.0 | S-index | Baliunas et al. (1995) |
| HD 100180 | F7 | 6060 ± 76 | 3.56 ± 0.04 | S-index | Baliunas et al. (1995) |
| HD 120136 | F7 | 6420 ± 155 | 0.33 | S-index | Mengel et al. (2016) |
| HD 75332 | F7 | 6206 ± 40 | 0.49 | S-index | Mittag et al. (2019) |
| θ Dra | F8IV | 6105 ± 271 | 0.12 ± 0.01 | S-index | This work |
| HD 154417 | F8V | 6021 ± 58 | 7.4 ± 0.2 | S-index | Baliunas et al. (1995) |
| HD 17051 | F8V | 6126 ± 75 | 1.6 | S-index | Metcalfe et al. (2010) |
| HD 16673 | F8V | 6327 ± 89 | 0.85 | S-index | Mittag et al. (2019) |
| HD 115383 | F8V | 6100 ± 153 | 11.79 | S-index | Boro Saikia et al. (2018) |
| CoRoT 102780281 | F8V | 5942 ± 88 | 0.3 | Photometry | Lopes et al. (2015) |
| KIC 8043142 | F8V | 5957 ± 77 | 4.5 | Photometry | Montet et al. (2017) |
| HD 187691 | F8V | 6150 ± 70 | 5.4 ± 0.1 | S-index | Baliunas et al. (1995) |
| KIC 2694810 | F8V-VI | 6036 ± 99 | 2 | Photometry | Montet et al. (2017) |
| HD 234856 | F9IV-V | 6155 ± 61 | 3 | CaII H line | Morgenthaler et al. (2011) |
| HD 114710 | F9V | 6097 ± 141 | 9.6 | S-index | Metcalfe et al. (2010) |
| β Vir | F9V | 6083 ± 58 | 0.23 ± 0.04 | S-index | This work |
| KIC 5955122 | F9V | 5954 ± 70 | 21 | Photometry | Bonanno et al. (2014) |
| KIC 7272437 | F9IV-V | 6075 ± 122 | 3 | Photometry | Montet et al. (2017) |
| KIC 10921242 | F9IV-V | 6021 ± 107 | 3 | Photometry | Montet et al. (2017) |
Journal of individual observations and magnetic detection for θ Dra LSD profiles in 2017, showing date and time of the observation, Stokes I profile SNR, rotation cycle with respect to observations starting at HJD = 2457850.6206, radial velocity (RV), chromospheric activity (S-index and H α-index), longitudinal magnetic field (Bl), null value (Nl), and magnetic detection flag for the presence of a magnetic field in individual LSD profiles where D is a definite detection, M is marginal, N is no detection. The Stokes V observations consist of a sequence of four exposures as described in Section 2.1.
| Date 2017 | HJD | SNR | Rot. | RVa | S-index | Hα-index | Bl | Nl | Det. |
|---|---|---|---|---|---|---|---|---|---|
| (local time) | 2450000+ | Stokes I | cycle | (km s−1) | (G) | (G) | N, M, D | ||
| Apr 06 | 7850.6206 | 576 | 0.000 | −31.17 | 0.212 | 0.286 | 4.4 ± 1.9 | 0.5 ± 1.9 | N |
| Apr 06 | 7850.6366 | 579 | 0.006 | −31.39 | 0.210 | 0.286 | 1.9 ± 1.6 | −0.6 ± 1.6 | N |
| Apr 06 | 7850.6524 | 574 | 0.011 | −31.61 | 0.212 | 0.286 | 2.3 ± 1.4 | 0.8 ± 1.4 | N |
| Apr 06 | 7850.6683 | 567 | 0.017 | −31.82 | 0.212 | 0.286 | −2.8 ± 1.7 | −0.5 ± 1.7 | N |
| Apr 06 | 7850.6843 | 568 | 0.022 | −32.00 | 0.212 | 0.287 | −0.8 ± 1.3 | 0.5 ± 1.3 | N |
| Apr 07 | 7851.5594 | 569 | 0.326 | −7.71 | 0.208 | 0.285 | −1.6 ± 1.6 | 0.7 ± 1.6 | M |
| Apr 07 | 7851.5772 | 576 | 0.332 | −6.74 | 0.207 | 0.284 | 3.5 ± 1.4 | −0.1 ± 1.4 | D |
| Apr 07 | 7851.5949 | 567 | 0.338 | −5.92 | 0.207 | 0.284 | 1.2 ± 1.7 | 1.6 ± 1.7 | N |
| Apr 07 | 7851.6127 | 560 | 0.344 | −5.05 | 0.208 | 0.285 | 2.0 ± 1.4 | 1.5 ± 1.4 | N |
| Apr 07 | 7851.6305 | 570 | 0.351 | −4.12 | 0.208 | 0.284 | 2.4 ± 1.5 | 1.9 ± 1.6 | D |
| Apr 10 | 7854.5346 | 559 | 1.359 | −12.31 | 0.209 | 0.285 | 4.8 ± 2.0 | −1.1 ± 2.0 | D |
| Apr 10 | 7854.5524 | 563 | 1.365 | −11.58 | 0.209 | 0.286 | 3.0 ± 2.4 | 0.5 ± 2.4 | M |
| Apr 10 | 7854.5701 | 550 | 1.371 | −10.65 | 0.210 | 0.287 | 2.7 ± 1.7 | −1.3 ± 1.7 | D |
| Apr 10 | 7854.5877 | 588 | 1.377 | −9.73 | 0.208 | 0.286 | 4.1 ± 1.4 | 0.2 ± 1.4 | D |
| Apr 10 | 7854.6055 | 582 | 1.384 | −8.91 | 0.208 | 0.286 | 1.9 ± 1.3 | 0.0 ± 1.3 | D |
| Apr 11 | 7855.4836 | 537 | 1.689 | 15.94 | 0.209 | 0.285 | 4.4 ± 2.9 | 2.7 ± 2.9 | N |
| Apr 11 | 7855.5013 | 561 | 1.695 | 15.76 | 0.210 | 0.285 | 3.0 ± 2.5 | −0.3 ± 2.5 | N |
| Apr 11 | 7855.5191 | 541 | 1.701 | 15.57 | 0.210 | 0.285 | −2.9 ± 2.6 | −1.0 ± 2.6 | N |
| Apr 11 | 7855.5369 | 556 | 1.707 | 15.38 | 0.209 | 0.285 | −2.6 ± 2.0 | −0.5 ± 2.0 | N |
| Apr 11 | 7855.5546 | 549 | 1.713 | 15.08 | 0.210 | 0.286 | 2.1 ± 1.5 | −0.3 ± 1.5 | N |
| Apr 12 | 7856.5068 | 556 | 2.044 | −24.00 | 0.208 | 0.285 | 3.4 ± 2.0 | −0.7 ± 2.1 | M |
| Apr 12 | 7856.5244 | 572 | 2.050 | −24.66 | 0.208 | 0.285 | 2.4 ± 1.2 | −0.4 ± 1.2 | D |
| Apr 12 | 7856.5422 | 573 | 2.056 | −25.31 | 0.208 | 0.286 | 2.3 ± 2.1 | 1.0 ± 2.2 | N |
| Apr 12 | 7856.5599 | 555 | 2.062 | −25.94 | 0.207 | 0.285 | 1.2 ± 1.7 | 0.0 ± 1.7 | D |
| Apr 12 | 7856.5776 | 570 | 2.068 | −26.53 | 0.207 | 0.285 | −3.0 ± 1.5 | −1.0 ± 1.5 | N |
| Apr 15 | 7859.5275 | 601 | 3.093 | −22.15 | 0.208 | 0.286 | −2.0 ± 1.7 | −0.6 ± 1.8 | M |
| Apr 15 | 7859.5452 | 598 | 3.099 | −22.88 | 0.208 | 0.286 | 1.9 ± 1.7 | 0.2 ± 1.7 | M |
| Apr 15 | 7859.5630 | 589 | 3.105 | −23.59 | 0.208 | 0.285 | 3.5 ± 2.3 | −1.9 ± 2.3 | N |
| Apr 15 | 7859.5808 | 602 | 3.111 | −24.30 | 0.207 | 0.286 | −1.5 ± 1.3 | −0.1 ± 1.3 | N |
| Apr 15 | 7859.5986 | 594 | 3.117 | −24.97 | 0.208 | 0.286 | −3.7 ± 2.3 | 1.3 ± 2.3 | N |
| Apr 16 | 7860.4760 | 598 | 3.422 | −21.61 | 0.210 | 0.285 | 3.1 ± 2.1 | −1.1 ± 2.2 | D |
| Apr 16 | 7860.4937 | 595 | 3.428 | −20.84 | 0.210 | 0.286 | 0.9 ± 1.2 | 0.1 ± 1.2 | M |
| Apr 16 | 7860.5116 | 589 | 3.434 | −20.11 | 0.211 | 0.285 | −3.0 ± 2.3 | −0.2 ± 2.3 | D |
| Apr 16 | 7860.5293 | 579 | 3.441 | −19.34 | 0.211 | 0.285 | 6.3 ± 1.8 | −2.9 ± 1.8 | M |
| Apr 16 | 7860.5470 | 576 | 3.447 | −18.59 | 0.211 | 0.285 | −1.0 ± 1.3 | 0.2 ± 1.3 | N |
| Apr 17 | 7861.4462 | 593 | 3.759 | 16.13 | 0.206 | 0.286 | −0.8 ± 1.2 | −0.1 ± 1.2 | N |
| Apr 17 | 7861.4639 | 598 | 3.765 | 16.30 | 0.206 | 0.286 | 1.7 ± 1.8 | −0.5 ± 1.9 | M |
| Apr 17 | 7861.4816 | 605 | 3.771 | 16.41 | 0.206 | 0.286 | −2.7 ± 1.6 | −0.3 ± 1.6 | N |
| Apr 17 | 7861.4994 | 596 | 3.777 | 16.44 | 0.205 | 0.286 | −4.3 ± 2.0 | 0.4 ± 2.0 | N |
| Apr 17 | 7861.5171 | 596 | 3.784 | 16.48 | 0.205 | 0.286 | 1.8 ± 2.1 | −1.6 ± 2.2 | N |
| Apr 19 | 7863.4966 | 594 | 4.471 | −23.78 | 0.208 | 0.286 | 1.6 ± 1.7 | −1.0 ± 1.7 | N |
| Apr 19 | 7863.5144 | 585 | 4.477 | −23.07 | 0.208 | 0.287 | 2.4 ± 2.4 | −0.1 ± 2.4 | N |
| Apr 19 | 7863.5320 | 590 | 4.483 | −22.34 | 0.208 | 0.286 | 5.6 ± 2.8 | 0.5 ± 2.8 | M |
| Apr 19 | 7863.5497 | 590 | 4.489 | −21.62 | 0.208 | 0.287 | 3.7 ± 1.6 | −0.8 ± 1.6 | M |
| Apr 19 | 7863.5674 | 594 | 4.495 | −20.88 | 0.208 | 0.286 | −6.1 ± 3.2 | −4.0 ± 3.2 | N |
| Apr 20 | 7864.4710 | 589 | 4.809 | 15.59 | 0.206 | 0.285 | 1.6 ± 1.5 | 1.4 ± 1.5 | N |
| Apr 20 | 7864.4887 | 585 | 4.815 | 15.78 | 0.207 | 0.286 | 1.7 ± 1.5 | −2.3 ± 1.5 | N |
| Apr 20 | 7864.5065 | 578 | 4.821 | 15.95 | 0.206 | 0.285 | 8.6 ± 2.4 | 2.8 ± 2.4 | N |
| Apr 20 | 7864.5242 | 595 | 4.828 | 16.14 | 0.206 | 0.286 | −2.7 ± 1.9 | −0.5 ± 1.9 | N |
| Apr 20 | 7864.5420 | 590 | 4.834 | 16.25 | 0.206 | 0.286 | 2.2 ± 2.4 | −2.7 ± 2.4 | N |
| Apr 21 | 7865.5442 | 580 | 5.182 | −16.65 | 0.211 | 0.288 | −4.4 ± 2.5 | −1.9 ± 2.5 | N |
| Apr 21 | 7865.5619 | 569 | 5.188 | −17.44 | 0.211 | 0.287 | −5.4 ± 2.7 | −0.6 ± 2.7 | N |
| Apr 21 | 7865.5797 | 555 | 5.194 | −18.31 | 0.211 | 0.288 | 2.0 ± 2.7 | −0.2 ± 2.7 | N |
| Apr 21 | 7865.5975 | 563 | 5.200 | −19.09 | 0.208 | 0.286 | −3.5 ± 2.0 | −0.5 ± 2.0 | N |
| Apr 21 | 7865.6154 | 563 | 5.206 | −19.92 | 0.211 | 0.287 | 0.9 ± 1.5 | 3.5 ± 1.5 | N |
| Apr 22 | 7866.4785 | 584 | 5.506 | −26.80 | 0.214 | 0.287 | 3.5 ± 2.2 | −1.6 ± 2.2 | M |
| Apr 22 | 7866.4964 | 586 | 5.512 | −26.24 | 0.209 | 0.285 | −4.4 ± 2.4 | −1.3 ± 2.4 | D |
| Apr 22 | 7866.5141 | 576 | 5.519 | −25.64 | 0.209 | 0.285 | 4.0 ± 1.9 | 1.0 ± 1.9 | D |
| Apr 22 | 7866.5319 | 589 | 5.525 | −24.98 | 0.208 | 0.286 | −3.0 ± 1.6 | −1.0 ± 1.6 | D |
| Apr 22 | 7866.5496 | 596 | 5.531 | −24.38 | 0.208 | 0.284 | 0.6 ± 2.0 | −0.2 ± 2.0 | D |
| Apr 23 | 7867.4570 | 593 | 5.846 | 14.13 | 0.206 | 0.286 | −1.1 ± 1.6 | −0.8 ± 1.7 | N |
| Apr 23 | 7867.4747 | 601 | 5.852 | 14.48 | 0.206 | 0.284 | −2.6 ± 1.2 | −0.4 ± 1.2 | N |
| Apr 23 | 7867.4924 | 582 | 5.858 | 14.83 | 0.206 | 0.285 | 1.8 ± 1.3 | 0.2 ± 1.3 | N |
| Apr 23 | 7867.5101 | 578 | 5.864 | 15.16 | 0.206 | 0.285 | 2.0 ± 1.2 | −0.9 ± 1.2 | M |
| Apr 23 | 7867.5279 | 595 | 5.871 | 15.41 | 0.206 | 0.286 | 2.6 ± 1.8 | 0.6 ± 1.8 | M |
| Apr 24 | 7868.4942 | 552 | 6.206 | −10.73 | 0.208 | 0.285 | −2.1 ± 2.3 | 1.6 ± 2.3 | N |
| Apr 24 | 7868.5119 | 546 | 6.212 | −11.65 | 0.208 | 0.286 | −1.1 ± 1.3 | 0.1 ± 1.3 | N |
| Apr 24 | 7868.5297 | 549 | 6.218 | −12.48 | 0.208 | 0.285 | 2.9 ± 2.5 | 2.0 ± 2.5 | N |
| May 15 | 7889.4331 | 496 | 13.477 | 12.99 | 0.206 | 0.284 | −4.2 ± 2.9 | −0.8 ± 2.9 | N |
| May 15 | 7889.4508 | 497 | 13.483 | 12.53 | 0.205 | 0.284 | −4.6 ± 2.4 | −0.3 ± 2.4 | N |
| May 15 | 7889.4685 | 499 | 13.489 | 12.03 | 0.206 | 0.284 | −7.4 ± 2.9 | −0.6 ± 2.9 | N |
| May 15 | 7889.4862 | 515 | 13.495 | 11.50 | 0.205 | 0.283 | −1.0 ± 1.4 | 2.0 ± 1.4 | N |
| May 15 | 7889.5038 | 530 | 13.501 | 11.02 | 0.205 | 0.283 | 4.0 ± 1.7 | 4.0 ± 1.7 | N |
| May 16 | 7890.4187 | 483 | 13.819 | −28.43 | 0.203 | 0.285 | −13.0 ± 5.6 | 2.3 ± 5.6 | N |
| May 16 | 7890.4364 | 486 | 13.825 | −28.91 | 0.204 | 0.285 | −13.1 ± 4.7 | 3.3 ± 4.7 | N |
| May 20 | 7894.4204 | 604 | 15.208 | −14.12 | 0.202 | 0.286 | 2.0 ± 1.4 | −1.2 ± 1.4 | N |
| May 20 | 7894.4381 | 609 | 15.214 | −13.30 | 0.202 | 0.286 | 3.9 ± 2.2 | 1.2 ± 2.2 | N |
| May 20 | 7894.4558 | 598 | 15.221 | −12.42 | 0.202 | 0.285 | −4.1 ± 1.7 | −0.6 ± 1.7 | N |
| May 20 | 7894.4735 | 602 | 15.227 | −11.55 | 0.202 | 0.286 | −2.9 ± 1.5 | −0.3 ± 1.5 | N |
| May 20 | 7894.4911 | 598 | 15.233 | −10.68 | 0.202 | 0.286 | −2.1 ± 1.3 | 0.9 ± 1.3 | N |
| Jun 05 | 7910.4354 | 548 | 20.769 | 13.87 | 0.205 | 0.283 | −2.6 ± 1.2 | −0.3 ± 1.2 | N |
| Jun 05 | 7910.4532 | 522 | 20.775 | 14.19 | 0.206 | 0.285 | 2.3 ± 2.3 | 4.3 ± 2.3 | N |
| Jun 05 | 7910.4711 | 529 | 20.781 | 14.64 | 0.205 | 0.284 | 3.3 ± 2.6 | 0.1 ± 2.6 | N |
| Jun 05 | 7910.4889 | 549 | 20.788 | 14.97 | 0.206 | 0.284 | −3.5 ± 1.3 | −0.2 ± 1.3 | M |
| Jun 05 | 7910.5066 | 532 | 20.794 | 15.19 | 0.206 | 0.284 | 3.1 ± 2.4 | −2.4 ± 2.4 | N |
| Jun 14 | 7919.4807 | 513 | 23.910 | 8.94 | 0.200 | 0.283 | 3.1 ± 1.8 | −1.2 ± 1.8 | N |
| Jun 14 | 7919.4984 | 512 | 23.916 | 9.56 | 0.200 | 0.281 | −2.1 ± 2.0 | −0.5 ± 2.0 | N |
| Jun 14 | 7919.5161 | 509 | 23.922 | 10.14 | 0.200 | 0.283 | 3.3 ± 2.0 | −1.5 ± 2.0 | N |
| Jun 14 | 7919.5339 | 504 | 23.928 | 10.76 | 0.200 | 0.282 | −2.8 ± 1.5 | −3.2 ± 1.5 | N |
| Jun 14 | 7919.5517 | 508 | 23.934 | 11.31 | 0.200 | 0.283 | −0.5 ± 1.6 | −0.1 ± 1.6 | N |
| Jun 16 | 7921.4609 | 562 | 24.597 | −32.37 | 0.199 | 0.284 | 2.7 ± 1.6 | 1.0 ± 1.6 | N |
| Jun 16 | 7921.4786 | 553 | 24.603 | −32.21 | 0.199 | 0.284 | −3.3 ± 1.5 | 1.8 ± 1.5 | N |
| Jun 16 | 7921.4964 | 562 | 24.610 | −32.09 | 0.199 | 0.284 | 5.0 ± 1.9 | 1.3 ± 1.9 | N |
| Jun 16 | 7921.5142 | 566 | 24.616 | −31.91 | 0.199 | 0.285 | −0.3 ± 1.2 | 0.1 ± 1.2 | N |
| Jun 16 | 7921.5320 | 565 | 24.622 | −31.71 | 0.200 | 0.284 | 0.8 ± 1.1 | 1.5 ± 1.1 | N |
| Jun 17 | 7922.4543 | 582 | 24.942 | 4.43 | 0.204 | 0.285 | −1.9 ± 1.1 | 0.8 ± 1.2 | N |
| Jun 17 | 7922.4720 | 565 | 24.948 | 5.75 | 0.204 | 0.286 | −1.8 ± 1.2 | 2.2 ± 1.3 | N |
| Jun 17 | 7922.4898 | 583 | 24.955 | 6.51 | 0.204 | 0.285 | 2.2 ± 1.1 | 0.2 ± 1.2 | N |
| Jun 17 | 7922.5076 | 584 | 24.961 | 7.19 | 0.203 | 0.285 | 3.8 ± 1.6 | −0.3 ± 1.6 | N |
| Jun 17 | 7922.5255 | 573 | 24.967 | 7.88 | 0.204 | 0.285 | −0.9 ± 1.4 | 2.3 ± 1.4 | N |
| Jun 18 | 7923.4549 | 532 | 25.290 | 4.45 | 0.203 | 0.284 | −2.1 ± 1.2 | −2.1 ± 1.2 | N |
| Jun 18 | 7923.4727 | 523 | 25.296 | 3.65 | 0.204 | 0.284 | −4.8 ± 2.0 | 0.1 ± 2.0 | N |
| Jun 18 | 7923.4905 | 519 | 25.302 | 2.83 | 0.204 | 0.284 | −1.7 ± 1.5 | −1.1 ± 1.5 | N |
| Jun 18 | 7923.5083 | 530 | 25.308 | 2.08 | 0.204 | 0.284 | 1.9 ± 1.3 | −0.1 ± 1.3 | N |
| Jun 18 | 7923.5259 | 521 | 25.314 | 1.23 | 0.204 | 0.285 | 2.0 ± 1.3 | −2.4 ± 1.3 | N |
The RV precision of NARVAL is 0.018 km s−1 (Soubiran et al. 2018).
