


ABSTRACT
We present a multiwavelength investigation of the H ii region G347.600+00.211, located at a distance of 7.9 kpc. We analyse the gas and dust properties aiming to disentangle the origin of the region as well as its role in the formation of new stars. G347.600 + 00.211 is very conspicuous at 1420 MHz and infrared wavelengths, showing an incomplete shell-like structure with two distinct zones of very intense emission. The infrared bubble S8 is part of the shell structure. The spatial distribution of the molecular gas shows the presence of six clouds located around the ionized region and showing a good morphological correlation with the 8-|$\mu$|m emission. Cold dust is coincident with the dense gas shown in the CO measurements. As for the origin of the region, we found that the massive cluster [DBS2003]179 and two Wolf–Rayet (WR) stars are located at the same distance than the ionized gas. Based on a stellar density analysis, we inferred that one of the WR stars, 1181-81L, is also a probable member of the cluster. Both the cluster and the WR stars are not only within the ring-like structure, but are also located near the two spots of very heightened emission, suggesting they may be responsible for this bright emission. Finally, as expanding H ii regions are hypothesized to trigger star formation, we used different infrared point source catalogues to search for young stellar object candidates (cYSOs). A total of 33 cYSOs and 4 CH ii regions were identified projected on to the photodissociation regions and molecular clouds.
1 INTRODUCTION
The interstellar medium (ISM) is continuously changing, and is especially affected by massive stars, defined as stars whose zero-age main sequence (ZAMS) mass exceeds 8 M⊙. These stars modify their local medium in a variety of ways, such as ionizing the surrounding gas via their energetic ultraviolet (UV) radiation (Strömgren 1939), dissociating complex molecules present in their parental molecular cloud (Hollenbach & Tielens 1997), and injecting kinematic energy and considerable amounts of material in their vicinity through their strong winds (Avedisova 1972), supernova explosions (Cox 2005), and mass-loss processes, radically changing the chemical composition of the medium, its phases and dynamics.
The influence that massive stars have on the local ISM will vary according to the different evolutionary phases the stars go through (Weaver et al. 1977), due to the changes they experience in their mass-loss rates, terminal velocities of their winds and number of Lyman continuum photons, giving birth to emission structures with distinct physical properties (McKee & Ostriker 1977; Lozinskaia 1982; McKee, van Buren & Lazareff 1984). In addition, depending on whether massive stars are found isolated or as part of a stellar system, the structures they form are also expected to deviate from those predicted for a single ionizing source by theoretical models. The initial conditions of the ISM also have a defining impact on the characteristics of the observed morphologies, particularly near the Galactic Plane and in the inner part of the Galaxy, where the medium is highly inhomogeneous. A comprehensive analysis of the different structures associated to massive stars would then render relevant information about not only the physical properties of the stellar population that gave origin to them, but also about the maternal molecular cloud where these stars were formed.
Many detailed works about these structures can be found in the literature (e.g. Deharveng et al. 2009; Cichowolski et al. 2015; Mallick et al. 2015; Duronea et al. 2017), in which a multifrequency approach is taken in order to achieve a more complete characterisation of the emission structures and the interactions with their ionizing sources. Data products from surveys completed in recent years, spanning from the mid-infrared (MIR) wavelengths to the far-infrared (FIR) and reaching the radio frequencies, have allowed for the detection and mapping of the different components of the ISM. All these surveys are therefore used to complement each other, since the emission detected in each distinct frequency band gives information about different processes occurring in the ISM, indicating whether the present gas and/or dust are being heated, photoionized, and/or dissociated.
Morphological inspection of the structures shaped by massive stars not only gives clues about the ionizing sources and the initial conditions in which these stars originated; it also provides relevant information about star formation processes that could be occurring in the region. Further, massive stars have been involved in several works as possible triggers of new generations of stars, given their notorious impact on their surroundings (Deharveng, Zavagno & Caplan 2005; Martins et al. 2010; Zavagno et al. 2010; Akimkin et al. 2017; Luisi et al. 2021). They can affect the medium via the shocks produced by their strong winds, injecting mass and energy in the surrounding gas, which, in turn, can be accumulated and/or compressed, and can also perturb pre-existing molecular clumps present in their vicinity. The identification of young stellar objects candidates (cYSOs) and the analysis of their distribution in the surrounding molecular clouds and photodissociation regions (PDRs), could lead to a possible scenario of stellar formation being triggered by high-mass stars (e.g. Cichowolski et al. 2009; Pomarès et al. 2009; Yu, Wang & Li 2014; Gama et al. 2016; Figueira et al. 2020). Studies of this kind may also deepen our knowledge on the ongoing discussion of whether stars can be born in isolation or are always born in groups (Roberts 1957; Lada & Lada 2003; de Wit et al. 2005; Zinnecker & Yorke 2007; Evans et al. 2009). An analysis of the irreversible changes produced by the continuous feedback from massive stars on to their surroundings at different frequencies can be used to put constraints on the hydrodynamical models that aim to simulate star formation, as the observed structures are most ideal to use as comparison to the simulated results predicted from models (e.g. Bisbas et al. 2011; Dirienzo et al. 2012; Mackey et al. 2016; Marshall & Kerton 2019; González-Samaniego & Vazquez-Semadeni 2020). Observational works are therefore fundamental to study massive star and their effects on the ISM.
In this work, we present a multifrequency analysis of the Galactic H ii region G347.600+00.211, which is notorious for its considerable size relative to other regions nearby, its bright IR emission and the young massive cluster (YMC) it harbours, as well as three Wolf–Rayet (WR) type stars found in the area. We characterize the region estimating its physical properties and studying the emission distribution of the different components of dust and molecular material present in the area, with the aim to investigate the origin of G347.600 + 00.211 and analyse its role in the formation of new stars.
2 DATA SETS
To carry out this study, we made use of several public archival data described as follows:
Infrared data: MIR observations from the Spitzer Infrared Array Camera (IRAC) at 3.6, 4.5, 5.8, and 8.0 |$\mu$|m, as well as the Multiband Imaging Photometer for Spitzer (MIPS) at 24 |$\mu$|m, were obtained from the Galactic Legacy Infrared Midplane Survey Extraordinaire (GLIMPSE; Benjamin et al. 2003) survey and MIPS Galactic Plane Survey (MIPSGAL; Carey et al. 2005) survey, respectively. The resolution of the IRAC bands is better than 2 arcsec, while the MIPS 24-|$\mu$|m band has a resolution of 6 arcsec. The GLIMPSE (I+II + 3D)1 source catalogue (Spitzer Science 2009) and MIPSGAL 24-|$\mu$|m point source catalogue (Gutermuth & Heyer 2015) were also used.
Data from the Midcourse Space Experiment (MSX; Price et al. 2001) satellite mission was retrieved as well. The satellite surveyed the Galactic Plane at 8, 12, 14 and 21 |$\mu$|m (bands A, C, D, and E, respectively) with a spatial resolution of ∼18 arcsec. We made use of these photometric data from the latest version (V2.3) of the MSX Point Source Catalogue (PSC; Egan, Price & Kraemer 2003).
In addition, we used data from the Herschel infrared Galactic Plane Survey (Hi-GAL; Molinari et al. 2010), which consists of a set of Herschel Photodetector Array Camera and Spectrometer (PACS) and Spectral and Photometric Imaging REceiver (SPIRE) images at wavelengths of 70, 160, 250, 350, and 500 |$\mu$|m. The spatial resolution values of these data are approximately 8|${_{.}^{\prime\prime}}$|5, 13|${_{.}^{\prime\prime}}$|5, 18|${_{.}^{\prime\prime}}$|2, 24|${_{.}^{\prime\prime}}$|9 and 36|${_{.}^{\prime\prime}}$|3, respectively.
Radio continuum at 1420 MHz: We used data from the Southern Galactic Plane Survey (SGPS; McClure-Griffiths et al. 2005; Haverkorn et al. 2006). Interferometric observations obtained with the Australia Telescope Compact Array (ATCA) are combined with single dish data from the 64-m Parkes radiotelescope to sample extended structures. The final products have an angular resolution of about 2′.
Sub-millimeter and millimeter data: We retrieved the continuum emission map at 870 |$\mu$|m from the APEX Telescope Large Area Survey of the Galaxy (ATLASGAL; Schuller, F. et al. 2009). This survey was carried out systematically using the Large APEX Bolometer Camera (LABOCA), a 295-element bolometer array with a beam size of 19|${_{.}^{\prime\prime}}$|2 at this frequency. The data has a 1σ sensitivity of 50–70 mJy beam−1. We also used the ATLASGAL compact source catalogue (Contreras et al. 2013) of dusty clumps.
To analyse the molecular gas in the region we have used the Mopra Carbon Monoxide (CO) Survey of the Southern Galactic Plane – Data Release 3 (Braiding et al. 2018). This survey provides data in the 109-115 GHz J = 1-0 transitions of 12CO, 13CO, C18O, and C17O with a 0|${_{.}^{\prime}}$|6 spatial resolution and 0.1 |$\rm km\, s^{-1}$| spectral resolution. The observed antenna temperatures were converted into the main-beam brightness temperature scale by Tmb = TA/ηXB, where ηXB is the Mopra extended beam efficiency, ηXB = 0.55 (Ladd et al. 2005).
3 PRESENTATION OF THE REGION
G347.600 + 00.211 is a large, bright H ii region that lies near the Galactic Plane (l = 347|${_{.}^{\circ}}$|6 , b = 0|${_{.}^{\circ}}$|2). It was first distinguished as an H ii region via the detection of a radio recombination line (RRL) by Wilson et al. (1970), who carried out a survey of H109α emission looking for this line in southern sources. Wilson et al. (1970) measured a velocity of V|$_{\rm LSR} = -96.2\, \pm$| 0.7 |$\rm km\, s^{-1}$| for the radio source associated with G347.600 + 00.211, at Galactic Coordinates (|$l\, , \, b$|) = (347|${_{.}^{\circ}}$|610, 0|${_{.}^{\circ}}$|204). Additional RRLs were later detected by Caswell & Haynes (1987) and Anderson et al. (2011), spanning different sections of the region. The former found a RRL at a velocity of VLSR = –97.0 |$\rm km\, s^{-1}$| originated at (|$l\, , \, b$|) = (347|${_{.}^{\circ}}$|386 , 0|${_{.}^{\circ}}$|266), while the latter detected a line at VLSR = –102.5 |$\rm km\, s^{-1}$| in direction to (|$l\, , \, b$|) = (347|${_{.}^{\circ}}$|536 , 0|${_{.}^{\circ}}$|084). In this last case, the region of emission detected corresponded to the Green Bank Telescope (GBT) H ii Region Discovery Survey target G347.536 + 0.084 (HRDS; Bania et al. 2010; Anderson et al. 2011).
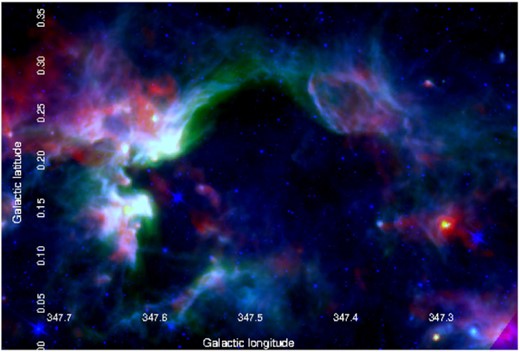
G347.600 + 00.211 was also identified in IR wavelengths. The WISE Catalogue of Galactic H ii Regions (Anderson et al. 2014) classified it as a ‘Known’ H ii region from its observed MIR emission morphology, and named it as G347.495 + 00.171. Fig. 1 presents G347.600 + 00.211 in three IR bands; it is seen as a large, complex structure composed of multiple bright regions of emission, spanning up to a radius of |$\sim \, 12$| arcmin (which is the approximate extension of the MIR emission; Anderson et al. 2014). The two smaller, most intense emission structures which appear as parts of the complex were also identified in the WISE catalogue as H ii regions, sharing membership with G347.600 + 00.211 and localized at Galactic Coordinates (|$l\, , \, b$|) = (347|${_{.}^{\circ}}$|590 , 0|${_{.}^{\circ}}$|217) and (347|${_{.}^{\circ}}$|620 , 0|${_{.}^{\circ}}$|146). Two other small structures associated with the region, localized at (|$l\, , b$|) = (347|${_{.}^{\circ}}$|599 , 0|${_{.}^{\circ}}$|245) and (|$l\, , b$|) = (347|${_{.}^{\circ}}$|629 , 0|${_{.}^{\circ}}$|148), were also identified and catalogued as ‘Group’ regions. All these regions are indicated in Fig. 1.
![Colour composite image of the H ii region G347.600 + 00.211, depicting the emission corresponding to three Spitzer bands: colour red traces MIPSGAL 24-$\mu$m emission, while green and blue trace GLIMPSE 8- and 4.5-$\mu$m emission. The orange and cyan circles delimit the H ii regions identified in the WISE catalogue as ‘Known’ and ‘Group’, respectively, with their coordinate centres and radii as they appear in the catalogue. ‘Known’ regions were assigned alphabetic letters for better identification. The green circle outlines IR bubble S8 as catalogued by Churchwell et al. (2006), centred on its catalogue coordinates; its size corresponds to the average radius of the bubble. The pink symbols mark the locations of the open cluster [DBS2003] 179 (diamond) and WR stars 1181-81L (cross), 1181-82L (x) and 1181-211L (box).](https://oup.silverchair-cdn.com/oup/backfile/Content_public/Journal/mnras/509/3/10.1093_mnras_stab3084/1/m_stab3084fig1.jpeg?Expires=1749891960&Signature=Za5D1DMZ2mU-dYEWqoc3310jB7UYhTLZijc1W8pvx-xcNi2YmqU0jkaaFVTJ76reNJJwNwIJnLWb~G8bBNcKV4FRRcw06EQQtcDMt9pHll~Xb7HdEugOgR3tPLPc7EOe6zpLGBgDcNEpCpzs8~qgt7P5JVA5-j4npZRdLE-HG6Os8gV~4JjWAzGRqNaq6JrHeYJMMEKCoZBuMGnn6H9SrMi3S-T056-GRiw-QjzRlId0O4Um3cVHFi8YP7qsRtcEbtxmtsF8W6da4OlF20133c7ON6bkZZhuicZlgkNgea01K09aTLifQ2j1KvlqTcmq6QSTtLFxfvMdSJLAGmHrgQ__&Key-Pair-Id=APKAIE5G5CRDK6RD3PGA)
Colour composite image of the H ii region G347.600 + 00.211, depicting the emission corresponding to three Spitzer bands: colour red traces MIPSGAL 24-|$\mu$|m emission, while green and blue trace GLIMPSE 8- and 4.5-|$\mu$|m emission. The orange and cyan circles delimit the H ii regions identified in the WISE catalogue as ‘Known’ and ‘Group’, respectively, with their coordinate centres and radii as they appear in the catalogue. ‘Known’ regions were assigned alphabetic letters for better identification. The green circle outlines IR bubble S8 as catalogued by Churchwell et al. (2006), centred on its catalogue coordinates; its size corresponds to the average radius of the bubble. The pink symbols mark the locations of the open cluster [DBS2003] 179 (diamond) and WR stars 1181-81L (cross), 1181-82L (x) and 1181-211L (box).
In addition, an infrared bubble (IB) was found to be part of G347.600 + 00.211; it is identified as S8 from the catalogue of bubbles in the Galactic Disc of Churchwell et al. (2006), centred at Galactic Coordinates (|$l\, ,b$|) = (347|${_{.}^{\circ}}$|401, 0|${_{.}^{\circ}}$|265). It has the appearance of a closed ring, as can be appreciated in Fig. 1.
An ultracompact (UC) H ii region was also identified in the area of G347.600 + 00.211. It was first detected by Walsh et al. (1997), who selected IRAS source candidates to UC regions using the colour criteria of Wood & Churchwell (1989), and then searched for 6.669-GHz methanol maser emission in all the selected sources. The UC region possibly related to G347.600 + 00.211, corresponds to IRAS 17079-3905 (|$l\, ,b$|) = (347|${_{.}^{\circ}}$|579, 0|${_{.}^{\circ}}$|211), for which methanol lines were found in the radial velocity range from –102.8 to –92 |$\rm km\, s^{-1}$| (Walsh et al. 1998). In Culverhouse et al. (2011) a catalogue of discrete sources from the QUaD2 Galactic Plane survey (Culverhouse et al. 2010) is presented. This survey maps the Galactic Plane at 100 and 150 GHz in Stokes I, Q and U parameters. The extracted sources were matched to objects from the IRAS Point Source Catalogue (IRAS-PSC) and Parkes-MIT-NRAO Catalogue (Condon, Griffith & Wright 1993). In particular, the source 347.61 + 0.19, which was detected at both 100 and 150 GHz, was matched to IRAS 17079–3905. Since both frequency bands are well-suited to detect clumps containing objects that have passed the pre-stellar phase, it is highly likely that the clumps detected by QUaD with far-IR counterparts are harbouring a recently formed H ii region. This is consistent with the fact that the IRAS counterpart of 347.61 + 0.19 satisfies the Wood–Churchwell criterion for UC H ii regions.
Several objects of stellar nature were identified in the area as well. The IR cluster [DBS2003] 179, discovered by (Dutra et al. 2003), is a YMC (Portegies Zwart, McMillan & Gieles 2010) whose spatial projection puts it very near to one of the brightest parts of G347.600 + 00.211. The ionized region has been related to this open cluster by several authors (Borissova et al. 2008; Borissova et al. 2012; Kharchenko et al. 2013; Kuwahara et al. 2020). It is worth pointing out, however, that they gave different distance estimates for the cluster (see Section 3.1). Its stellar population were studied extensively in Borissova et al. (2008) and later, using complementary data, in Borissova et al. (2012). Additionally, three WR type stars lie projected in the vicinity of G347.600 + 00.211: WR 1181-82L, 1181-81L, and 1181-211L (Shara et al. 2012), which were detected using NIR photometry (Shara et al. 2009) and classified with IR spectra. In particular, the WR star 1181-81L had been previously identified by Mauerhan, Van Dyk & Morris (2011) and associated with [DBS2003] 179. The locations of the cluster and the three WR stars are marked in Fig. 1.
3.1 Distance
G347.600 + 00.211 lies in the fourth quadrant of the Milky Way, were kinematic distance ambiguity (KDA) hinders the estimation of a clear distance value. For a certain Galactic Longitude and a given measurement of the radial velocity of the region, a particular Galactic Rotation model may be adopted to derive a near (N) and a far (F) distances. Generally, the ambiguity may be resolved via the study of atomic hydrogen absorption spectra (Caswell et al. 1975; Kuchar & Bania 1994)
Different distance values were attributed to this region by several authors. Based on their RRL velocity measurement, Wilson et al. (1970) estimated values of |$d_{\rm \, N}$| = 7.9 ± 1.0 kpc and |$d_{\rm \, F}$| = 11.6 ± 1.0 kpc, but there is no mention of either of these distances being favoured over the other. Caswell & Haynes (1987), who obtained similar distance values than Wilson et al. (1970), are not partial to any of these as well, although they do remark on the absence of an optical counterpart for G347.600+00.211. On the other hand, G347.600 + 00.211 was categorized as a far source by Fish et al. (2003), who observed H i absorption features to assign it a distance of 10.4|$^{+0.4}_{-0.9}$| kpc. However, uncertainty in kinematic distances can be high due to errors inherent to the models used, among which we can find the circular rotation assumption. In particular, this supposition works as a source of inaccuracy towards the centre and anticentre of the Galaxy, where non-circular movements are present. Another problem that arises when relying on these velocity curves is the possible existence of a bar in this section of the Galaxy.
There are also several works which link G347.600 + 00.211 to the open cluster [DBS2003] 179 which must be taken into consideration, since they derived distances to the cluster based on different methods and extend them to the ionized region. Borissova et al. (2012) used the O type stars identified in the cluster, together with Ks photometry data, to estimate a distance of 7.9 ± 0.8 kpc to the cluster. Mauerhan et al. (2011) associate to this cluster one of the WR stars (MDM32) that they identified spectroscopically; then, using the spectroscopic parallax of MDM32, they assigned a distance of 6.4 kpc to the cluster. Davies et al. (2012) assume that the cluster is associated with neighbouring molecular clouds, and infer a distance of 9.0 kpc. Other authors adopt distances of 6.3, 7.9, and 6.4 kpc for the cluster (Kharchenko et al. 2013; Morales et al. 2013 and Kuwahara et al. 2020, respectively). Given the high discrepancy in the distance estimates for [DBS2003] 179, we decided to adopt for the cluster and for G347.600 + 00.211 the spectrophotometric distance of 7.9 ± 0.8 kpc obtained by Borissova et al. (2012), who analysed the cluster extensively in a series of works using well-known techniques and their own data.
4 RESULTS
4.1 Radio continuum emission
Fig. 2 shows the emission distribution at 1420 MHz in the region of G347.600 + 00.211. An incomplete shell-like structure is clearly observed, which presents, as at IR wavelengths (see Fig. 1), an evident increase in flux density at l ∼ 347|${_{.}^{\circ}}$|6. In particular, two intense spots of emission are striking, in coincidence with the brightest emission areas observed at 8 |$\mu$|m. The [DBS2003] 179 massive cluster and the WR star 1181-81L are seen projected close to these intense regions.
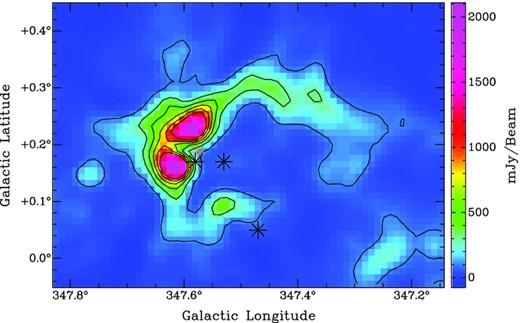
1420-MHz emission distribution. Contour levels are from 0.1 to 1.1 mJy beam−1 with a step of 0.2 mJy beam−1. The red and black asterisks indicate the location of DBS179 and the three WR stars, respectively.
4.2 Infrared emission
As described in Section 3 and shown in Fig. 1, G347.600 + 00.211 is very conspicuous in the IR bands. Fig. 1 clearly shows that the emission at 24 |$\mu$|m (seen in red) is distributed in the inner region of G347.600 + 00.211, in agreement with the fact that this emission mainly arises from warm dust which can reach rather high temperatures after absorbing high-energy photons. Following the shape of the distribution of heated dust, the emission at 8 |$\mu$|m (green in Fig. 1) is clearly observed in greater detail. This emission comes mainly from the polycyclic aromatic hydrocarbons (PAHs) present in PDRs, and it is a clear evidence that an energetic stellar radiation field is perturbing the surrounding neutral gas. The most striking features observed at 8 and 24 |$\mu$|m are the the two bright, arched structures indicated as b and c in Fig. 1. The IB S8 is also easily distinguished in these two IR bands. The 4.5-|$\mu$|m GLIMPSE band (blue in Fig. 1) reveals the point sources, since emission here is dominated by the stellar photospheres.
Fig. 3 shows the emission distribution at longer IR wavelengths. The emission at 8 (blue) and 70 (green) |$\mu$|m are seen spatially correlated with a slight trend of the latter bordering the inner part of the region, indicating that it is also tracing the warm dust that is mixed with the ionized gas. On the contrary, the emission at 250 (red) |$\mu$|m is detected mainly in the outer part of the H ii region, and it is mostly tracing the distribution of the cold dust. Then, assuming that the 250-|$\mu$|m traces the thermal emission generated by big grains (BGs), we find that the PAHs and BGs are not spatially correlated, and that PAHs emission appears distributed closer to the ionizing sources than the BGs, as already found by Paladini et al. (2012) around several evolved H ii regions.
Three-colour composite image of G347.600 + 00.211: Herschel PACS 70 and SPIRE 250 |$\mu$|m emission are in green and red, respectively. GLIMPSE 8 |$\mu$|m emission is in blue.
Marsh et al. (2017) derived density-weighted mean dust temperature and integrated H2 column density (NH2) maps, using the point process mapping (PPMAP) procedure3 with continuum Hi-GAL data in the wavelength range 70–500 |$\mu$|m. They assumed a gas to dust ratio of 100 to derive NH2. As can be seen from the top panel of Fig. 4, the colour temperature in the region of G347.600 + 00.211 ranges from 19 to 30 K. The two most intense emission regions possess the highest dust temperature, reaching temperatures of 28–30 K. The dust associated with the UC H ii region IRAS 17079–3905 mentioned in Section 3, has temperatures of ∼ 26 K. All of these hot spots lay closer to the projected locations of the stellar cluster and the two WR stars in its vicinity than the rest of the observed dust emission. Lower temperatures, of about 21-24 K, are detected in the rest of the structure including the IR bubble S8, which shows a colour temperature of about 23 K. All the estimated temperature values are typically observed in H ii regions (e.g. Anderson et al. 2012; Cichowolski et al. 2018). The bottom panel of Fig. 4 shows the NH2 distribution. The two pillar-like structures, with NH2 values higher than 600 × 1020 cm−2, are the most noticeable features. On the other hand, towards lower Galactic Longitudes, we can also distinguish the IB S8 and a dense structure that coincides with the molecular cloud F detected in the 12CO and 13CO emission distribution (see Section 4.3).
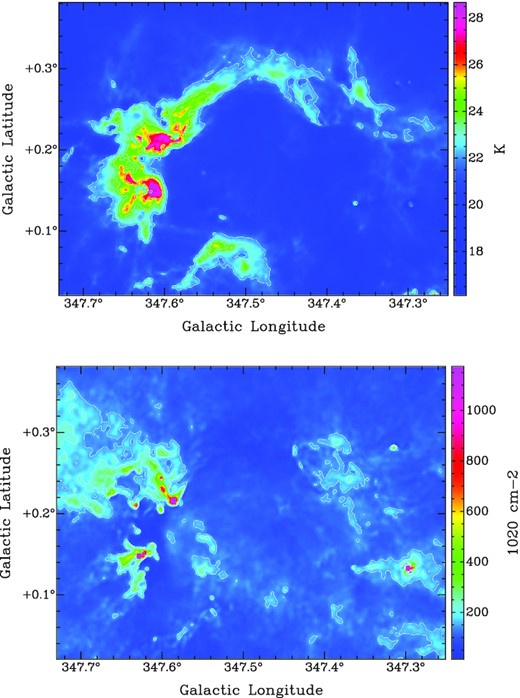
Top panel: Density-weighted mean dust temperature map, contour levels are 22, 24, 26, and 30 K. Bottom panel: H2 column density distribution, contour levels are 150, 200, and 300 in units of 1020 cm−2. Both maps were obtained from Marsh et al. (2017).
4.3 Sub-millimeter and molecular emission
The distribution of molecular gas can be appreciated in Fig. 5. The top and middle panels display the 12CO and 13CO emission distribution maps integrated within the velocity intervals from –102.62 to –86.49 |$\rm km\, s^{-1}$| and –100.47 to –90.02 |$\rm km\, s^{-1}$|. These velocity ranges were selected taking into account the velocities of the RRLs detected in the region (see Section 3) and where the presence of molecular emission is evident.
![Integrated emission maps from the Mopra survey (top and middle panels) and Spitzer/GLIMPSE survey IRAC-4 image (bottom); the images show the positions of the six molecular structures, identified with capital letters, as well as the three WR stars and [DBS2003] 179, marked in each of the maps with three asterisks and a cross, respectively. Top panel: 12CO emission integrated along the line of sight, in the velocity interval from –102.62 to –86.49 $\rm km\, s^{-1}$. Black contour values of 1.3, 1.8, 3.7, and 6.4 K are shown. Middle panel: 13CO emission distribution, integrated in the velocity interval from –100.47 to –90.02 $\rm km\, s^{-1}$. The black contours correspond to 0.25, 0.5, 1.0, and 2.5 K. Bottom panel: Emission map at 8 $\mu$m, with the black contours from the 12CO emission superimposed.](https://oup.silverchair-cdn.com/oup/backfile/Content_public/Journal/mnras/509/3/10.1093_mnras_stab3084/1/m_stab3084fig5.jpeg?Expires=1749891960&Signature=OIi6zcKOOHk8kPfvruB0j3o9wDgl7NYJpnyaWDFEuipJj5egMfunY6BmEVXl2-2pja5N6RVPQO0VWdol5R3qq5wvE4rXow99IeZd9C1nxOwLNhSat6sDVjWz7W11SlIO15NcIwBAMDajFKYIMqycatFVUYFGCIBlbBs8957~uF4B5b-QSCXyKIkkI-~VhLWVMztt7yHkS8q~k~aCALUlZH8iMRDVsf29ej1-hJfV3JaDItPzvMmJ1SnvXPwewiVMHTnqKNUIsR0zCOPtqjzwzrztxrlsxrVgOFTcPPYDQstDYK7ahChNwVM3Ra6wNO0~lhAIZPR2meHVnVj1Ib3wDA__&Key-Pair-Id=APKAIE5G5CRDK6RD3PGA)
Integrated emission maps from the Mopra survey (top and middle panels) and Spitzer/GLIMPSE survey IRAC-4 image (bottom); the images show the positions of the six molecular structures, identified with capital letters, as well as the three WR stars and [DBS2003] 179, marked in each of the maps with three asterisks and a cross, respectively. Top panel: 12CO emission integrated along the line of sight, in the velocity interval from –102.62 to –86.49 |$\rm km\, s^{-1}$|. Black contour values of 1.3, 1.8, 3.7, and 6.4 K are shown. Middle panel: 13CO emission distribution, integrated in the velocity interval from –100.47 to –90.02 |$\rm km\, s^{-1}$|. The black contours correspond to 0.25, 0.5, 1.0, and 2.5 K. Bottom panel: Emission map at 8 |$\mu$|m, with the black contours from the 12CO emission superimposed.
It is clear from Fig. 5 that the molecular emission is not uniformly distributed; most of the brightest emission is gathered at highest Galactic Longitudes while fainter emission is present at lower ones. Several structures can be distinguished, which seem to be arranged in an incomplete shell-like form, delimiting a large cavity. There are six molecular structures which stand out and have been identified in the three panels, which will hereafter be dubbed as A, B, C, D, E, and F, according to the location of their peaks of emission from higher to lower Galactic Longitudes. Comparing these structures in both CO maps, it is clear that most of them show a remarkable coincidence in their morphologies. In particular, objects B and C also show good agreements in their observed sizes and the positions of their maximums of emission. The three brightest structures – A, B, and C – are located at the higher Galactic Longitudes, with objects B and C having the most intense in 12CO and 13CO emission in their interiors. They also appear closer to the projected locations of [DBS2003] 179 and WR stars 1181-81L and 1181-82L than the rest of the structures. Clouds A, B and C are immersed in a fainter, vast molecular structure. The two fainter structures laying at the lowest Galactic Longitudes – E and F – appear to constitute the right side of the incomplete shell, though object E also displays a good morphological agreement with the IB S8. Cloud D lays the closest to WR star 1181-211L and looks the smallest in size in both molecular maps, with its 13CO emission looking significantly reduced in size and intensity compared to the rest of the molecular clouds.
In the bottom panel of Fig. 5, the 8-|$\mu$|m emission distribution is shown together with the 12CO molecular clouds indicated by contour levels. The molecular gas shows an excellent morphological correspondence with the IR emission, particularly in the brightest regions, indicating the molecular gas is being photodissociated by a stellar source (or sources) located inside the cavity, giving rise to PDRs. There is also noticeable coincidence in the form of the borders of structure E and S8, showing this structure as the molecular counterpart to the IR emission from the bubble. On the contrary, cloud D does not display such a good correspondence.
Table 1 summarizes the physical parameters of the six molecular clouds identified in Fig. 5, as derived from the 12CO and 13CO data. To obtain them we first integrated the 12CO and 13CO emission in the velocity interval in which each of the six clouds is detected. We then estimated, for each structure, the 12CO and 13CO peak temperature, Tpeak(CO) and Tpeak(13CO), respectively.
Physical parameters estimated for the six molecular structures detected in the 13CO and 12CO integrated emission maps.
| Tpeak(12CO) | Tpeak(13CO) | Δ v | Texc | τ13 | N(13CO) | N(H2) | M(H2) | |$n_{\mathrm{H}_2}$| | No. of clumpsa | |
|---|---|---|---|---|---|---|---|---|---|---|
| (K) | (K) | (|$\rm km\, s^{-1}$|) | (K) | (1016 cm−2) | (1022 cm−2) | (103 M⊙) | (103 cm−3) | |||
| A | 16.9 | 5.0 | 3.2 | 20.3 | 0.4 | 2.4 | 1.7 | 8.6 | 2.7 | 2 |
| B | 17.6 | 6.9 | 4.7 | 21.1 | 0.5 | 5.4 | 3.8 | 44.4 | 9.6 | 4 |
| C | 19.7 | 6.9 | 4.0 | 23.2 | 0.4 | 4.7 | 3.4 | 34.0 | 8.0 | 6 |
| D | 7.2 | 2.0 | 3.6 | 10.5 | 0.3 | 0.8 | 0.5 | 0.2 | 0.2 | 0 |
| E | 9.2 | 4.2 | 5.0 | 12.6 | 0.6 | 2.8 | 2.0 | 33.8 | 1.1 | 1 |
| F | 10.6 | 4.8 | 5.0 | 14.0 | 0.6 | 3.2 | 2.3 | 98.8 | 1.9 | 1 |
Number of catalogued cold clumps, identified at 870 |$\mu$|m, located over each cloud.
Fig. 6 displays the 870-|$\mu$|m emission distribution obtained from the ATLASGAL survey. At this frequency and with a 19|${_{.}^{\prime\prime}}$|2 angular resolution, it is possible to identify the very cold and dense regions, clumps, present inside the molecular clouds. Using this survey, Contreras et al. (2013) generated a compact source catalogue, which provides information about the location and properties of dusty clumps in the inner Galaxy. In Fig. 6, the location of the clumps catalogued in this region are indicated by ellipses whose semi-axis correspond to the sizes inferred by Contreras et al. (2013). As can be seen, the molecular clouds depicted in Fig. 5 have hierarchical internal structure; this is most notorious in the two densest clouds identified as B and C, which present several clumps inside. On the contrary, the clouds identified as E and F have only one cold region catalogued each, and the one named D does not have any. The lower number of dense clumps suggests fewer amount of material from which the clumps are formed, which is reflected in the values for the volume densities estimated for the molecular structures identified (see Table 1). In addition, there are also a few catalogued clumps that are not seen projected on to molecular gas detected in the velocity range from –102.6 to –86.5 |$\rm km\, s^{-1}$|, suggesting they are located at other distances. The location and shape of the more intense 870-|$\mu$|m emission show great correspondence with the densest structures observed in the N(H2) column density map obtained from IR data, as can be appreciated in Fig. 4 (bottom panel), which reaffirms the presence of small internal regions of cold and very dense material.
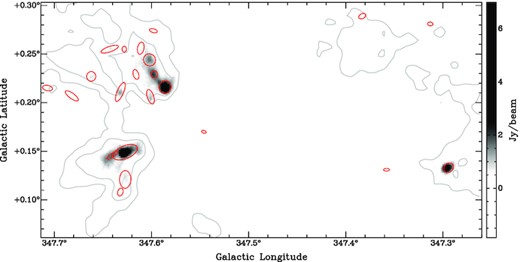
Emission map at 870 |$\mu$|m from the ATLASGAL survey, with contour levels of the CO emission at 2.3 and 4 mJy beam−1. The red ellipses indicate the positions and estimated sizes of the compact sources extracted by Contreras et al. (2013).
4.4 Identification of young stellar objects
Taking into account the high amounts of molecular gas in the area, we retrieved the infrared point sources from the Spitzer / GLIMPSE I+II + 3D and MIPSGAL 24-|$\mu$|m catalogues to search for cYSOs and analyse the distribution and evolutionary state of the young stellar population in the region.
To select candidate sources with IR excess we implemented the method described in the work of Gutermuth et al. (2009), which consists of several steps, the first of which involves applying to the sources a series of colour-based criteria in order to filter possible contaminant objects of varying nature. By constructing combinations of colour–colour diagrams (CCDs) the method makes use of the magnitudes detected at the four IRAC bands to first discard possible contaminants such as broad-line AGNs, PAH /star-forming galaxies, PAH emission sources, resolved /unresolved knots of shock emission, and other evolved or extragalactic objects with IR excess emission. After all the filters are applied, in the last steps cYSOs are identified and classified into Class I and Class II candidates. The former, more deeply embedded sources are characterized for their MIR emission excess stemming from warm dusty envelopes, and the latter are more evolved objects which show a gradual decrease in their MIR fluxes as a consequence of a dissipating envelope, while still accreting material through a circumstellar disk.
From the GLIMPSE source catalogue, a total of 5090 objects with all four IRAC magnitudes were detected in the region, but only those with uncertainties lower that 0.2 mag in all bands were kept, amounting to 4427 sources. The end result of the classification yielded a total of 66 cYSOs, composed of 20 Class I and 46 Class II candidates. For the former group, we could further confirm their classification into Class I YSOs by checking whether their IR fluxes continued to rise towards longer wavelengths using MIPS data. For those absent of MIPSGAL detection, we searched in the census of intrinsically red sources of Robitaille et al. (2008)4 for a 24 |$\mu$|m counterpart. We then calculated their [5.8–24] colour. This rendered 10 Class I sources which had to be re-classified as Class II cYSOs, resulting in a final tally of 10 Class I and 56 Class II cYSOs. The result of the selection process and subsequent classification is summarized in Table 2, where the last column indicates the type/s of emission structure/s over which the cYSO is seen projected on to.
List of point sources from the GLIMPSE I+II + 3D catalogue identified as cYSOs, and classified as Class I or Class II. The 24-|$\mu$|m magnitudes marked with an asterisk in column 8 correspond to values taken from Robitaille et al. (2008).
| Spitzer sources | ||||||||
|---|---|---|---|---|---|---|---|---|
| Id. | GLIMPSE name | (|$l\, ,\, b$|) | 3.6 |$\mu$|m | 4.5 |$\mu$|m | 5.8 |$\mu$|m | 8.0 |$\mu$|m | 24 |$\mu$|m | Emission structure |
| (°) | (mag) | (mag) | (mag) | (mag) | (mag) | |||
| (1) | (2) | (3) | (4) | (5) | (6) | (7) | (8) | (9) |
| Class I | ||||||||
| 1 | G347.2864 + 00.1373 | 347.286 , 0.137 | 14.4 | 12.5 | 11.3 | 11.2 | F/13CO | |
| 2 | G347.2918 + 00.1329 | 347.292 , 0.133 | 11.5 | 8.5 | 7.0 | 6.4 | 1.5 | F/13CO |
| 3 | G347.2975 + 00.2832 | 347.298 , 0.283 | 11.4 | 10.4 | 9.3 | 6.7 | 0.4* | PDR of E |
| 4 | G347.3875 + 00.0798 | 347.388 , 0.080 | 12.5 | 11.6 | 10.7 | 10.1 | NR | |
| 5 | G347.4330 + 00.2636 | 347.433 , 0.264 | 10.9 | 10.2 | 9.3 | 8.6 | 5.2* | PDR of E |
| 6 | G347.5318 + 00.1261 | 347.532 , 0.126 | 12.1 | 11.4 | 10.6 | 10.3 | NR | |
| 7 | G347.5443 + 00.2741 | 347.544 , 0.274 | 11.0 | 10.1 | 9.2 | 7.9 | 5.0* | PDR of C |
| 8 | G347.5874 + 00.1653 | 347.587 , 0.165 | 12.4 | 11.3 | 10.3 | 9.1 | 5.5* | NR |
| 9 | G347.6179 + 00.1319 | 347.618 , 0.132 | 9.6 | 8.3 | 7.1 | 6.1 | B/13CO | |
| 10 | G347.6282 + 00.1481 | 347.628 , 0.148 | 11.1 | 9.2 | 7.7 | 6.1 | B/13CO | |
| Class II | ||||||||
| 11 | G347.1641 + 00.1001 | 347.164 , 0.100 | 11.1 | 10.1 | 9.4 | 8.8 | 6.8 | NR |
| 12 | G347.1752 + 00.0855 | 347.175 , 0.086 | 6.9 | 6.6 | 6.0 | 5.5 | 2.7 | NR |
| 13 | G347.1795 + 00.1441 | 347.180 , 0.144 | 7.5 | 6.8 | 6.2 | 5.9 | 4.6 | NR |
| 14 | G347.1904 + 00.1237 | 347.190 , 0.124 | 12.2 | 11.8 | 11.4 | 11.0 | NR | |
| 15 | G347.2038 + 00.2729 | 347.204 , 0.273 | 9.6 | 9.2 | 8.7 | 7.9 | 5.8 | NR |
| 16 | G347.2178 + 00.2309 | 347.218 , 0.231 | 7.4 | 7.1 | 6.6 | 6.3 | 4.3 | F |
| 17 | G347.2303 + 00.2790 | 347.230 , 0.279 | 7.0 | 6.4 | 5.9 | 5.5 | 3.5 | NR |
| 18 | G347.2304 + 00.3247 | 347.230 , 0.325 | 10.8 | 10.1 | 9.4 | 8.8 | 7.1 | NR |
| 19 | G347.2563 + 00.0841 | 347.256 , 0.084 | 11.7 | 11.3 | 11.1 | 10.6 | NR | |
| 20 | G347.2628 + 00.1389 | 347.263 , 0.139 | 11.9 | 11.4 | 10.8 | 9.9 | 6.2 | F |
| 21 | G347.2699 + 00.1052 | 347.270 , 0.105 | 6.9 | 6.2 | 5.6 | 5.1 | 3.3 | F |
| 22 | G347.2764 + 00.2509 | 347.276 , 0.251 | 10.6 | 9.7 | 9.0 | 8.5 | 5.6 | PDR of F |
| 23 | G347.3166 + 00.2891 | 347.317 , 0.289 | 10.8 | 10.3 | 9.8 | 9.2 | PDR of E | |
| 24 | G347.3186 + 00.0962 | 347.319 , 0.096 | 6.7 | 6.4 | 5.9 | 5.7 | 4.1 | NR |
| 25 | G347.3206 + 00.2898 | 347.321 , 0.290 | 13.1 | 12.5 | 11.7 | 10.8 | PDR of E | |
| 26 | G347.3217 + 00.1275 | 347.322 , 0.128 | 10.9 | 10.2 | 9.6 | 9.0 | 6.5 | PDR of F |
| 27 | G347.3305 + 00.1299 | 347.331 , 0.130 | 6.8 | 6.4 | 5.8 | 5.4 | 3.7 | PDR of F |
| 28 | G347.3342 + 00.1929 | 347.334 , 0.193 | 7.4 | 6.4 | 5.6 | 5.3 | 4.7 | PDR of F |
| 29 | G347.3402 + 00.2860 | 347.340 , 0.286 | 6.6 | 6.3 | 5.8 | 5.5 | 3.6 | PDR of E |
| 30 | G347.3474 + 00.3212 | 347.347 , 0.321 | 12.1 | 11.3 | 10.4 | 9.6 | 7.0 | NR |
| 31 | G347.3607 + 00.2088 | 347.361 , 0.209 | 7.2 | 6.6 | 6.1 | 5.7 | 4.3 | PDR of E |
| 32 | G347.3670 + 00.2027 | 347.367 , 0.203 | 11.1 | 10.6 | 10.3 | 9.5 | 7.1* | PDR of E |
| 33 | G347.3885 + 00.1197 | 347.389 , 0.120 | 11.1 | 10.5 | 9.8 | 8.7 | 5.8 | NR |
| 34 | G347.3939 + 00.1309 | 347.394 , 0.131 | 12.6 | 12.1 | 11.7 | 11.1 | NR | |
| 35 | G347.3994 + 00.0680 | 347.399 , 0.068 | 9.9 | 9.1 | 8.4 | 7.8 | 4.3 | NR |
| 36 | G347.4290 + 00.0809 | 347.429 , 0.081 | 12.4 | 11.7 | 11.1 | 10.7 | NR | |
| 37 | G347.4421 + 00.2400 | 347.442 , 0.240 | 12.5 | 12.0 | 11.7 | 10.8 | PDR of E | |
| 38 | G347.4622 + 00.1577 | 347.462 , 0.158 | 11.2 | 10.9 | 10.5 | 10.0 | NR | |
| 39 | G347.4642 + 00.1025 | 347.464 , 0.103 | 10.2 | 9.1 | 8.4 | 7.7 | 4.8 | NR |
| 40 | G347.4788 + 00.1170 | 347.479 , 0.117 | 12.3 | 11.7 | 11.3 | 10.5 | NR | |
| 41 | G347.5106 + 00.2847 | 347.511 , 0.285 | 7.7 | 6.9 | 6.3 | 6.0 | PDR of C | |
| 42 | G347.5128 + 00.0928 | 347.513 , 0.093 | 6.6 | 6.2 | 5.5 | 5.3 | 3.6 | NR |
| 43 | G347.5237 + 00.0827 | 347.524 , 0.083 | 11.8 | 11.4 | 10.8 | 10.1 | NR | |
| 44 | G347.5278 + 00.3400 | 347.528 , 0.340 | 7.7 | 7.5 | 7.0 | 6.8 | 5.2 | NR |
| 45 | G347.5401 + 00.2454 | 347.540 , 0.245 | 13.1 | 12.3 | 12.0 | 11.1 | NR | |
| 46 | G347.5404 + 00.2113 | 347.540 , 0.211 | 12.1 | 11.8 | 11.3 | 10.8 | NR | |
| 47 | G347.5416 + 00.1529 | 347.542 , 0.153 | 12.3 | 11.6 | 11.2 | 10.1 | NR | |
| 48 | G347.5500 + 00.2864 | 347.550 , 0.286 | 7.5 | 6.7 | 6.0 | 5.5 | 3.8 | PDR of C |
| 49 | G347.5508 + 00.0625 | 347.551 , 0.063 | 8.8 | 8.6 | 8.1 | 7.8 | D | |
| 50 | G347.5606 + 00.2881 | 347.561 , 0.288 | 9.6 | 9.2 | 8.9 | 8.1 | PDR of C | |
| 51 | G347.5816 + 00.1254 | 347.582 , 0.125 | 10.1 | 9.2 | 8.3 | 7.6 | 5.0 | NR |
| 52 | G347.6047 + 00.0459 | 347.605 , 0.046 | 11.5 | 10.9 | 10.3 | 9.2 | NR | |
| 53 | G347.6060 + 00.1891 | 347.606 , 0.189 | 7.2 | 6.1 | 5.3 | 4.9 | 2.7 | NR |
| 54 | G347.6269 + 00.2507 | 347.627 , 0.251 | 10.4 | 10.1 | 9.6 | 9.3 | C | |
| 55 | G347.6370 + 00.1991 | 347.637 , 0.199 | 7.1 | 6.8 | 6.2 | 6.1 | PDR of A | |
| 56 | G347.6530 + 00.1541 | 347.653 , 0.154 | 11.7 | 11.2 | 10.8 | 10.1 | B | |
| 57 | G347.6848 + 00.1797 | 347.685 , 0.180 | 12.9 | 12.2 | 11.4 | 10.2 | NR | |
| 58 | G347.6917 + 00.2062 | 347.692 , 0.206 | 11.2 | 10.9 | 10.5 | 9.7 | PDR of A | |
| 59 | G347.6946 + 00.0450 | 347.695 , 0.045 | 7.0 | 6.6 | 6.1 | 5.8 | 4.6 | NR |
| 60 | G347.6971 + 00.2176 | 347.697 , 0.218 | 11.8 | 11.2 | 10.6 | 10.0 | PDR of A | |
| 61 | G347.7075 + 00.2289 | 347.708 , 0.229 | 7.1 | 6.2 | 5.6 | 5.0 | 1.8 | PDR of A |
| 62 | G347.7165 + 00.0980 | 347.717 , 0.098 | 13.8 | 12.8 | 12.2 | 10.4 | NR | |
| 63 | G347.7167 + 00.2726 | 347.717 , 0.273 | 7.8 | 6.8 | 6.0 | 5.7 | 5.6 | PDR de A |
| 64 | G347.7197 + 00.1783 | 347.720 , 0.178 | 12.5 | 12.0 | 11.4 | 10.5 | NR | |
| 65 | G347.7208 + 00.1056 | 347.721 , 0.106 | 7.7 | 6.7 | 5.8 | 5.1 | 2.1 | NR |
| 66 | G347.7277 + 00.3131 | 347.728 , 0.313 | 12.7 | 11.9 | 11.4 | 10.9 | NR | |
We would like to point out that, in addition to the Spitzer catalogues, the Wide-field Infrared Survey Explorer (WISE; Wright et al. 2010) AllWISE source catalogue (Cutri et al. ) was consulted as well. We followed the steps described by Koenig et al. (2012) and applied the colour–based filters used in their work to identify cYSOs from the point sources that were retrieved. Considering that the wavelengths of this survey largely overlaps with the Spitzer bands, which have better angular resolution, we carefully scrutinised the location of each WISE cYSO using the Spitzer data. We found that all those point sources that were not classified as a Spitzer cYSO as well were spurious sources, and therefore all AllWISE sources were rejected for further consideration.
We have also made use of the MSX Point Source Catalog (PSC) and followed the procedure elaborated by Lumsden et al. (2002) to look for massive YSOs (MYSOs) and compact H ii (CH ii) regions candidates, both infrared-bright objects and tracers of recent massive-star formation activity. The methodology resembles the one followed for the GLIMPSE catalogue; colour-colour plots are constructed using the four MIR fluxes of the sources, to filter out possible contaminants (PNs, shock emission, evolved objects) and classify the candidate sources. Only the sources with variability and reliability flags with values of 0 and flux qualities above 1 in all four bands were retrieved from the PSC, which amounted to 326 sources of which just 14 were left after applying the different constraints. In the end, the classification scheme rendered two MYSOs and four CH ii regions, whose basic photometric information and positionally related emission structure/s are detailed in Table 3.
List of point sources from the MSX PSC, identified as MYSOs or CH ii region candidates.
| MSXsources | |||||||
|---|---|---|---|---|---|---|---|
| Id. | MSX name | (|$l\, ,\, b$|) | FA | FC | FD | FE | Emission structure |
| (°) | (Jy) | (Jy) | (Jy) | (Jy) | |||
| (1) | (2) | (3) | (4) | (5) | (6) | (7) | (8) |
| MYSO | |||||||
| 1 | G347.5994 + 00.2031 | 347.599 , 0.203 | 0.5 | 1.9 | 7.1 | 23.8 | PDR of C |
| 2 | G347.6327 + 00.2551 | 347.633 , 0.255 | 0.5 | 2.3 | 2.6 | 7.4 | PDR of C |
| CH ii | |||||||
| 3 | G347.6348 + 00.1566 | 347.635 , 0.157 | 1.2 | 2.0 | 1.4 | 4.2 | B |
| 4 | G347.6370 + 00.1455 | 347.637 , 0.146 | 1.2 | 3.4 | 2.4 | 10.4 | B |
| 5 | G347.6392 + 00.1617 | 347.639 , 0.162 | 1.6 | 3.8 | 1.9 | 6.0 | B |
| 6 | G347.6398 + 00.2527 | 347.640 , 0.253 | 0.6 | 1.2 | 1.0 | 2.2 | PDR of C |
The spatial distribution of all the cYSOs found can be appreciated in Fig. 7, where they appear projected over the 8-|$\mu$|m emission. White level contours of 1.3, 1.8, and 3.7 K corresponding to the 12CO integrated emission (see Section 4.3) were superimposed to the PDR emission, to facilitate the identification and subsequent analysis of the projected locations of the cYSOs relative to the previously identified molecular structures, the photodissociation regions and their observed morphologies. The cYSOs observed distribution will be further discussed in Section 5.2.
![Spatial distribution of cYSOs obtained from the GLIMPSE I+II + 3D (in black) and MSX (in magenta) point source catalogues. The crosses represent class I cYSOs and the diamonds correspond to class II cYSOs, while the black x symbols indicate the Spitzer sources that were tagged as ‘NR’ (not related). The filled and empty circles stand for CH ii regions and MYSOs, respectively. The location of the UC H ii region IRAS 17079–3905 is marked with a red x symbol, while the positions of the YMC [DBS2003] 179 and WR stars are indicated by yellow symbols (see Fig. 1). The colour image corresponds to Spitzer / GLIMPSE 8 $\mu$m emission, the white contour levels to 12CO integrated emission from the Mopra survey at 1.3, 1.8, and 3.7 K, and the red contours to the emission at 0.4, 1, and 2.3 Jy beam−1 from the ATLASGAL survey. The six molecular structures identified in Section 5 are marked with white capital letters.](https://oup.silverchair-cdn.com/oup/backfile/Content_public/Journal/mnras/509/3/10.1093_mnras_stab3084/1/m_stab3084fig7.jpeg?Expires=1749891960&Signature=T0tDbAaHYs8Kn431C182v2Uz7n8GFSfEM8I0j9N9JuwhbW72SGASRtZro1bUyBaFURxVHeEaq4gbVGaiMwPBBUNssUvLP3DPPAmKrHUMu3iwmdiGPc6E50Mw~ruOA71EhctNGqSjHjlLYs6ORDV0j4y475Px-B~pXTuNKxyGe~tSyYdiCWwhzN5cFpEiAmQF1v9ljUS-kxfmuQwxkNP5R5Sugm2N4UT5bTrHncQkrOMlYZRDyXQKzcRvd3pfZV2Sr3YWrhJvfowgyepzJGMrO1Mo-98f1oyJ~3fQU7d8fpnPtRQxSFsvxkYwnto8fulvwjTOHUCWBu7ie5XYC4~5PQ__&Key-Pair-Id=APKAIE5G5CRDK6RD3PGA)
Spatial distribution of cYSOs obtained from the GLIMPSE I+II + 3D (in black) and MSX (in magenta) point source catalogues. The crosses represent class I cYSOs and the diamonds correspond to class II cYSOs, while the black x symbols indicate the Spitzer sources that were tagged as ‘NR’ (not related). The filled and empty circles stand for CH ii regions and MYSOs, respectively. The location of the UC H ii region IRAS 17079–3905 is marked with a red x symbol, while the positions of the YMC [DBS2003] 179 and WR stars are indicated by yellow symbols (see Fig. 1). The colour image corresponds to Spitzer / GLIMPSE 8 |$\mu$|m emission, the white contour levels to 12CO integrated emission from the Mopra survey at 1.3, 1.8, and 3.7 K, and the red contours to the emission at 0.4, 1, and 2.3 Jy beam−1 from the ATLASGAL survey. The six molecular structures identified in Section 5 are marked with white capital letters.
5 DISCUSSION
In the previous sections, we presented the observed emission from G347.600+00.211 at different ranges of the electromagnetic spectrum, described their distributions and complementarity, and introduced the population of cYSOs. The bright emission from the gas and dust components as well as the sheer size of the region and the peculiar projected locations of some of the cYSOs found, could all be linked to the existence of a significant amount of stellar source/s being harboured in the central cavity of the region. Thus, in this section we proceed to discuss the stellar content present in G347.600 + 00.211, and how it might be related to both the origin of the H ii region and the star formation activity taking place in the area.
5.1 Origin of the region
The great amount of ionizing radiation needed to explain the intense emission detected, points to the existence of several massive stars interacting with all the components of the ISM described in the previous sections. We therefore looked for high-mass stars in the Galactic O Star Catalogue (GOSC: Maíz Apellániz et al. 2013) and in the online5 compilation of all known Galactic Wolf–Rayet stars (Rosslowe & Crowther 2015) based on the 7th catalogue compiled by van der Hucht (2001) and van der Hucht (2006), and found that the YMC [DBS2003] 179 and the three WR type stars identified as 1181-81L, 1181-82L, and 1181-211L by Shara et al. (2012), are the only sources located in the area.
As mentioned in Section 3, Borissova et al. (2012) conducted an extensive study of [DBS2003] 179 (indicated by a yellow diamond in Fig. 7), and situated it very close to the Galactic Centre, at a distance of 7.9 ± 0.8 kpc. By means of IR photometric and spectroscopic information they detected several massive stars and determined their physical parameters. They identified three late WN or WR/LBV stars, at least five O If and five O V as stellar members of the cluster; thus, making this cluster a prime candidate for main ionizing source of G347.600 + 00.211.
The size of the cluster was first determined by Dutra et al. (2003), who estimated a 1.25-arcmin radius by visual inspection of the ‘Two Micron All Sky Survey’ (2MASS; Skrutskie et al. 2006) images. Borissova et al. (2008) calculated a 32 arcsec radius by applying a radial surface density profile, while Kharchenko et al. (2013), using the same technique, derived a radius of 3.45 arcmin. Using new techniques, we have revisited the size of the cluster. We constructed a stellar density map (see Molina Lera, Baume & Gamen 2018) and applied the statistical function provided by the python6 package ‘scipy stats Gaussian kde’.7 For this purpose, we selected the brightest sources (magnitudes at 3.6 |$\mu$|m < 12 mag) of the GLIMPSE Source Catalogue. We first conducted the study using all selected sources and afterwards we considered only those that satisfied dh < 7.1 kpc, where dh is the highest geometric distance determination (obtained from Bailer-Jones et al. 2020) and 7.1 kpc is the lowest value for the cluster distance adopted from Borissova et al. (2012). Our results show, in both cases, a stellar overdensity coincident with the cluster position, with a radius of ∼1.1 arcmin. In Fig. 8, we show the decontaminated stellar density map and the positions of the WR and O type stars across the region. Despite lying separate from the compact group of stars located at the densest area, we can see that the source identified as WC8 star 1181-81L (+ symbol in Fig. 8) is also enclosed by the isodensity curve of [DBS2003] 179, suggesting that this WR star is also a probable member of the cluster.
![Figures centred in the [DBS2003] 179 position covering a region of 12 × 12 arcmin. The grey curves correspond to isodensity stellar values. The black isodensity curve encloses the stellar cluster. Left-hand panel: Stellar density map where the bluest colours indicate the highest density values. Right-hand panel: WISE 3.4-$\mu$m band image, where red symbols represent the WR stars 1181-81L (cross) and 1181-82L (x), identified by Shara et al. (2012), and those which are previously known members of the cluster (red squares), while O type–stars are represented with blue circles.](https://oup.silverchair-cdn.com/oup/backfile/Content_public/Journal/mnras/509/3/10.1093_mnras_stab3084/1/m_stab3084fig8.jpeg?Expires=1749891960&Signature=kNH2wAL4XQaN7KfKfwbgiCFlgaSuUCco-ctIqjfhWsbMIcj41V3rCIBxElJPDAQlpsfdCpT5JUgoadaRULY2AwQozp7yugE1rQ5Ykcek4A4ysGkrFVJ-eV4SPgHYLmbbYuK2qZuchFhhaV2MYjbk~3mgsecevqHTjHu2-UcUBs1ksD-fmfwSqe5mZneWyBPclLoZ1TY-qZBSZVf~lI2v~L9fe0hEHq~RAsP81zI05VcsqGfx3Khwk39tjuMHROIn8uxe-mz9UXELco0FxEnisBqcKAv-4SAZLVHr64js9pF8eI4stLL3czdX~JoABls1B4XTmJ0tWZYmRpnMtX2DAA__&Key-Pair-Id=APKAIE5G5CRDK6RD3PGA)
Figures centred in the [DBS2003] 179 position covering a region of 12 × 12 arcmin. The grey curves correspond to isodensity stellar values. The black isodensity curve encloses the stellar cluster. Left-hand panel: Stellar density map where the bluest colours indicate the highest density values. Right-hand panel: WISE 3.4-|$\mu$|m band image, where red symbols represent the WR stars 1181-81L (cross) and 1181-82L (x), identified by Shara et al. (2012), and those which are previously known members of the cluster (red squares), while O type–stars are represented with blue circles.
On the contrary, the WR star 1181-82L (indicated by an x symbol in Figs 7 and 8) lies well outside the iso-density curve. This star has an estimated distance of 6.32 kpc (Shara et al. 2012). Taking into account the high uncertainty of about 25 per cent in this estimated value, together with the projected location of the star nearing the centre of the cavity of the H ii region, it is likely that the stellar radiation originating from this source is also contributing to the shaping of the emission structures observed. Its energetic photons could be reaching and affecting, in particular, the nearest point-like section of molecular cloud F. These arguments also point to a possible scenario in which the WR star could have once been part of the cluster and got ejected as consequence of dynamical processes. To explore this scenario, since we lack information about the stellar proper motion, we made a rough estimation of the spatial velocity needed for the WR star to reach its present location. Assuming that the star has been travelling for about 106 yr to cover the distance of about 7 pc that separates it from the centre of the cluster, we obtained that a spatial velocity of ∼ 7 km s−1 would be enough. Since this low velocity estimate is a canonically observed value, the proposed scenario cannot be ruled out.
Lastly, WR 1181-211L (yellow square in Fig. 7) was classified as a WN7 ± 2 star and assigned a distance of 5.51 kpc by Shara et al. (2012). Besides having the most different distance estimation, this star is the only one seen outside the cavity formed by the ionized gas, suggesting that it is not related to the region under study. Another point in favour of this scenario would be the presence of molecular gas at a similar distance than that estimated for the star, and whose shape shows a good agreement with its projected location. Analysing the distribution of the molecular gas in the vicinity of 1181-211L, we found a large molecular cloud whose morphology is highly indicative of it being disturbed by the star, at the velocity range from –71.8 to –59.1 |$\rm km\, s^{-1}$|(corresponding to kinematic distances of 5.7 and 5.1 kpc, respectively). The added morphological evidence together with the lower distance of the WR would then suggest that this massive star might be interacting with its own separate/unrelated local medium, without any contribution to the formation of the gas and dust structures that compose G347.600 + 00.211.
5.2 Analysis of the distribution of cYSOs and star formation processes in the region
In Section 4.4, we have identified several IR point sources candidate to be YSOs, which were presented in Tables 2 and 3, and displayed in Fig. 7. An inspection of this figure shows that around half of the cYSOs seem to be spatially correlated either with the 8-|$\mu$|m emission or the molecular gas. The emission structure we associate each cYSO with can be consulted at the last column of the two tables referenced above. There are also several cYSOs that appear to be unrelated to G347.600 + 00.211, which can be expected taking into account the large distance estimate to the region, its considerable size and the amount of the molecular gas in this part of the Galactic Plane. This could be the case, for instance, of the sources that are seemingly in locations devoid of molecular material, and in actuality could be related to a molecular cloud present at another velocity range. We counted 35 cYSOs of this type, which are indicated with the letters ‘NR’ (to stand for ‘Not Related’) in the last column of the aforementioned tables. From here on, we will not be considering these sources for further discussion. On the other hand, although the cYSOs which are seen projected on to molecular gas were not discarded, we must keep in mind that molecular gas could be present also at other velocities, indicating that sources that appear related to a given cloud could in truth be at another distance value, be it nearer or farther away.
We can see that several cYSOs are located in the densest areas of the molecular clouds, projected on to the cold, dense clumps identified at 870 |$\mu$|m (indicated by red contours in Fig. 7) where most new–born stars are expected to be found (Pokhrel et al. 2020). Particularly, all MYSOs and CH ii regions are located over the densest structures, inside clouds B and C.
The bright emission observed at 8 |$\mu$|m together with the remarkable morphological coincidence between the PDRs and the molecular emission, put in evidence a clear interaction between the dense, cold gas and the energetic radiation originating from the stellar component present in the region. This interaction is most notorious looking at the two densest molecular structures identified as B and C, given the intense emission from the bordering PDR, though there is also abundant photo–dissociated gas around the entire edge of G347.600 + 00.211. Other observational features which also stand out are the strong radio continuum emission (see Fig. 2), and the vast cavity defined by the distribution of molecular clouds described in Section 4.3, which is also detected over ∼15 |$\rm km\, s^{-1}$| in the H i emission distribution (not shown in this work). With an angular size of ∼ 20′ (46 pc at a distance of 7.9 kpc), this central void could have originated as a consequence of the sweep–up effects from powerful stellar winds. All of these are signs that highly–energetic stellar sources are at work, modifying the local medium and assisting in giving shape to the region as we see it today. Moreover, the presence of several cYSOs shows that there is still active star formation taking place in the molecular gas. However, working out the process/es that have given birth to them is not a simple matter. This is largely due to the numerous difficulties encountered when trying to determine with certainty the extent of the influence of the stellar feedback in the surrounding medium, which are very well summarized by Krumholz et al. (2014).
Observational studies of Galactic H ii regions usually rely on the detection of morphological features such as the ones found in this work to suggest that triggered star formation is taking place (e.g. Deharveng et al. 2006; Zavagno et al. 2006; Snider et al. 2009; Smith et al. 2010). Despite the difficulties in determining the spontaneous or triggered nature of the star-forming mechanism, due to the circumstantial evidence presented we could still assume there is some contribution from triggering processes to the global star formation rate in the area. Thus, we could consider the two methods most often cited in the literature for some of the cYSOs which draw our attention, due to their particular locations and the morphology of the emission that surrounds them. One such case is the Class I cYSO found at the border of the IB S8, projected over the intense emission from the PDR. Its peculiar position would be consistent with a scenario of star formation activity triggered by the expansion of the bubble over the molecular gas, whose ionizing source/s should be located in the interior of the bubble. This would be a prime example where the collect and collapse (C&C) process (Elmegreen & Lada 1977) could be at work. In this case, the material collected during the expansion of the ionized gas could have gone through gravitational collapse, giving way to star-forming processes. Another interesting case are the cYSOs that lay nearby the pointy section of structure F, at (|$l\, , b$|) ∼ (347|${_{.}^{\circ}}$|335 , 0|${_{.}^{\circ}}$|137), where the 12CO emission shows a good morphological correspondence with the bow-like form of the PDR. Since the small, disperse group of sources lay where the molecular gas is being photo–dissociated by the stellar UV photons, this poses a scenario in which the origin of these sources could be explained by the radiation–driven implosion (RDI) process (Lefloch & Lazareff 1994). This star-forming mechanism considers that the ionizing stellar radiation could be exerting enough pressure to further compress the ‘heads’ of preexisting pillar-like structures and drive the dense accumulated material to its implosion, giving birth to new stars. However, although the presence of cYSOs and the remarkable coincidence between the PDR and the molecular gas show that this area is being affected by the stellar radiation field, the 8-|$\mu$|m emission related to cloud F seems to be lacking in intensity and extension in respect to the PDRs related to clouds A, B, and C. This could be the result of geometric dilution effects of the stellar radiation that reaches the structure; being the farthest from the position of the YMC, the ionizing photons must travel further to arrive at the molecular gas, and this greater distance significantly lowers the amount of photons that reach it since they must distribute over a larger area.
Several interesting cYSOs are located on to molecular structures B and C, either distributed in their interiors or their associated PDRs. These two molecular clouds, together with structure A, show slightly elongated forms, seemingly arranged in arrow-like fashions with their brightest spots pointing towards the location of [DBS2003] 179. There are remarkable coincidences between the densest 12CO and 13CO clouds and the most intense 870-|$\mu$|m emission in their elongated shapes, locations and orientations. Being the closest to [DBS2003] 179, structures B and C show the most energetic molecular and PDR emission, with cloud B harbouring three of the identified CH ii regions, located where its PDR glows the brightest. On the other hand, at the ‘head’ of the cometary-like PDR associated with structure C, lays the UC H ii region IRAS 17079-3905 (see Section 3). Walsh et al. (1997) found that this IRAS source hosts a O5/O4 type star, which is consistent with our lack of detection of any objects of pre-stellar nature in its immediate surroundings. We also note that one of the two MYSOs (#1) is located over a bright rim feature very near the border of structure C, also in the direction of the YMC, which would make it another key location for the RDI star-forming mechanism to be at work taking into account its proximity to the ionizing cluster.
Even though we have proposed star-forming mechanisms for some of the cYSOs, the stellar formation process that would be in action at every individual case is a topic still under heavy discussion. In addition, given the clear in-homogeneity of the ISM in this area near the Galactic Plane, it would not be amiss to consider a probable scenario in which the RDI mechanism is acting simultaneously with C&C processes. This is analysed at length in works such as (Walch et al. 2015), who based on simulations propose that it is not one mechanism or the other that is at work when creating new generations of stars, but a mix of both processes acting at different instances and combining their effects. Moreover, another possible scenario is one where no stellar feedback is involved in the formation of some of the detected cYSOs. In this case, non-triggered star formation could be taking place in the densest structures, with the inner turbulence present in the molecular gas generating the gravitational instabilities that would lead to the fragmentation and subsequent collapse of the dense clumps (McKee & Tan 2003; Bonnell, Vine & Bate 2004).
Many complex hydrodynamical simulations have been developed over the years aiming to understand the physics behind stellar feedback processes, and several works which address the issue of induced star formation present models which show individual massive stars and clusters being born without any significant input of feedback. For instance, Dale, Ercolano & Bonnell (2012) simulate the turbulent evolution of molecular clouds with different initial conditions to investigate the effects of the photoionization from the O-type stars born in these structures. In all of their runs, dense regions and filamentary structures are formed, the majority of which give birth to massive stars and clusters containing O stars. However, their results show a very limited influence of ionization feedback from these objects on the star formation rate in every cloud, attributing most star-forming activity to being direct consequence of cloud turbulence.
Drawing similarities with Dale et al. (2012), the densest structures identified in G347.600 + 00.211 as ATLASGAL clumps, most of which are also positionally coincident with the high-density zones observed in the H2 column density map derived from Herschel data (see the bottom panel of Fig. 4), could have formed as a result of the turbulence present in the massive molecular cloud from which the YMC [DBS2003] 179 was also born. As it is also suggested in the simulations, the ionizing radiation from the newly born stars in the cluster could have had trouble interacting with the densest condensations distributed in the interior of the molecular complex, and would have only been able to significantly affect the less dense gas surrounding the preexisting clumps and pillar-like structures we see pointing towards the location of the cluster.
However, determining which, if any, of the identified cYSOs could have their origins linked to some form of feedback from the massive cluster [DBS2003] 179 is not obvious. This is exemplified in the simulations carried out in Dale & Bonnell (2012), in which the ionizing luminosity from an external stellar source interacts with a molecular cloud, and here too it is shown that the more diffuse molecular material is the most affected. Another interesting result obtained by Dale & Bonnell (2012) is that many new stars seem to form in the densest parts of the cloud complex nearest to the ionizing source, though it is also noted that some of these can be formed in the absence of feedback as well. The authors then conclude that they cannot accurately distinguish which cases would correspond to triggered star formation and which ones to an spontaneous birth.
Summing up, despite the evident effects of [DBS2003] 179 in its surrounding gas and dust, the extent of its influence in terms of inducing star formation is not clear, since for instance, we must take into consideration the joint contributions from the numerous O-type and other high-mass stars contained in this cluster to thoroughly investigate their effects. In order to further improve our understanding on this matter, hydrodynamical models that include all the different forms of stellar feedback and initial conditions are necessary to analyse the full impact of massive stars on their local neighbourhood as comprehensibly as possible, and to properly reproduce how all these components interact together. Even though the effects of turbulence, shocks, and a magnetized ISM and their interaction with stellar sources continue being under study, valid conclusions can still be drawn from comparing the simulated results with observations.
6 CONCLUSIONS
We performed a multiwavelength analysis of the H ii region G347.600 + 00.211 and studied its relation to the massive cluster [DBS2003] 179 and three Wolf–Rayet stars identified as possible ionizing sources of the region, reaching the following main conclusions:
The estimated total flux density obtained from the 1420-MHz data indicates that a large number of UV photons are necessary to explain the observed, extensive radio continuum emission. Given the numerous high-mass stars present in the YMC [DBS2003] 179, we consider this cluster to be the main ionizing source of G347.600 + 00.211.
The emission observed in the MIR bands replicates quite well the form of the radio continuum emission, indicating the ionized gas is well mixed with the warm dust and photodissociated gas, particularly in the two brightest spots of emission observed in the radio and IR frequencies.
The 12CO and 13CO integrated emission maps showed a remarkable morphological agreement with the 8-|$\mu$|m emission from the PDRs, revealing ample interaction between the ionizing stellar radiation and the molecular gas. Six molecular clouds were identified and characterized. The ones with highest volumetric densities were revealed to possess an internal structure, defined by denser sections in their interiors where ATLASGAL cold clumps were detected. The inner structure of the densest clouds is also clearly discerned in the H2 column density distribution map, which shows a good morphological coincidence with the clumps as well.
A reexamination of the size of [DBS2003] 179 via a stellar density analysis, in consideration with the estimated distance of the WR star 1181-81L, suggests this source could be part of the stellar cluster and therefore interacting with G347.600+00.211. Taking into account the position of WR 1181-82L with respect to the two brightest pillar-like structures, its location nearing the centre of the region and its estimated distance, we argue in favour of WR 1181-82L contributing to the emission detected and propose a scenario in which this star, once a member of [DBS2003] 179, was ejected from the cluster as a result of dynamical processes. Finally, we consider WR 1181-211L was not involved in the formation of G347.600 + 00.211 due to its significantly lower distance value and the detection of a molecular cloud possibly being affected by this WR star.
Inspecting the spatial distribution of cYSOs and considering the candidates located over either the identified molecular structures or their associated PDRs, we found 33 cYSOs and 4 CH ii regions possibly associated with G347.600 + 00.211, with several of them projected on to the densest clouds and their bright rims. We propose different origins for the identified candidates, and put forward particular cases which could be the result of either the C&C or RDI mechanism. However, we do not discard scenarios where a mix of both processes could explain their formation or where no triggering is involved. Ultimately, though our observational study does not allow us to establish for certain the star-forming process that gave birth to each of these candidates, we believe there is clear morphological evidence of stellar feedback from the massive cluster acting up in the region, which in turn could lead to induced star formation taking place in some measure.
In summary, we can conclude that the large, highly bright emission structures that conform G347.600+00.211 are evidence of a great amount of ionizing photons interacting with the medium, originating from numerous massive stars located in the vicinity of the region, which contribute to the shaping of G347.600 + 00.211 and to kick-start the formation of new stars to a greater o lesser extent via stellar feedback.
ACKNOWLEDGEMENTS
We are deeply grateful to the referee, whose valuable comments, corrections and suggestions helped to improve this work significantly. We also include the following acknowledgements for the use of databases and/or its data products. This research has made use of the VizieR catalogue access tool, CDS, Strasbourg, France (DOI: 10.26093/cds/vizier). The original description of the VizieR service was published in 2000, A&AS 143, 23. This publication makes use of data products from the Wide-field Infrared Survey Explorer, which is a joint project of the University of California, Los Angeles, and the Jet Propulsion Laboratory/California Institute of Technology, funded by the National Aeronautics and Space Administration. This research has made use of the NASA/IPAC Infrared Science Archive, which is funded by the National Aeronautics and Space Administration and operated by the California Institute of Technology. The ATLASGAL project is a collaboration between the Max-Planck-Gesellschaft, the European Southern Observatory (ESO) and the Universidad de Chile. It includes projects E-181.C-0885, E-078.F-9040(A), M-079.C-9501(A), M-081.C-9501(A) plus Chilean data. We thank ATNF and CSIRO for the use of the SGPS data. The SGPS is based upon work supported in part by the U.S. National Science Foundation through grant AST-0307358 to Harvard College Observatory and grant AST-9732695 to the University of Minnesota. This research made use of Montage. It is funded by the National Science Foundation under Grant Number ACI-1440620, and was previously funded by the National Aeronautics and Space Administration’s Earth Science Technology Office, Computation Technologies Project, under Cooperative Agreement Number NCC5-626 between NASA and the California Institute of Technology. JAM-L and RG acknowledge support from CONICET grant PIP 112-201701-00055. SC, SBC and LAS acknowledge support from CONICET grant PIP 112-201701-00604. RG acknowledges support of the UNLP project 80120180200065LP.
DATA AVAILABILITY
The data sets were derived from sources in the public domain: GLIMPSE (I+II + 3D) source catalogue at https://vizier.u-strasbg.fr/viz-bin/VizieR-3?-source = II/293; MIPSGAL 24-|$\mu$|m point source catalogue at https://vizier.u-strasbg.fr/viz-bin/VizieR-3?-source = J/AJ/149/64/catalog; Galactic Midplane Spitzer red sources at https://vizier.u-strasbg.fr/viz-bin/VizieR-3?-source = J/AJ/136/2413/table2; MSX Point Source Catalogue at https://irsa.ipac.caltech.edu/cgi-bin/Gator/nph-dd; ATLASGAL compact source catalogue at https://vizier.u-strasbg.fr/viz-bin/VizieR?-source = J/A + A/549/A45. ATLASGAL calibrated map at https://atlasgal.mpifr-bonn.mpg.de/cgi-bin/ATLASGAL_DATASETS.cgi; SGPS radio continuum map at 1420 MHz taken from https://www.atnf.csiro.au/research/cont/sgps/queryForm.html; Spitzer and WISE maps at https://irsa.ipac.caltech.edu/frontpage/; Mopra CO maps at https://dataverse.harvard.edu/dataset.xhtml?persistentId=doi:10.7910/DVN/LH3BDN; Herschel emission maps taken from http://archives.esac.esa.int/hsa/whsa/.
Footnotes
QUEST (QU Extragalactic Survey Telescope) at DASI (Degree Angular Scale Interferometer). See Hinderks et al. (2009) for a detailed description of the instrument.
REFERENCES
Author notes
PhD Fellow of CONICET, Argentina.
