


ABSTRACT
On the basis of the Galaxy Evolution Explore (GALEX) ultraviolet (UV) data, many studies have demonstrated that recent star formation (RSF) is common in early-type galaxies. In particular, near-ultraviolet (NUV) light is used to investigate star formation activity in early-type galaxies, owing to its high sensitivity to the presence of young stars. This study characterized the stellar population properties of luminous early-type galaxies (Mr ≤ −20.65 mag) in the redshift range 0.005 ≤ z ≤ 0.09 on the basis of the Sloan Digital Sky Survey (SDSS) data. Initially, the most frequently used criterion of NUV |$-\, r$| ≤ 5.4 was applied to identify early-type galaxies with RSF, and 19 per cent (172/913) of the sample galaxies met this criterion, in agreement with previous studies. A more robust sample of galaxies with RSF along with a stricter criterion (70 galaxies with NUV |$-\, r$| ≤ 5.0) were then used for further analysis, and consequently 7.7 per cent (70/913; lower limit of the RSF fraction) of the sample galaxies were classified as early-type galaxies with RSF. These galaxies tended to exhibit higher H β absorption-line strengths and stronger emission lines than quiescent (QST, NUV |$-\, r$| > 5.4) early-type galaxies. The most prominent feature of early-type galaxies with RSF identified in this study was that they were more metal-poor than QST galaxies owing to metal-poor stellar populations that were possibly formed from materials accreted from gas-rich satellites during (minor) mergers or interactions. The results strongly indicate that the observed RSF in the sample galaxies at the present epoch is mainly driven by external processes (i.e. mergers or interactions).
1 INTRODUCTION
Early-type galaxies have traditionally been viewed as simple stellar systems in terms of their dynamics and stellar populations. While the majority populations of early-type galaxies are old that were formed early in highly efficient starbursts at high redshifts, numerous recent studies based on ultraviolet (UV) and integral-filed spectroscopy (IFS) data have reported that several early-type galaxies possess a small number of young stellar populations.
In particular, with UV data, the star formation history of galaxies can be probed with considerably greater accuracy compared with the use of only optical data, since UV data are more sensitive to the presence of young stellar populations than optical data. For instance, Ferreras & Silk (2000) investigated early-type galaxies in Abell 851 (z ∼ 0.41) using the Hubble Space Telescope (HST) F300W − F702W colours and reported a significant fraction of faint blue early-type galaxies. Later, by using Galaxy Evolution Explorer (GALEX) data, Yi et al. (2005) studied the near-ultraviolet (NUV) colour–magnitude relation (CMR) of early-type galaxies, and found a significantly large scatter towards blue colour. Subsequently, Kaviraj et al. (2007) claimed that at least 30 per cent of early-type galaxies have experienced recent star formation (RSF) in the last billion years, and Jeong et al. (2009) concluded that these galaxies with RSF are generally drawn from the lower stellar velocity dispersion (see also Schawinski et al. 2007a), and that the majority of the Fundamental Plane (FP) tilt and scatter could be explained if it could be considered that the properties of a substantial fraction of early-type galaxies are influenced by RSF. Furthermore, high-resolution far-ultraviolet HST/ACS images have indicated that several early-type galaxies have extended star formation histories (Salim & Rich 2010). Recently, using spectra from the SDSS-III Baryon Oscillation Spectroscopic Survey (BOSS) covering the NUV passband, Salvador-Rusiñol et al. (2020) observed that many early-type galaxies show signs of recent (< 2 Gyr) star formation (at the 0.5 per cent level by stellar mass), and Werle et al. (2020) noted that young stellar populations (< 1 Gyr) are essential to reproduce the UV emission of 17 per cent of early-type sample galaxies considered in their study.
Numerous studies based on IFS data, such as Spectroscopic Areal Unit for Research on Optical Nebulae (SAURON; Bacon et al. 2001; de Zeeuw et al. 2002), ATLAS|$^{\tt 3D}$|(Cappellari et al. 2011), Calar Alto Legacy Integral Field Area Survey (CALIFA; Sánchez et al. 2012), Sydney-Australian-Astronomical-Observatory Multi-object Integral-field Spectrograph (SAMI; Croom et al. 2012), and Mapping Nearby Galaxies at Apache Point Observatory (MaNGA; Bundy et al. 2015) data, have also provided additional evidence supporting the varied formation histories of early-type galaxies (Emsellem et al. 2004; Sarzi et al. 2006; Davis et al. 2011; Barrera-Ballesteros et al. 2015; Jin et al. 2016; Bryant et al. 2019).
Other studies have also pointed to the diversity of populations in early-type galaxies (see, e.g. Bica & Alloin 1987; Trager et al. 2000; Fukugita et al. 2004; van Dokkum 2005; Young, Bendo & Lucero 2009; Sheen et al. 2012; La Barbera et al. 2014; Vazdekis et al. 2016). In particular, frequent discoveries of early-type galaxies with disturbed features, such as shells and tidal debris, in both field (e.g. ∼ 70 per cent of bulge-dominated early-type galaxies in the study of van Dokkum 2005) and cluster (e.g. ∼ 40 per cent of red-sequence galaxies in the study of Sheen et al. 2012) environments constitute direct observational evidence of the star formation history of early-type galaxies being complex.
While early-type galaxies have shown complex star formation histories, the mechanism underlying RSF is yet to be ascertained. One possibility is that RSF in early-type galaxies is related to gas accretion via mergers or interactions (i.e. external processes; Salim & Rich 2010; Kaviraj et al. 2011; Chung et al. 2012; Kaviraj 2014; Serra et al. 2014; Werle et al. 2020). Notably, gas cooling (i.e. internal processes, Mathews & Brighenti 2003; Valentini & Brighenti 2015; Sheen et al. 2016) is a compelling mechanism for RSF in early-type galaxies. In general, the metallicity of RSF and QST galaxies would not differ if RSF were to be caused by internal processes, whereas if stars are formed by gases accreted from a low-mass satellite, galaxies with RSF are expected to be more metal-poor than QST galaxies. Crockett et al. (2011) and Kaviraj et al. (2012) found low metal star-forming regions in NGC 4550 (a barred lenticular galaxy in the Virgo cluster) by using the HST Wide Field Camera 3 (WFC3) NUV and optical data and suggested that minor mergers were significant. Recently, Werle et al. (2020) claimed that RSF in early-type galaxies is related to rejuvenation events triggered by external processes based on the spectral energy distribution (SED) fitting method. Therefore, it is important to investigate the metal abundance of galaxies with RSF relative to QST galaxies on the basis of the absorption-line strength, which is the most direct indicator of stellar metallicity.
This study investigated the metallicity of early-type galaxies with RSF to determine the main driving mechanism of RSF. The sample galaxies and their properties are described in Sections 2 and 3, respectively, and the main mechanism driving the observed RSF in early-type galaxies is discussed in Section 4. Finally, the conclusions are presented.
2 DATA AND SAMPLE
We selected all SDSS DR7 galaxies with spectra in the redshift range 0.005 ≤ z ≤ 0.09 and applied an absolute r-band magnitude cut-off of −20.65 to obtain a volume-limited sample. Furthermore, following Yi et al. (2005), we adopted a fracDev cut of 0.95 in the g, r, and i bands to select early-type galaxies. This method is suitable for selecting early-type galaxies with a de Vaucouleurs profile, but some early-type galaxies with an exponential profile may be excluded.
Morphological classification based on visual inspection was also performed by three authors by using the SDSS DR7 colour-composite images, and only those galaxies that were unanimously voted by the three authors as being early-type galaxies were classified as early-type galaxies. Thus, a robust sample set was constructed.
The UV−optical colour is an appropriate indicator for classifying a sample set of galaxies into RSF and QST early-type galaxies. Therefore, we cross-matched the position of our candidates with the GALEX GR6/7 archive with a 5-arcsec tolerance and selected a UV source with a long exposure time.
An additional consideration in the sample selection was the quality of spectroscopic data. The Oh–Sarzi–Schawinski–Yi catalogue (Oh et al. 2011, hereafter OSSY) provides the signal-to-noise (S/N) ratio and a quality assessment value for the spectra based on a continuum fit (rN/sN; see section 3 of OSSY). We applied thresholds of 10 and 1.5 for the S/N ratio and rN/sN, respectively, to select galaxies with high-quality spectroscopic data.
These steps yielded a final sample set containing 914 early-type galaxies. The selection criteria are summarized in Table 1. The redshift (top panel) and r-band absolute magnitude (bottom right-hand panel) distributions of our sample galaxies are presented in Fig. 1. Although the sample galaxies were selected from a volume-limited sample, there are regions without samples (e.g. −21.00 ≤ Mr ≤ −20.65 and 0.075 ≤ z ≤ 0.09) owing to limitations in the visual inspection of SDSS images.
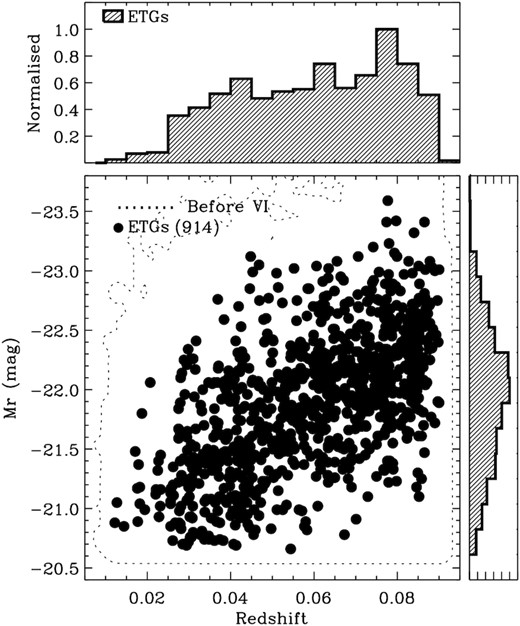
Redshift of our sample galaxies as a function of r-band absolute magnitude. All galaxies (adopting only the fracDev cut) are displayed as a contour plot for comparison.
Summary of sampling criteria.
| Criterion | Purpose |
|---|---|
| 0.005 ≤ z ≤ 0.09 | To limit redshift for morphological classification |
| Mr ≤ −20.65 | The absolute r-band magnitude cut-off for a |
| volume-limited sample | |
| S/N ≥ 10 | To guarantee the quality of spectroscopic data |
| rN/sNa ≤ 1.5 | To guarantee the quality of the fit to the |
| stellar continuum |
a rN/sN is the quality assessment parameter of OSSY.
3 PROPERTIES OF EARLY-TYPE GALAXIES
3.1 UV colour–magnitude relations
Galaxies are known to populate three main regions of the colour–magnitude diagram: the red-sequence, the blue cloud, and the green valley in-between. Early-type galaxies generally belong to the red sequence, specifically under optical colours, as the majority of their populations are old and metal-rich. Accordingly, the UV CMR is an appropriate tool for tracing young stellar populations in early-type galaxies owing to its high sensitivity toward the presence of young stars of age less than 1 Gyr (see fig. 7 of Kaviraj et al. 2007).
It is noteworthy that the UV intensity can also be increased by active galactic nucleus (AGN). The ratio of the emission lines is widely used to distinguish various classes of galaxies, depending on their ionization mechanisms. The most frequently used method for this purpose is the optical diagnostic Baldwin–Phillips–Terlevich (BPT) diagram (Baldwin, Phillips & Terlevich 1981), involving the use of the [O iii]/H β and [N ii]/H α ratios. The BPT diagram of our sample galaxies is presented in Fig. 2, and it is based on four emission lines from OSSY whose amplitude-over-noise (A/N) values exceed three. The demarcation lines suggested by Kauffmann et al. (2003, dashed curve), Kewley et al. (2001, 2006, solid curve), and Schawinski et al. (2007b, straight line) were used to classify galaxies into four types, namely star-forming, composite, Seyfert, and low-ionization nuclear emission-line region (LINER), and a Seyfert galaxy was excluded from the sample.
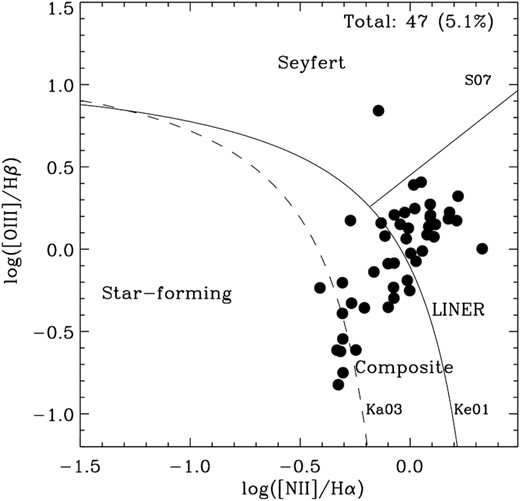
Emission-line ratio diagram for our sample galaxies. The curve labelled Ka03 denotes the purely star-forming empirical limit of Kauffmann et al. (2003), and curve labelled Ke01 represents the theoretical maximum starburst model of Kewley et al. (2001, 2006). The straight line labelled S07 is from Schawinski et al. (2007b) and divides Seyfert and LINER AGNs.
Optical and UV CMRs to which Galactic extinction correction1 and k-correction 2 were applied are presented in Fig. 3. Using the empirical demarcation line given by NUV |$-\, r$| = 5.0 (dashed line in the bottom panel), which is a stricter criterion than that the criterion used by Yi et al. (2005) and Kaviraj et al. (2007) for selecting genuine early-type galaxies with RSF, we identified galaxies that have experienced RSF (blue filled circles). Galaxies with NUV |$-\, r$| > 5.4, which is the value obtained from the red-sequence fit by Yi et al. (2005) (see the dotted line in the bottom panel), were also selected as control samples (QST, black open circles). Compared with the optical CMR (top), the UV CMRs (middle and bottom) show a larger scatter owing to the presence of galaxies with RSF. For instance, the scatter is found to increase by 23 per cent when errors based on the least-square fits of NUV |$-\, r$| and |$u\, -\, r$| are compared. The overall fraction of our RSF early-type galaxies is approximately 7.7 per cent (70/913), which is a lower limit because of our strict criterion used for selecting RSF galaxies compared with previous studies (see, e.g. Yi et al. 2005; Kaviraj et al. 2007; Jeong et al. 2009). The RSF fraction increased to 19 per cent (172/913) for Yi et al.’s (2005) criterion of NUV |$-\, r$| ≤ 5.4.
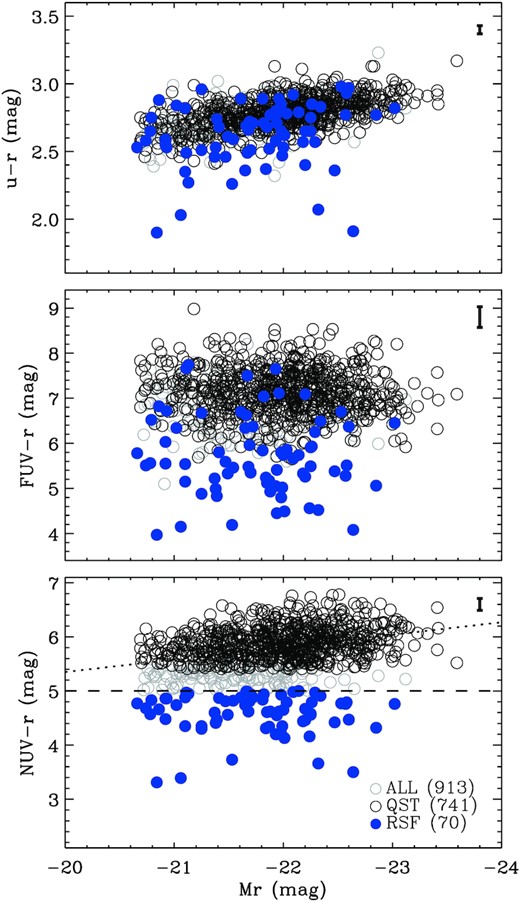
Optical and UV CMRs for our sample galaxies. The |$u\, -\, r$| (top panel), FUV |$-\, r$| (middle panel), and NUV |$-\, r$| (bottom panel) colours are shown as a function of the r-band absolute magnitude. The dashed line in the NUV |$-\, r$| CMR indicates the cut-off used to identify RSF early-type galaxies, and the dotted line is the red-sequence fit from Yi et al. (2005). On the basis of these thresholds, we divided the sample into RSF (blue filled circles), composite (grey open circles), and quiescent (QST; black open circles) early-type galaxies.
Supporting our empirical NUV|$\, -\, r$| threshold, our galaxies with RSF exhibited a 17 times higher rate of strong emission lines (∼ 32.9 per cent, 23/70) than QST galaxies (∼ 1.9 per cent, 14/741). In other words, nearly one-third of RSF galaxies showed emission lines and the bulk of the emission was star-forming or composite, whereas most QST galaxies were virtually free of emission lines or classified as LINER.
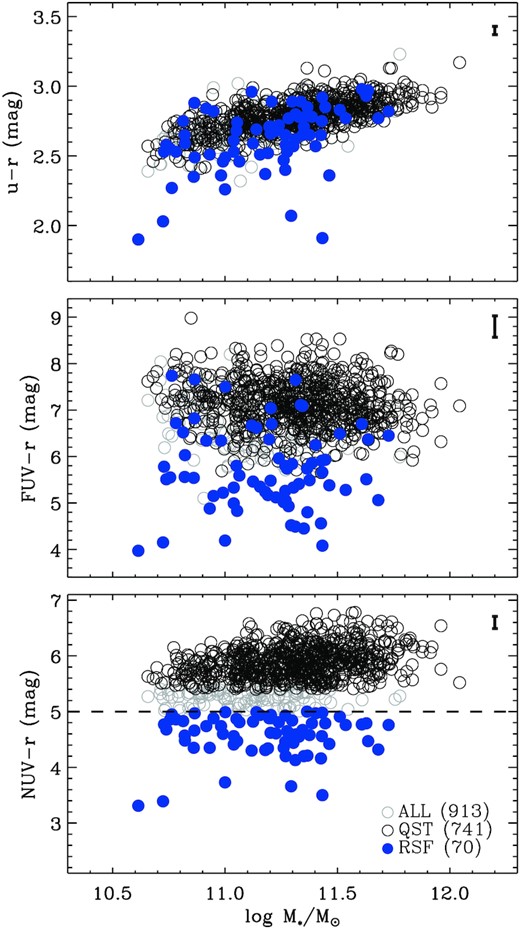
Optical and UV colour–stellar mass relations of our sample galaxies. The symbols are the same as those in Fig. 3.
SDSS images of our RSF and QST early-type galaxies are presented in Figs 5 and 6, and they show that there were no morphological differences between their optical images.
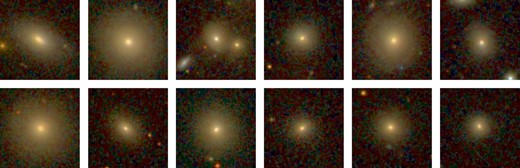
Sample SDSS colour-composite images of our RSF early-type galaxies. Each image shows an area of 50 × 50 arcsec 2.
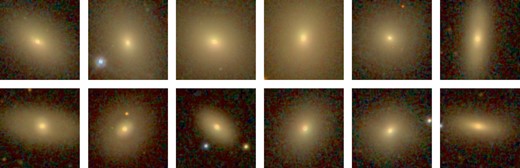
Same as Fig. 5 but for QST early-type galaxies.
3.2 Stellar population parameters
To understand the star formation history of early-type galaxies with RSF, we initially investigated the H β, Mg b, Fe 5270, and Fe 5335 line strengths obtained from OSSY, and the observed line indices of our RSF and QST early-type galaxies in the [MgFe]′3–H β plane are shown in Fig. 7. This figure also shows the simple stellar population models proposed by Thomas et al. (2003) for fixed [α/Fe] = 0.3. Galaxies with RSF exhibited stronger H β line strengths, which provided evidence for RSF, and weaker [MgFe]′, which implied lower metal abundance relative to QST galaxies. For reference, the mean H β and [MgFe]′ values of our galaxies with RSF were 1.94 and 3.02 Å, respectively, whereas those of QST galaxies were 1.73 and 3.33 Å. It is noteworthy that the results of a simulation indicated that galaxy mergers or interactions can dilute the overall metallicities of the galaxies involved owing to inflows of metal-poor gases (see, e.g. Rupke, Kewley & Barnes 2010).
![Top panel: distribution of [MgFe]′ for RSF (blue shaded) and QST (black solid) early-type galaxies. Bottom left-hand panel: index measurements for our RSF (blue filled circles) and QST (black open circles) galaxies with the stellar population models of Thomas, Maraston & Bender (2003). Bottom right-hand panel: distribution of H β for our RSF and QST galaxies.](https://oup.silverchair-cdn.com/oup/backfile/Content_public/Journal/mnras/509/1/10.1093_mnras_stab2990/1/m_stab2990fig7.jpeg?Expires=1750228399&Signature=30jZoDw9aPGMTtQsgXoQv2wBkNPWPOWxrhxL1XDPWsQvoKx4wUpw3s8Kvg01GHBAbl2Bj5EJL6yVUAAUMroD4w7af4MR3S7TqpRJwW8UyzZ1t~VpfYmRX1pLg2MFBAjv59Beyq81cHaJAvTDJp2dSQ5u4nfs1RUwU9QhrvQkNJKfsgJ~WbmMjg4XsBKO7WIrJLEA6cB4EKVanRRXcPKsxlrZvVICQgDtNpq9te0FPpII95RGS~duUAkvHF4m6ZweOBI4tQkwoVB0ymoJmnGFH4k9cVg-9qflDrezzCECY0xnNs~zGHzhVZ~50867n7kdWsPv9F9SqL4zX-85u03~PQ__&Key-Pair-Id=APKAIE5G5CRDK6RD3PGA)
Top panel: distribution of [MgFe]′ for RSF (blue shaded) and QST (black solid) early-type galaxies. Bottom left-hand panel: index measurements for our RSF (blue filled circles) and QST (black open circles) galaxies with the stellar population models of Thomas, Maraston & Bender (2003). Bottom right-hand panel: distribution of H β for our RSF and QST galaxies.
Stellar population parameters, such as age, metallicity, and stellar abundance ratios, can serve as effective tools for probing galaxy properties and star formation histories. We estimated the age and metallicity of our RSF and QST early-type galaxies using the Lick index grid method (see, e.g. Khim et al. 2015) and the grids of the [MgFe]′–H β and Mg b–|$\langle \rm Fe \rangle$|4 planes modelled by Thomas et al. (2003). To obtain highly accurate estimates, we interpolated the models; the parameter ranges were spanning age = 1–15 Gyr (in intervals obtained with 71 steps), [Z/H] = −1.35 to 0.35 (18 steps), and [α/Fe] = 0.0–0.5 (11 steps). For outliers lying outside the model grids, we used the best-fitting values at the boundary of the models. It should be noted that this method provides the luminosity-weighted age and metallicity that is biased towards younger and brighter stellar components of galaxies.
The results are presented in Fig. 8, and they show considerable differences in the age and metallicity distributions between our RSF (blue filled circles and shaded histograms) and QST (black open circles and solid histograms) galaxies. For reference, the Kolmogorov–Smirnov (KS) test for both the age and metallicity distributions of our RSF and QST galaxies yielded a probability less than 0.001; hence, the null hypothesis of no difference can be rejected.
![Top panel: distribution of the derived metallicity ([Z/H]) for RSF (blue shaded), RSF subsample (green filled), and QST (black solid) early-type galaxies. Bottom left-hand panel: Metallicity ([Z/H]) of RSF (blue filled circles), RSF subsample (green open stars), and QST (black open circles) galaxies as a function of the stellar age. Bottom right-hand panel: distribution of the derived stellar age of our RSF (blue shaded), RSF subsample (green filled), and QST galaxies (black solid).](https://oup.silverchair-cdn.com/oup/backfile/Content_public/Journal/mnras/509/1/10.1093_mnras_stab2990/1/m_stab2990fig8.jpeg?Expires=1750228399&Signature=YG7-jxGv2lLo91P~CMUQfaFpGQwpGYdv~HfhwvIpWvKM2vK1ENC2gbbdPam3CEDFrnFuqdF-ggL0m8i~VGi70uD16TciShzqZcrz2aX2iaHUUGFNKcBl-7hK~WFs4pbkKYrjc4CFQYOrrNVCPFv8veefM98JJGvWfzx6uBmB9rrH0f2iWBNhB4uZNigRUiFDYiY7vTn3P9sc6dbzpaLRIBbseNvfBHPpsKH6NtnZ~lRqq9wrJqh0BkEiBNeajIRl6uFRgxlSFY~lmf0RlsPAYxKsEhvclRQzRN8pc7q79hKmQ7y78ifGo~92qA93TZfmoSna0IkHUJTLa1-JjPFSWg__&Key-Pair-Id=APKAIE5G5CRDK6RD3PGA)
Top panel: distribution of the derived metallicity ([Z/H]) for RSF (blue shaded), RSF subsample (green filled), and QST (black solid) early-type galaxies. Bottom left-hand panel: Metallicity ([Z/H]) of RSF (blue filled circles), RSF subsample (green open stars), and QST (black open circles) galaxies as a function of the stellar age. Bottom right-hand panel: distribution of the derived stellar age of our RSF (blue shaded), RSF subsample (green filled), and QST galaxies (black solid).
Given that UV colours are often used as a proxy for star formation activity, an RSF subsample with a stricter criterion could show clearer discrepancies in the age and metallicity distributions when compared with QST galaxies. Accordingly, we selected RSF subsample galaxies with NUV |$-\, r$| ≤ 4.5 (24 galaxies, green open stars), and their age and metallicity distributions are shown by the green filled histograms in Fig. 8. As expected, the age and metallicity distributions of the RSF subsample galaxies shifted towards smaller values, indicating younger and more metal-poor galaxies.
Since early-type galaxies show a strong mass-metallicity relationship and our RSF galaxies tended to have slightly smaller stellar masses than QST galaxies, we further investigated the age and metallicity differences between our sample galaxies by considering different mass ranges as follows: log M*/M⊙ ≤ 11.21 (35 RSF galaxies, 11 RSF subsample galaxies, and 251 QST galaxies), 11.21 < log M*/M⊙ ≤ 11.73 (35 RSF galaxies, 13 RSF subsample galaxies, and 458 QST galaxies), and log M*/M⊙ > 11.73 (no RSF galaxy and 32 QST galaxies). The results are presented in Fig. 9, and they confirm the significant difference in the age and metallicity distributions between our RSF (RSF subsample) and QST galaxies. They also show that our RSF (RSF subsample) galaxies tended to be younger and more metal-poor than QST galaxies.
![Left-hand panel: distribution of the derived stellar age for RSF (blue shaded), RSF subsample (green filled), and QST (black solid) early-type galaxies in different mass bins. The red circles (mean) and error bars (standard deviation) represent the results of bootstrap resampling. The probability of similarity in the distributions as determined using the KS test (PKS) and number of sample galaxies are presented in the left-hand corner of each panel. Right-hand panel: same as the left-hand side figures but for metallicity ([Z/H]).](https://oup.silverchair-cdn.com/oup/backfile/Content_public/Journal/mnras/509/1/10.1093_mnras_stab2990/1/m_stab2990fig9.jpeg?Expires=1750228399&Signature=OSEvtVaaUXgrq5s~t6YkxMdbBb9S7onfSfLcvWdlE~FMK0CAs7hFIHGIZ3Y0q1LRTskfKZGr2nppajMiUOmrXtcpF10GFADdY6PhgVAqmZq7Spx5tcZXcq~hBWslPSPGKBxcuM3zqe6mtIQRhnkEWXkkJmTI26LiYr7svjObOJjiFTezH5GPDhCzGF54Ch0TSRtzsrzXcYizPwDNv48ldvDuo3h2BX7se0Kg8mnWlAcP5NMqrnIiuxXyjtWUMw3GEjq~PeV3CfgxvUzW0gAnYvm-ZujdeTIWoUsuGpIAZ6OsedKm9~TU428JKHGu2ANZBHAVJ9DveZUMw8qxHuBh-A__&Key-Pair-Id=APKAIE5G5CRDK6RD3PGA)
Left-hand panel: distribution of the derived stellar age for RSF (blue shaded), RSF subsample (green filled), and QST (black solid) early-type galaxies in different mass bins. The red circles (mean) and error bars (standard deviation) represent the results of bootstrap resampling. The probability of similarity in the distributions as determined using the KS test (PKS) and number of sample galaxies are presented in the left-hand corner of each panel. Right-hand panel: same as the left-hand side figures but for metallicity ([Z/H]).
To test the statistical significance of our finding, we performed the KS test between our RSF and QST galaxies and between the RSF subsample galaxies and QST galaxies, and the probability is specified in each panel of Fig. 9. The shift towards smaller values in all distributions is very obvious, except for the age distribution in the intermediate mass bin (bottom left-hand panel) for which only a marginal difference is observed (PKS = 0.125 between the RSF and QST galaxies and 0.139 between the RSF subsample galaxies and QST galaxies). When we performed the KS test again by excluding some RSF galaxies in the leftmost bin of the [Z/H] histograms [two RSF galaxies in the first mass bin (top right-hand panel) and one RSF galaxy in the intermediate mass bin (bottom right-hand panel)], the probability between the RSF and QST galaxies was 0.043 in the first mass bin and less than 0.001 in the intermediate mass bin. This implies that the metallicity distributions of the RSF and QST galaxies are significantly different.
Additionally, to quantify the statistical significance, we performed bootstrap resampling for the age and [Z/H] values of the QST galaxies with an identical number of RSF galaxies (35 for the first mass bin and 35 for the intermediate mass bin). After 1000 iterations, the mean and standard deviation (red circles and error bars in Fig. 9) were calculated for each histogram bin. We verified that the age and metallicity distributions of our RSF and RSF subsample galaxies could not be reproduced by random sampling from the age and [Z/H] values of the QST galaxies.
4 DISCUSSION AND CONCLUSIONS
RSF in early-type galaxies is no longer surprising, but its details remain unclear. What drives star formation in early-type galaxies? Where does the gas come from? Is it merger-driven or could it simply have originated from stellar mass-loss and gas cooling in a quiescent mode? Can we distinguish between these two cases? To answer these questions, we investigated the stellar population parameters of the RSF and QST early-type galaxies and found that our RSF galaxies were more metal-poor than QST galaxies.
Given that galaxy mergers or interactions are a potential triggering mechanisms for RSF, images of early-type galaxies with RSF can be expected to exhibit merger signatures such as tidal tails, shells, and double nuclei. We investigated the DESI Legacy Imaging Surveys data (Dey et al. 2019) that are two magnitudes deeper than SDSS data and found that (at least) five galaxies showed merger signatures, which are shown in Fig. 10. In particular, one galaxy clearly showed a shell structure, which appeared to originate from interaction with a companion galaxy (see the rightmost panels of Fig. 10. The simulation of Ji, Peirani & Yi (2014) showed that most of the known merger features are characteristic of major mergers and that it is difficult to detect minor merger features even with deep imaging. This might be the reason for merger signatures not being detected in most of the images of our RSF galaxies.
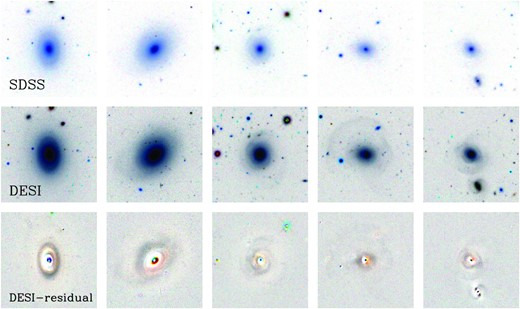
Top panel: SDSS colour-composite images of our RSF early-type galaxies with a shell structure. Middle panel: same as top figures but from DESI Legacy Imaging Surveys. Bottom panel: residual images from DESI Legacy Imaging Surveys. Each image shows an area of 120 × 120 arcsec2.
To identify suitable stellar population parameters that could be reproduce the difference in metal abundance between our RSF and QST galaxies, we estimated variations in metal abundance by quantifying the amount of young stars in RSF galaxies and by assuming that star formation in galaxies with RSF is caused by accumulation of gases from low-mass satellites. The effect of star formation on the Mg b and |$\langle \rm Fe \rangle$| line strengths is shown in Fig. 11. The observed Mg b and |$\langle \rm Fe \rangle$| mean strengths of our RSF, RSF subsample galaxies and QST galaxies are shown by the blue filled circle, green open star, and black open circle, respectively, for specific stellar population models (red circle, blue triangle, green inverted triangle, and red arrow). On the basis of the models proposed by Thomas et al. (2003), a galaxy with an age of 15 Gyr and with solar metallicity ([Z/H] = 0.0]) shows Mg b and |$\langle \rm Fe \rangle$| strengths of 4.49 and 2.50 Å, respectively, consistent with the mean values of our QST galaxies (Mg b = 4.33 and |$\langle \rm Fe \rangle$| = 2.42 Å). The blue triangle (Mg b = 3.75 and |$\langle \rm Fe \rangle$| = 2.29 Å) and red arrow (Mg b = 3.29 and |$\langle \rm Fe \rangle$| = 2.15 Å) correspond to the presence of 3 and 6 per cent of a young stellar population (∼ 1 Gyr and subsolar metallicity ([Z/H] = −0.33)), respectively. These model values coincide with the mean observed Mg b and |$\langle \rm Fe \rangle$| values of the RSF and RSF subsample galaxies: 3.69 and 2.37 Å (RSF) and 3.30 and 2.29 Å (RSF subsample), respectively. Furthermore, the observed UV colour difference between the RSF and QST galaxies, Δ(NUV |$-\, r)_{\rm obs}$| = 1.28 ± 0.38 (1.58 ± 0.36 when the RSF subsample galaxies are considered instead of the RSF galaxies), can be naturally explained with the models of Yi (2003) by assuming the combination of an old [97 per cent (94 per cent for the RSF subsample galaxies) of a stellar population of 12 Gyr with solar metallicity] and a young [3 per cent (6 per cent for the RSF subsample galaxies) of a stellar population of 1 Gyr with subsolar metallicity] stellar population, which yielded Δ(NUV |$-\, r)_{\rm model}$| = 1.00 (1.35 for the RSF subsample galaxies). It is noteworthy that the mass fraction of the young stellar component is only about 3 per cent. This indicates that the luminosity-weighted metallicities of our RSF galaxies were lower than those of QST galaxies but the mass-weighted metallicities of our RSF and QST galaxies were fairly comparable. Therefore, it is likely that even the early-type galaxies that are quiescent today have experienced RSF as a result of (minor) mergers or interactions in the past.
![Response of Mg b and $\langle \rm Fe \rangle$ indices to variations in the mass fraction of young stars. The observed Mg b and $\langle \rm Fe \rangle$ mean strengths of the RSF, RSF subsample, and QST galaxies are represented by the blue filled circle, green open star, and black open circle, respectively. The remaining symbols indicate the contribution of a young population (∼ 1 Gyr and [Z/H] = −0.33) with mass fractions of 0 (red filled circle), 3 (blue filled triangle), and 6 per cent (red arrow).](https://oup.silverchair-cdn.com/oup/backfile/Content_public/Journal/mnras/509/1/10.1093_mnras_stab2990/1/m_stab2990fig11.jpeg?Expires=1750228399&Signature=m-WwtJcXhk7E9n45JCoyNV6JgnIHaGwYdTirxPUK6lMNzRaZFJ46nodTx2vvYfRQjE1qms-PdJBR8PTEd2yf4b5zX7sHsExWJd458QjjFzcei0ZlaCW-IzinRAV0zyLFDvOvbfbrAYgUj6Fdb7SyR5AuPz~~~4F2S2LZ9jlxMq52YjrN5jv~VuSutqSRebLOp2nAFDY7YbW7LRAppPUKnxiWC2-GKlPkoLE48Fk7WmZ~QfA2xCozSXiOrHZwJ0meftDfeO7-becDFJP-ukaY8f3C9fjP-XWlFzDCG0fCXnSmhISrg6nZbvTi1EQDQdRzxurZfVqtEO7rXGa6mXAg0g__&Key-Pair-Id=APKAIE5G5CRDK6RD3PGA)
Response of Mg b and |$\langle \rm Fe \rangle$| indices to variations in the mass fraction of young stars. The observed Mg b and |$\langle \rm Fe \rangle$| mean strengths of the RSF, RSF subsample, and QST galaxies are represented by the blue filled circle, green open star, and black open circle, respectively. The remaining symbols indicate the contribution of a young population (∼ 1 Gyr and [Z/H] = −0.33) with mass fractions of 0 (red filled circle), 3 (blue filled triangle), and 6 per cent (red arrow).
Previous IFS surveys, such as SAURON, ATLAS|$^{\tt 3D}$|, CALIFA, SAMI, and MaNGA, have investigated stellar and ionised gas kinematics and found that a significant number of early-type galaxies possess kinematically misaligned gas with respect to their stellar kinematic axis (i.e. kinematic misalignment, Emsellem et al. 2004; Sarzi et al. 2006; Davis et al. 2011; Barrera-Ballesteros et al. 2015; Jin et al. 2016; Bryant et al. 2019). According to ATLAS|$^{\tt 3D}$|, for example, approximately 36 per cent of fast-rotating early-type galaxies exhibit kinematic misalignments (Davis et al. 2011). In general, the phenomenon of kinematic misalignment does not occur in all galaxies where stars are formed through external processes, but it is a clear indication of external gas accretion through mergers or interactions. Therefore, if star formation in early-type galaxies is driven by external processes, the possibility of finding kinematically misaligned galaxies in our RSF sample is high. In a forthcoming companion paper, we shall present an investigating of the kinematic misalignment of our sample galaxies on the basis of MaNGA data.
This study investigated the metal abundance of early-type galaxies to understand the main mechanism of RSF in early-type galaxies. The observed H β, Mg b, Fe 5270, and Fe 5335 line strengths indicated that early-type galaxies with RSF are younger and more metal-poor than QST galaxies. This implies that RSF in early-type galaxies has been driven by metal-poor gas accreted during mergers or interactions. Our findings provide evidence that mergers or interactions are vital for the evolution of early-type galaxies in nearby universe. In future, we intended to investigate the kinematics of our sample galaxies on the basis of MaNGA IFS data to determine the relationship between kinematic structures and star formation. The relationship can provide valuable information on the formation and evolution of early-type galaxies.To facilitate follow-up studies, we provide a catalogue of the RSF galaxies considered in this study in Table 2.
Properties of our RSF early-type galaxies.
| SDSS object ID | RA | Dec. | Redshift | Mr | u − r | FUV − r | NUV − r | H β | [MgFe]′ | Age | [Z/H] |
|---|---|---|---|---|---|---|---|---|---|---|---|
| (°) | (°) | (mag) | (mag) | (mag) | (mag) | (Å) | (Gyr) | ||||
| 587735044686348347 | 129.006 302 | 30.266 399 | 0.0256 | −21.13 | 2.27 | 7.74 | 4.95 | 2.61 | 2.43 | 2.4 | −0.07 |
| 587726878881611947 | 331.591 095 | −8.090 000 | 0.0275 | −21.67 | 2.49 | 7.50 | 4.99 | 2.32 | 2.90 | 2.6 | 0.14 |
| 587729159515865215 | 223.574 295 | 4.283 900 | 0.0288 | −22.25 | 2.65 | 5.49 | 4.58 | 2.03 | 3.28 | 4.8 | 0.21 |
Notes. This table is available in its entirety in the online journal. Only a portion of the table is shown here for guidance regarding its form and content.
SUPPORTING INFORMATION
Table 2. Properties of our RSF early-type galaxies.
Please note: Oxford University Press is not responsible for the content or functionality of any supporting materials supplied by the authors. Any queries (other than missing material) should be directed to the corresponding author for the article.
ACKNOWLEDGEMENTS
We thank the anonymous referee for constructive comments that improved the clarity of this paper. HJ acknowledges support from the National Research Foundation of Korea (NRF) grant funded by the Korea government (MSIT) (No. NRF-2019R1F1A1041086). KO acknowledges support from the NRF (NRF-2020R1C1C1005462). SJJ acknowledges support from the Basic Science Research Program through the NRF funded by the Ministry of Education (NRF-2020R1I1A1A01055595). SKY acknowledges support from the NRF (NRF-2020R1A2C3003769).
DATA AVAILABILITY
The data underlying this paper are available in this paper and in its online supplementary material or will be shared on request to the corresponding author.
Footnotes
The details of the k-correction are described in section 3 of Yi et al. (2011).
[MgFe]′ = |$\sqrt{\rm Mg\, {\it b}\, (0.72\, \times \, \rm Fe\, 5270\, +\, 0.28\, \times \, \rm Fe\, 5335)}$| (Thomas et al. 2003)
|$\langle \rm Fe \rangle$| = (Fe 5270 + Fe 5335)/2 (Gorgas, Efstathiou & Aragon Salamanca 1990)
