


ABSTRACT
We report deep imaging observations with DOLoRes@TNG of an ultra-faint dwarf satellite candidate of the Triangulum galaxy (M33) found by visual inspection of the public imaging data release of the DESI Legacy Imaging Surveys. Pisces VII/Triangulum (Tri) III is found at a projected distance of |$72\, {\rm kpc}$| from M33, and using the tip of the red giant branch method, we estimate a distance of |$D=1.0^{+0.3}_{-0.2}\, {\rm Mpc}$|, meaning the galaxy could either be an isolated ultra-faint or the second known satellite of M33. We estimate an absolute magnitude of MV = −6.1 ± 0.2 if Pisces VII/Tri II is at the distance of M33, or as bright as MV = −6.8 ± 0.2 if the galaxy is isolated. At the isolated distance, it has a physical half-light radius of |$r_{\rm h}=131\pm 61\, {\rm pc}$| consistent with similarly faint galaxies around the Milky Way. As the tip of the red giant branch is sparsely populated, constraining a precision distance is not possible, but if Pisces VII/Tri III can be confirmed as a true satellite of M33, it is a significant finding. With only one potential satellite detected around M33 previously (Andromeda XXII/Tri I), it lacks a significant satellite population in stark contrast to the similarly massive Large Magellanic Cloud. The detection of more satellites in the outskirts of M33 could help to better illuminate if this discrepancy between expectation and observations is due to a poor understanding of the galaxy formation process, or if it is due to the low luminosity and surface brightness of the M33 satellite population which has thus far fallen below the detection limits of previous surveys. If it is truly isolated, it would be the faintest known field dwarf detected to date.
1 INTRODUCTION
With a stellar mass of M* = 3 × 10⁹ M⊙ (McConnachie 2012), and a halo mass of ∼1011 M⊙ (Corbelli et al. 2014), the Triangulum spiral galaxy (M33) is the most massive satellite of the Andromeda galaxy (M31) and one of the most massive galaxies of the Local Group. With this mass, the ΛCDM cosmological paradigm predicts that M33 should host a number of its own satellites. Cosmological simulations find it should have between 9–25 companions with stellar mass >103 M⊙ (e.g. Dooley et al. 2017; Bose, Deason & Frenk 2018; Patel et al. 2018), and at least 1 with M* > 106 M⊙ (Deason et al. 2013). However, to date, only one potential satellite has been uncovered: Andromeda (And) XXII/Triangulum (Tri) I, which has a stellar mass of 2 × 10⁴ M⊙ (Martin et al. 2009, 2016b). This was found in the framework of the Pan-Andromeda Archaeological Survey (PAndAS; McConnachie et al. 2009), an observing programme which has conducted a deep survey of the M33 halo out to ∼1/3 of its virial radius.
To date, no brighter satellites have been found outside this radius in shallower surveys such as the SDSS. There is also a notable dearth of globular clusters around M33 compared to other spiral galaxies (Cockcroft et al. 2011). This negligible satellite population is in stark contrast to that of the similarly massive Large Magellanic Cloud (LMC), which has upwards of seven known satellite galaxies (e.g. Jethwa, Erkal & Belokurov 2016; Fritz et al. 2019; Erkal & Belokurov 2020). Part of this is due to the difference in limiting magnitude that can be probed in M33 versus the far nearer LMC. But even so, the lack of bright companions (M* > 104 M⊙) is surprising.
Previously, this lack of satellite galaxies and far flung globular clusters of M33 was attributed to its dynamical evolution. Warps to its outer stellar and H i discs were thought to originate from a prior interaction with M31 occurring ∼2 Gyr ago, which would have stripped much of M33’s stellar halo and satellites (McConnachie et al. 2009; Cockcroft et al. 2011). Nevertheless, newer studies which include up-to-date proper motions for M31 and M33 suggest that the latter is more likely on its first infall to the M31 system (e.g. Patel, Besla & Sohn 2017; van der Marel et al. 2019). If this scenario is correct, M33’s satellite system should extend beyond a single, low-mass satellite.
This dramatic gap between theoretical expectations and observations could imply that our understanding of the formation of low mass galaxies is flawed. Perhaps the feedback recipes used in hydro-dynamical surveys are incorrect, or we are wrong about the nature of dark matter itself. Or, it could be that the majority of M33 satellites have luminosities and surface brightnesses that lie just below the detection limits of previous surveys. In any event, given the paucity of known M33 satellites, even a single new detection or exclusion of a companion has the potential to completely change our understanding of the M33 system, and galaxy formation more widely.
In the last decades, the discoveries of Andromeda satellites have been made by means of visual inspection or automatic algorithm searches in stellar density maps of resolved red giant branch (RGB) stars, counted in selected areas of the colour–magnitude diagrams (CMDs) from large-scale photometric survey data, such as the Sloan Digital Sky Survey (SDSS; Abazajian et al. 2009) and the Panoramic Survey Telescope and Rapid Response System (Pan-STARRs; Martin et al. 2013a,b; Chambers et al. 2016). However, the main contribution to the dwarf census of M31 satellites came from PAndAS with the wide-field imager on the Canada French Hawaii Telescope (CFHT; Martin et al. 2009; McConnachie et al. 2009; Richardson et al. 2011)
Although the M31 stellar halo photometry from the PAndAS is significantly deeper than those from the SDSS or Pan-STARRs, this ground-based data can only reach the red clump locus in the CMDs at the distance of Andromeda. Thus, low-mass systems with absolute magnitude fainter than MV ∼ −6 are very hard to detect because of the lack of enough RGB star tracers in their CMDs, yielding a cut-off in the luminosity function of satellites of M31 (see Brasseur et al. 2011; their fig. 1). An alternative approach is to search for partially resolved stellar overdensities in the public deep images recently available from the DESI Legacy Imaging Surveys (DESI LIS; Dey et al. 2019). These data were obtained with the Dark Energy Camera (DECam) mounted on the Blanco 4-m telescope, located at the Cerro Torrolo Inter-American Observatory (Flaugher et al. 2015), which reach surface brightness as faint as ∼29 mag arcsec–2. This low surface regime allows us to detect the underlying, unresolved population of these systems as a diffuse light round overdensity overlapping a small (∼1–2 arcmin) clump of faint stars.
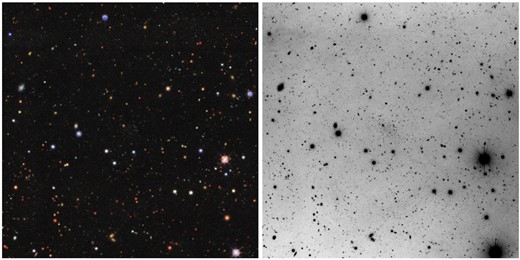
Left-hand panel: image of the dwarf galaxy Pisces VI/Tri III from the DESI LIS. Right-hand panel: TNG r-band image of the galaxy obtained from TNG follow-up observations (see Section 2). The total field of view of both images is 8.6 8.6 arcmin2. North is up, East is left.
Using this approach, we have very recently identified a partial resolved dwarf galaxy candidate outside the PAndAS survey footprint. Placed at the distance of M33, it would be located at a projected distance of ≳70 kpc from the Triangulum galaxy. Unfortunately, the DESI LIS photometry is too shallow to allow the measurement of an accurate distance, making it impossible to reject it as a background isolated dwarf situated a few Mpcs behind Andromeda (as e.g. the Do I dwarf; Martínez-Delgado et al. 2018). In this paper, we present follow-up photometric observations, a distance estimate, and structural analysis of this stellar system that suggests its likely association to M33.
2 OBSERVATIONS AND DATA REDUCTION
Pisces VII/Tri III1 was discovered in the Pisces constellation by the amateur astronomer Giuseppe Donatiello as a partially resolved overdensity in the Pisces constellation. It was found by visual inspection of the available DESI LIS images of an extensive area of 20° × 30° in the surroundings of the Triangulum galaxy (M33), outside the PAndAs footprint (see Fig. 1 left-hand panel).2 The detection was subsequently confirmed by a visual inspection of the SDSS DR9 images and follow-up observations using the Italian Telescopio Nazionale Galileo (TNG) described in Section 2.1. The position of the centre of this new dwarf galaxy is given in Table 1.
The priors used in the emcee routine.
| MCMC Parameter | Value |
|---|---|
| x0 (radians) | 0.3 ≤x0 ≤ 0.4 |
| y0 (radians) | 0.45 ≤ y0 ≤ 0.5 |
| rh (arcmin) | 0 ≤ rh < 1 |
| ϵ | 0 ≤ ϵ ≤ 1 |
| θ (radians) | 0 ≤ θ ≤ π |
| N* | 0 < N|$^{*}\, \leqslant$| n |
| MCMC Parameter | Value |
|---|---|
| x0 (radians) | 0.3 ≤x0 ≤ 0.4 |
| y0 (radians) | 0.45 ≤ y0 ≤ 0.5 |
| rh (arcmin) | 0 ≤ rh < 1 |
| ϵ | 0 ≤ ϵ ≤ 1 |
| θ (radians) | 0 ≤ θ ≤ π |
| N* | 0 < N|$^{*}\, \leqslant$| n |
2.1 TNG imaging observations
We used deep images of a 8.6 x 8.6 arcmin2 field around the candidate galaxy obtained with the focal reducer instrument DOLoRes (see http://www.tng.iac.es/instruments/lrs/) of the 3.58-m TNG taken on 2020 November 17 (programme A42DDT2; P.I.: W. Boschin).
These observations include 41x180 s unbinned (scale 0.252 arcsec pixel–1) exposures in the g’-band and 20 x 180 s unbinned exposures in the r’-band, with a median seeing of 1.15 and 0.85 arcsec, respectively.
The raw data were pre-processed in a routine way using standard IRAF tasks, i.e. dividing the trimmed and bias-subtracted images by a master flat-field produced from multiple twilight sky-flat exposures.
Images were reduced using the daophot/allframe suite of programmes (Stetson 1987, 1994), largely following the method outlined by Monelli et al. (2010). For each individual image, we performed the initial steps: (i) search for stellar sources, (ii) aperture photometry, (iii) PSF derivation, and (iv) PSF photometry with ALLSTAR. Then images were registered with DAOMASTER and stacked on a median image. This was used to extract a deeper list of stars, which was fed to allframe. This provides individual catalogues with better determined position and instrumental magnitude of the input sources. The updated photometry allowed us to refine the PSF (using improved list of stars) and the geometric transformations (leading to a better coadded image and cleaner input list). A final run of allframe provided the final photometry. The list of sources was cleaned using the sharpness parameter, and further polished by removing object after a visual inspection on the stacked image.
The photometric calibration was performed using local standard from the PanSTARRs 1 survey (Chambers et al. 2016), using 121 stars in common. The mean magnitudes were calibrated with a linear relation for the g band, and a zero-point for the r band. The calibrated local standard agree well below 0.01 mag with the tabulated ones, with standard deviation of the order of 0.03 mag. All data are then extinction corrected using the reddening maps from Schlafly & Finkbeiner (2011).
3 METHODS
3.1 Identifying probable members
![Left-hand panel: CMD within 1 arcmin of the centre of Pisces VII/Tri III. The grey data points indicate the complete data set observed. The blue data points are the sources deemed likely members of the candidate dwarf galaxy. The solid black line is an isochrone from the Dartmouth isochrone data base with [Fe/H] = −2.0 dex, [α/Fe] = 0.4 dex, and age = 12 Gyr. The grey dashed lines indicate the CMD selection box used. Right-hand panel: Spatial density plot of the observed data, with blue points showing the likely members of the dwarf galaxy which pass the criteria described in Section 3.1. The dashed circles shaded grey show 1 × and 2 × rh.](https://oup.silverchair-cdn.com/oup/backfile/Content_public/Journal/mnras/509/1/10.1093_mnras_stab2797/1/m_stab2797fig2.jpeg?Expires=1749824372&Signature=acZq4Sf0ydWkm6pb0R9xpUORiK27PZzWf9gI4AG~z6ki8mcA2Y7uoPQVD5EBnAHgBTMcpxA2t1XnTSemxCHqhgttxdZSq-9NfWi2StjLImlmpQt4Xo10XxeULAXrSet-esIPb1qgeURLc6kOq3fQJ2d-mVn8NjjWp0o2GspXGszINcW-7glHF7wQW0CoaCbDTUsa2hOf~n9gU06a8NkJdE7cVpiMA1oMEVEtkG4cfoUeLTqLQOzJ0iKLFud4MEVIHO1C0BcUbOS~q-XqqWSFEUxi15Vv243asp592WgrtOPy7xjQT4WSrtwN3CdRk6fwK8uyg~U2~R3th16~MTBqzg__&Key-Pair-Id=APKAIE5G5CRDK6RD3PGA)
Left-hand panel: CMD within 1 arcmin of the centre of Pisces VII/Tri III. The grey data points indicate the complete data set observed. The blue data points are the sources deemed likely members of the candidate dwarf galaxy. The solid black line is an isochrone from the Dartmouth isochrone data base with [Fe/H] = −2.0 dex, [α/Fe] = 0.4 dex, and age = 12 Gyr. The grey dashed lines indicate the CMD selection box used. Right-hand panel: Spatial density plot of the observed data, with blue points showing the likely members of the dwarf galaxy which pass the criteria described in Section 3.1. The dashed circles shaded grey show 1 × and 2 × rh.
3.2 Structural Properties
The structural properties were determined using the iterative Bayesian approach of Markov chain Monte Carlo (MCMC) analysis and we use the emcee code developed by Foreman-Mackey et al. (2013) to implement this. Our methodology followed the procedure outlined in Martin et al. (2016b), summarized below.
Uniform flat priors were used to constrain the parameter space to physical solutions but were kept broad to ensure the analysis was not overconstrained, see Table 1. The emcee routine used 100 walkers, over a total of 10 000 iterations with a burn in stage of 8 500. Fig. 3 is the resulting corner plot from the MCMC analysis and the derived structural parameters are summarized in Table 2.
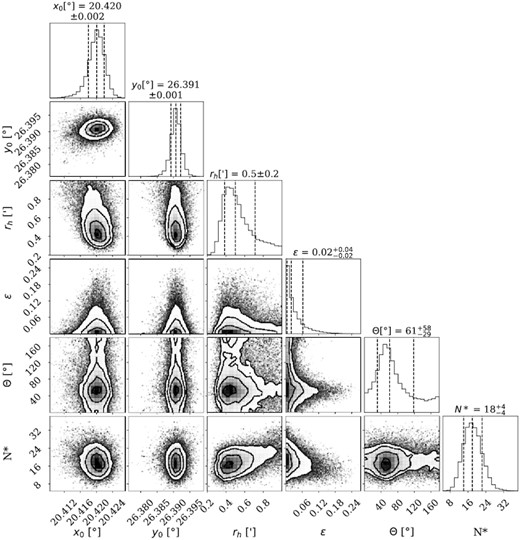
2D and marginalized PDFs for the central coordinates of the system, x0 and y0, the half-light radius, rh, the ellipticity, ϵ, the position angle of the major axis, θ, and the number of stars belonging to the system from the CMD selection criteria, N*. The dashed lines represent the mean value and 1σ uncertainties.
The final structural and photometric properties for the dwarf.
| Property | Value |
|---|---|
| RA | |$1^{\rm h}\, 21^{\rm m}\, 40{_{.}^{\rm s}}5\, \pm \, {0{_{.}^{\rm s}}8}$| |
| Dec. | 26|$^\circ \, 23^{^{\prime }}\, 24^{^{\prime \prime }}\, \pm \, {4^{^{\prime \prime }}}$| |
| rh (arcmin) | 0.5 ± 0.2 |
| D (kpc) | |$1000^{+300}_{-200}$| |
| rh (pc) | 131 ± 61 |
| MV | −6.8 ± 0.2 |
| μ0 (mag arcsec−2) | 27.7 ± 0.3 |
| L (L⊙) | |$3.7^{+0.8}_{-0.6}\times 10^4$| |
| ϵ | 0.02 |$^{{+{0.04}}}_{{-{0.02}}}$| |
| θ(°) | 61 |$^{{+{58}}}_{{-{29}}}$| |
| N* | 18 |$^{{+{4}}}_{{-{4}}}$| |
Next, we plot a stellar radial density profile using the parameters that were deduced from the MCMC analysis, which we show in Fig. 4. The error bars on the data points represent the Poisson uncertainties for each point. We overplot the exponential profile deduced using MCMC, which agrees very well with the observed profile. In addition, we perform a basic chi-squared fit of the exponential profile shown in equation (2) to this binned data. We recover a very similar value for rh = 0.48 arcmin, completely consistent with the MCMC approach.
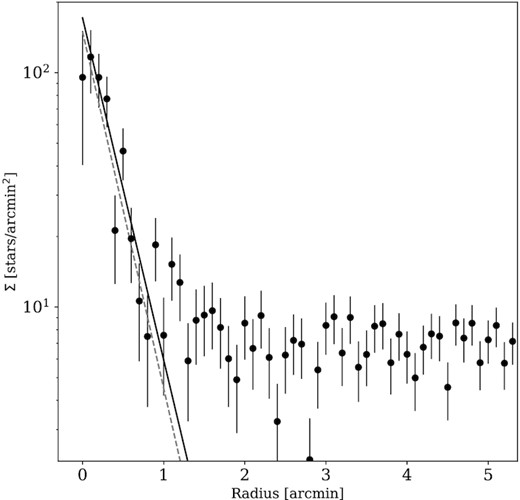
Stellar radial density profile with the observed data binned in elliptical annuli with the favoured structural properties of ellipticity, the position angle, the structural centre, and the number of stars. The solid black fit uses the MCMC values and the dashed grey line is the chi-squared fit, which yields a value for rh = 0.48 arcmin.
3.3 The distance to the dwarf
To determine the distance to Pisces VII/Tri III, we use the Tip of the Red Giant Branch (TRGB) method. We construct a luminosity function for our dwarf galaxy (see Fig. 5), using all sources within 2 × rh of the galaxy’s centroid and colours of 0.3 < g − r < 1.1. This produces a reasonably tight selection of RGB stars, and minimizes foreground contamination. From this, we subtract an area-normalized background luminosity function constructed from sources with the same colour cut, between 2.5–3.5 arcmin from our source. The grey shaded area in Fig. 5 shows the region below which our photometry is |$\lt 90{{\ \rm per\ cent}}$| complete.
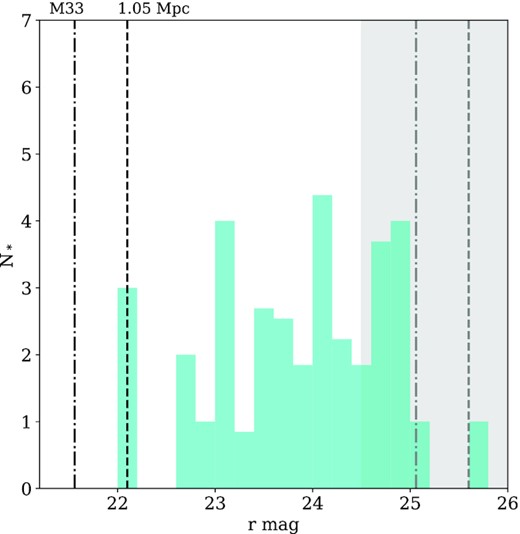
A background corrected luminosity function for all stars within 2 × rh of the galaxy centre. The grey shaded region shows the point at which our completeness drops below 90 per cent. Using a Sobel edge detection filter, we find a peak in the luminosity function at r = 22.1, which is indicated as the dashed black line. The location of the TRGB of M33 is shown as a dot–dashed line. The grey lines show the predicted locations for the HB in the LF for these three distances.
The TRGB in the r-band should have an absolute magnitude of Mr, TRGB = −3.01 ± 0.1 (Sand et al. 2014). To begin with, we apply a Sobel edge detection filter to the luminosity function (Lee, Freedman & Madore 1993). This has been a historically popular way of finding the sharp edge of the TRGB, but it does not consider any uncertainties in the data. From this, we find a value of possible values for the TRGB at r = 22.1, which is marked as the black dashed line in Fig. 5. This corresponds to physical distance estimate of 1.05 Mpc. Owing to the paucity of stars within our data set, this method has merely located the three brightest stars in the data set. The dot–dashed line represents the TRGB location for an object at the distance of M33 (820 kpc; Conn et al. 2012). In Fig. 6, we show the CMD for all stars witin 2 × rh of the dwarf galaxy with isochrones of varying metallicity overlaid at each of these proposed distances (Dotter et al. 2008). For a distance of 820 kpc, the dwarf appears metal poor, with [Fe/H] ∼ −2.0.
![The first two panels show the CMD for all sources within 2 × rh of the centre of the dwarf. In each panel, Dotter et al. (2008) isochrones with an age of 12 Gyr, [α/Fe] = +0.4 and metallicities of [Fe/H] $= -2.0\, {\rm and}\, -2.5$ are overlaid for two different distances: the distance to M33 (820 kpc), and that from our TRGB analysis (1.0 Mpc). The final panel shows a control field located away from the centre of the dwarf of equal area. Using the TRGB estimate, the isochrones imply the system is very metal poor, whereas the M33 distance gives a good match to the colours of the RGB stars.](https://oup.silverchair-cdn.com/oup/backfile/Content_public/Journal/mnras/509/1/10.1093_mnras_stab2797/1/m_stab2797fig6.jpeg?Expires=1749824372&Signature=1-icMxCSItlLWU8VPQXLXwaf3ZY8eEgwt9h87klPf2sZQT96sZFaeen4ensznmDfEAPZ1p2aCPZn8zKuzXM3VrC4u24xeWNQ3t~18uWcXiQ8~zPWsuAghC2TFpmLu2Motoanf5aoaZ2hjUB4nEowEw6GkT65ZS~fadh~BnIcXBw80DzoAO5jgNUnDcH2KjF-R972wGsAuDXtjd-jSJAcPIG7tXvun1ppmxm-emp5BCIZwrD9Nh-FP-YiSm96K66oLoerG9J-06B7Akm4oBa1v5PmWDLvgBIWXDRUUwmF9gn1ZyRbT2uAPxdKZ0~KNJ66FgwbwuQ0idfUMmHSKi7PVw__&Key-Pair-Id=APKAIE5G5CRDK6RD3PGA)
The first two panels show the CMD for all sources within 2 × rh of the centre of the dwarf. In each panel, Dotter et al. (2008) isochrones with an age of 12 Gyr, [α/Fe] = +0.4 and metallicities of [Fe/H] |$= -2.0\, {\rm and}\, -2.5$| are overlaid for two different distances: the distance to M33 (820 kpc), and that from our TRGB analysis (1.0 Mpc). The final panel shows a control field located away from the centre of the dwarf of equal area. Using the TRGB estimate, the isochrones imply the system is very metal poor, whereas the M33 distance gives a good match to the colours of the RGB stars.
As a second step, we could also look for a peak in the luminosity function at the location of the horizontal branch (HB). The HB is a secure distance estimator and it is typically better populated than the RGB, allowing a better constraint. In Fig. 5, we also show the predicted location of the HB assuming the Sobel distance estimate, as well as the HB for an object at the distance of M33. However, as our photometry is incomplete at these magnitudes, we cannot locate this feature.
Our primary interest is the value of mtrgb, so we use Bayesian inference with this model to determine posterior probabilities for this using equation (7) as our likelihood function. We implement uniform priors on f of U(0, 1), and for α and β, we use the same priors as Conn et al. (2012) of U(0, 2). For mtrgb, we adopt a more informative prior based on the results of our Sobel filter method above, setting this to U(20, 23.1). For mi, we use our r-band magnitudes and use the same colour selection function as for the luminosity function above (0.5 < g − r < 1.1), and only include stars with r < 24 to ensure we are using a complete sample. We then numerically integrate equation (6) over a grid of m using the trapezoid rule for a given set of parameters, and take the total likelihood as the sum of the logarithm of this over all stars.
We again use emcee to sample the posterior distribution for the model parameters for this broken power-law distribution. The results of this are shown in the left-hand panel Fig. 7. The results are inconclusive, and highly dependent on both the priors and the colour and distance selection. Using purely the colour cut, and the whole field of view, we find a triple-peaked distribution, with higher posterior values for mtrgb ∼ 21.8, 22.1, and 22.7 (corresponding to distances of ∼0.9 − 1.4 Mpc). If we narrow the colour cut slightly to exclude the bluer stars which may or may not be members (0.5 < g − r < 1.1), we instead recover the Sobel value for the TRGB of of |$m_{\rm trgb}=22.0^{+0.6}_{-0.5}$| (right-hand panel Fig. 7), corresponding to a distance of |$D=1.0^{+0.3}_{-0.2}$| Mpc. If we only include stars within the central two half-light radii (to exclude background contaminants), we measure mtrgb = 21.9 ± 0.5 (|$D=960^{+200}_{-190}$| kpc).
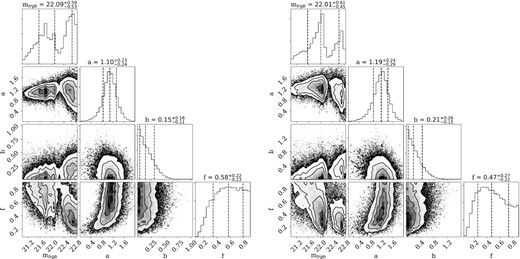
Left-hand panels: posterior distribution for the MCMC TRGB finding algorithm using our standard colour cut. The key parameter of interest is mtrgb. For this colour cut, the distribution shows three peaks, and is poorly constrained, resulting in a distant estimate between 0.9–1.4 Mpc. Right-hand panels: the same, but for a marginally tighter colour cut (0.5 < g − r < 1.1). Here, |$m_{\rm trgb}=22.0^{+0.6}_{-0.5}$|, favouring an isolated distance of |$D=1.0^{+0.3}_{-0.2}$| Mpc. The posterior results are very sensitive to assumptions of priors and colour cuts, owing to the paucity of stars (dwarf and background model) in the region.
This sensitivity to our selection criteria is driven by the scant number of stars both within the dwarf galaxy itself, and in the surrounding field. The model is highly sensitive to individual stars, and the uncertainties in all cases are likely underestimated. The stellar populations are scarce, making it difficult to distinguish between foreground and dwarf stars (as shown by the f parameter in both corner plots). Overall, this approach appears to favour an isolated distance for Pisces VII/Tri III. To confirm this, we require deeper data which would allow us to resolve the better populated HB or main sequence turn-off. For the rest of the paper, we assume a distance for the dwarf of |$D=1.0^{+0.3}_{-0.2}$| Mpc, and use these to calculate a physical size and luminosity range for this candidate.
3.4 Luminosity
The luminosity of Pisces VII /Tri III was calculated using a methodology similar to the approach outlined in Martin et al. (2016b). A probability density function (PDF) was made using a theoretical luminosity function, describing the number of expected star counts per narrow magnitude bin for a stellar population with an age of 12 Gyr, [α/Fe] = +0.4 dex and metallicity of [Fe/H] = −2.0 dex. This PDF was then used to weight random sampling in magnitude space. Stars which are selected from the isochrone which have a magnitude above the magnitude limit on the CMD used in our analysis (r < 24.0) are flagged. The magnitude is then converted into the corresponding luminosity. When converting into a luminosity, the uncertainty in the distance was considered by sampling the distance from a Gaussian distribution centred around the results from the distance modulus with a σ corresponding to the uncertainty of the distance modulus. The process of random sampling was repeated until a total of N* flagged stars was obtained, matching our data set. Once this limit was reached, the luminosity of all sampled stars was summed, including those not flagged, to give a final luminosity value. The whole process was repeated 1000 times and an average luminosity was obtained. Assuming the isolated distance, the resulting magnitudes were Mr = −6.5 ± 0.3 and Mg = −6.8 ± 0.2. The uncertainty comes from the standard deviation of the 1000 iterations, wherein uncertainty is introduced in the random sampling of the distance Gaussian indicative of the distance error. We then convert this into an absolute magnitude in the V-band using the colour transforms of Jordi, Grebel & Ammon (2006), giving MV = −6.8 ± 0.2. Assuming Pisces VII/Tri III is instead an M33 satellite, the resulting g- and r- band magnitudes are Mr = −6.1 ± 0.2 and Mg = −6.3 ± 0.3, giving MV = −6.1 ± 0.2.
From these values, we find the total luminosity of the dwarf galaxy to be |$L=2.1\pm 0.4\times 10^4$| and |$3.7^{+0.8}_{-0.6}\times 10^4\, {\rm L_\odot }$| for the M33 and isolated distances, respectively. We also calculate the distance independent central surface brightness of the dwarf galaxy μ0, and find a value of μ0 = 27.6 ± 0.2 mag arcsec–2.
4 DISCUSSION AND CONCLUSIONS
We report the discovery of Pisces VII/Tri III, a new dwarf galaxy in the surroundings of M33 by visual inspection of the public available image of the DESI LIS outside the PAndAs survey footprint. Using deeper follow-up imaging from DOLoRes@TNG, we attempt to constrain a distance for this dwarf. The paucity of stars makes this extremely challenging, but based on both a Sobel and MCMC approach, the likely distance |$D=1.0^{+0.3}_{-0.2}\, {\rm Mpc}$|, making it either a satellite of M33, or an isolated ultra-faint dwarf (UFD) in the field. It is faint and compact with MV = −6.1 ± 0.2 for the M33 distance or MV = −6.8 ± 0.2 for the isolated case. It would then have a half-light radius of |$r_{\rm h}=119\pm 48\, {\rm pc}$| for an M33 distance or |$r_{\rm h}=131\pm 61\, {\rm pc}$| for the isolated case, comparable to UFDs of the Milky Way (see Fig. 8). This luminosity would make it one of the faintest dwarf galaxies detected beyond the Milky Way, and potentially the faintest detected field galaxy to-date.
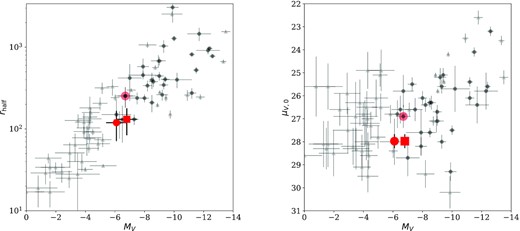
Left-hand panel: MV versus rh for dwarf spheroidal galaxies of the Milky Way (light grey triangles) and M31 (dark grey circles). Our new candidate is highlighted as a large red circle (for an M33 distance) and a red square (for the isolated distance), and fits comfortably within the size-luminosity relation for Local Group dwarfs. The point with the red shading is the only other likely satellite of M33, Andromeda XXII/Triangulum I. Right-hand panel: MV versus central surface brightness, μV, 0, for Local Group dwarfs.
Armed with the structural and photometric properties of our dwarf, we can place it in context with the other dwarf galaxies of the Local Group. In Fig. 8, we show the relationship between luminosity and half-light radius (left-hand panel) and surface brightness (right-hand panels). The light grey triangles show Milky Way satellites, while dark grey circles show M31 satellites. These values are compiled from a number of sources (McConnachie 2012; Bechtol et al. 2015; Drlica-Wagner et al. 2015; Koposov et al. 2015; Martin et al. 2016b; Weisz et al. 2019). Our candidate is highlighted as a large red circle and square for the M33 and isolated distances, respectively. It is only the second potential satellite galaxy of M33 discovered. The other, Andromeda XXII, is highlighted with red shading.4
Our derived properties for the new dwarf are perfectly consistent with other UFD galaxies. If this galaxy was confirmed as a satellite of M33, it would alleviate the current tension between the observed and predicted number of satellites around M33 (Patel et al. 2018). Given its low luminosity, it also suggests it may be the tip of the iceberg in terms of finding more UFDs in the M31–M33 system.
The new census of dwarf galaxies and the homogeneous distance measurements for all the known M31 satellites from the PAndAS survey suggest the possible existence of a coherent flattened galaxy plane of 15 satellite galaxies in that survey volume (Ibata et al. 2013). This Great Plane of Andromeda (GPoA, see Fig 9) is almost edge-on orientated and extends more than 400 kpc from the centre of M31. Interestingly, this plane seems to be aligned with the Giant Stellar Stream in the M31 halo and, in contrast with a similar satellite plane found in the Milky Way (Pawlowski, Pflamm-Altenburg & Kroupa 2012), it is not perpendicular to its galactic disc but inclined ∼ 50°. The existence of these kinematically correlated satellite planes in the Local Group spirals are very rare in cosmological simulations based on the ΛCDM paradigm (e.g. Pawlowski 2018). Some solutions proposed for this possible small-scale problem for the ΛCDM theory are the accretion of dwarf galaxies along filaments of the cosmic web (e.g. Buck, Macciò & Dutton 2015), infall of satellites in groups (e.g. Samuel et al. 2021), or a possible tidal dwarf galaxy origin for some of the satellites of Andromeda (Hammer et al. 2018).
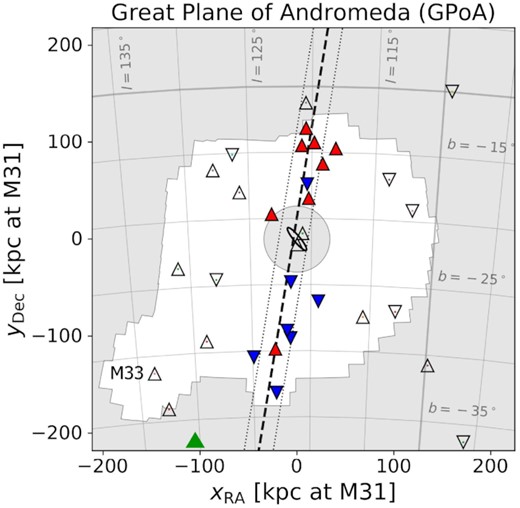
Position of Pisces VI/Tri III (green triangle) with respect to M31 (black ellipse) and M33 and the GPoS. The dashed and dotted lines indicate the orientation and width of the best-fitting GPoS, respectively. The white footprint corresponds to the region explored by the PAndAS survey. Satellites with measured radial velocities are showed as colour-coded triangles, according to whether they are approaching (blue) or receding (red) relatively to M31. Adapted from Fig. 1 in Pawlowski (2018).
The available DESI LIS imaging data outside the PAndAs footprint also allows us to explore the existence of additional members of this possible GPoA at larger projected distances from M31. Fig. 9 shows the position of the Pisces VII/Tri III with respect to M33 and the GPoA (Pawlowski 2018). It clearly lies off the plane, and in projection seems likely associated to the outer M33 halo.
The discovery of Pisces VII/Tri III by visual inspection of a limited area around M33 using the DESI LIS deep imaging suggests that there is still room for discovery of low surface brightness dwarf galaxies lurking in the outskirts of Andromeda, beyond the bounds of the PAndAS survey. To confirm whether it is a bona-fide satellite of M33, a precision distance should be measured using deep imaging. Follow-up studies using the Hubble Space Telescope would allow the HB and main sequence of the dwarf to be resolved, allowing us to distinguish between the distances measured from the scarce RGB stars. In addition, spectroscopy of its brightest member stars would allow us to determine whether it is dynamically bound to M33. Given the faint nature of the stars, an 8–10 m class telescope, such as Keck, would be required.
ACKNOWLEDGEMENTS
We thank the TNG director, Dr Ennio Poretti, for the telescope time he kindly granted us to perform the photometric follow-up of this dwarf galaxy. DMD acknowledges financial support from the Talentia Senior Programme (through the incentive ASE-136) from Secretaría General de Universidades, Investigación y Tecnología, de la Junta de Andalucía. DMD and EJA acknowledge funding from the State Agency for Research of the Spanish MCIU through the ‘Center of Excellence Severo Ochoa’ award to the Instituto de Astrofísica de Andalucía (SEV-2017-0709). This publication is based on observations made on the island of La Palma with the Italian Telescopio Nazionale Galileo, which is operated by the Fundación Galileo Galilei-INAF (Istituto Nazionale di Astrofisica) and is located in the Spanish Observatorio of the Roque de Los Muchachos of the Instituto de Astrofísica de Canarias.
This project used public archival data from the DESI Legacy Imaging Surveys (DESI LIS). The Legacy Surveys consist of three individual and complementary projects: the Dark Energy Camera Legacy Survey (DECaLS; Proposal ID 2014B-0404; PIs: David Schlegel and Arjun Dey), the Beijing-Arizona Sky Survey (BASS; NOAO Prop. ID 2015A-0801; PIs: Zhou Xu and Xiaohui Fan), and the Mayall z-band Legacy Survey (MzLS; Prop. ID 2016A-0453; PI: Arjun Dey). DECaLS, BASS, and MzLS together include data obtained, respectively, at the Blanco telescope, Cerro Tololo Inter-American Observatory, NSF’s NOIRLab; the Bok telescope, Steward Observatory, University of Arizona; and the Mayall telescope, Kitt Peak National Observatory, NOIRLab. The Legacy Surveys project is honoured to be permitted to conduct astronomical research on Iolkam Du’ag (Kitt Peak), a mountain with particular significance to the Tohono O’odham Nation. NOIRLab is operated by the Association of Universities for Research in Astronomy (AURA) under a cooperative agreement with the National Science Foundation. This project used data obtained with the Dark Energy Camera (DECam), which was constructed by the Dark Energy Survey (DES) collaboration. Funding for the DES Projects has been provided by the U.S. Department of Energy, the U.S. National Science Foundation, the Ministry of Science and Education of Spain, the Science and Technology Facilities Council of the United Kingdom, the Higher Education Funding Council for England, the National Center for Supercomputing Applications at the University of Illinois at Urbana-Champaign, the Kavli Institute of Cosmological Physics at the University of Chicago, Center for Cosmology and Astro-Particle Physics at the Ohio State University, the Mitchell Institute for Fundamental Physics and Astronomy at Texas A&M University, Financiadora de Estudos e Projetos, Fundacao Carlos Chagas Filho de Amparo, Financiadora de Estudos e Projetos, Fundacao Carlos Chagas Filho de Amparo a Pesquisa do Estado do Rio de Janeiro, Conselho Nacional de Desenvolvimento Cientifico e Tecnologico and the Ministerio da Ciencia, Tecnologia e Inovacao, the Deutsche Forschungsgemeinschaft, and the Collaborating Institutions in the Dark Energy Survey. The Collaborating Institutions are Argonne National Laboratory, the University of California at Santa Cruz, the University of Cambridge, Centro de Investigaciones Energeticas, Medioambientales y Tecnologicas-Madrid, the University of Chicago, University College London, the DES-Brazil Consortium, the University of Edinburgh, the Eidgenossische Technische Hochschule (ETH) Zurich, Fermi National Accelerator Laboratory, the University of Illinois at Urbana-Champaign, the Institut de Ciencies de l’Espai (IEEC/CSIC), the Institut de Fisica d’Altes Energies, Lawrence Berkeley National Laboratory, the Ludwig Maximilians Universitat Munchen and the associated Excellence Cluster Universe, the University of Michigan, NSF’s NOIRLab, the University of Nottingham, the Ohio State University, the University of Pennsylvania, the University of Portsmouth, SLAC National Accelerator Laboratory, Stanford University, the University of Sussex, and Texas A&M University. The Legacy Surveys imaging of the DESI footprint is supported by the Director, Office of Science, Office of High Energy Physics of the U.S. Department of Energy under Contract No. DE-AC02-05CH1123, by the National Energy Research Scientific Computing Center, a DOE Office of Science User Facility under the same contract; and by the U.S. National Science Foundation, Division of Astronomical Sciences under Contract No. AST-0950945 to NOAO.
Based, in part, on observations at Cerro Tololo Inter-American Observatory and National Optical Astronomy Observatory, which are operated by the Association of Universities for Research in Astronomy (AURA) under a cooperative agreement with the National Science Foundation.
DATA AVAILABILITY
The data underlying this article will be shared on reasonable request to the corresponding author.
Footnotes
Following the naming convention suggested in the Appendix of Martin et al. (2009), we suggest for this galaxy the dual naming introduced with the discovery of Pegasus/And VI, Cassiopeia/And VII or Pisces VI/And XXII.
Our search for dwarf satellite candidates around M33 was performed using the Legacy Survey Sky Viewer web site available in legacysurvey.org/viewer.
We assume that this sample is photometrically complete for this magnitude cut-off, that is ∼1.5 mag brighter than the magnitude limit of our diagram.
REFERENCES
Author notes
Talentia Senior Fellow
