-
PDF
- Split View
-
Views
-
Cite
Cite
Ke Xu, Qiusheng Gu, Shiying Lu, Xue Ge, Mengyuan Xiao, Emanuele Contini, Star-forming S0 galaxies in the SDSS-IV MaNGA survey, Monthly Notices of the Royal Astronomical Society, Volume 509, Issue 1, January 2022, Pages 1237–1244, https://doi.org/10.1093/mnras/stab3013
Close - Share Icon Share
ABSTRACT
To investigate star-forming activities in early-type galaxies, we select a sample of 52 star-forming S0 galaxies (SFS0s) from the SDSS-IV MaNGA survey. We find that SFS0s have smaller stellar masses compared to normal S0s in MaNGA. After matching the stellar mass to select the control sample, we find that the mean Sérsic index of SFS0 bulges (1.76 ± 0.21) is significantly smaller than that of the control sample (2.57 ± 0.20), suggesting the existence of pseudo-bulges in SFS0s. After introducing the environmental information, SFS0s show smaller spin parameters in the field than in groups, while the control sample has no obvious difference in different environments, which may suggest different dynamical processes in SFS0s. Furthermore, with derived N/O and O/H abundance ratios, SFS0s in the field show nitrogen enrichment, providing evidence for the accretion of metal-poor gas in the field environment. To study the star-formation relation, we show that the slope of the spatially resolved star-formation main sequence is nearly 1.0 with MaNGA integral field unit data, confirming the self-regulation of star-formation activity on kpc scales.
1 INTRODUCTION
Galaxy morphology encodes clues to galaxy formation and evolution. The famous ‘tuning fork’ (Hubble 1936) separates spirals and ellipticals on the two sides of lenticular galaxies (S0s). S0 galaxies contain a disc structure as spirals, except for the more prominent bulges and absence of spiral patterns, which are a significant bridge connecting early-type galaxies (ETGs) and late-type galaxies (LTGs). S0s and ellipticals are usually classified as ETGs. Because ETGs are redder than LTGs, the gas evacuation mechanism is required to suppress star formation and preserve the old stellar population (e.g. Strateva et al. 2001), resulting in a lack of both recent star formation and cold gas in ETGs.
However, recent observations indicate that some ETGs contain atomic gas, and even dust and/or molecular gas (e.g. Bottinelli & Gouguenheim 1977; Colbert, Mulchaey & Zabludoff 2001; Morganti et al. 2006; Combes, Young & Bureau 2007). The related star-formation activity is revealed, e.g. from far-ultraviolet and infrared radiation (Davis et al. 2014), or from emission-line diagnostic analysis (Xiao et al. 2016). However, some ETGs with higher gas surface density than normal spirals fall systematically below the Kennicutt–Schmidt law (Schmidt 1959; Kennicutt 1998) and Elmegreen–Silk relation (Elmegreen 1997; Silk 1997), showing lower star-formation efficiency than LTGs (Davis et al. 2014). Because of the above facts, Davis et al. (2014) used the local volumetric star-formation relation to unify the star formation of spirals, starbursts, and ETGs, and proposed a dynamical origin for the star-formation suppression in ETGs.
On the other hand, different environments may have different imprints during the formation and evolution of S0s. Deeley et al. (2020) utilized the SAMI survey and proposed two formation pathways for S0s. One is through minor mergers in the field, and the other is from faded spirals in denser environments. Different star-formation histories could lead to different features of S0s. While the faded spirals preserve more rotation-supported discs (e.g. Deeley et al. 2020), according to numerical simulations, minor mergers, frequently happening in the local universe (e.g. Villalobos & Helmi 2008), have been shown to have the effect of reducing the specific angular momentum, thickening the disc, and contributing to random motion (Ghosh et al. 2021). The specific angular momentum is an indispensable quantity influencing the atomic gas component in a disc galaxy (e.g. Obreschkow et al. 2016), preventing the gas from infalling and suppressing star formation. As for galaxies with lower specific angular momentum, the corresponding low Toomre parameter Q (Toomre 1964) would lead to disc instability and more efficient gas consumption within a time-scale of ∼2–3 Gyr (Romeo & Mogotsi 2018; Murugeshan et al. 2019; Romeo 2020; Romeo et al. 2020), which is significantly shorter than the cosmic time, leaving the galaxy deficient in atomic gas and raw material for further star formation. However, for S0s formed recently via minor mergers, they are still in star-formation conditions, and would provide clues to the physics in star-formation activity triggered by mergers or accretions.
Today, the study of S0s undergoing star-formation activity is of interest; this will not only help to understand the process of quenching or rejuvenation in ETGs, but also help to ascertain the nature of the star-formation law in the case of ETGs. Nowadays, with available integral field unit (IFU) data, such as MaNGA, it is possible to analyse the spatially resolved dynamics and chemical components, providing valuable information on the formation and evolution of S0s.
In this paper, we have two main aims. The first is to obtain basic information on star-forming S0s (hereafter SFS0s), such as stellar mass, the Sérsic index of bulges, and the star-formation main sequence (SFMS). The second is to study the relation between star-formation activity and environment.
This paper is organized as follows: In Section 2, we introduce the sample selection, basic physical parameters, and preliminary analysis. In Section 3, we describe the dynamics and chemical enrichment of S0s in different environments. We also discuss the origin of star-forming S0s in Section 4, and conclude in Section 5. In this paper, we carry out our work using the Salpeter initial mass function (Salpeter 1955) in a flat |$\rm \Lambda CDM$| cosmology, with parameters |$\rm \Omega _M=0.3$|, ΩΛ = 0.7 and |$H_0=70\, \mathrm{km\, s^{-1}\, Mpc}^{-1}$|.
2 DATA
In this work, we utilize the data products from MaNGA (Bundy et al. 2015; Yan et al. 2016) Data Release 16 (Ahumada et al. 2020). We use the ‘MAPS-VOR10-GAU-MILESHC’ files from the Data Analysis Pipeline (dap, Westfall et al. 2019; Belfiore et al. 2019) for emission-line information and stellar kinematics. dap simultaneously fits the emission line and stellar continuum, minimizing the stellar features on the recovered emission-line fluxes. We use the pipe3d value-added catalogue (Sánchez et al. 2016a,b) for stellar mass surface density, redshift, axial ratio, and ionization information in the central 2.5-arcsec aperture. The total stellar mass and star-formation rate are taken from the MPA–JHU catalogue (Kauffmann et al. 2003a; Brinchmann et al. 2004).
2.1 Sample selection
Fischer, Domínguez Sánchez & Bernardi (2019) described the Sloan Digital Sky Survey IV (SDSS-IV) MaNGA Pymorph Photometric Value-Added Catalogues (MPP-VAC) and MaNGA Deep Learning Morphology Value-Added Catalogues (MDLM-VAC). They included the photometric parameters and morphological classification, which have been manually checked, providing valuable morphological information for later analysis.
In this work, we first select galaxies in MDLM-VAC with TType < 0, ensuring that they are early-type galaxies. Secondly, these galaxies are required to be S0 candidates, with P_S0 > 0.7. Thirdly, the ellipticity is required less than 0.7 to avoid edge-on cases. Fourthly, to decide whether the galaxy has ongoing star-formation activity, we perform a traditional BPT diagnostic (Baldwin, Phillips & Terlevich 1981) and restrict the signal-to-noise ratio (S/N) to >5 for all emission lines in the central 2.5-arcsec aperture. The demarcation lines are taken from Kewley et al. (2001) and Kauffmann et al. (2003b) to select star-forming S0s. We further require the H α equivalent width in the central 2.5-arcsec aperture to be larger than 6 Å (e.g. Sánchez 2020). The corresponding diagnostic is shown in Fig. 1. After excluding AGNs and composite types, we obtain a sample of 52 SFS0s. Finally, a sample of 216 normal S0s is also constructed by adopting the criterion as in Bluck et al. (2020), 1.1 dex lower than the SFMS given by Renzini & Peng (2015). The stellar mass versus redshift distribution of normal S0s and SFS0s is plotted in Fig. 2. The two sequences in Fig. 2 are primary and secondary samples in the MaNGA survey (Bundy et al. 2015; Yan et al. 2016), which reach 1.5 and 2.5 Re for more than 80 |${{\ \rm per\ cent}}$| of the galaxies individually. The main conclusions are compatible in the two sequences, and we will use both samples in this work.
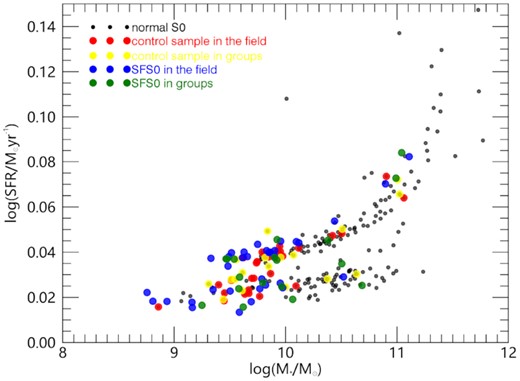
The stellar mass versus redshift distributions. The dots show normal S0s (black), the control sample in the field (red), the control sample in groups (yellow), SFS0s in the field (blue), and SFS0s in groups (green).
2.2 Environmental information
As discussed in Deeley et al. (2020), the environment plays an essential role in the formation and evolution of S0 galaxies, leading to distinct origins in the field and denser groups. Yang et al. (2007) presented the group catalogue for SDSS galaxies. By cross-matching our galaxies with their catalogue, we separate our sample as in Deeley et al. (2020): isolated S0s that are not associated with any group and grouped S0s that are in groups with halo masses larger than 1011 M⊙. We finally get 52 SFS0s (34 in the field and 18 in groups) and 208 normal S0s (108 in the field and 100 in groups).
2.3 Control sample
Fig. 2 shows that normal S0s present higher stellar masses, which may be related to the mass quenching discussed in previous work (Xiao et al. 2016; Li et al. 2020). For comparison, a control sample with a similar stellar mass distribution to SFS0 is required. For each SFS0, we match a control galaxy from the normal ones with Δlog(M*) < 0.15 and Δz < 0.02. In this way, a sample of 48 normal S0s is selected, while four SFS0s fail to match a counterpart due to the lack of quiescent S0s below log(M*/M⊙) < 9.5. Removing these four SFS0s does not affect our results, and we preserve a 52 SFS0 sample and 48 normal S0s as the control sample. Fig. 2 shows their stellar mass versus redshift distributions.
To have better knowledge of the two samples, we compare their morphologies. We plot the bulge Sérsic index from the MPP-VAC of SFS0s and the control sample in Fig. 3. Note that the excess at Sérsic index n = 8 is due to the upper limit in the fitting procedure. Regardless of this, SFS0s and the control sample have mean values of 1.76 ± 0.21 and 2.57 ± 0.20, respectively, indicating that SFS0s contain more pseudo-bulges than the control sample, consistent with Xiao et al. (2016). Cappellari et al. (2013) found an inverse relation between bulge fraction and molecular-gas content. A classic bulge would lead to less cold gas at the centre. In contrast, the shallower potential well for pseudo-bulges introduces weaker dynamical suppression, as Davis et al. (2014) suggested.
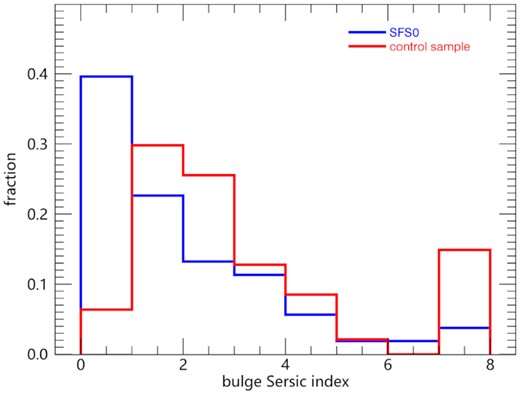
The distributions of the Sérsic index of bulges. Blue lines represent SFS0s and red lines represent the control sample. The excess at n = 8 is due to the upper limit in the morphological fitting.
2.4 Spin parameter
2.5 Star-formation rate
2.6 Gas inflow indicator
Luo et al. (2021) used the N/O abundance ratio to study the accretion of metal-poor gas in star-forming galaxies. The basic idea is that oxygen is the primary element depending on stellar nuclear activities, while nitrogen can be the primary and secondary element. In a low-metallicity star, helium burning provides materials for nitrogen and oxygen production, leading to a constant N/O ratio, while a high-metallicity star has carbon and oxygen from the ISM, resulting in N/O dependent on the O/H ratio (detailed in Luo et al. 2021). The different roles of nitrogen determine its relationship between N/O and O/H (e.g. Andrews & Martini 2013). When galaxies accrete the metal-poor gas, they would be located above the relation between N/O and O/H, resulting in N/O abundance excess. During the transport of gas into galaxies, star formation is sustained.
3 RESULTS
3.1 Star-formation main sequence
In Fig. 4, we plot the SFMS for SFS0s only; due to the absence of emission lines, galaxies of the control sample are not shown. The total stellar mass and star-formation rate are derived from the MPA–JHU catalogue. The solid line in Fig. 4 is from Elbaz et al. (2007), and describes the SFMS of SDSS z ∼ 0 galaxies with the same data from the MPA–JHU catalogue. 10/34 of SFS0s in the field and 7/18 of SFS0s in groups are below the 1σ threshold of the relation. While the SFS0s are selected according to the central 2.5-arcsec aperture, most are located well on the SFMS, suggesting a relatively steady star-formation rate as star-forming disc galaxies. About a third of the SFS0s lower than the SFMS might be transforming between blue and red sequences. Because some galaxies would scatter below the 1σ limit due to statistical fluctuations, a third is probably an overestimation.
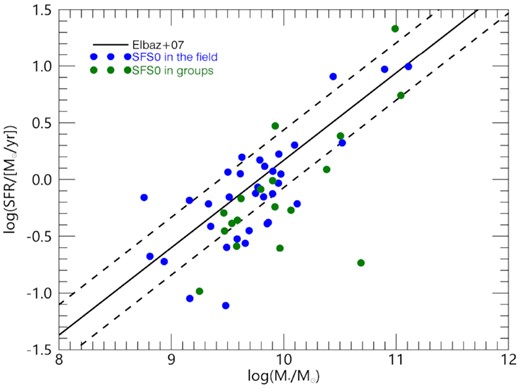
The star-formation main sequence of SFS0s. The blue points are isolated SFS0s, and the green points are SFS0s groups. The solid line is from Elbaz et al. (2007), and the two dashed lines correspond to the ±1σ thresholds.
Considering smaller physical scales, Sánchez et al. (2021) also presented the resolved SFMS (rSFMS) relation based on the different data sets in the local universe (e.g. for the CALIFA survey, the slope and intercept are 1.01 ± 0.15 and −10.27 ± 0.22, respectively). Our work gives the rSFMS relation from the SFS0 spaxels with H α equivalent width > 6 Å (detailed in Section 2.5). The stellar mass in each spaxel is from the pipe3d pipeline. The spaxel area is derived from the redshift and spaxel angular size accounting for galaxy inclination. The results are presented in Fig. 5. Because the fitting of spaxels from the SFS0s in the field and groups are similar, we show the fitting result combining all the spaxels, where the derived slope and intercept are 1.04 ± 0.01 and −10.38 ± 0.03, respectively, nearly the same as in Sánchez et al. (2021). The existence of such an rSFMS relation implies that star formation in SFS0s is self-regulated by the same physical process at kpc scales as normal star-forming galaxies (Sánchez et al. 2021). Given the nature of S0 formation via faded spirals in groups or minor mergers and accretion in the field, this further confirms that the galaxy interactions between themselves or different environments do not affect star formation globally, but through regulation at resolved scales (Sánchez 2020; Sánchez et al. 2021).
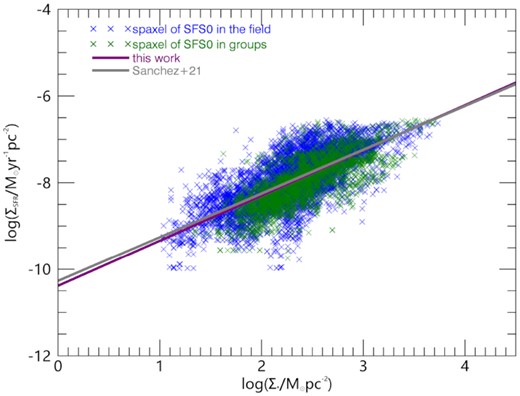
The spatially resolved SFMS for our SFS0s. Blue crosses: star-forming spaxels from SFS0s in the field. Green crosses: star-forming spaxels from SFS0s in groups. The solid purple line is the best-fitting of all the spaxels in this work, while the solid grey line is the fitting of the CALIFA data set from Sánchez et al. (2021).
3.2 Spin parameter distribution
With MaNGA spatially resolved IFU data, we are able to calculate the spin parameter combining stellar kinematic measurements from individual spaxels. As discussed in Section 2.4, we only use the spaxels within 45 degrees of the major axis to avoid the deprojection effect near the minor axis. We calculate all spaxels within 1.5 Re and show the results in Fig. 6. The SFS0 and control sample have similar spin parameter distributions. To further investigate the effect of environment (e.g. the field and groups), we plot the distributions of |$\lambda _R$| for SFS0s and the control sample in different environments separately in Fig. 6.
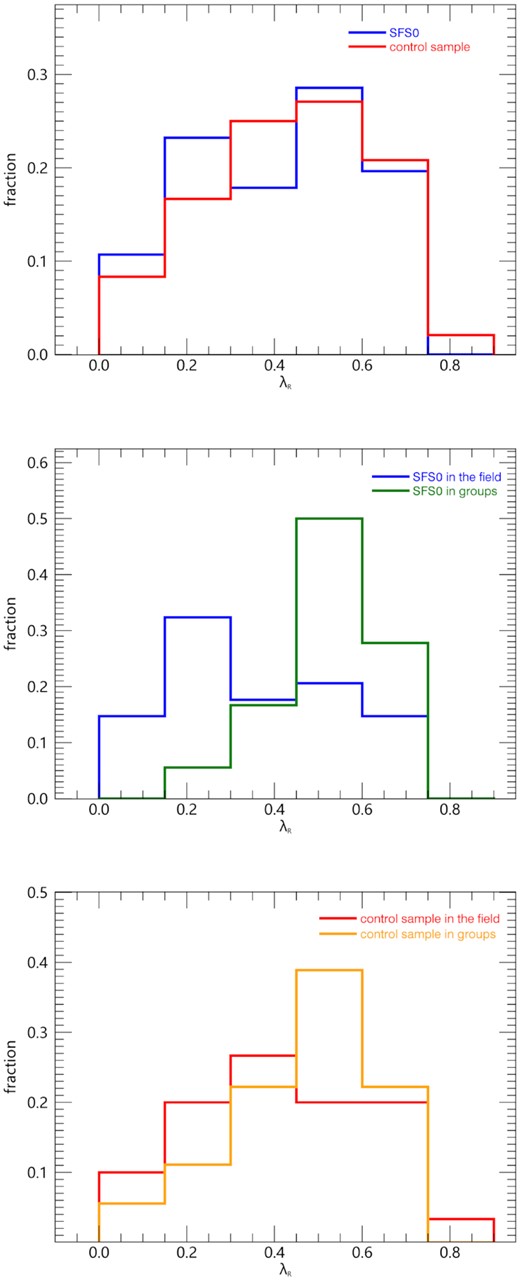
The distributions of spin parameters. Top: SFS0 and the control sample. Middle: the SFS0s in the field and in groups. Bottom: the control sample in the field and in groups.
The spin parameter distributions of SFS0s in the field and groups are different. In the field, they have average |$\lambda _R\sim 0.40\pm 0.04$|, while in groups the average |$\lambda _R$| is 0.57 ± 0.03. However, there is no significant difference for the control sample. The control sample in groups is slightly more rotation-supported (|$\lambda _R\sim 0.52\pm 0.04$|) than the isolated (|$\lambda _R\sim 0.46\pm 0.04$|), which is consistent with Deeley et al. (2020). To confirm the validity of distinct distributions in SFS0s, we adopt the two-sample Kolmogorov–Smirnov test (K–S test). For SFS0s in the field and group, the p-value is ∼0.01 (<0.05), while, for the control sample in the field and group, the p-value is ∼0.19. The above analysis implies that SFS0s in the field and group may experience different dynamical processes, suggesting that the faded spiral scenario is more feasible in groups. Some isolated SFS0s exist with λR > 0.45, which will be discussed in Section 4.
3.3 N/O abundance
The method of N/O abundance ratio proposed by Luo et al. (2021) can provide evidence of accretion. We follow the same method to calculate the N/O and O/H for SFS0s (detailed in Section 2.6).
In Fig. 7, the solid red line is the fitting for normal star-forming galaxies by Luo et al. (2021). In this work, the abundance excess of N/O is not as high as Luo et al. (2021) because they selected anomalously low-metallicity regions. However, we still have several spaxels with 12 + log(O/H) < 8.50 ∼ −1.43. It can be seen that the excess of N/O is more obvious in lower-metallicity regions [12 + log(O/H) < 8.65)], especially for those spaxels in isolated SFS0s, the same region where typical anomalously low-metallicity regions are located in Luo et al. (2021). To better show the level of excess from the relation, we generate Gaussian random points along the relation between log(N/O) and log(O/H). We assume that the random set has the same dispersion as SFS0 spaxels, ∼0.14. Then we apply the K–S test to the residuals of the random Gaussian set and SFS0 spaxels from the relation. The p-value is smaller than 10−15 for both the spaxels of SFS0s in the field and groups. Therefore, the spaxels do not follow normal galaxies, which possibly suggests that these regions have N/O abundance excess like those galaxies accreting metal-poor gas from the outside.
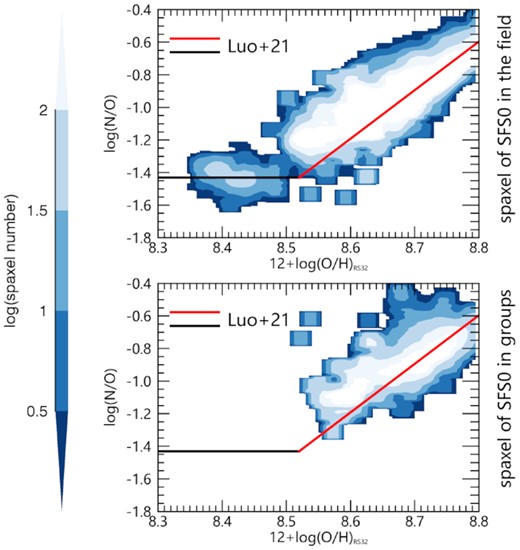
The N/O versus O/H plane for SFS0s. The upper and lower panels are the spaxels from SFS0s in the field and in groups individually. The black and red solid lines are the result from Luo et al. (2021). The colour grid represents the spaxel number.
4 DISCUSSION
4.1 Relation between |$M_*$| and metallicity
Using a sample of ∼53 000 star-forming galaxies, Tremonti et al. (2004) found a relation between stellar mass and gas-phase metallicity, known as the mass–metallicity relation (MZR). Recently, Barrera-Ballesteros et al. (2016) found that low-mass (|$\rm \le 10^{9.5}\,\,M_{\odot }$|) galaxies deviated to lower metallicities by using MaNGA data. Therefore, it is necessary to examine the influence of stellar mass on metallicity for SFS0s.
We divide SFS0s in the field into low-mass ones [log(M*/M⊙) ≤ 9.5; nine galaxies] and high-mass ones [log(M*/M⊙) > 9.5; 25 galaxies]. The relation between N/O and O/H abundances is plotted in Fig. 8. The star-forming regions in low-mass isolated SFS0s have lower metallicity than their high-mass counterparts, aligned to the MZR. In addition, the low-mass ones are located in the expected regions in the N/O versus O/H plane, which indicates the possibility of metal-poor gas accretion. Since the merger history affects the specific angular momentum in the galaxy, a quick check is through their |$\lambda _R$|, with 0.27 ± 0.04 for the low-mass and 0.45 ± 0.04 for the high-mass ones. The former show disturbed kinematics, as expected after minor mergers (e.g. Ghosh et al. 2021). Even though the high-mass isolated SFS0s are more rotation-supported than the low-mass ones, they have smaller |$\lambda _R$| than SFS0s in groups, and we do not rule out the possibility of accretion or minor mergers. Because the galaxies absorbed by high-mass isolated SFS0s in minor mergers are also more massive and less metal-poor, a lack of apparent nitrogen abundance excess is reasonable. Furthermore, they also make up the portions of isolated SFS0s with |$\lambda _R\gt 0.45$| in Fig. 6.
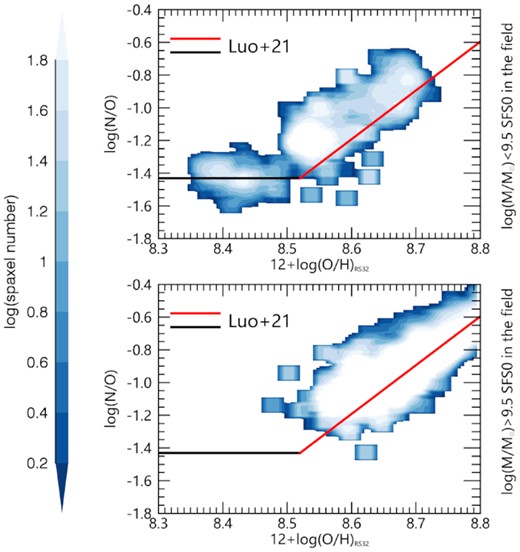
The N/O versus O/H plane for the spaxels from low-mass (top) and high-mass (bottom) SFS0s in the field. The black and red solid lines are from Luo et al. (2021). The colour grid represents the spaxel number.
To find the spatial distribution of these spaxels, we set up a grid of |$\rm \Delta log(N/O)$| versus log(O/H) [|$\rm \Delta log(N/O)=log(N/O)-log(N/O)_{Luo+21}$|, where |$\rm log(N/O)_{Luo+21}$| is calculated from Luo et al. 2021], and calculate the mean distance from the galaxy centre of the spaxels in the grid. The 12 + log(O/H) range is restricted to [8.52,8.80] to contain enough spaxels. The calculated results are then fitted with the loess procedure (Cappellari et al. 2013) and shown in Fig. 9. The loess procedure is used here to recover the trends from the noisy data.
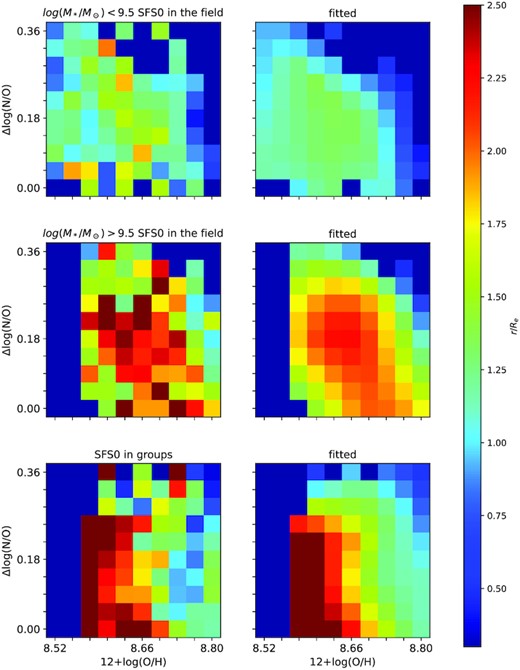
The Δlog(N/O) versus log(O/H) plane for low-mass isolated SFS0s (top), high-mass isolated SFS0s (middle), and SFS0s in groups (bottom). |$\rm \Delta log(N/O)=log(N/O)-log(N/O)_{Luo+21}$|, where |$\rm log(N/O)_{Luo+21}$| is calculated from the relation in Luo et al. (2021). The left-hand panels are the original calculation and the right-hand panels are the results from loess fitting. The colour is the distance to the galactic centre normalized by |$R_{\rm e}$|.
The trend of SFS0s in groups can be explained by a negative radial metallicity gradient where low-metallicity spaxels are located in a distant region. For high-mass isolated SFS0s, most spaxels have a mean distance of 2 |$R_{\rm e}$|, indicating the existence of a young stellar population at larger radii. Luo et al. (2021) found the highest N/O excess region at |$r\gt 1.5\,\,R_{\rm e}$|. If we suppose that these high-mass isolated SFS0s accrete materials from outside, our results are similar to Luo et al. (2021) and the relatively high angular momentum helps stabilize the disc and prevent gas inflowing (e.g. Obreschkow et al. 2016). For low-mass isolated SFS0s, we find spaxels with a nitrogen abundance excess in the central region, which provides evidence for metal-poor gas inflow fuelling the central star formation. We note that this is an average result, not representative of a single galaxy.
4.2 SF quenching or rejuvenation
The environment may have important imprints on the galaxy evolution in addition to morphological quenching (e.g. Li et al. 2020). For example, the anomalously low-metallicity galaxies in Luo et al. (2021) accrete metal-poor gas from the circumgalactic medium or the cosmic web. For galaxies in groups or the field, the ongoing physical process can be very different. In the field, minor mergers and inflows of fresh gas are common for S0s (Jaffé et al. 2014), while in denser environments S0s are often found on the outskirts of clusters, where harassment (e.g. Moore et al. 1996), tidal interactions (e.g. Mayer et al. 2006), and stripping (e.g. Nulsen 1982; Roberts & Parker 2020) are important, especially falling towards the central region of clusters.
In the local universe, minor mergers happen frequently (e.g. Frenk et al. 1988; Gao et al. 2004). Kaviraj (2014a,b) suggested that almost half of the nearby star-formation activity is triggered by minor mergers. Because minor mergers are not destructive, unlike major mergers, the disc structure can be preserved. Minor mergers triggering star formation have been observed in S0s (e.g. Ge et al. 2020; Chen et al. 2021). On the other hand, in numerical simulations, minor mergers are shown to thicken the disc and decrease the specific angular momentum (e.g. Ghosh et al. 2021). After a minor merger, the angular momentum should be reduced from the initial state, explaining the low λR distribution in isolated SFS0s. For those high-mass isolated SFS0s with higher λR, accretion is not remarkable, as shown in Fig. 8, so they can maintain their relatively high angular momentum. Thickness and disturbances to the disc would be a good tracer for mergers, which is of further interest with deep imaging.
On the other hand, in groups, processes like ram pressure stripping could make the infalling satellites more gas-poor in denser environments (Kimm, Yi & Khochfar 2011). The environmental effects would affect the material cycle in the galaxy (Tumlinson, Peeples & Werk 2017) and strip the atomic gas, which is less bonded to the host. However, during a process such as stripping, the star-formation rate can also be enhanced (e.g. Roberts & Parker 2020). For normal spiral galaxies, the gas depletion time is ∼1.0 Gyr considering the Kennicutt–Schmidt law, which is much shorter than the cosmic age. Within dense environments, the depletion would be more effective. From the statistics, we would observe fewer such SFS0s in groups than in the field, in coincidence with our work (18 in groups and 34 in the field). In contrast, normal S0 galaxies have similar numbers in different environments. Because the faded spirals are mainly the predecessors of S0s in groups or clusters (Spitzer & Baade 1951; Gunn & Gott 1972; Dressler 1980; Dressler et al. 1997), they are more rotation-supported. They have low-metallicity regions at larger radii, implying a stable disc resisting gas inflow. With more data and larger samples in the future, we can further study the impact of group richness and distance from the group centre on SFS0s.
Compared with Luo et al. (2021), our SFS0 sample has larger O/H in its spaxels, which is certain because their sample consists of low-metallicity regions. With the old evolved stellar population in early-type galaxies, it is not strange that the nitrogen abundance excess is not obvious. Another possibility is that the change in metallicity might depend on the properties of the interacting neighbourhood (e.g. Pak et al. 2021). We note that, due to the old stellar population in these early-type galaxies, we will not have the problem of Wolf–Rayet stars as in Luo et al. (2021). Our sample selection excludes AGNs and has moderate star-formation activity, which makes it impossible for the outflow to dilute the ISM.
Andrews & Martini (2013) found N/O ∝ O/H1.7 using the global data. Our SFS0s in groups are consistent with their slope in Fig. 7 of this paper, despite the different intercepts. The construction of global N/O abundances from the resolved ones and the detailed chemical evolution of SFS0s are of future interest.
4.3 Spatially resolved SFMS and star-formation law
As discussed in Section 3.1, the rSFMS with the slope ∼1.0 obtained in this work is consistent with the previous work using different data sets. The slope of ∼1.0 enables the construction of a global SFMS from the resolved scales, though the scatter of the rSFMS could contribute to the non-linear global relation. It also implies that SFS0s regulate their star-formation activity at resolved scales of kpc.
5 CONCLUSION
In this work, we select the S0 sample from the previous deep learning results for the SDSS-IV MaNGA survey. Our main results are the following:
SFS0s show a smaller mean bulge Sérsic index.
Iisolated SFS0s have smaller λR than SFS0s in groups. Compared to SFS0s, the normal S0s do not show obvious differences in different environments.
The resolved star-formation main sequence has a slope ∼1.0, consistent with normal star-forming galaxies.
Isolated SFS0 spaxels show more obvious N/O excesses than SFS0s in groups, which might be due to accretion or minor mergers.
Low-mass isolated SFS0s have similar N/O abundances to anomalously low-metallicity regions in Luo et al. (2021) compared to high-mass ones.
From the above, we provide clues for the origin of SFS0s. In groups, they are possible successors of faded spirals. In the field, minor mergers could provide metal-poor gas and ignite star formation in S0s, especially in low-mass ones. In addition, their star formation is self-regulated at kpc scales during quenching or rejuvenation, identical to normal star-forming galaxies.
In future research, we expect observation results from JCMT and to find more information with gas data. Also, with the coming MaNGA new data release, we should have a larger sample and high-quality data.
ACKNOWLEDGEMENTS
The authors are very grateful to the anonymous referee for critical comments and instructive suggestions, which significantly strengthened the analysis in this work.
This work is supported by the National Key Research and Development Program of China (No. 2017YFA0402703) and by the National Natural Science Foundation of China (No. 11733002).
Funding for the Sloan Digital Sky Survey IV has been provided by the Alfred P. Sloan Foundation, the US Department of Energy Office of Science, and the Participating Institutions. SDSS-IV acknowledges support and resources from the Center for High-Performance Computing at the University of Utah. The SDSS web site is www.sdss.org. SDSS-IV is managed by the Astrophysical Research Consortium for the Participating Institutions of the SDSS Collaboration including the Brazilian Participation Group, the Carnegie Institution for Science, Carnegie Mellon University, the Chilean Participation Group, the French Participation Group, the Harvard-Smithsonian Center for Astrophysics, Instituto de Astrofísica de Canarias, Johns Hopkins University, Kavli Institute for the Physics and Mathematics of the Universe (IPMU)/University of Tokyo, Lawrence Berkeley National Laboratory, Leibniz Institut für Astrophysik Potsdam (AIP), Max-Planck-Institut für Astronomie (MPIA Heidelberg), Max-Planck-Institut für Astrophysik (MPA Garching), Max-Planck-Institut für Extraterrestrische Physik (MPE), National Astronomical Observatory of China, New Mexico State University, New York University, University of Notre Dame, Observatório Nacional/MCTI, Ohio State University, Pennsylvania State University, Shanghai Astronomical Observatory, United Kingdom Participation Group, Universidad Nacional Autónoma de México, University of Arizona, University of Colorado Boulder, University of Oxford, University of Portsmouth, University of Utah, University of Virginia, University of Washington, University of Wisconsin, Vanderbilt University, and Yale University.
DATA AVAILABILITY
The dap and pipe3d pipeline data are available via https://www.sdss.org/dr16/manga/, and the loess software is available via http://www-astro.physics.ox.ac.uk/~mxc/software/ and Cappellari et al. (2013).


