


ABSTRACT
The black hole X-ray transient MAXI J1820 + 070 (= ASSASN-18ey) discovered in 2018 March was one of the optically brightest ever seen, which has resulted in very detailed optical outburst light curves being obtained. We combine them here with X-ray and radio light curves to show the major geometric changes the source undergoes. We present a detailed temporal analysis that reveals the presence of remarkably high amplitude (>0.5 mag) modulations, which evolve from the superhump (16.87 h) period towards the presumed orbital (16.45 h) period. These modulations appear ∼87 d after the outburst began, and follow the Swift/BAT hard X-ray light curve, which peaks 4 d before the radio flare and jet ejection, when the source undergoes a rapid hard to soft state transition. The optical modulation then moves closer to the orbital period, with a light-curve peak that drifts slowly in orbital phase from ∼0.8 to ∼0.3 during the soft state. We propose that the unprecedentedly large amplitude modulation requires a warp in the disc in order to provide a large enough radiating area, and for the warp to be irradiation driven. Its sudden turn-on implies a change in the inner disc geometry that raises the hard X-ray-emitting component to a height where it can illuminate the warped outer disc regions.
1 INTRODUCTION
The X-ray transient (XRT), MAXI J1820 + 070, was discovered via its X-ray outburst in 2018 March (Kawamuro et al. 2018), although it was also recorded as an optical transient, ASASSN-18ey, a few days earlier (Denisenko 2018). It became one of the brightest (in both X-rays and optical) of these objects ever seen (Mereminskiy et al. 2018; Shidatsu et al. 2018; Littlefield 2018), and remained active and bright for many months, undergoing X-ray state transitions and several subsequent outbursts. Also found to be a powerful, steady radio source, Bright et al. (2020) detected a large radio flare and jet ejection at the time of the first hard-to-soft state transition, following which the radio flux was substantially reduced.
Its large increase in brightness (from a quiescent V ∼ 19 to ≤12; Russell et al. 2019a; Russell, Baglio & Lewis 2019b) immediately indicated that it was a low-mass X-ray binary (LMXB) in which a cool, evolved low-mass donor transfers material by Roche lobe overflow via an accretion disc on to a compact object. Based on its X-ray properties (Shidatsu et al. 2018), it was suspected to be a black hole (BH), and the source has been extensively observed throughout the outburst, from both ground- and space-based facilities. The rare (∼decades apart) outbursts only occur when the disc becomes sufficiently massive to undergo a transition to a hot, viscous state, which then results in a higher mass-transfer rate on to the BH. These black hole X-ray binaries (BHXBs) provide superb laboratories within our Galaxy for studies of the physics of BH environments and the behaviour of X-ray irradiated accretion discs. For recent reviews of BHXBs and their properties, see e.g. Casares, Jonker & Israelian (2017).
The unusually high visual brightness of MAXI J1820+070 (hereafter J1820), only exceeded by the prototypical BHXBs A0620-00 and V404 Cyg, combined with its appearance at the start of the observing season and its low extinction (it is at Galactic latitude +10°), has allowed for the generation of a remarkably detailed outburst light curve by the American Association of Variable Star Observers (AAVSO). Some of these data were reported by Patterson et al. (2018), who detected a large amplitude (∼0.5 mag) 16.87 h modulation, beginning approximately 75 d after the start of outburst (with no such variation present earlier). They considered this to be indicative of the orbital period, although conceded that it might also be a ‘superhump’, a feature originally found in the SU UMa dwarf nova sub-class of cataclysmic variables (CVs), which is always a few per cent longer than Porb and is commonly interpreted as being due to a precessing accretion disc (see Whitehurst & King 1991).
What is remarkable about J1820 is the extremely high amplitude of optical modulation seen by Patterson et al. (2018) at the superhump period of 16.87 h. Such modulations have been seen before in BHXBs (O’Donoghue & Charles 1996), and explained by Haswell et al. (2001) as arising due to X-ray irradiation of a disc whose area is changing on the precession period. However, those superhumps were of much lower amplitude (≤0.2 mag).
Following its transition to quiescence in 2019 (although there have been subsequent shorter outbursts), Torres et al. (2019, 2020) obtained the optical radial velocity curve and rotational broadening of the K4/5 donor star, finding the orbital period to be 16.45 h and obtaining a mass function of 5.2 M⊙. This confirmed that the Patterson et al. (2018) modulation was indeed a superhump. From these data, Torres et al. (2020) deduced the binary parameters of J1820 to be a 0.6 M⊙ donor orbiting a 8.5 M⊙ BH with a high orbital inclination (in the range 66°–81°, with 73.5° preferred), thereby confirming its BHXB status although Atri et al. (2020) inferred a slightly lower value (63°) based on the radio jet properties.
Furthermore, at only 3.0 ± 0.3 kpc distance (Atri et al. 2020), there has been extensive coverage of this outburst at X-ray and radio wavelengths, producing a wealth of results (see e.g. Stiele & Kong 2020 and references therein), and Bright et al. (2020) and Shaw et al. (2021) place its X-ray/radio properties into the context of the BHXB population. There has been particular interest in the X-ray spectra and timing behaviour in the interval leading up to the very rapid (only a few days) hard-to-soft state transition, ∼120d into the outburst. That is because the canonical model of BHXBs has a truncated inner accretion disc surrounding a very hot, hard X-ray-emitting region during the hard state, followed by the disc radius decreasing towards the innermost stable circular orbit as it enters the soft state. The details of this process are still highly controversial.
The aim of this paper is therefore to bring together for the first time an extremely detailed AAVSO light curve of the 2018-19 main outburst together with its X-ray and radio behaviour. In particular, we explore the properties of the optical modulation as it evolves leading up to, and through, the state transition.
2 OBSERVATIONS
The optical observations of J1820 used in this paper were carried out by the AAVSO, the Southern African Large Telescope (SALT), and the South African Astronomical Observatory (SAAO) 1 m telescope. The X-ray light curves obtained by NICER, the BAT and XRT instruments aboard the Niel Gehrels |$\it Swift$| Observatory (hereafter Swift/BAT and Swift/XRT, respectively), and MAXI, together with the radio coverage by AMI, MeerKAT, eMERLIN, and VLA are also discussed here to provide full multiwavelength observations of the overall temporal evolution of J1820 for ∼200d following the 2018 outburst. For convenient reference to different times within the outburst, we adopt the same day number scheme as used by Stiele & Kong (2020); i.e. day 0 is 2018 March 11 0h ut = MJD 58188, just before the first triggering of X-rays from J1820 (Kawamuro et al. 2018).
2.1 AAVSO data
The optical brightness of J1820, reaching V ∼ 12, meant that the source could be accurately and reliably monitored by the global network of the AAVSO for extended periods of time. This provided an essentially continuous light curve throughout the 2018 main outburst. The AAVSO observers providing the most accurate brightness estimates typically used CCD cameras on 0.2–0.4 m telescopes, with time resolutions of ∼5–60 s, more than sufficient for the time-scales of interest here. We accessed the J1820 V-band data from the online AAVSO data base,1 which contains the details of each observation (including comparison stars used), selecting only those data with quoted errors <0.02 mag, which we then used for the temporal analysis. This yielded ∼370 000 data points, which are plotted in Fig. 1.

Multiwavelength light curves of J1820. From top to bottom: (1) Optical (AAVSO – red; SAAO 1 m – magenta; SALT – yellow) and X-ray Swift–XRT – black; Swift–BAT – cyan. Optical magnitudes were converted to an arbitrary intensity scale; Swift–XRT count rates (right y-axis) are offset by +9000. (2) MAXI count rate. (3) MAXI Hardness Ratio (10–20 keV/ 2–10 keV). (4) NICER count rate. (5) NICER Hardness Ratio (4–12 keV/2–4 keV). (6) Radio fluxes from AMI to LA (magenta; 15.5 GHz), MeerKAT (orange; 1.28 GHz), eMERLIN (red; 1.5, 5 GHz), and VLA (blue; C band) are plotted in the bottom panel (see Bright et al. 2020 and Homan et al. 2020 for details). Three vertical dashed lines mark key intervals during this outburst: Days 87 (blue), the beginning of large amplitude optical modulations; 114 (black), peak of the Swift/BAT secondary maximum; 118 (red), time of the AMI radio flare, jet ejection and X-ray state change from hard to soft – see Discussion section.
2.2 SAAO/SALT
We obtained high-speed photometry of J1820 using the SAAO 1 m telescope for 20 nights, from 2018 March 25 to September 29, equipped with the Sutherland High Speed Optical Camera (SHOC; Coppejans et al. 2013), a frame transfer EM-CCD camera (an Andor iXon888 camera). The light curves derived from the 200 ms images were produced from differential aperture photometry using the SHOC data reduction pipeline,2 and these data are included in Fig. 1, albeit in time-averaged form.
Photometry of J1820 was also performed with the SALT on 5 d between 2018 May and July. The observations on 2018 June 13 and July 7 used SALT’s imaging spectrograph – the Robert Stobie Spectrograph. There is also SALTICAM, that acts as an acquisition camera and fast science imager for SALT, and was used for the May 22, July 8 and 10 observations. The reduced data are also plotted in Fig. 1, again in time-averaged form, but after converting from magnitudes into an arbitrary intensity scale. The intrinsically high time resolution data from both SALT and SHOC will be presented in a subsequent paper.
2.3 X-ray data: Swift, NICER, MAXI
In addition to its continuous monitoring with the BAT (15–150 keV), Swift observed J1820 extensively with targeted XRT (0.3–10 keV; Burrows et al. (2005)) observations throughout the 2018 outburst (Stiele & Kong 2020), and we used the Build Swift–XRT products (from the UK Swift Science Data Centre) to construct an X-ray light curve for use here. These data are presented in Fig. 1, together with X-ray observations reported by NICER (0.5–12 keV; see Gendreau, Arzoumanian & Okajima 2012) from 2018 March to September, and the MAXI (2–20 keV; see Matsuoka et al. (2009)) X-ray light-curve data collected from the MAXI data archive centre.
3 TEMPORAL ANALYSIS
As already noted by Patterson et al. (2018), J1820 exhibited large, photometric variations with a period of 0.703 ± 0.003 d (subsequently revised to 0.6903 d in Patterson 2019), and these are readily visible in the AAVSO light curve, but only during certain intervals. Since the orbital period has now been accurately determined (Torres et al. 2019, 2020) to be Porb = 0.68549 ± 0.00001 d, we undertook a Lomb–Scargle (LS) periodogram analysis of this rich AAVSO optical data set to study in detail these variations of J1820 throughout the ∼1 yr outburst. The relevant periodicities in which we are interested are the orbital, superhump (Psh) and precession (Pprec) periods, where Pprec is the beat period between the first two. We used a dynamical power spectrum (DPS) analysis to reveal how these periodicities of J1820 evolve with time (as used, e.g. Clarkson et al. 2003 and Kotze & Charles 2012). The data coverage is sufficiently extensive to also allow for phase-folding of the light curves as a function of time during the outburst.
3.1 Presence of orbital and superorbital modulations
We have used the ‘LS Periodogram’ from gatspy.periodic,3 to perform the period analysis of our optical and X-ray light curves. The LS periodogram (see Lomb 1976 and Scargle 1982) is a commonly used statistical tool for detecting periodic signals in unevenly spaced observations.
While our initial LS periodogram of the whole AAVSO 2018 light curve (Fig. 2, top panel) did reveal the ∼0.7 d modulation described above, the power spectrum was dominated by large peaks at 1 cycle d−1 and its harmonics. These were a result of the daily gaps introduced by the western hemisphere distribution of AAVSO observers, and produced strong features in the window spectrum. Accordingly, we used the same approach as described in Barthes (1995) in order to effectively ‘clean’ these spurious features from the power spectrum. This is equivalent to pre-whitening the data (Roberts, Lehar & Dreher 1987), as used in a very similar analysis recently by Boyd et al. (2017). We employed the clean-ps code of Lehto (1993),4 which is based on the algorithms of Roberts et al. (1987) and implementation of Clark (1980), in producing the overall power spectrum shown in the middle panel of Fig. 2, now dominated by the ∼0.7 d feature. This is shown at much higher resolution in the lower panel, now revealing both the superhump and orbital periods. We also divided these power spectra into four main time intervals of the outburst to show how these peaks evolved.

Periodograms of the AAVSO 2018 V-band light curve of J1820: (upper) the Lomb–Scargle power spectrum, with dominant peaks at 1 cycle d−1 and its harmonics, due to the data sampling window; (middle) power spectrum using CLEAN, with the strongest peak (arrowed) indicating the orbital (|$P_{\rm orb}^{-1}$| = 1.4588 d−1)/superhump (|$P_{\rm sh}^{-1}$| = 1.42241 d−1) frequencies; (lower) zoom into the CLEANed power spectrum strongest peak, the different coloured curves correspond to different time intervals as the outburst evolves (see inset box). Note that for the first 86 d of the outburst, there is no significant power seen at all (the cyan curve very close to zero). From day 87 onwards, substantial power is detected at Psh (green) and then close to Porb (black), with the green- and red-dashed vertical lines indicating the relevant frequencies.
We were not surprised to detect the Psh signal at a frequency of 1.422 d−1 (=0.703 d, the green-dashed line), as our AAVSO data set incorporates the Center for Backyard Astrophysics (CBA; Patterson et al. 2013) data of Patterson et al. (2018) where it was first reported. That Porb is now well-defined spectroscopically means that this confirms the superhump signal as being a positive superhump, i.e. at a slightly longer period than Porb.
However, the Porb signal has not been reported photometrically before. As indicated in Fig. 2, a peak is found close to a frequency of 1.4588 d−1 (=0.6855 d, the red-dashed line). This corresponds to the spectroscopically determined value of Porb in Torres et al. (2019), although their precision in determining Porb of ±10−5 d, is much better than our ∼0.001 d, due to their longer baseline. This work also provides us with a precise ephemeris for our subsequent examination of the orbital phase-folded light curves.
Patterson (2019) had already noted that they could see no periodic signals in their CBA data during the first ∼75 d of J1820’s outburst, as demonstrated in Fig. 2 by the lowest curve, which covers days 10–86. It is clear that the power spectrum changes dramatically as a function of time through the outburst.
3.1.1 Dynamical power spectrum analysis
Accordingly, we performed a DPS analysis on the well-sampled AAVSO data set, extending from days 12 to 239, with the results shown in Fig. 3, which is centered around the frequency of ∼1.5 d−1. The DPS plot was produced using ‘sliding windows’ that are 10 d data sets (hence each window covers almost 14 binary cycles) which move by 1 d in the time domain to produce adequate resolution, and also provide a degree of smoothing of the resulting power spectra. Power is plotted here at the centre time for each 10 d window. The horizontal white-dotted line marks the exact value of the spectroscopically determined orbital frequency (1.45881 d−1), from the motion of the donor as measured in quiescence (Torres et al. 2019).

The AAVSO light curve (top panel) and dynamical power spectrum (DPS, see text), centred near the superhump and orbital frequencies, where the latter is marked by the dotted horizontal white line at 1.45879 d−1. Orbital power peaks at time ∼ day 112 (MJD-58188), but just prior to this, the power is seen to be dominated at the lower (superhump) frequency (1.42241 d−1, the green-dotted line). The vertical white-dashed line marked at day 118 corresponds to the X-ray state transition time, which is reflected in the MAXI and NICER HR plots in Fig. 1.
The superhump frequency of 1.422 d−1 (0.703 d) can be discerned in the DPS (Fig. 3) as the enhancement of power, just below the dashed orbital frequency line, beginning at day 87, ∼15 d before the orbital power peaks. It is this interval that was first reported by Patterson et al. (2018) and shown in more detail in Patterson (2019), whose fig. 2 covers days 92–122 (which have the largest amplitude variability, and from which they derived a 0.69045 d period).
3.1.2 The orbital and superhump light curves
The power spectra (Fig. 2) show that there is no periodicity present until day 87, when the superhump modulation appears and dominates the light curve during the 15 d interval from days 87 to 102 (Fig. 2, bottom panel, green curve). After day 102, the modulation has moved towards the orbital period (as can be seen in Fig. 3), where it remains strong, even after the state transition (118 d). In fact, it is detectable throughout the subsequent soft state, up to the transition back to the hard state, around day 210, albeit with gradually decreasing amplitude. This is clear from Fig. 2, bottom panel, in the red and violet curves, and where these key day numbers were used in selecting the intervals of interest.
To investigate the evolution and variation in these periodicities at different epochs, we have folded the AAVSO data on both Porb and Psh, as shown in Fig. 4. The top panel is the superhump light curve for days 87–102, showing the enormous (≥0.6 mag) amplitude present through this interval. The second panel is a phase-fold on Porb for days 103–142, the interval from Fig. 3 where the strongest power close to Porb occurs, and days 160–180, when it has diminished but is still present. However, the key feature to note here is not just reduced modulation amplitude, but the movement in phase of the light-curve peak, from phase ∼0.9 to ∼0.2. This will be investigated further in the next section. We note also that Patterson (2019) reported a weak 0.6883 d modulation in their final 2 months of CBA data.

Phase-folded AAVSO light curves on (top panel) superhump (Psh = 0.703 d) and (middle panel) orbital (Porb = 0.68549 d) periods, during the intervals where they dominate. The 50-bin means (and errors) are shown as the solid black points. The bottom panel is the normalised NICER 2–12 keV flux also phase-folded on Porb for days 103–142 where the optical modulation is at a maximum, showing that there is no X-ray equivalent. Note that T0 for the orbital phase is taken from Torres et al. (2019), i.e. it is the spectroscopic ephemeris with phase 0 at inferior conjunction.
It has been noted in most observational papers on J1820 that there was no orbital period signal present in the first 87 d of outburst. However, given that fast (∼minutes) X-ray dips were seen by XMM (Kajava et al. 2019), this suggested that the light curve might contain partial eclipses, dipping or other obscuration that would be highly non-sinusoidal and hence have been overlooked in previous studies. Accordingly, we folded the first 87 d of AAVSO and NICER data on Porb, obtaining the light curves shown in Fig. 5. There are no phase-dependent features evident in the X-ray light curve, but the optical shows a possible weak (≤0.2 mag) partial eclipse at phase 0, although it must be noted that there is no signal in either the LS or phase-dispersion minimization periodogram analysis.

The AAVSO and NICER data for the first 87 d of outburst folded on Porb using 100 phase bins per cycle. There is no feature present in X-rays, but a possible weak partial eclipse is seen in the optical, although no signal is present in either Lomb–Scargle or phase-dispersion minimization analysis.
3.1.3 Dynamical optical light curve
With such high-quality data, in which at certain times individual cycles of the superhump/orbital modulation were clearly visible, and given the phase shifts revealed in the previous section, we decided to perform a dynamic fold of the light curve itself. This is shown in Fig. 6, and uses the same 10 d-sliding window technique, with 1 d steps, as described earlier, in which the data within that window are phase-binned on Porb and the resulting light curve plotted as a grey scale. This covers the interval of days 82–162 in order to show how the modulation shifts with time, since Fig. 3 has already indicated that a longer (than Porb) period is required during the first part of this interval, and a close to orbital modulation itself is dominant from days 102 to 142.
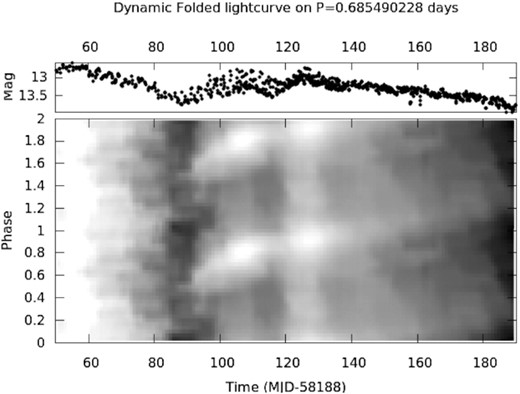
Dynamic fold of the AAVSO V-band data on the spectroscopically determined Porb (Torres et al. 2019) during the time interval of days 50–190. This makes it clear how little (orbital) modulation is present early in the outburst, but how dramatically the modulation begins at day 87, and then continues for the rest of the data set. The grey scale magnitude range is from 12.7 (white) to 13.8 (black). See text for full details.
Accordingly, a significant drift in phase of ∼0.3 is evident for the first ∼20 d of Fig. 6, which was also noted by Patterson (2019). This is exactly the movement in (orbital) phase that would be expected for the Psh = 0.703 d that is present at this time in our power spectra (Fig. 2). It should then be noted in Fig. 6 that, after ∼day 103, the drift in the light-curve peak slows down, moving only by ∼0.25 in phase over the next 50 d. This movement is shown even more clearly in the phase-folded light curves (Fig. 4), which compares the orbital modulation for days 103–142 with 160–180. This is the reason that the power spectra peaks for post-day 103 in Fig. 2 are not exactly at Porb, but instead at a very slightly longer period that we denote |$P_{\rm W} = 0.68823\, d$| (frequency of 1.45301 d−1), which is also marked on that figure. These photometric periods detected are summarized in Table 1.
Optical photometric periods in J1820 (from Fig. 2).
| Day Nos.b | Freq. (d−1) | P (d)a | Notes |
|---|---|---|---|
| 87–102 | 1.42241 | 0.70303(1) | Psh |
| 103–112 | 1.44797 | 0.69062(5) | – |
| 113–160 | 1.45301 | 0.68823(2) | PW |
| 113–253 | 1.45301 | 0.68823(5) | PW |
| Day Nos.b | Freq. (d−1) | P (d)a | Notes |
|---|---|---|---|
| 87–102 | 1.42241 | 0.70303(1) | Psh |
| 103–112 | 1.44797 | 0.69062(5) | – |
| 113–160 | 1.45301 | 0.68823(2) | PW |
| 113–253 | 1.45301 | 0.68823(5) | PW |
3.1.4 The precession period
With such an extensive data set we had hoped to search for evidence of Pprec itself, something that is rarely possible. The detection of a positive superhump in J1820 indicates that, in the commonly accepted model for superhumps (see Introduction, the disc is then precessing on the beat between Porb and Psh, i.e. 27.548 d (or frequency of 0.0363 d−1). This is comparable to the predicted value of ∼28 d in Torres et al. (2019). Such a low-frequency feature requires zooming-in to this part of Fig. 2 (middle panel) and this is shown in Fig. 7. While there is clearly substantial low-frequency power present, there is no stable signal present close to 0.0363 d−1 in either half of our data set. Nevertheless, the variability at these low frequencies (∼20–30 d) is directly visible in the overview AAVSO light curve shown in the top panel of Fig. 6. It should also be noted that the drift in the orbital-folded light curve discussed in the previous section (Fig. 6), which results in the photometric PW, can be interpreted as a changed Psh. This would then have a much longer (∼175 d) beat period with Porb.

Zoom-in to the low-frequency end of Fig. 2, covering the beat-period variations that might be expected between Porb and Psh.
3.2 Optical/X-ray evolution through the outburst
We now attempt to locate these large periodic variations exhibited by J1820 within the context of the overall optical/X-ray light curve of Fig. 1. A key feature is the X-ray state change (from hard to soft) that occurs between days 110 and 120 (already noted by Stiele & Kong 2020 for its unusual rapidity) and is clearly visible in the Swift-XRT, MAXI, and NICER light curves, as well as their hardness ratios. Not surprisingly, the quality and extent of the X-ray coverage through the transition has meant that the X-ray spectral and timing properties of these data have already undergone substantial analysis and interpretation, see e.g. Kara et al. (2019), Buisson et al. (2019), Paice et al. (2019), Stiele & Kong (2020), Wang et al. (2020), Paice et al. (2021), Axelsson & Veledina (2021), and De Marco et al. (2021). Our aim here is to build on these X-ray studies placing them in the context of our optical timing analysis.
The state transition provides a natural division of the light curve into intervals when its optical/X-ray behaviour has very different properties. We demonstrate this by plotting the AAVSO V-band flux against the MAXI 2-20 keV and Swift/BAT 15–150 keV X-ray fluxes in Fig. 8, where we use different colours to correspond to these key intervals.

The optical versus MAXI (circles) and Swift/BAT (stars) X-ray fluxes for the different time intervals of the J1820 outburst, using the same colour scheme as in Fig. 2 lower box, i.e. we use four different colours for four different time intervals – pale green covers the hard state, magenta points for the soft state, and the dark green and red points are when the largest optical periodic modulations were occurring (see text).
From Fig. 1, it is clear that the AAVSO and MAXI light curves follow the same basic shapes, on both sides of the state change, and this overall correlation is clear in Fig. 8. We have included the Swift/BAT data in this figure (star symbols) to demonstrate that the optical follows the hard X-ray flux even more closely. This is largely as expected in an LMXB, where the optical flux is driven by an X-ray irradiated disc (van Paradijs & McClintock 1994). However, the two states have different slopes in this correlation, with the soft state (magenta) being much flatter than the hard state data. Note that the hard state, which lasts until the transition begins around day 112, is divided into three intervals, using the same colour scheme as in our power spectral analysis (Fig. 2 lower box). This is in order to carefully examine any X-ray variability that might be associated with the intervals (days 87–102 and 103–142) when the largest optical modulations are present.
Even though the optical flux from luminous LMXBs has been clearly demonstrated to arise from X-ray irradiation of the disc and inner face of the donor, it is clear that the large modulations present during days 87–102 (dark green symbols) are not driven by X-ray variations. We demonstrate the absence of any X-ray modulation on Porb in Fig. 4 (bottom panel) where the higher time-resolution NICER data is phase folded.
It is also interesting to note that the slight increase in the optical at very low X-ray fluxes, relative to the general trend, is actually the ‘bump’ in the AAVSO light curve around day 210, and has no equivalent in the MAXI light curve.
3.2.1 X-ray state transition
An important feature of Fig. 1 is that the optical flux stops its gradual decline from outburst and increases again, starting at day 87, which is exactly when the Psh power starts to appear (Fig. 3), and just before the Swift/BAT begins its rise to its secondary maximum. Yet J1820 remains in the hard state for almost another month, the interval during which the periodic optical modulations are strongest. The amplitude of these modulations drops significantly at the end of this interval, which is when the X-ray state transition occurs and there is a sudden rise in X-ray brightness detected by MAXI, Swift, and NICER. This close correlation indicates that the optical and X-ray behaviour must be physically linked.
After the transition, J1820 remains in the soft state for ∼80 d, until ∼day 212, when it changes back to the hard state. These are the magenta points in Fig. 8.
The X-ray spectral changes that take place during the outbursts of BHXBs are usually examined via the hardness–intensity diagram (HID), and these have been presented in many of the papers referred to earlier in this section. However, given the close relationship of the Swift/BAT and optical light curves, we have created our own HID (Fig. 9), using the NICER total counts for the intensity and the Swift/BAT 15–150 keV/NICER 2-12 keV ratio as the ‘hard colour’. This plot covers the entire hard and soft states (220 d) of the outburst, and we use essentially the same colour scheme as in earlier figures, so as to facilitate cross-referencing.

HID for J1820 using BAT(15-150keV)/NICER(2-12keV) to define the hard colour, and covering the first 200 d after outburst (marked as ‘*’), and colour-coded as: days 0–87 (pale green), 87–118 (cyan), 118–204 (magenta). The crosses mark (blue, day 87) the start of large optical modulations, (green, day 114) the BAT peak, and (red, day 118) the radio flare/jet ejection. The state transition occurs between days 115–120. The interval of large optical modulation is plotted in cyan, and blown up (inset) to show more detail, with the direction of time marked by the arrows.
There are three key times leading up to the state transition around day 120, and these are marked on our HID as crosses, and on Fig. 1 as dashed lines:
Blue cross – day 87: the start of the large optical modulation
Green cross – day 114: the peak of the Swift/BAT secondary maximum
Red cross – day 118: the radio flare/jet ejection (Bright et al. 2020; Homan et al. 2020)
Our HID shows that there are rapid and complex changes occurring during this ∼30 d interval, so the inset in Fig. 9 shows a zoom-in, where the arrows indicate the direction of time. It is particularly interesting that rapid X-ray spectral changes begin on day 87 (just as the optical modulation appears, at the blue cross), as the source enters a loop (marked in cyan for clarity), becoming first harder and then softer as it brightens towards the BAT peak (at the green cross). It then continues to soften as it moves rapidly (within a few days) to the time of the AMI radio flare and superluminal jet ejection episode at the red cross (Bright et al. 2020), which essentially marks the state transition. The optical modulation continues into the soft state (as can be seen in the DPS, Fig. 3), remaining strong for another month, and while its amplitude gradually fades after that, it is still at almost 0.2 mag (peak-to-peak) in the days 160–180 light curve of Fig. 4. This remarkable correlation between the optical and X-ray behaviour must have a physical connection that we will explore in the next section.
4 DISCUSSION
Our analysis of the extensive AAVSO optical and Swift/NICER light curves of J1820’s 2018 outburst shows three main phases with the following properties:
Days 0–86: classic BHXB X-ray/optical outburst light curve in the hard state, decaying and variable, but with no (substantial) periodic modulation. Note also the change in NICER flux slope at ∼day 60 in Fig. 1.
Days 87–112: optical decline is reversed and a gradual increase in brightness occurs, along with the sudden appearance of a huge optical modulation and a secondary maximum in Swift/BAT. The modulation is first on Psh, then drifts to be very close to Porb, but measurably different at PW = 0.68823 d, and with an amplitude at times ≥0.5 mag.
Days 112–253: begins with an X-ray state change from hard to soft. Optical modulation continues at PW, but with a slowly decaying amplitude.
Of these remarkable properties, the principal one is the large amplitude (mean ∼0.6 mag) modulation on Psh (Fig. 4 top panel), which has never been seen before in the BH X-ray transient (BH XRTs), and appears at the same time as the Swift/BAT light curve starts to increase. Indeed, Patterson (2019) already named J1820 as the ‘king of the black hole superhumps’, which is an apt title when it is compared (Table 2) with other LMXB BH XRTs observed during outburst, as their superhump modulation amplitude, A, is always ≤0.2 mag. Furthermore, our analysis of this modulation during the soft state, when it is occurring at PW, has shown that the peak in the folded light curve (see Fig. 6) moves gradually during the next 80 d from orbital phase ∼0.85, which is close to inferior conjunction of the mass-losing companion (with an orientation similar to that visualized in Fig. 10) to phase ∼0.2. This means that the optical modulation cannot arise on the X-ray irradiated face of the donor, and must instead somehow be a feature of the disc itself.

Visualization of the J1820 system at orbital phase 0.85, using BinSim4 and the binary parameters given in the text. 4http://www.phys.lsu.edu/~rih/binsim/download.html.
Black-hole X-ray transients displaying superhumps during outburst.
| System name | Psh (d) | Porb (d) | ϵ (per cent) | A (mag) | i (deg) |
|---|---|---|---|---|---|
| XTE J1118 + 480a | 0.169930 | 0.170529 | 0.35 | 0.1 | 71–82 |
| GRO J0422 + 32 a | 0.2157 | 0.21216 | 1.67 | 0.1 | 10–50 |
| GS 2000 + 25a | 0.3474 | 0.344098 | 0.96 | 0.2 | 54–60 |
| GRS 1124-683a | 0.4376 | 0.4333 | 0.99 | 0.2 | 39–65 |
| MAXI J1820 + 070b | 0.70303 | 0.68549 | 2.6 | 0.36 | 66–81 |
| Swift J1753.5-0127c | 0.1351 | ? | ? | 0.15 | ? |
| GRS 1716-249d | 0.6127 | ? | ? | 0.1 | ? |
To understand this property, we first need to examine the background to superhumps in CVs, how this has been applied to LMXBs, and how this is, or is not, relevant to J1820.
4.1 Superhumps and precessing accretion discs
The mass donors in SU UMa systems have very low masses (≤0.3M⊙), and hence correspondingly low mass ratios, with q = M2/MWD ≲ 0.25, and it is this feature that is a key part of what has been the common superhump explanation. It is also why they are often considered to be an excellent analogue of the BH XRTs, amongst other LMXBs. Superoutbursts in SU UMa systems always follow a normal outburst, and this was explained by Whitehurst & King (1991) as the hot accretion disc expanding towards its tidal radius, becoming eccentric and beginning to slowly precess as it reaches the 3:1 resonance. They show that this is only possible if q ≲ 0.3. During closest approaches to the donor, tidal stresses increase, leading to greater heating of the disc and it becomes brighter, which we see as superhumps, on a period that is the beat between the precession and orbital periods.
It is this extreme q value that completes the analogy with BH XRTs. Torres et al. (2020) have already accurately measured q spectroscopically for J1820, and it is 0.072 (±0.012). However, the crucial difference is that, in CVs, the dominant optical light source is the thermal, viscous energy release within the disc itself, whereas in LMXBs it is the intense X-ray irradiation from within the inner disc illuminating the outer disc that provides the principal energy source, typically exceeding the disc’s intrinsic energy by a factor ∼103. Consequently, superhumps were not expected to be seen in BH-XRTs, and yet O’Donoghue & Charles (1996)’s careful reanalysis of the outburst photometry of three XRTs clearly showed that superhumps were present (and more were subsequently discovered, as listed in table 2). This paradox seemed to be resolved by Haswell et al. (2001) who showed that, in precessing disc simulations, the disc area also varied, and this variation would therefore be reflected through the X-ray irradiation in the resulting optical light curve.
4.2 Application to MAXI J1820 + 070
4.2.1 Basic parameters
Our observations show that, for J1820, ϵ = 0.026, which would imply a mass ratio of q = 0.12 (from equation 1). Interestingly, this is exactly the same as that first estimated by Torres et al. (2019), but still consistent, within the uncertainties of ϵ, with the more accurate value of Torres et al. (2020).
4.2.2 Location and extent of the optical modulation
At first sight, the optical modulations observed during the outburst of J1820 seem to follow the description and predictions of O’Donoghue & Charles (1996) and Haswell et al. (2001). The former note that superhumps are most likely detectable two months or more after the outburst beginning and their appearance seems to be associated with a ‘glitch’ in the (hard) X-ray light curve, which is exactly what is happening with J1820. They also point out that, contrary to CV superoutbursts, in XRTs one observes during outbursts both the superhump and orbital modulations in the system’s optical emission, as appears at first sight to be the case for J1820.
Haswell et al. (2001) note that the superhump tidal-resonance model cannot apply as such to the BH XRTs, since the supposedly tidally enhanced viscous dissipation is negligible compared to the contribution by X-ray irradiation, the ratio of the two corresponding luminosities being as low as ∼10−4. They suggest therefore that the observed superhump modulation results from the varying disc surface area generated by the tidal resonance between the disc and the secondary, as described at the beginning of this section. This would change the area visible to the observer, thereby causing modulations in the optical flux. This type of optical modulation would dominate in the outbursts of low-inclination binaries, while in the high-inclination systems a modulation at the orbital period, resulting from X-ray irradiation of the secondary, would be more pronounced.
At least two properties of the J1820 outburst are, however, incompatible with the above-described picture. First, the superhump amplitude reaches 0.5 mag or greater, while the Haswell et al. (2001) model provides for 0.1 mag at most, since in the simulations on which it is based, the disc surface area changes by no more than about 10 per cent.5 Secondly, the optical modulation, because of its phasing cannot be attributed to the irradiated face of the secondary. Such detailed examination of the phasing of the optical light in the other SXTs in Table 2 has not been possible, and an alternative explanation may therefore be needed for all of them.
Another key fact provided by J1820 is that its high orbital inclination, combined with lack of any X-ray modulation on this period, does require that we seek an explanation associated with the properties of the disc. Furthermore, we have the unique result here that the modulation only begins at a particular time during the X-ray spectral evolution of the source. Given the significance of J1820’s inclination in this discussion, we will first revisit the current observational constraints on i. These are collected together in Table 3.
The absence of X-ray eclipses provides a strong constraint of i < 77°. But the initial indication of a value close to 70° came from Torres et al. (2019) who interpreted their Hα equivalent width (Hα EW) light curve, peaking near orbital phase 0.9, as an indication of a grazing eclipse. Suggestions that it might be lower came from Atri et al. (2020), whose radio ejecta defined the jet axis of the rotating BH to be i = 63° ± 3°, and assuming that the jet axis is perpendicular to the plane of the accretion disc. Similarly, lower values are supported by the X-ray dips (Homan et al. 2018; Kajava et al. 2019) and the possible optical partial eclipse seen in Fig. 5. We also suggest that the H α behaviour seen by Torres et al. (2019) is actually due to the stream-impact hotspot, as might be expected during the first quiescence interval of J1820, as a consequence of ongoing mass transfer immediately before a subsequent new outburst. Accordingly, we adopt a value of i = 63° for the remainder of this discussion, as visualized in Fig. 10.
4.2.3 A precessing, warped disc
The solution to the superhump amplitude difficulty can also be found in Haswell et al. (2001) who invoke the possibility of the disc in XRTs being warped under radiation-induced torques (Pringle 1996; Wijers & Pringle 1999; Ogilvie & Dubus 2001). Indeed, as seen from Fig. 11, with rb/106 ∼ 0.5 (rb being the orbital separation) and q = 0.06, J1820 is close to being unstable to the mode 1 (prograde) warping induced by radiative torques (and that assumes α = 0.3 and ϵ = 0.1, see below).

Ogilvie & Dubus (2001) computed the stability of X-ray binaries to irradiation-driven warping and this is their fig. 7, on which we have added J1820 as a red cross. This plots the size of the binary, rb, in units of GM1/c2, against q, and shows the unstable and stable regions, with HMXBs in the upper right, and LMXBs in the lower left. J1820 is almost exactly on the stability curve for mode 1 warping (see text for details). The source directly above it is V404 Cyg.
Since the large superhump amplitude cannot be produced by the disc’s tidal deformation, but might be easily accounted for by its warped surface (in providing a much larger area for X-ray irradiation), the precession period should be identified with the warp precessional movement, i.e. with nodal precession. Unfortunately, the theory of radiatively warped discs is not developed enough to produce reliable estimates of the nodal precession period resulting from this mechanism. One should also keep in mind that the mechanism’s stability criterion, i.e. its critical radius, strongly depends on the viscosity parameter (rcrit ∼ α−4) and accretion radiative efficiency (rcrit ∼ ϵ−2). While the viscosity parameter in an irradiated disc is supposed to be >0.1 (Tetarenko et al. 2018) and is not expected to vary, the radiative efficiency clearly does vary with the X-ray spectral state of the system, so changes in the warp structure during outburst should be expected (see below).
Interestingly, the Psh observed in J1820 corresponds very well to the prediction of the 3:1 tidal model for a free-particle disc. The significance of this fact is unclear, especially given that superhumps in most SU UMa stars do not satisfy this relation (Pearson 2006; Smith et al. 2007; Smak 2020).
Even if the stream impact cannot provide the luminosity required to explain the observed optical modulated flux, the stream must play a role in its appearance. As explained in Ogilvie & Dubus (2001), the character of the radiative-warping instability depends strongly on the radius at which matter is added to the disc. Even in the case of a planar disc, a substantial fraction of the mass-transfer stream can over (under) flow its surface, adding mass at the circularisation radius Rcirc (e.g. Armitage & Livio 1998), but in the case of a warp most of the stream can end up at this radius, depending on the phase of the precession. When mass is added to the external disc edge, the prograde mode 1 is becoming unstable, as should be the case for J1820. In addition, the critical radius at which mode 1 is unstable is smaller than when mass is added at the circularization radius. The calculations of Ogilvie & Dubus (2001) do not take into account the fact that the mass added at the outer-disc radius has lower angular momentum than the disc at this radius. These authors note that this produces an extra torque that might affect the stability properties. They speculated that a disc could be unstable to radiation-driven warping when mass is added at the outer disc radius, but stable when it is added at the circularization radius, so that such a system would display warping cycles: an initially flat disc with mass input at its outer edge becomes unstable and tilts; mass input then moves towards the circularization radius where the disc then becomes stable to warping and resumes its initially flat shape. They do not consider modulations of the mass-transfer rates that could produce a similar effect if the amount of matter overflowing the disc depends on the rate at which it is provided. We stress that all these ‘scenarios’ are very uncertain because of the absence of accurate calculations of the radiation-driven warping taking into account all the relevant torques and mass input to the disc. Nevertheless, it seems that J1820 during outburst is a system where at least some of the processes conjectured by Ogilvie & Dubus (2001) are occurring.
We can then suggest the following scenario based on the assumption that according to the Ogilvie & Dubus (2001) criterion, J1820 during its outburst becomes unstable to radiative warping, and taking into account our observation that a Psh to PW variation is always present in some form after day 87.
The superhump appearing at day 87 is due to nodal precession at a beat period between the orbital and superhump periods. At day 87, the optical decline is reversed in parallel with the hard (Swift/BAT) X-rays. This would correspond to the growth of the radiative-warping triggered by the growth of the irradiating flux and probably due to increased accretion efficiency. The warp allows the surface of the secondary near the L1 point to ‘see’ the X-rays directly, which leads to an enhanced mass-transfer rate (Viallet & Hameury 2008). The impact of the enhanced matter stream causes a deformation of the warp, thereby producing after day 103 a modulation at PW, that is closer to the orbital period. At day 114, the rapid drop in hard X-rays damps the effect of irradiation on the disc and the secondary, but enough flux is left to continue to drive the warp. It is possible that the varying stream impact-radius modifies the warp structure.
Why does this happen at day 87? We note that, at day 60, the NICER light curve (and hardness ratio) changes slope in a way typical to the cooling front beginning to propagate through the disc, and which usually signals the beginning of the end of an outburst. In this case, the cooling front clearly fails to complete its job, and instead gets reflected back as a heating front, which happens when the inner disc radius is truncated and fixed (see e.g. Dubus, Hameury & Lasota 2001). It seems that, by day 118, the inner disc radius reaches the ISCO, while the reflected front arrives at the outer disc edge. The reflected-front propagation could therefore lead to disc expansion between days 87–118 (Hameury & Lasota 2020).
4.2.4 Irradiation
From day 0 to day 87, the outburst is hard (for a ‘soft’ XRT), which means that, during the decay from maximum, a substantial ‘corona’ is maintained. It is most probably an advection-dominated accretion flow (ADAF; e.g. Esin, McClintock & Narayan 1997), i.e. the inner disc edge is (much) larger than the ISCO (innermost stable circular orbit, see Dubus et al. 2001). It is this ADAF that irradiates directly the outer disc regions with hard X-rays. The outer disc at some point becomes tilted and warped (see above), and if the irradiation is quasi-isotropic this would lead to a strong modulation at the precession period if the hard X-ray-emitting region is high enough above the disc. This could happen if the steady jet (which has been present throughout the hard state, as evidenced by the radio flux in Fig. 1) were a significant contributor to the X-ray flux as well, but this is still unclear (see e.g. Shaw et al. 2021).
The level of tilting required can be crudely estimated if we simply take the far half of the disc (as observed at ∼phase 0.9) and tilt it towards us. Requiring that this gives an optical increase of 0.5 mag can be achieved with a tilt of 23°, relative to the measured binary inclination of ∼63°. We note that this ought to bring the disc close to producing dips in the X-ray flux at appropriate phases, and some have been seen (e.g. Kajava et al. 2019), but this should be calculated with more realistic and detailed geometry (as in, e.g. Ogilvie & Dubus 2001).
Maintaining the ADAF even near maximum is untypical, as one expects (at least from the model) the inner disc to then be at the ISCO. However. if a strong magnetic field is accumulating in the inner disc region, this could prevent it from moving in towards the BH. There is strong evidence that the inner disc radius is moving in slowly, which comes from the detailed analysis of X-ray QPOs throughout the outburst by Stiele & Kong (2020). They see the QPOs remaining at very low frequencies, between 0.1 and 0.5 Hz, throughout most of the hard state, but they move rapidly to 4 Hz at day 117, having doubled in frequency in just 1 d – the truncated inner disc has moved in rapidly.
Therefore, during decay from maximum, the ADAF cools down and the field accumulates at the BH, creating what is called a magnetically arrested disc (Tchekhovskoy, Narayan & McKinney 2011), i.e. a configuration favouring launching jets by the Blandford–Znajek mechanism (Blandford & Znajek 1977). At day 87, an outflow is created (a ‘pre-jet-ejection’) forming a new source of hard X-rays, now high enough above the disc to irradiate the outer disc. Such a source is referred to by De Marco et al. (2021) as shocks within a ballistic jet, further above the disc. We note that Buisson et al. (2019)’s fitting of the NuSTAR spectra taken on day 110 give a much greater height [>100 Rg for the upper corona (lamp post) compared to earlier spectra, and this could be related to the jet component, as also noted in the jet outflow of the Insight/HXMT spectral fits by You et al. 2021]. This outflow radiates anisotropically, which, combined with the disc warp, can now produce the observed modulation at the ‘superhump’ period. This is whatchangesatday 87:thegeometryofdisc irradiation.Between days 114 and 117, the outflow becomes an ejection (seen by Bright et al. 2020) that leaves the vicinity of the BH, leading to the ‘collapse’ of the magnetic field, which allows the inner disc to reach the ISCO, and the transition to the soft state occurs from ∼day 118.
The 87 d time-scale is also interesting given that it is comparable to the ‘secondary maximum’ that has been seen in many LMXB XRTs (Chen, Livio & Gehrels 1993). We believe that it is likely to be linked to these same processes involving both the inner and outer regions of the disc.
5 CONCLUSIONS
The spectacularly extensive and detailed AAVSO observations of J1820 provide the most complete optical outburst light curve of any BH XRT to date. Combined with contemporaneous X-ray monitoring they offer a superb probe of the evolving geometry of both the inner and outer accretion disc regions. Our key results and conclusions are as follows:
These data show that the appearance of a large optical modulation on Psh at day 87 is linked to the beginning of changes in the X-ray spectral properties of J1820.
The large amplitude of this modulation (≥0.6 mag) is too large to be explained via an area-variation effect in an eccentric, precessing disc. This also calls into question this explanation for superhumps that have been seen in other LMXB XRTs.
This modulation |$\it cannot$| be due to an X-ray variation, as no X-ray modulation is present on any of the observed optical periodicities.
The period of this optical modulation drifts on a time-scale of ∼14 d to ∼PW, very close to Porb, and the variations in the light curves show clearly that it cannot be explained as X-ray heating of the inner face of the donor.
Instead, we interpret this effect as irradiation-driven warping of the outer disc, thereby creating sufficient disc area, tilted towards the observer to explain the modulation.
This also requires a raised, hard X-ray-emitting source that we associate with the outflow and base of the jet as it approaches the end of the hard state.
Much of our interpretation is speculative because detailed modelling of such behaviour is missing, largely because data of the quality and extent obtained for the J1820 outburst has simply not been available hitherto. Accordingly, we hope that investigations into the structure and evolution of radiatively warped discs in X-ray binaries are worth a renewed effort.
Future such campaigns should focus in particular on the 2–3 weeks around an X-ray state transition. Whilst straightforward for ground-based monitoring facilities such as those offered by AAVSO and CBA, it can be difficult to anticipate such state changes so as to arrange for suitable X-ray coverage. This will be particularly suited for future wide-field X-ray missions.
ACKNOWLEDGEMENTS
We thank the anonymous referee whose comments and queries have led to significant improvements in the clarity and presentation of our results. We acknowledge with thanks the variable star observations from the AAVSO International Data base contributed by dedicated observers worldwide and used in this research. This work has also used data supplied by the UK Swift Science Data Centre at the University of Leicester. The SALT observations were obtained under the SALT Large Science Programme on transients (2018-2-LSP-001; PI: DAHB), which is also supported by Poland under grant no. MNiSW DIR/WK/2016/07. DAHB and SBP acknowledge research support from the National Research Foundation. JPL was supported in part by a grant from the French Space Agency CNES, and would like to thank Joe Smak for inspiring discussions on superhump behaviour. JAP acknowledges support from STFC and a UGC-UKIERI Thematic Partnership, and is part supported by a University of Southampton Central VC Scholarship.
DATA AVAILABILITY
The AAVSO optical data used throughout this paper are available from https://aavso.org/aavso-international-database-aid, and the radio data from the links in Bright et al. (2020). The X-ray data underlying this article are available from the following archives:
Swift – https://www.swift.ac.uk/archive/
MAXI – http://maxi.riken.jp/star_data/J1820+071/J1820 + 071.html
Footnotes
Gatspy, created by Jake VanderPlas, is a collection of tools for analyzing astronomical time series data in python (VanderPlas & Ivezić 2015).
The clean algorithm performs a non-linear deconvolution in the frequency domain, and it provides a simple way to understand and remove the artifacts introduced by missing data.
Also, in the case of CV superhumps, for probably different reasons, the tidal-resonance model fails to reproduce the observed superhump amplitudes (see Smak 2009).
