


ABSTRACT
We present H α velocity maps for the HIghMass galaxies UGC 7899, UGC 8475, UGC 9037, and UGC 9334, obtained with the SITELLE Imaging Fourier Transform Spectrometer on the Canada–France–Hawaii Telescope, to search for kinematic signatures of late gas accretion to explain their large atomic gas reservoirs. The maps for UGC 7899, UGC 9037, and UGC 9334 are amenable to disc-wide radial flow searches with the DiskFit algorithm, and those for UGC 7899 and UGC 9037 are also amenable to inner-disc kinematic analyses. We find no evidence for outer disc radial flows down to |$\bar{V}_{\mathrm r} \sim 20 \ \mathrm{km\, s}^{-1}$| in UGC 9037 and UGC 9334, but hints of such flows in UGC 7899. Conversely, we find clear signatures of inner (r ≲ 5 kpc) non-circularities in UGC 7899 and UGC 9037 that can be modelled as either bisymmetric (which could be produced by a bar) or radial flows. Comparing these models to the structure implied by photometric disc–bulge–bar decompositions, we favour inner radial flows in UGC 7899 and an inner bar in UGC 9037. With hints of outer disc radial flows and an outer disc warp, UGC 7899 is the best candidate for late accretion among the galaxies examined, but additional modelling is required to disentangle potential degeneracies between these signatures in H i and H α velocity maps. Our search provides only weak constraints on hot-mode accretion models that could explain the unusually high H i content of HIghMass galaxies.
1 INTRODUCTION
Galaxies within haloes are surrounded by large coronas of hot gas and grow as low-metallicity gas from the corona and circumgalactic medium accrete on to them (Fraternali 2017; Ho et al. 2017). Star-forming galaxies at low redshift have the highest rates of star formation at early times when their gas reservoirs are plentiful. The star formation rate (SFR) of a typical galaxy decreases as its stellar mass increases: gas within the galaxy is consumed to form stars. For this reason, gas fraction and stellar mass have a strong negative correlation (Catinella et al. 2010; Huang et al. 2014). This trend is consistent with a cosmic downsizing scenario whereby as time passes, the galaxies that contribute to the bulk of star formation within the Universe get less and less massive (Cowie et al. 1996; Juneau et al. 2005; Fontanot et al. 2009).
The recently completed Arecibo Legacy Fast ALFA (ALFALFA) extragalactic survey detected 34 spiral galaxies that are both massive in atomic hydrogen, H i, (|$M_{\rm H\, \small {I}}$| > 10|$^{\rm {10}} $| M⊙) and that have high gas fractions (|$M_{\rm H\, \small {I}}$|/M*) relative to their stellar masses (Huang et al. 2014; Haynes et al. 2018). Branded HIghMass, H i fractions in the sample range |$0.24 \ \lt \ \rm{M_{\rm H\, \small {I}}/M_{\ast }} \ \lt \ 9.2$|, with a median gas fraction of 1.23 (Huang et al. 2014). The combination of both high |$M_{\rm H\, \small {I}}$| and high |$M_{\rm H\, \small {I}}/M_{\ast }$| distinguishes HIghMass from other gas-rich samples such as the ‘H i Monsters’ (Lee et al. 2014) and ‘H i GHz’ (Catinella & Cortese 2014) samples. The four HIghMass galaxies studied in this paper are UGC 7899, UGC 8475, UGC 9037, and UGC 9334, and their optical Sloan Digital Sky Survey (SDSS) images are shown in Fig. 1.

Two possible explanations for the overabundance of H i in HIghMass galaxies are that they have undergone inefficient star formation over cosmic time, or they have recently accreted external gas to replenish what they depleted to form stars. In other words, they may be ‘star-poor’ and/or ‘gas-rich’, respectively.
Some HIghMass galaxies may be rendered star-poor if they are embedded in dark matter haloes characterized by a high-spin parameter (λ) (Peebles 1971), which implies that the galactic disc is extended and sparse (Mo, Mao & White 1998). Previous studies suggest that the λ of some HIghMass galaxies are higher than average when compared to other local galaxies, but that for others is commensurate with the gas-rich galaxy population (Hallenbeck et al. 2016). In addition, UV, optical broad-band, and H α imaging of HIghMass galaxies (Huang et al. 2014) suggests that the majority have higher current SFRs than the parent ALFALFA sample, which does not support the high-spin hypothesis.
However, the H i morphology and kinematics of HIghMass galaxies provide hints that they may have been inactive in the past. Hallenbeck et al. (2014) found evidence for inflowing H i across the entire disc of UGC 9037, and Hallenbeck et al. (2016) identified a potential H i disc warp at r > 20 kpc in UGC 7899. In addition, a variety of axisymmetric instability indicators in H i and CO (Toomre 1964; Hunter, Elmegreen & Baker 1998; Schaye 2004; Romeo & Wiegert 2011; Romeo & Falstad 2013) suggest moderate to strongly unstable inner discs in both UGC 7899 and UGC 9037, which may also be consistent with a fresh gas reservoir on the verge of forming stars. These results may suggest that both galaxies have accreted material from external reservoirs or acquired it in a merger event(s).
Under the late accretion scenario, HIghMass galaxies maintain their gas richness through the accretion of low-metallicity gas from the corona and circumgalactic medium. This process occurs after galaxy formation and is hence referred to as late accretion, and may explain numerous phenomena not exclusive to the HIghMass sample (Armillotta, Fraternali & Marinacci 2016; Fraternali 2017). Some degree of accretion must be ongoing to maintain star formation in galaxies (Pitts & Tayler 1989; Fraternali & Tomassetti 2012; Saintonge et al. 2013). Unfortunately, in the absence of detecting accretion directly, we only have circumstantial evidence for its occurrence (Sancisi et al. 2008; Fraternali 2017).
Cosmological simulations predict that galaxies build up their gas reservoirs through either hot-mode accretion, where infalling gas shock heats to the halo virial temperature before condensing on to the disc, or cold-mode accretion, in which infalling gas at temperatures lower than virial flows directly into the galaxy (Kereš et al. 2005). Analytical models of outside-in hot-mode accretion presented in Pezzulli & Fraternali (2016) imply that radial flows for a Milky Way-like disc are small over cosmic time (|$\lesssim 1 \ \mathrm{km\, s}^{-1}$|), while cold-mode accretion is most common in low-mass systems (total baryon mass Mgal ≲ 1010.3 M⊙) and dominant at high redshift (z > 3). However, the unusually large gas reservoirs of the HIghMass galaxies combined with hints of disc-wide non-circular flows in H i make them good candidates in which to search for kinematic signatures of cold or hot accreting gas.
As such, searching for non-circular flows in H α, beginning with a disc-wide search for radial flows, is a logical next step in this analysis, since they can have larger amplitudes in H α than in H i (Sellwood & Sánchez 2010), and because H α maps galaxies at higher angular resolution, especially in the inner disc where H ii regions are more abundant.
This paper presents a search for signatures of late gas accretion in four HIghMass galaxies by characterizing non-circular flows in their H α velocity maps. We describe observations of UGC 7899, UGC 8475, UGC 9037, and UGC 9334 with the SITELLE Imaging Fourier Transform Spectrometer (IFTS) at the Canada–France–Hawaii Telescope (CFHT) in Section 2. We search the resulting H α velocity maps for radial and bisymmetric non-circular flows using the DiskFit algorithm (Spekkens & Sellwood 2007; Sellwood & Sánchez 2010; Sellwood & Spekkens 2015) in Section 3, and discuss our results in context of the late accretion hypothesis in Section 4.
2 OBSERVATIONS AND DATA REDUCTION
2.1 Sample selection
We select galaxies from the HIghMass sample defined in Huang et al. (2014) that are suitable for our study. Eligible galaxies with significant H α emission need to have intermediate inclinations (45○ ≤ i ≤ 75○): galaxies with high inclinations are not amenable to searches for non-circular flows, while those with low inclinations will exhibit little Doppler shift across the disc. In addition, the H α emission of the targets must fall entirely within SITELLE’s 647−685 nm SN3 band (Drissen et al. 2019), which is likely if their H i-measured systemic velocities satisfy |$V_\rm{H\,\small{I}} \lesssim 13\,000 \ \mathrm{km\, s}^{-1}$|. From the 10 HIghMass galaxies that fit these criteria (Huang et al. 2014), we were able to observe UGC 7899, UGC 8475, UGC 9037, and UGC 9334.
2.2 SITELLE observations
UGC 7899 and UGC 9037 were observed during photometric conditions in queue observing mode with SITELLE on 2016 March 6, while UGC 8475 and UGC 9334 were observed on 2017 July 3 and 2019 April 5, respectively. SITELLE is an IFTS, which produces spectra for each pixel in its field of view (Drissen et al. 2019). The observations were configured to detect H α with a resolution R ∼ 1500 in the SN3 filter. The corresponding number of Δλ = 0.45 nm moveable mirror steps and reference wavelength for each observation are given in Table 1. The spectra contained the [N ii] 6548 and 6583 Å doublet, in addition to the brighter H α line, which was fit along with H α to extract line-of-sight velocities. Because the N ii doublet is weaker than the H α emission line, the effect on the fits is mild and we do not consider the N ii maps in this analysis (Drissen et al. 2019).
Galaxy and observation parameters. Columns 2, 3, and 4: the angular resolution per pixel, the distance to the galaxy in megaparsecs from the complete ALFALFA catalogue (Haynes et al. 2018), and the resolution at that distance, respectively. Column 5: number of steps of the moveable mirror in the IFTS (and thus, the number of interferometric images taken). Column 6: the exposure time per step. Column 7: reference wavelength, λref, at which R = λref/Δλ = 1500, where Δλ is the step size. Columns 8 and 9: the lunar separation and the lunar illumination fraction, respectively, during observations. Column 10: the velocity-uncertainty threshold value. Pixels below this value are included in the filtered velocity map. Column 11: the flux threshold, above which pixels are included in the velocity map. Only necessary for UGC 8475.
| Galaxy | Φ | d | D | N | texp | λref | |$\bar{\theta }_{\text{sep}}$| | fillum | δVthres | Fthres |
|---|---|---|---|---|---|---|---|---|---|---|
| (arcsec) | (Mpc) | (kpc arcsec−1) | (s) | (nm) | (○) | (|$\mathrm{km\, s}^{-1}$|) | (|$\mathrm{erg\, s^{-1}\, cm^{-2}\, arcsec^{-2}}$|) | |||
| (1) | (2) | (3) | (4) | (5) | (6) | (7) | (8) | (9) | (10) | (11) |
| UGC 7899 | 0.32 | 129 | 0.63 | 264 | 22.0 | 675.9 | 125 | 0.08 | 16 | … |
| UGC 8475 | 0.65 | 102 | 0.49 | 206 | 56.2 | 671.6 | 34 | 0.80 | 15 | 4.8 × 10⁻¹⁷ |
| UGC 9037 | 0.32 | 88 | 0.43 | 259 | 22.0 | 669.5 | 78 | 0.24 | 15 | … |
| UGC 9334 | 0.32 | 110 | 0.53 | 260 | 25.0 | 673.1 | 148 | 0.01 | 15 | … |
Table 1 also contains the Moon’s illumination fraction fillum and its mean angular separation |$\bar{\theta }_{\text{sep}}$| from the target during the observations. Distributed photon noise from the Moon limits the sensitivity of SITELLE (Drissen et al. 2014), making dark sky conditions ideal. While this was the case for the UGC 7899, UGC 9037, and UGC 9334 runs, the Moon phase and position were more problematic for our run on UGC 8475. We compensated for the higher lunar photon noise by increasing the integration time per step on this target. Even so, the resulting data quality is lower for this galaxy (see Section 2.4).
2.3 Data reduction with ORCS
ORCS is a publicly available1 analysis engine for spectral data cubes taken by SITELLE (Martin, Drissen & Joncas 2015). ORCS generates velocity maps from hyperspectral cubes by fitting an emission line profile (sinc or sincgauss, the convolution of a sinc and a Gaussian) to the spectrum of each pixel in a user-generated region of interest (ROI) around the galaxy within SITELLE’s field of view. The fitting algorithm requires an initial guess for the emission line velocity, which should be no more than an FWHM from the emission line profile centroid to return a reliable fit. For a sinc profile, this is equal to FWHM = 1.21Δw, where Δw is the velocity spectrum channel width. Since our targets are massive disc galaxies at intermediate inclinations, their spectral extents vastly exceed the FWHM of our observing set-up. For each target, we therefore scripted ORCS to perform a series of sinc-profile fits using different input velocities across an ROI encompassing the entire galaxy to create a series of partial maps. We use the velocity-uncertainty associated with a given pixel as a proxy for the goodness of fit to each spectrum. Reliable fits have significantly lower velocity uncertainties than unreliable ones, and we therefore construct a velocity field for each target by selecting the pixel values within the ROI with the lowest velocity uncertainty across all partial maps. We show the complete velocity and velocity uncertainty maps of UGC 7899 that result from this approach as an example in Fig. 2.
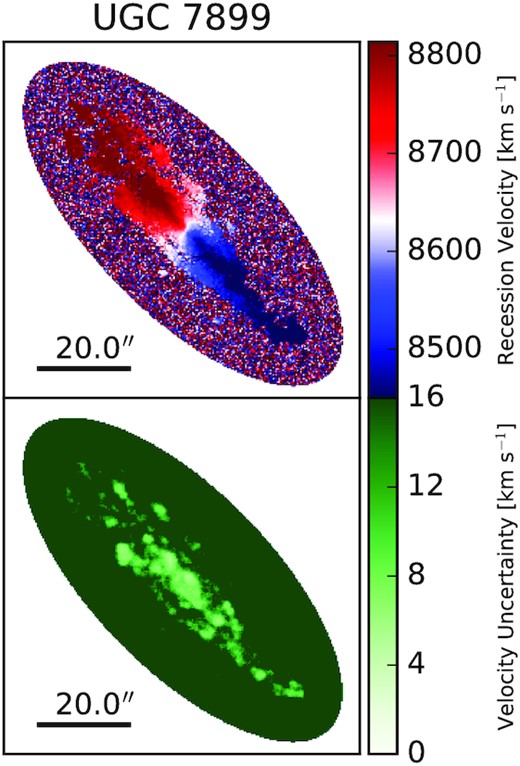
The velocity (top) and velocity-uncertainty (bottom) maps of UGC 7899 output from the ORCS velocity field script described in Section 2.3. The black bar in the lower-left corner shows the angular scale of each panel, and the ellipse containing non-zero data is the ROI for this galaxy. The maximum value of the colour bar corresponds to δVthres for UGC 7899.
2.4 Final velocity maps
Velocity field pixels with the largest uncertainties tend to be those for which ORCS failed to find real emission and instead returned the velocity of a spurious noise peak in the vicinity of an input guess. In the outskirts of the galaxy disc, spurious velocities quickly outnumber reliable ones and destabilize the DiskFit models described in Section 3. To avoid this, we filter out pixels with a velocity uncertainty larger than a given value δVthres from the velocity maps returned by the ORCS script described in Section 2.3. The threshold values, δVthres, are given in Table 1. Changes to δVthres in the range 15–25 |$\mathrm{km\, s}^{-1}$| produce minor changes to the filtered velocity field input to DiskFit, but do not change the characteristics of the models obtained. We note that for the noisier UGC 8475 data, we additionally retained only velocity map pixels at locations where the H α flux exceeded |$F_{\rm thres} = 4.8 \ \times \ 10^{-17} \ \mathrm{erg\, s^{-1}\, cm^{-2}\, arcsec^{-2}}$|. This is suboptimal, as a low-flux pixel can still give an accurate measure of gas velocity so long as the line peak is measured precisely. We did not bin pixels spatially for UGC 7899, UGC 9037, or UGC 9334, but used a bin size of 2 pixels for UGC 8475 to increase SNR at the cost of angular resolution. We experimented extensively with various bin sizes in order to improve the filling factor of our velocity maps, but found that binning pixels for galaxies other than UGC 8475 had no noticeable impact on the kinematic models.
Fig. 3 presents the final velocity and velocity-uncertainty maps for UGC 7899, UGC 8475, UGC 9037, and UGC 9334. Not all galaxy maps are filled out to the same extent. For example, though the observing conditions for UGC 7899 were better than they were for UGC 9037, they were less optimal than the conditions for UGC 9334. In addition, UGC 7899 appears to be more complete relative to UGC 9037 and UGC 9334 because it is at a higher inclination. Despite the differences in data quality, all galaxies show signs of ordered rotation with no obvious signs of distortion, motivating a more quantitative analysis to constrain non-circular flows.
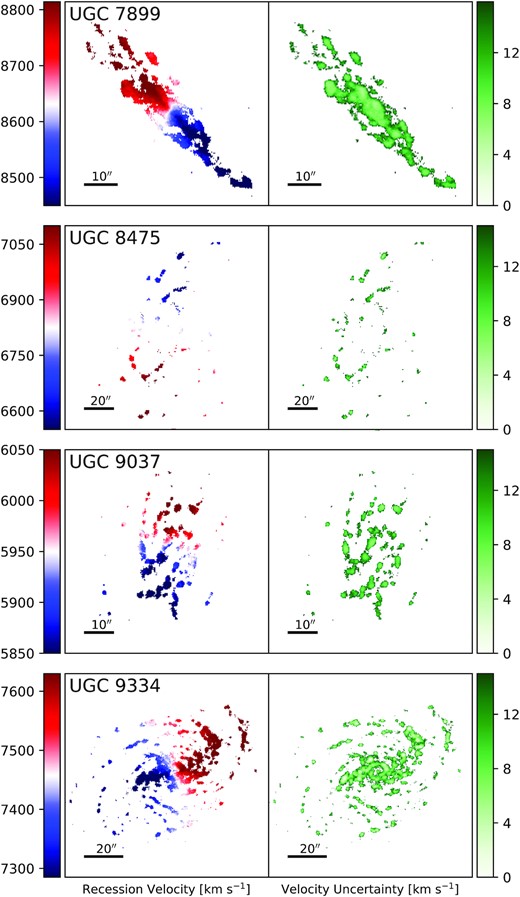
From top to bottom, the final velocity and velocity-uncertainty maps of UGC 7899, UGC 8475, UGC 9037, and UGC 9334. Velocity maps are in the left column and velocity-uncertainty maps are in the right column. The black bar in the lower-left corner of each panel shows the angular scale of the maps.
The patchy nature of the velocity maps suggests that the observations trace spiral arms and the H ii regions within them, as opposed to the diffuse ionized gas (DIG) (e.g. Haffner et al. 2009). This is especially apparent in UGC 8475, UGC 9037, and UGC 9334, where their moderate inclinations allow for a clearer distinction between arm and interarm regions than in higher inclination systems such as UGC 7899. Unfortunately, since our observations probe all ionized gas, we cannot disentangle H ii regions from the DIG, even though the latter has lower signal-to-noise. As described in Section 3 below, the kinematic models that we apply to the velocity maps are sensitive to coherent non-circular flows rather than local ones associated with individual H ii regions or spiral patterns. The velocity maps in Fig. 3 are therefore amenable to searches for radial flows from late accretion.
3 DATA ANALYSIS WITH DISKFIT
In this section, we model the SITELLE velocity maps of HIghMass galaxies presented in Fig. 3 to search for non-circular flows. We describe the kinematic DiskFit models that we adopt in Section 3.1 and the application of those models to the velocity maps in Sections 3.2 and 3.3. We combine our kinematic models of UGC 7899 and UGC 9037 with photometric decompositions to determine our preferred models for each of these galaxies in Section 3.4. DiskFit is a publicly available code2 developed by Spekkens & Sellwood (2007), Sellwood & Sánchez (2010), and Sellwood & Spekkens (2015) for the purpose of modelling asymmetries in the photometry (images) or kinematics (velocity maps) of disc galaxies.
3.1 Kinematic models
The kinematic branch of DiskFit applies physically motivated models to velocity maps of galaxies in order to constrain the disc geometry and kinematic components. While DiskFit has the capacity to fit for simple warps (Sellwood & Spekkens 2015), we consider only models of thin flat discs defined by a kinematic centre (xc, yc), disc position angle (|$\phi ^{\prime }_{\rm d}$|), heliocentric systemic velocity (Vsys), and an inclination (i), that do not vary with radius. A thin, flat disc is a reasonable assumption for the HIghMass galaxies given their intermediate inclinations, the lack of strong warps in their H i distributions (Hallenbeck et al. 2016) as well as the fact that H α lies primarily within the optical radius beyond where warps tend to begin. In particular, the radius of the disc at the 25th mag arcsec−2 isophote well exceeds the extent of our velocity maps for all of the galaxies (Huang et al. 2014), and warps in the radial range probed by our maps are therefore unlikely (Briggs 1990; García-Ruiz, Sancisi & Kuijken 2002).
Because of the 2θb dependence of the non-circular flow terms in equation (3), the best fitting ϕb can represent either the major or minor axis of the corresponding bar-like distortion to the potential. For bisymmetric flows caused by a stellar bar, the sky plane position angle therefore corresponds to |$\phi ^{\prime }_b$| from equation (4) computed from either ϕb or (ϕb + 90○). We report both possibilities for |$\phi ^{\prime }_\mathrm{ b}$| for our bisymmetric models.
DiskFit accepts a number of input parameter values. The geometric parameters that were allowed to vary in the models we consider include the disc position angle |$\phi ^{\prime }_{\rm d}$|, inclination i, best-fitting centre (xc, yc) and Vsys. In the case of a bisymmetric flow model, ϕb is also a free parameter. The model also depends on fixed parameters to specify the spatial extent of the fit, such as the radial model extent as well as rt for any non-circular flows.
In Sections 3.2 and 3.3, we describe our application of these kinematic models to the final velocity and velocity-uncertainty maps for UGC 7899, UGC 8475, UGC 9037, and UGC 9334 shown in Fig. 3. In all models, parameter uncertainties are determined from 1000 radial-rescaled bootstrap realizations of the velocity maps as described in Sellwood & Sánchez (2010). In order to assess the validity of features in best-fitting models to each velocity map as a whole, we also model subsets of the data defined by their kinematics. Specifically, we isolate the approaching and receding halves of the disc about the best-fitting minor axis, as well as the northern and southern halves above and below the best-fitting major axis. Segmenting was performed using the disc geometry from the best-fitting rotation-only model. When modelling the segmented halves, we let the position angle and inclination vary (but account for the inclination in comparing the rotation curves of different segments) and keep the centre fixed to that obtained by the rotation-only model of the whole galaxy. Finally, we use the distances in Table 1 to convert galactocentric radius from angular to linear units when plotting kinematic components.
3.2 Searching for radial flows across the entire disc
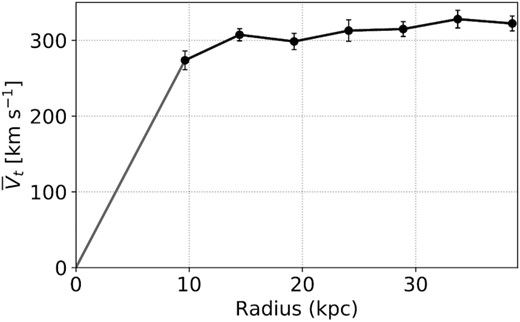
One goal of the analysis presented here is to indirectly detect accretion by constraining radial flows, and this is where we begin. The poor data quality of UGC 8475 evident in Fig. 3 prohibits detailed kinematic modelling, particularly in the inner disc where velocity uncertainties are high. Thus, we apply the radial flow model in equation (2) to the velocity and velocity-uncertainty maps of UGC 7899, UGC 9037, and UGC 9334, with the truncation radius set to the model extent in order to search for radial flows across the entire disc of each galaxy. The resulting |$\bar{V}_{\mathrm r}$|(r) from models of the entire map (black line), as well as of subsets of the data defined relative to the kinematic major and minor axes (coloured lines) of each galaxy are shown in Fig. 4. As discussed in Section 3.1, a non-zero |$\bar{V}_{\mathrm r}$|(r) does not necessarily imply physical radial inflows; rather we interpret a non-zero |$\bar{V}_{\mathrm r}$|(r) as a signature of non-circular flows to be more fully characterized in subsequent sections. We have verified that the radial flow profiles are unchanged if the disc geometries in the kinematic models are fixed to photometric values from Huang et al. (2014); we therefore find it unlikely that the non-circular flows discussed below result from errors in the disc geometry.
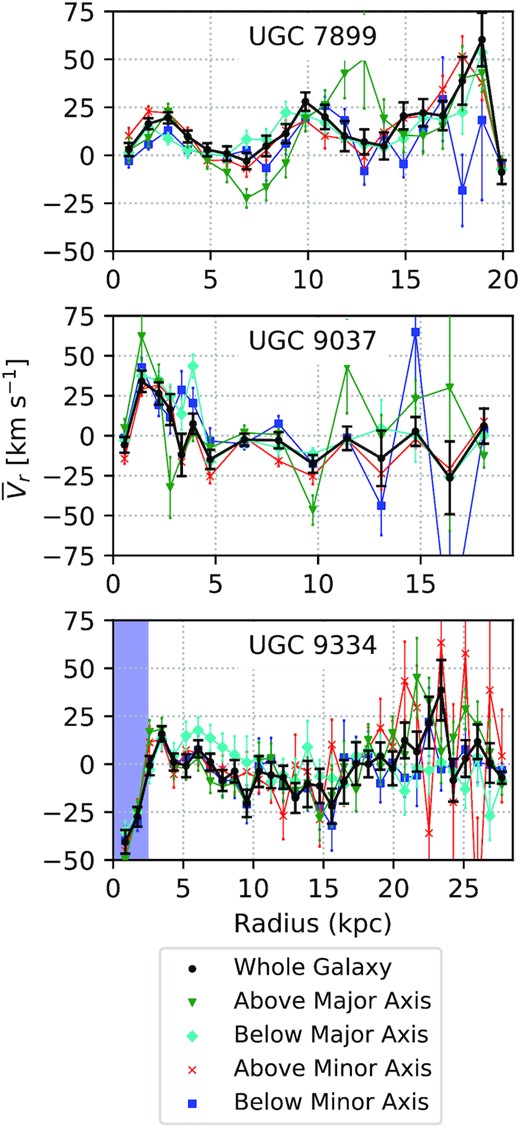
From top to bottom, |$\bar{V}_{\mathrm r}$|(r) in radial flow models applied across the entire discs of UGC 7899, UGC 9037, and UGC 9334. In all panels, the black lines show |$\bar{V}_{\mathrm r}$|(r) obtained by modelling the velocity field as a whole, whereas the coloured lines represent models applied to subsets of the data. The green upside-down triangles and cyan diamonds show |$\bar{V}_{\mathrm r}$|(r) for halves north and south of the major axis. The red crosses and blue squares track the halves above and below the minor axis, which correspond to the receding and approaching halves respectively for these three galaxies (see Fig. 3).
The shading in the bottom panel indicates the approximate extent of a bar aligned along the major axis of UGC 9334, and thus where |$\bar{V}_{\mathrm r}$|(r) and |$\bar{V}_{\mathrm t}$|(r) in equation (2) are degenerate.
The top panel of Fig. 4 shows that the radial flow models of UGC 7899 consistently find a non-zero |$\bar{V}_{\mathrm r}$|(r) for r ≤ 5 kpc, suggesting that the model has uncovered coherent non-circular flows in the inner disc. Further out, there are hints of non-zero |$\bar{V}_{\mathrm r}$|(r) at r ∼ 10 kpc and 15 kpc ≲ r ≲ 20 kpc, with model amplitudes as large as 50 |$\mathrm{km\, s}^{-1}$| in the latter region. However, these signatures are less coherent across models of different data subsets compared to |$\bar{V}_{\mathrm r}$|(r) in the inner disc. The most discrepant among subset models is that from the Northern half (blue line and squares), which we speculate arises from a dearth of data North of the major axis beyond r = 10 kpc in the velocity map. This is illustrated in Fig. 5, where sky-plane projections of the locations with r = 10 kpc (inner black ellipse) and r = 15 kpc (outer black ellipse) are superimposed on the velocity maps for UGC 7899. Models of the approaching segment (blue lines and squares in the top panel of Fig. 4) also return |$\bar{V}_{\mathrm r}(r) \sim 0$| for r > 15 kpc. We therefore conclude that there is a clear signature of non-circular flows for r < 5 kpc and marginal evidence for non-circular flows beyond this radius in UGC 7899. In Section 3.3, we will model the non-circular flows in the inner disc as both radial flows and a bar-like flow and determine our preferred physical model.
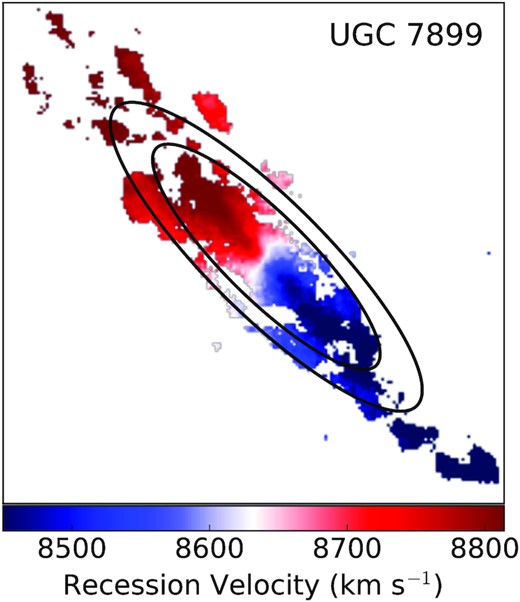
Annulus corresponding to r = 10 kpc (inner black ellipse) and r = 15 kpc (outer black ellipse) in the disc plane for the best-fitting kinematic model geometry in our preferred model of UGC 7899 (Table 2) superimposed on the final velocity map. There is a dearth of data North of the kinematic major axis in the map, which likely explains the discrepant |$\bar{V}_{\mathrm r}$|(r) relative to other radial flow models in Fig. 4 as well as the dip in the rotation curve for UGC 7899 in that region in Fig. 9. See text for details.
The middle panel of Fig. 4 shows that the radial flow models of UGC 9037 consistently find a non-zero |$\bar{V}_{\mathrm r}$|(r) for r ≲ 3.5 kpc, suggesting that these models, too, have uncovered coherent non-circular flows in the inner disc. On the other hand, all of the models return |$\bar{V}_{\mathrm r}$|(r) ∼0 beyond the inner disc, albeit with some scatter between models of different data subsets. Adopting the uncertainties on the model applied to the velocity map as a whole (black line) as an approximate upper limit, our models imply that |$\bar{V}_{\mathrm r}(r) \lt 15 \ \mathrm{km\, s}^{-1}$| in the outer disc of UGC 9037. In Section 3.3, we will model the non-circular flows in the inner disc as both radial flows and a bar-like flow and determine our preferred physical model.
The bottom panel of Fig. 4 shows that the best-fitting |$\bar{V}_{\mathrm r}$|(r) to the entire velocity map for UGC 9334 (black line) dips below 0 for |$10\, \text{kpc} \lesssim r \lesssim 15$| kpc and above 0 for |$20\, \text{kpc} \lesssim r \lesssim 25$| kpc. The latter flows are not consistently recovered in different subsets of the data. We therefore find no convincing signature of non-circular flows for r ≳ 3 kpc for UGC 9334, with the models suggesting that |$\bar{V}_{\mathrm r}(r) \lt 20$| |$\mathrm{km\, s}^{-1}$| on average across the disc. There is strong evidence that |$\bar{V}_{\mathrm r}(r) \lt 0$| for r ≲ 3 kpc in all of the models, which implies coherent non-circular flows in that region. We speculate that they stem from a bar aligned along the major axis of UGC 9334 (Willett et al. 2013) that is visible in the bottom panel of Fig. 1. We highlight the approximate extent of the bar region in blue in the bottom panel of Fig. 4, and note that the DiskFit’s bisymmetric model (equation 3) is degenerate for this geometry (Randriamampandry et al. 2016; see Section 3.1). In Section 3.3, we will therefore apply rotation-only models to the velocity map of UGC 9334, with the caveat that they do not reliably trace the physical structure of this system in the bar region.
3.3 Application of kinematic models
Informed by the radial flow search of the previous section, we present the rotation-only models to the velocity and velocity-uncertainty maps for all four galaxies, as well as inner bisymmetric and radial flow models for UGC 7899 and UGC 9037. Section 3.3.1 presents rotation-only models for UGC 8475 and UGC 9334, and Sections 3.3.2 and 3.3.3 present applications of all three models to UGC 7899 and UGC 9037, respectively. The best-fitting geometries for all models are given in Table 2, and Figs 6–11 show the models, residuals, and kinematic components. In Section 3.4, we discuss our preferred models for UGC 7899 and UGC 9037 among those applied to the data.
|$\bar{V}_{\mathrm t}$|(r) in rotation-only model for UGC 8475 applied to the velocity and velocity-uncertainty maps in Fig. 3.
Fitted parameters for the fits performed on UGC 7899, UGC 8475, UGC 9037, and UGC 9334. Column 1: the model applied (preferred model in bold). Columns 2 and 3: right ascension and declination of the galaxy centre (uncertainty in the last digit shown in parentheses). Column 4: the position angle of the galaxy disc. Column 5: the inclination of the galaxy disc. Column 6: the truncation radius for a fit, only applicable to constrained non-circular flow fits. Column 7: the disc-plane bar angle, only relevant to fits for inner bisymmetric flows. Column 8: possible sky-plane major axis bar angles, calculated from ϕb (column 7) and i (column 4) using equation (4) (see text for details).
| Galaxy | Model | RA (J2000) (H:M:S) | Dec. (J2000) (D:M:S) | |$\phi ^{\prime }_{\rm d}$| (○) | i (○) | rt (kpc) | ϕb (○) | |$\phi ^{\prime }_\mathrm{ b}$| (○) |
|---|---|---|---|---|---|---|---|---|
| (1) | (2) | (3) | (4) | (5) | (6) | (7) | (8) | |
| Rotation only | 12:43:45.50(6) | 10:46:13.74(6) | 45.4 ± 0.6 | 74.3 ± 0.8 | … | … | … | |
| UGC 7899 | Inner bisymmetric | 12:43:45.50(4) | 10:46:13.74(4) | 45.4 ± 0.3 | 74.4 ± 0.6 | 4.9 | 33 ± 6 | 55, 23 ± 4 |
| Inner radial flow | 12:43:45.50(6) | 10:46:13.74(5) | 45.2 ± 0.5 | 74.0 ± 0.7 | 4.9 | … | … | |
| UGC 8475 | Rotation only | 13:29:25.8(8) | 11:00:28.5(7) | 167 ± 1 | 62 ± 2 | … | … | … |
| Rotation only | 14:08:29.3(2) | 07:03:28.4(2) | 345.0 ± 0.8 | 63 ± 2 | … | … | … | |
| UGC 9037 | Inner bisymmetric | 14:08:29.3(1) | 07:03:28.2(1) | 344.6 ± 0.6 | 61 ± 1 | 3.3 | 24 ± 13 | 117, 177 ± 8 |
| Inner radial flow | 14:08:29.3(2) | 07:03:28.2(2) | 344.5 ± 0.7 | 61 ± 2 | 3.3 | … | … | |
| UGC 9334 | Rotation only | 14:31:01.1(1) | 05:58:42.3(1) | 290.3 ± 0.5 | 52.6 ± 0.7 | … | … | … |
3.3.1 UGC 8475 and UGC 9334
As discussed in Section 3.2, the sparsity of the UGC 8475 data and the bar along the UGC 9334 major axis limit our analysis of the velocity and velocity-uncertainty maps in Fig. 3 for these objects to the application of rotation-only models. Their best-fitting disc geometries are given in Table 2, which are in good agreement with photometric measurements (Huang et al. 2014). The best-fitting |$\bar{V}_{\mathrm t}$|(r) for these models are given in Fig. 6 for UGC 8475 and by the black line in Fig. 7 for UGC 9334. To the best of our knowledge, Figs 6 and 7 present the first rotation curve measurements for these galaxies in any tracer. Both curves are flat or mildly rising out to the last measured point, and their amplitudes are consistent with estimates from single-dish H i profile widths and photometric disc inclinations (Huang et al. 2014). We note that the H α rotation curves of massive galaxies are generally flat (e.g. Catinella, Giovanelli & Haynes 2006), and therefore that the mild rotation curve rise in both galaxies could stem from a missed warp in our flat disc models. However, the warp would need to begin well within the edge of the optical disc in both galaxies, which we consider unlikely.
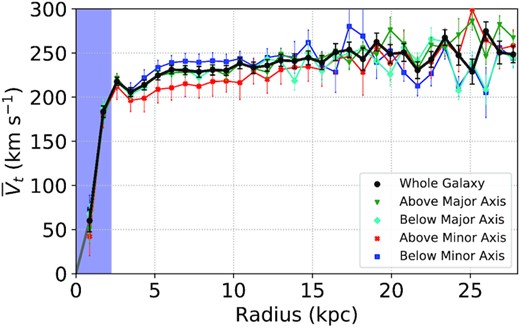
|$\bar{V}_{\mathrm t}$|(r) in rotation-only model for UGC 9334 applied to the velocity and velocity-uncertainty maps in Fig. 3. The black points show |$\bar{V}_{\mathrm t}$|(r) obtained by modelling the whole galaxy, whereas the coloured lines represent models run on different halves of the disc, relative to the kinematic major and minor axes of the whole-disc models, as described in the legend. For UGC 9334, the segment above the minor axis corresponds to the receding half of the disc, and the segment below the minor axis corresponds to the approaching half. The shaded region is the same as in Fig. 4, and highlights the region where |$\bar{V}_{\mathrm t}$|(r) does not reliably trace rotation because of a bar aligned along the major axis (see Fig. 1).
The coloured lines in Fig. 7 show |$\bar{V}_{\mathrm t}$|(r) obtained from rotation-only models applied to halves of the UGC 9334 velocity map in Fig. 3, defined from the kinematic major and minor axes of the whole-disc model given in Table 2. Models for the (statistically independent) northern and southern halves agree well within uncertainty across the disc, and all of the curves are generally consistent for r > 15 kpc. However, for 3 kpc < r < 10 kpc, |$\bar{V}_{\mathrm t}$|(r) for the receding (above minor axis) half of UGC 9334 consistently exceeds that for the approaching (below minor axis) half by |$\sim \! 30\, \mathrm{km\, s}^{-1}$|, suggesting a degree of kinematic lopsidedness. Relatively isolated galaxies do sometimes exhibit morphological and kinematic asymmetries (e.g. Greisen, Spekkens & Van Moorsel 2009; Reynolds et al. 2020), and the origin of this feature in UGC 9334 deserves further study that we reserve for future work.
3.3.2 UGC 7899
Informed by the whole-disc radial flow models of Section 3.2, we apply rotation-only, inner bisymmetric and inner radial flow models to the velocity and velocity-uncertainty maps for UGC 7899 in Fig. 3. In all models, we set the truncation radius for the non-circular flows as |$r_{t}=4.9\,$| kpc, which corresponds to the approximate extent of the coherent feature in the top panel of Fig. 4 in integer pixel units; the models do not depend strongly on this choice, with values in the range 4.5 kpc < rt < 5.5 kpc returning similar results. Fig. 8 presents the best-fitting models and residuals, Fig. 9 shows the kinematic components from the models, and Table 2 reports the best-fitting disc geometries.
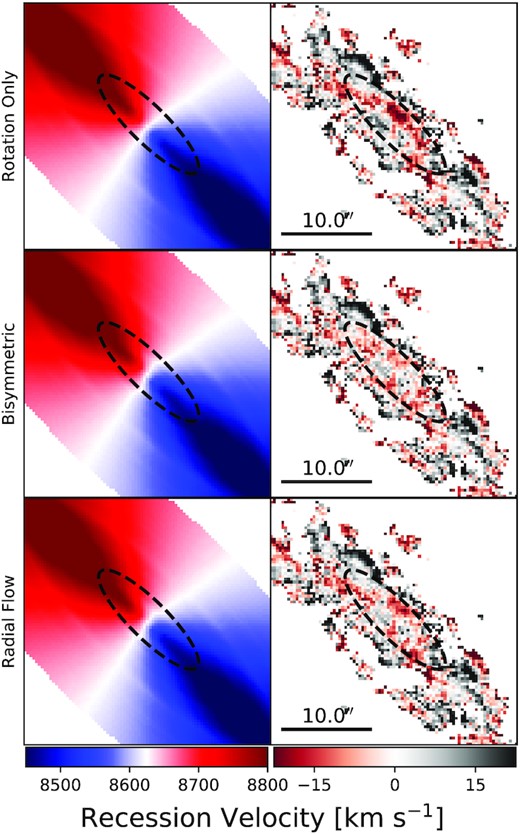
Best-fitting model (left) and residuals (right) for the inner disc for the rotation-only (top), inner bisymmetric (middle), and radial flow (bottom) models applied to the velocity and velocity-uncertainty maps for UGC 7899 in Fig. 3. A black, dashed ellipse extends to the truncation radius rt (only physically relevant for the bisymmetric and radial flow models but plotted on the rotation-only model for consistency), within which the discrepancy between the rotation-only and non-circular flow models is most severe. The black bar in the residual panels shows the angular scale, and the colour bars show the velocity scale in each column.
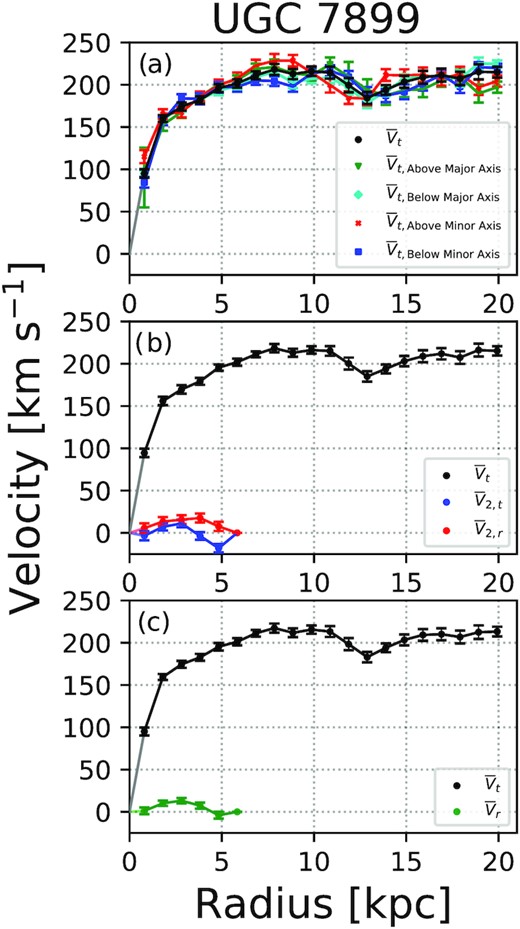
Best-fitting kinematic components from (a) rotation-only, (b) bisymmetric, and (c) radial flow models for UGC 7899 shown in Fig. 8. In all panels, the black points correspond to |$\bar{V}_{\mathrm t}$|(r) obtained by applying the model to the entire velocity map. In (a), the coloured lines represent |$\bar{V}_{\mathrm t}$|(r) obtained from models run on different halves of the disc, relative to the kinematic major and minor axes of the whole-disc models, as described in the legend, with marker symbols consistent with Fig. 4. In (b), the blue and red lines correspond to the tangential and radial components of the bisymmetric flow, |$\bar{V}_{2,t}(r)$|and |$\bar{V}_{2,\mathrm{ r}}(r)$|, respectively. In (c), the green line corresponds to the inner-disc radial flow, |$\bar{V}_{\mathrm r}$|(r). The ∼35 |$\mathrm{km\, s}^{-1}$| amplitude dip in |$\bar{V}_{\mathrm t}$|(r) at r ∼ 13 kpc in all models is likely due to a lack of data within that region of the disc (see Fig. 5 and text for details).
Fig. 8 shows that by eye, the data-model residuals in the inner disc of UGC 7899 are both larger and more coherent for the best-fitting rotation-only model than for either the best-fitting inner bisymmetric or inner radial flow models. The latter two models are nearly indistinguishable in the sky plane, and the slightly larger residuals for the radial flow model relative to the bisymmetric model are expected from its smaller number of fitted parameters.
The kinematic components in Fig. 9 and the disc geometries in Table 2 are well-constrained in all three models. Consistent with the findings of Holmes et al. (2015) for the CALIFA sample, the disc geometries and axisymmetric tangential components |$\bar{V}_{\mathrm t}$|(r) between different models are identical to within uncertainty: all models return the same disc geometry and rotation curves. The disc geometries are consistent with previous photometric estimates from R-band imaging (Huang et al. 2014, see also Section 3.4) and kinematic measurements from models applied to H i maps (Hallenbeck et al. 2016).
We find a |$\sim \! 35\, \mathrm{km\, s}^{-1}$| dip in |$\bar{V}_{\mathrm t}$|(r) at |$r \sim 13\,$| kpc in all three models, as well as in rotation-only models run on different subsets of the data relative to the kinematic major and minor axes defined by the disc geometry in Table 2. We attribute this dip to a combination of UGC 7899 velocity map properties from 10 kpc <r < 15 kpc in the disc plane, a region highlighted by the black sky-plane ellipses in Fig. 5. First, there is a clear dearth of emission in the Northern (above major axis) half of the disc: this likely underpins the change in |$\bar{V}_{\mathrm t}$|(r) for the Northern half of the galaxy (green line and upside-down triangles in upper panel of Fig. 9) and the discrepancy in |$\bar{V}_{\mathrm r}$|(r) in the whole-disc radial flow models (green line and upside-down triangles in upper panel of Fig. 4) for that subset. The gas signature picks up beyond r > 15 kpc along the major axis in particular, resulting in a rotation curve which recovers to its previous plateau. Secondly, Fig. 5 shows some evidence for a disconnect between the gas in the southern half of the disc in that region and the emission at smaller r that may connect to the tail-like structure to the south-west of the galaxy. Ultimately, the dip in |$\bar{V}_{\mathrm t}$|(r) at |$r \sim 13\,$| kpc most likely stems from a complexity in the kinematics that is missing in our models rather than a change in the underlying mass distribution of UGC 7899 in the H α tracer. This may correspond to a warp in the disc, although it would lie well within the outer H i disc warp suggested by Hallenbeck et al. (2016) as well as the edge of the stellar disc (Huang et al. 2014).
Fig. 9 also shows that the inner non-circular components |$\bar{V}_{2,t}(r)$| and |$\bar{V}_{2,r}(r)$| in the bisymmetric model and |$\bar{V}_{\mathrm r}$|(r) in the radial flow model are both well constrained, with similar extents, amplitudes and uncertainties. Combined with the similarities between the models, residuals and |$\bar{V}_{\mathrm t}$|(r) from Figs 8 and 9, we therefore find that the inner bisymmetric model and the inner radial flow model describe the kinematics of UGC 7899 equally well. We discuss our preferred model between the two in Section 3.4, and its physical implications in Section 4.
3.3.3 UGC 9037
Informed by the whole-disc radial flow models of Section 3.2, we apply rotation-only, inner bisymmetric and inner radial flow models to the velocity and velocity-uncertainty maps for UGC 9037 in Fig. 3. In all models, we set the truncation radius for the non-circular flows as |$r_{\mathrm t}=3.3\,$|kpc, which corresponds to the approximate extent of the coherent feature in the top panel of Fig. 4 in integer pixel units; the models do not depend strongly on this choice, with values in the range 3 < rt < 4 kpc returning similar results. Fig. 10 presents the best-fitting models and residuals, Fig. 11 shows the kinematic components from the models, and Table 2 reports the best-fitting disc geometries.
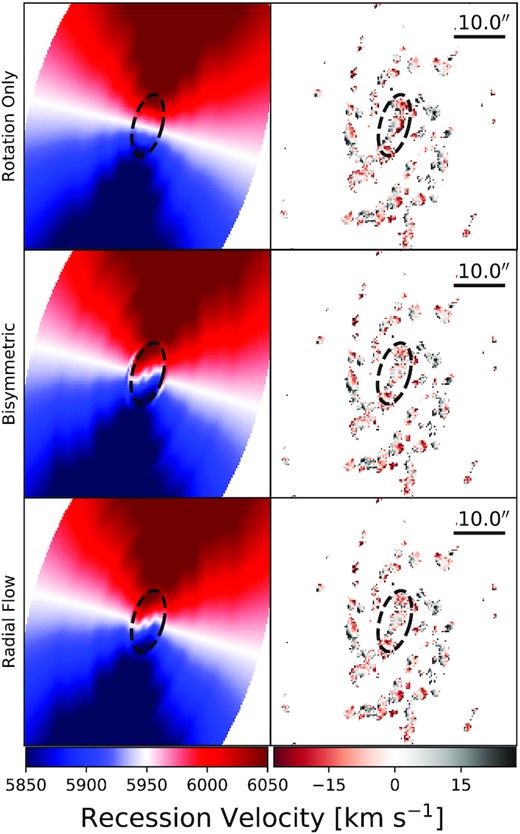
Same as in Fig. 8 but for UGC 9037.
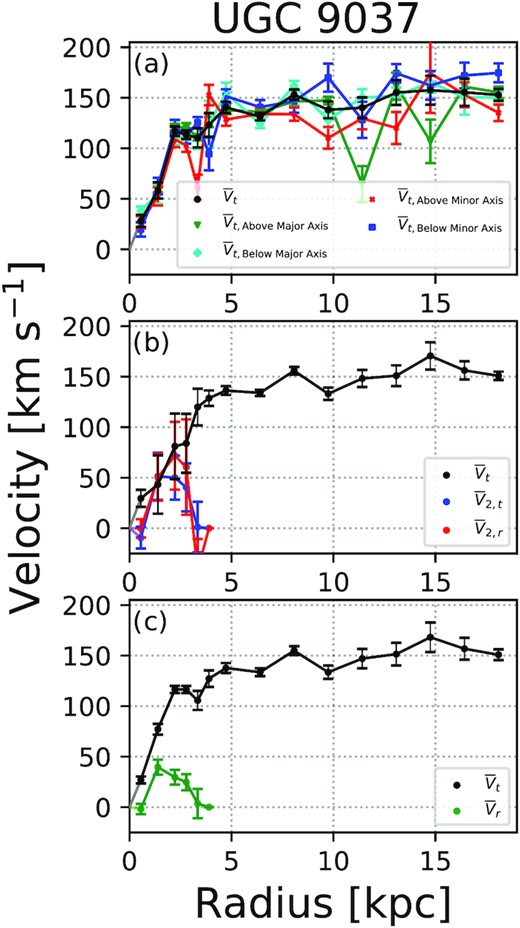
Same as in Fig. 9, but for UGC 9037.
The kinematic components in Fig. 11 and the disc geometries in Table 2 are well constrained in all three models. The disc geometries are consistent with previous photometric estimates from R-band imaging (Huang et al. 2014, see also Section 3.4) and kinematic measurements from models applied to H i and CO maps (Hallenbeck et al. 2014). The coloured lines in Fig. 11a) show |$\bar{V}_{\mathrm t}$|(r) obtained by fitting halves of the data relative to the kinematic major axis of the whole disc model as described in the legend. The models for these data subsets are generally consistent with one another, particular for r < 10 kpc.
Fig. 10 shows that by eye, the data-model residuals in the inner disc of UGC 9037 are both larger and more coherent for the best-fitting rotation-only model than for either the best-fitting inner bisymmetric or inner radial flow models. The larger uncertainties in the inner bisymmetric flows (as compared to the inner radial flow model) are characteristic of bootstrap resampling with a model that has more free parameters (e.g. Holmes et al. 2015). As is the case for UGC 7899, the best-fitting inner bisymmetric and inner radial flow models are nearly indistinguishable in the sky plane. The similarities between the models, residuals and |$\bar{V}_{\mathrm t}$|(r) from Figs 10 and 11, respectively, preclude drawing conclusions from kinematic modelling alone. We discuss our preferred model for UGC 9037 in Section 3.4, and its physical implications in Section 4.
3.4 Preferred models for UGC 7899 and UGC 9037
Our analysis of the velocity and velocity-uncertainty maps for UGC 7899 and UGC 9037 in Sections 3.3.2 and 3.3.3 proved inconclusive with regard to determining the ideal kinematic model for either system. Thus, we combine our kinematic analysis with photometric modelling to determine our preferred physical model. We use the photometric branch of DiskFit to model the R-band imaging for UGC 7899 and UGC 9037 presented in Huang et al. (2014).
The photometric branch of DiskFit, which uses the same optimization algorithm as for the kinematic branch, can decompose images into disc, bar and bulge components (Kuzio de Naray et al. 2012; Sellwood & Spekkens 2015; Holmes et al. 2015; Lewis & Spekkens 2018). The flat disc and fixed-angle bar are described by non-parametric surface brightness profiles and the bulge has a Sérsic functional form. A disc–bar–bulge model returns the best-fitting photometric disc position angle |$\phi ^{\prime }_{\rm d, phot}$|, inclination iphot, and the sky-plane bar position angle |$\phi ^{\prime }_{\rm b, phot}$|.
We apply disc–bar–bulge models to the R-band imaging for UGC 7899 and UGC 9037, using 1000 bootstrap realizations to estimate uncertainties. The best-fitting parameters from these runs are reported in Table 3, and can be compared with their kinematically derived counterparts in Table 2. We determine our preferred kinematic model by requiring that the implied structure is broadly consistent with our best-fitting photometric decompositions.
Best-fitting parameters derived from the photometric disc–bar–bulge model applied to R-band images of UGC 7899 and UGC 9037. Column 1: the disc position angle. Column 2: the disc inclination. Column 3: the sky-plane bar angle.
| |$\phi ^{\prime }_{\rm d, phot}$| (○) | iphot (○) | |$\phi ^{\prime }_{\rm b, phot}$| (○) | |
|---|---|---|---|
| Galaxy | (1) | (2) | (3) |
| UGC 7899 | 42.6 ± 0.7 | 76.6 ± 0.7 | 36 ± 2 |
| UGC 9037 | 330 ± 6 | 48 ± 5 | 112 ± 3 |
| |$\phi ^{\prime }_{\rm d, phot}$| (○) | iphot (○) | |$\phi ^{\prime }_{\rm b, phot}$| (○) | |
|---|---|---|---|
| Galaxy | (1) | (2) | (3) |
| UGC 7899 | 42.6 ± 0.7 | 76.6 ± 0.7 | 36 ± 2 |
| UGC 9037 | 330 ± 6 | 48 ± 5 | 112 ± 3 |
Comparing |$\phi ^{\prime }_b$| and |$\phi ^{\prime }_{\rm b, phot}$| for UGC 7899 in Tables 2 and 3 respectively, we find that the sky-plane position angle of the bar implied by our photometric models is inconsistent with either possible |$\phi ^{\prime }_b$| calculated from the inner bisymmetric kinematic model of this galaxy (equation 4). In the case of UGC 9037 on the other hand, the kinematic sky-plane bar position angle |$\phi ^{\prime }_b = (117 \pm 8)^\circ$| (Table 2), is consistent to within uncertainty with its photometric sky-plane bar position angle, |$\phi ^{\prime }_{\rm b, phot} = (112 \pm 3)^\circ$| (Table 3 and Fig. 1), implying that a bar at this position angle explains both the R-band photometry and inner H α kinematics for this galaxy.
We note that |$\phi ^{\prime }_{\rm d, phot}$| and iphot for UGC 9037 differ from their kinematic models at approximately twice the model standard deviation implied by the uncertainties on the fit. As a check, we re-ran the disc–bar–bulge photometric models for UGC 9037 with the disc geometry fixed to the kinematic values and recover a |$\phi ^{\prime }_{\rm b, phot}$| that is consistent with the one reported in Table 3. This is not unexpected since the photometric disc geometry in a flat-disc model is typically driven by the outer disc morphology, while the photometric bar geometry is driven by that of the inner disc.
The lack of consistency between the disc geometry and bar angle for the inner bisymmetric flow model and for the disc–bulge–bar decomposition for UGC 7899 implies that we cannot find a bar-like model that consistently reproduces its kinematics and morphology. We therefore favour inner radial flows to explain the non-circular motions in UGC 7899. Conversely, our kinematic and photometric models of UGC 9037 can be consistently modelled with an inner bar, and we favour this interpretation for its underlying structure.
4 DISCUSSION
In this Section, we discuss the implications of the kinematic models presented in Section 3 for the physical structure of the HIghMass galaxies and the late accretion hypothesis. We place our preferred models for UGC 7899 and UGC 9037 in the context of other constraints on their structure in Section 4.1. In Section 4.2, we consider our constraints on disc-wide radial flows for UGC 7899, UGC 9037, and UGC 9334 in the context of hot and cold gas accretion models.
4.1 The Structure of UGC 7899 and UGC 9037
While both our inner radial flow models and inner bisymmetric models for UGC 7899 and UGC 9037 adequately describe the measured H α kinematics for these systems (Sections 3.3.2 and 3.3.3, respectively), a comparison between the implied inner-disc structure with photometric disc–bar–bulge decompositions suggest inner radial flows in UGC 7899 and inner bisymmetric flows in UGC 9037. Here, we discuss those interpretations in the context of other constraints on those systems as well as in the broader gas-rich galaxy population.
Our preferred model for UGC 7899 is that of a disc galaxy with inner radial flows and marginal evidence for non-circular flows beyond the inner disc. We therefore do not corroborate consistent |$\bar{V}_{\mathrm r}(r) \sim 20 \ \mathrm{km\, s}^{-1}$| radial flows for 10 kpc ≲ r ≲ 20 kpc suggested by some of the H i modelling presented by Hallenbeck et al. (2016). However, our results are still consistent with the overall picture of this galaxy’s morphology, structure, and star formation from that study.
In both H i and H α, UGC 7899’s H α distribution is visibly asymmetric (see Figs 1 and 3). Emission at the northern, receding edge is more extended than the southern, approaching lobe, which narrows (see Fig. 2). Hallenbeck et al. (2016) also show that the position angle of the H i disc changes beyond r ∼ 20 kpc. These anisotropies may indicate an H i warp, and the disconnect between the gas in the southern half of the disc and the emission at smaller radii for 10 kpc < r < 15 kpc (Fig. 5) may be related. We return to the warp and outer disc kinematics in UGC 7899 in the context of late accretion in Section 4.2.
Under the assumption of trailing spiral arms (Lindblad 1963; Contopoulos 1971), we can determine the direction of fitted radial flows in UGC 7899 as per equation (2). The spiral arm structure of UGC 7899 suggests that its motion is clockwise in the plane of the sky. This implies that the Eastern semiminor axis (θ = 90○) is the nearest point of the disc, and therefore that |$\bar{V}_{\mathrm r}(r) \gt 0$| detected represents inflows.
Hallenbeck et al. (2016) found that the surface densities of H i and H2 gas reach values of |$30 \ \mathrm{M}_{\odot }\, \mathrm{pc^{-2}}$| and |$10 \ \mathrm{M}_{\odot }\, \mathrm{pc^{-2}}$| respectively in UGC 7899, implying that this gas is marginally unstable within r < 30 kpc, and strongly unstable for r < 10 kpc. Since UGC 7899 is observed to most actively form stars in its inner regions, this is consistent with inner radial inflow. UGC 7899 has a typical SFR for its H2 mass, and its star formation efficiency drops as a function of disc radius, suggesting that the bottleneck for star formation is the atomic to molecular (H i-to-H2) conversion pathway (Hallenbeck et al. 2016). This in turn suggests imminent star formation in the central regions.
If the radial flows we detect are fuelling this inner-disc star formation, then their peak amplitude |$\bar{V}_{\mathrm r} \sim 10 \ \mathrm{km\, s}^{-1}$| at r ∼ 2 kpc for UGC 7899 in Fig. 9(c) allows for an estimate of the gaseous mass influx μ for a thin axisymmetric disc via |$\mu = 2 \pi r \Sigma _g \bar{V}_{\mathrm r}$|. If the flows detected in our H α maps are present in the molecular and atomic phases, then adopting a characteristic |$\Sigma _g \sim 40 \ \mathrm{M}_{\odot }\, \mathrm{pc^{-2}}$| (Hallenbeck et al. 2016) implies a mass inflow |$\mu \sim 5 \ \mathrm{M}_{\odot }\, \mathrm{yr^{-1}}$| or |$\Sigma _{\mu } \sim 0.4 \ \mathrm{M}_{\odot }\, \mathrm{yr^{-1}}\ \text{kpc}^{-2}$| within that radius. If this gas will be turned into stars to avoid the continuity problem implied by radial flows (Wong et al. 2004; Spekkens & Sellwood 2007), then the corresponding SFR and central surface density exceeds estimates from H α imaging for UGC 7899 and other HIghMass galaxies (Huang et al. 2014). This further supports the conclusion that our preferred model for the inner non-circular flows implies an imminent phase of significant central star formation.
Our results for UGC 9037 favour inner-disc non-circular flows that can be explained by the bar that is visible in images of this galaxy (Fig. 1). The extent and amplitude of the inner bisymmetric flow are broadly commensurate with that found in H α in CALIFA galaxies (Holmes et al. 2015). We do not corroborate the widespread non-circular flows farther out identified in some H i kinematic models in Hallenbeck et al. (2014), instead placing an upper limit |$\bar{V}_{\mathrm r}(r) \lesssim 15 \ \mathrm{km\, s}^{-1}$| on their amplitude for r ≳ 5 kpc (Section 3.2). We discuss the implications of this limit in the context of late accretion in Section 4.2.
While some H i models for UGC 9037 in Hallenbeck et al. (2014) also suggested the presence of non-circular flows in the inner disc, they are distinct from the ones that we detect in H α. Importantly, the orientation of the central minor-axis twist in the H i velocity maps (Fig. 2 in Hallenbeck et al. 2014) is opposite the one evident in the non-circular flow models of the H α velocity maps presented here (Fig. 10). When these signatures are both modelled as radial flows, the H i feature represents inflow while the H α feature represents outflow if the spiral arms in UGC 9037 are trailing.
While we prefer a bisymmetric flow to explain the inner non-circular flows that we detect in UGC 9037 because of their consistency with photometric models, we also note that the outflows implied by our inner disc radial flow models are challenging to reconcile with constraints from other tracers. Gas outflows can plausibly result from intense star formation (Nath & Silk 2009), but we have no evidence for such an event in UGC 9037.
The specific SFR and central H i surface density of UGC 9037 are both greater than the typical value for a galaxy with the same stellar mass (Huang et al. 2014; Hallenbeck et al. 2014), and a variety of axisymmetric instability indicators (see Section 1) suggest that the H i phase is marginally unstable in the inner region as well. These past observations indicate that UGC 9037 may be on the verge of a significant central star formation phase. Our preferred kinematic model for UGC 9037 – that of an axisymmetric outer disc with an inner bar – may be consistent with this basic picture, since bars can efficiently shuttle gas into the galaxy interior (Oh, Oh & Sukyoung 2011). However, since bars are long-lived this scenario implies that we are observing the system at a special time, and it is therefore more likely that the bar and central star formation potential are disconnected.
While galaxies with strong bars tend to be less gas rich than those without (Masters et al. 2012), our kinematic model for UGC 9037 as well as the bar in UGC 9334 that precludes a search for inner non-circular flows (see Fig. 1 and Section 3.2) suggest that weak bars may be as common in massive gas-rich galaxies just as they are in the broader galaxy population (e.g. Erwin 2018). Notwithstanding the small sample size considered here, this correspondence may suggest that massive, gas-rich galaxies evolve secularly in a similar manner to other galaxies.
4.2 Radial flows and late accretion
We now turn to the implications of our constraints on non-circular flows in UGC 7899, UGC 9037, and UGC 9334 for the late accretion hypothesis. As outlined in Section 1, cosmological simulations suggest hot-mode accretion as the dominant mechanism in the HIghMass galaxies given their relatively high stellar masses. On the other hand, the high gas-richness of the HIghMass galaxies raises the possibility that recent cold-mode accretion played a role in building their H i reservoirs. We discuss both possibilities below.
Neither galaxy shows evidence for radial flows in their outer discs (see Fig. 4). Adopting |$\bar{V}_{\mathrm r}(r) \lt 20 \ \mathrm{km\, s}^{-1}$| at r ∼ 15 kpc appropriate for UGC 9334 as a conservative upper limit on the radial inflow amplitude that we can detect, a total disc gas surface density of |$\Sigma _\mathrm{ g}(r \ = \ 15 \ \text{kpc}) \sim 10\, \mathrm{M}_{\odot }\, \mathrm{pc^{-2}}$| (e.g. Hallenbeck et al. 2014), and an angular momentum mismatch α = 0.3 on the higher end of that considered by Pezzulli & Fraternali (2016), equation (5) implies an upper limit on the accretion rate surface density of |$\dot{\Sigma }_{\text{acc}} \lt 45 \ \mathrm{M}_{\odot }\ \text{pc}^{-2} \ \text{Gyr}^{-1}$| in UGC 9037 and UGC 9334. This is substantially higher than the current SFR densities of HIghMass galaxies (Huang et al. 2014), as well as that of the Milky Way. Furthermore, given the inverse relationship between |$\dot{\Sigma }_{\text{acc}}$| and α, our outer disc radial flow constraints allow for substantially higher |$\dot{\Sigma }_{\text{acc}}$| values than estimated here for smaller angular momentum mismatches. Thus, while we do not find evidence for outer disc radial flows in UGC 9037 and UGC 9334, we have found weak constraints on hot-mode accretion via these implied upper limits on outer disc radial flows. In particular, the predicted accretion rates for the Milky Way are much smaller than we can detect in the velocity maps, and as such they are consistent with our data.
In Section 3.4, we advocated radial flows as the preferred model for the inner disc (r ≲ 5 kpc) kinematics of UGC 7899, and in Section 4.1, we argued that inflows of the measured amplitude are consistent with other observations that suggest imminent central star formation in this galaxy. We now discuss possible origins of these flows. The inconsistency between the radial dependence of the flow constraints in UGC 7899 and that expected from the hot-mode accretion models of Pezzulli & Fraternali (2016) suggests that, if late accretion is at work, then cold-mode accretion is the more likely explanation. This latter scenario would require a significant mass flow of cold gas to reach the inner disc of UGC 7899 (Section 4.1, Hallenbeck et al. 2016).
Unlike UGC 9037 and UGC 9334, UGC 7899 does have hints of outer disc radial flows that broadly increase with radius (see Fig. 4), as well as evidence for a disconnect between the detected H α emission at 10 kpc ≲ r ≲ 15 kpc and that in the rest of the disc (see Fig. 5). It is also the only HIghMass galaxy imaged in H i thus far that shows evidence for an outer warp in that tracer (Hallenbeck et al. 2016). Among galaxies examined in this work, then, UGC 7899 is the best candidate for late accretion, where both hot-mode (outer disc radial flows; e.g. Pezzulli & Fraternali 2016) and cold-mode (outer disc warp; e.g. Shen & Sellwood 2006) accretion mechanisms may be at work. Attributing these features to late accretion is premature, however, given the well-known degeneracy between disc geometry and non-circular flows in kinematic models (see Section 3.1). If UGC 7899 does harbour a warp that begins far within the optical disc (Section 3.3.2), then the application of flat-disc models in Section 3.2 may return spurious radial flow signatures. A cursory examination of this effect in the H i mapping data for UGC 7899 was carried out in Hallenbeck et al. (2016), and a joint H i + H α kinematic analysis may help disentangle a warp and any outer radial flows. We leave that significant task for future work.
Beyond the non-circular flows examined here, a future step for constraining the origin of the large H i reservoirs in HIghMass galaxies is to compare gas-phase metallicities to predictions from accretion models as well as to search for pristine accreting gas (Pezzulli & Fraternali 2016; Fraternali & Pezzulli 2018). SITELLE’s narrow SN3 filter precludes this study from the data in-hand, but observations with its SN1 and SN2 filters would afford line ratio measurements to carry out such an investigation (e.g. Rousseau-Nepton et al. 2018; Moumen et al. 2019; Flagey et al. 2020). But in this work, we have not found direct evidence for late accretion in the HIghMass galaxies examined.
5 CONCLUSION
We have presented new H α velocity maps of the HIghMass systems UGC 7899, UGC 8475, UGC 9037, and UGC 9334, obtained with the SITELLE IFTS on CFHT, in order to search for non-circular flows indicating late gas accretion that might explain the large H i reservoirs in these galaxies.
The SITELLE hyperspectral velocity cubes were calibrated with the ORCS package to produce arcsecond velocity and velocity-uncertainty maps (Section 2). The maps for UGC 7899, UGC 9037, and UGC 9334 are suitable for detailed kinematic modelling, but the poor sensitivity of the UGC 8475 maps due to distributed photon noise from the Moon precludes searches for non-circular flows in this object.
We proceed to apply kinematic models to the velocity maps for UGC 7899, UGC 9037, and UGC 9334 using the DiskFit algorithm (Section 3). We find no evidence for radial flows in the outer discs of UGC 9037 and UGC 9334, placing conservative upper limits of |$\bar{V}_{\mathrm r} \lesssim 15 \ \mathrm{km\, s}^{-1}$| and |$\bar{V}_{\mathrm r} \lesssim 20 \ \mathrm{km\, s}^{-1}$| for r ≳ 5 kpc, respectively (Section 3.2). There are hints of outer disc radial flows in UGC 7899 with amplitudes as large at |$\bar{V}_{\mathrm r} \sim 50 \ \mathrm{km\, s}^{-1}$|.
We find clear signatures of non-circular flows in the inner discs of UGC 7899, UGC 9037, and UGC 9334. The major axis alignment of a bar-like optical feature in UGC 9334 precludes detailed modelling of that system, but we apply rotation-only, inner radial flow models and inner bisymmetric models to the velocity maps for UGC 7899 and UGC 9037 to determine the likely origin of those asymmetries (Section 3.3). We find that inner radial flow and inner bisymmetric models describe their kinematics equally well, and determine our preferred model for each galaxy by carrying out disc-bulge-bar decompositions of R-band imaging using the photometric branch of DiskFit and requiring physical consistency with the kinematic models (Section 3.4). As a result of this exercise, our preferred model for UGC 7899 is found to be a disc with inner radial flows and marginal non-circular flows beyond, whereas UGC 9037 is best characterized as a disc with an inner bisymmetric flow and axisymmetric rotation in the outer disc.
Our preferred model for UGC 7899 is an axisymmetric outer disc with inner radial inflows. In this scenario, its enhanced central H i surface density indicates that UGC 7899 may be in the midst of a significant star formation episode (Section 4.1). We do not corroborate the coherent outer disc flows in this system implied by some lower resolution H i kinematic models, but there are hints of asymmetries at large r in our H α maps including non-zero radial flow components, asymmetries in the H α distribution as well as a dip in the rotation curve that likely stems from a disconnect between the gas in the southern half of the disc at 10 kpc < r < 15 kpc and that in the rest of the disc.
We posit that UGC 9037 harbours a weak inner bar that is shuttling gas toward the galaxy centre, consistent with the high inner H i and CO surface density measured in this system and suggesting an upcoming episode of star formation (Section 4.1). While we only favour a bar model for this galaxy to explain its inner-disc kinematics, the photometric and kinematic signatures of weak bars in UGC 7899 and UGC 9334 as well suggest that, as with the broader galaxy population, these structures may be common in HIghMass galaxies.
With hints of outer disc radial flows and an outer disc warp, UGC 7899 is the best candidate for late accretion among the galaxies examined (Section 4.2). However, this interpretation is muddled by the well-known degeneracy between non-circular flows and disc warps in kinematic models, which may be at work in the flat-disc DiskFit models that we have applied. A careful joint H i + H α kinematic analysis of UGC 7899 that allows for outer disc warps may help disentangle these effects, and gas-phase metallicity information would also add additional constraints on late accretion.
In this work, we have found weak constraints on hot-mode accretion from upper limits on outer disc radial flows implied by our data, but have not found direct evidence for accretion in the HIghMass galaxies examined.
ACKNOWLEDGEMENTS
We thank Dr Thomas Martin and Dr Laurent Drissen whose efforts to develop ORCS were instrumental. KS acknowledges support from the Natural Sciences and Engineering Research Council of Canada (NSERC).
The observations in this work were obtained at the CFHT that is operated from the summit of Maunakea by the National Research Council of Canada, the Institut National des Sciences de l’Univers of the Centre National de la Recherche Scientifique of France, and the University of Hawaii. The observations at the Canada–France–Hawaii Telescope were performed with care and respect from the summit of Maunakea that is a significant cultural and historic site.
We thank our anonymous reviewer, whose comments have greatly improved this paper.
DATA AVAILABILITY
The data underlying this article will be shared on reasonable request by the corresponding author.
Footnotes
DiskFit Source.
